Zip Codes with the Highest Percentage of Population Employed in Health Diagnosing & Treating in Florence, SC
RELATED REPORTS & OPTIONS
Health Diagnosing & Treating
Florence
Compare Zip Codes
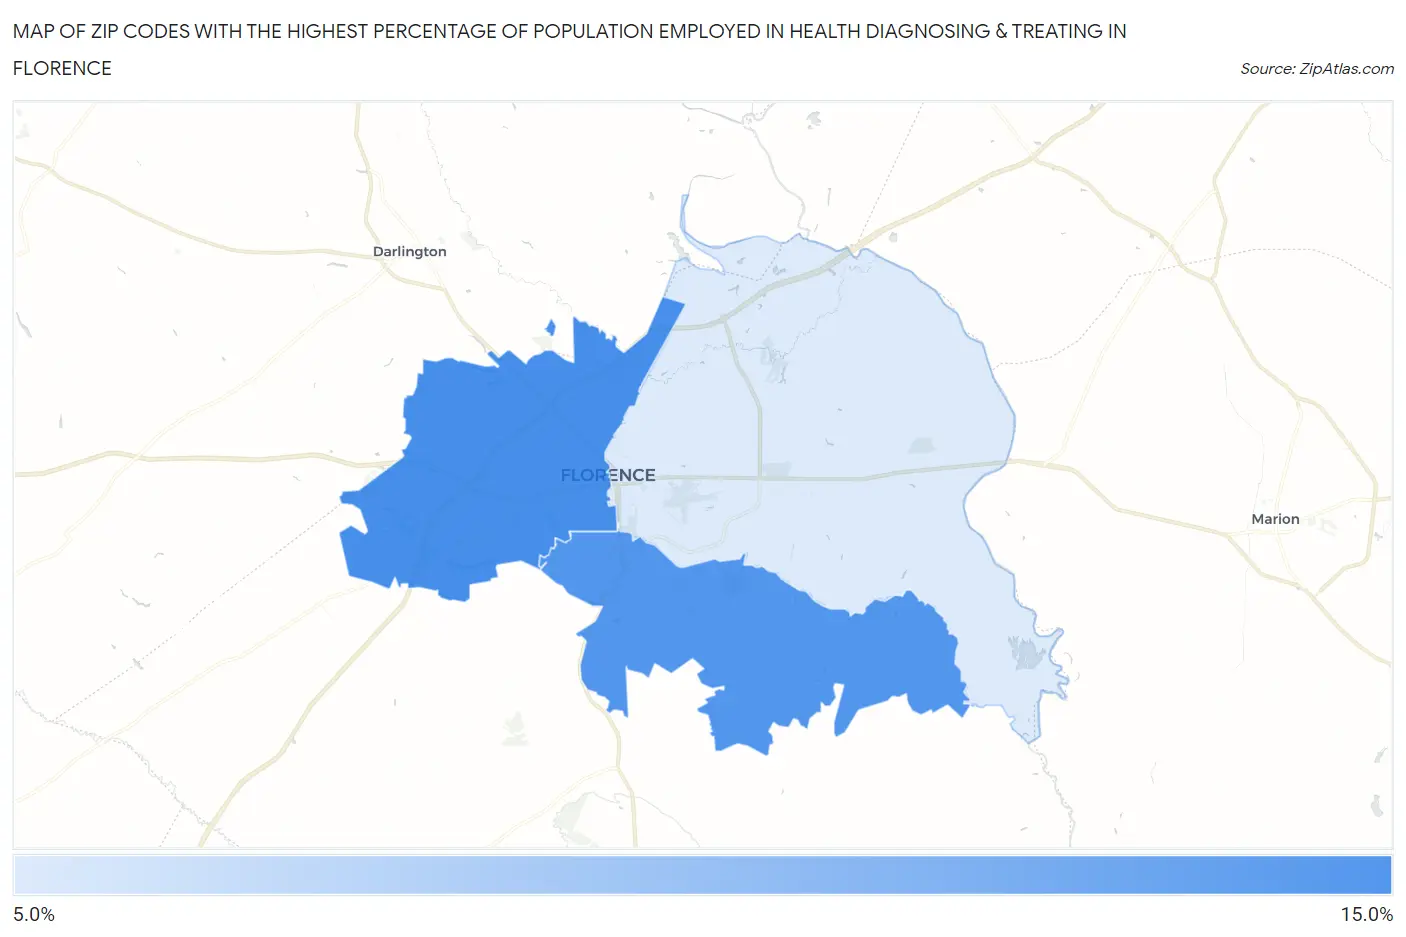
Map of Zip Codes with the Highest Percentage of Population Employed in Health Diagnosing & Treating in Florence
5.3%
10.5%
Zip Codes with the Highest Percentage of Population Employed in Health Diagnosing & Treating in Florence, SC
| Zip Code | % Employed | vs State | vs National | |
| 1. | 29501 | 10.5% | 6.7%(+3.75)#43 | 6.2%(+4.23)#3,336 |
| 2. | 29505 | 10.1% | 6.7%(+3.38)#47 | 6.2%(+3.86)#3,758 |
| 3. | 29506 | 5.3% | 6.7%(-1.39)#218 | 6.2%(-0.916)#16,440 |
1
Common Questions
What are the Top Zip Codes with the Highest Percentage of Population Employed in Health Diagnosing & Treating in Florence, SC?
Top Zip Codes with the Highest Percentage of Population Employed in Health Diagnosing & Treating in Florence, SC are:
What zip code has the Highest Percentage of Population Employed in Health Diagnosing & Treating in Florence, SC?
29501 has the Highest Percentage of Population Employed in Health Diagnosing & Treating in Florence, SC with 10.5%.
What is the Percentage of Population Employed in Health Diagnosing & Treating in Florence, SC?
Percentage of Population Employed in Health Diagnosing & Treating in Florence is 9.1%.
What is the Percentage of Population Employed in Health Diagnosing & Treating in South Carolina?
Percentage of Population Employed in Health Diagnosing & Treating in South Carolina is 6.7%.
What is the Percentage of Population Employed in Health Diagnosing & Treating in the United States?
Percentage of Population Employed in Health Diagnosing & Treating in the United States is 6.2%.