Zip Codes with the Highest Percentage of Population Employed in Health Diagnosing & Treating in Charleston, SC
RELATED REPORTS & OPTIONS
Health Diagnosing & Treating
Charleston
Compare Zip Codes
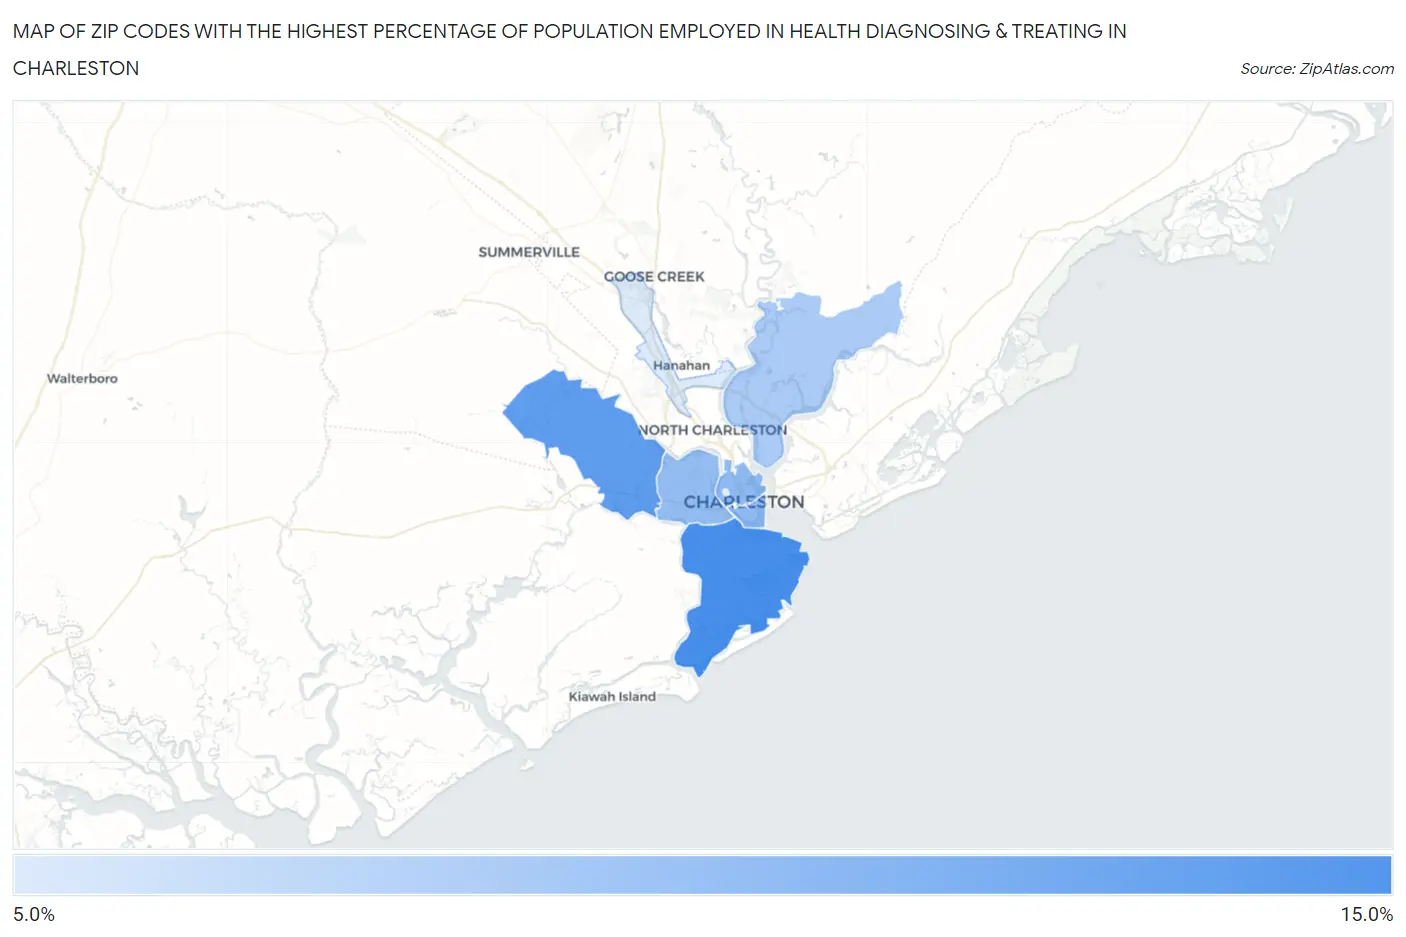
Map of Zip Codes with the Highest Percentage of Population Employed in Health Diagnosing & Treating in Charleston
5.2%
11.1%
Zip Codes with the Highest Percentage of Population Employed in Health Diagnosing & Treating in Charleston, SC
| Zip Code | % Employed | vs State | vs National | |
| 1. | 29412 | 11.1% | 6.7%(+4.40)#37 | 6.2%(+4.87)#2,792 |
| 2. | 29414 | 10.1% | 6.7%(+3.41)#46 | 6.2%(+3.89)#3,708 |
| 3. | 29403 | 8.3% | 6.7%(+1.55)#89 | 6.2%(+2.03)#6,834 |
| 4. | 29401 | 8.2% | 6.7%(+1.46)#93 | 6.2%(+1.94)#7,057 |
| 5. | 29407 | 8.0% | 6.7%(+1.31)#98 | 6.2%(+1.79)#7,418 |
| 6. | 29492 | 7.2% | 6.7%(+0.427)#138 | 6.2%(+0.905)#9,861 |
| 7. | 29406 | 5.2% | 6.7%(-1.56)#228 | 6.2%(-1.08)#17,071 |
1
Common Questions
What are the Top 5 Zip Codes with the Highest Percentage of Population Employed in Health Diagnosing & Treating in Charleston, SC?
Top 5 Zip Codes with the Highest Percentage of Population Employed in Health Diagnosing & Treating in Charleston, SC are:
What zip code has the Highest Percentage of Population Employed in Health Diagnosing & Treating in Charleston, SC?
29412 has the Highest Percentage of Population Employed in Health Diagnosing & Treating in Charleston, SC with 11.1%.
What is the Percentage of Population Employed in Health Diagnosing & Treating in Charleston, SC?
Percentage of Population Employed in Health Diagnosing & Treating in Charleston is 9.1%.
What is the Percentage of Population Employed in Health Diagnosing & Treating in South Carolina?
Percentage of Population Employed in Health Diagnosing & Treating in South Carolina is 6.7%.
What is the Percentage of Population Employed in Health Diagnosing & Treating in the United States?
Percentage of Population Employed in Health Diagnosing & Treating in the United States is 6.2%.