Zip Codes with the Highest Percentage of Population Employed in Health Diagnosing & Treating in Summerville, SC
RELATED REPORTS & OPTIONS
Health Diagnosing & Treating
Summerville
Compare Zip Codes
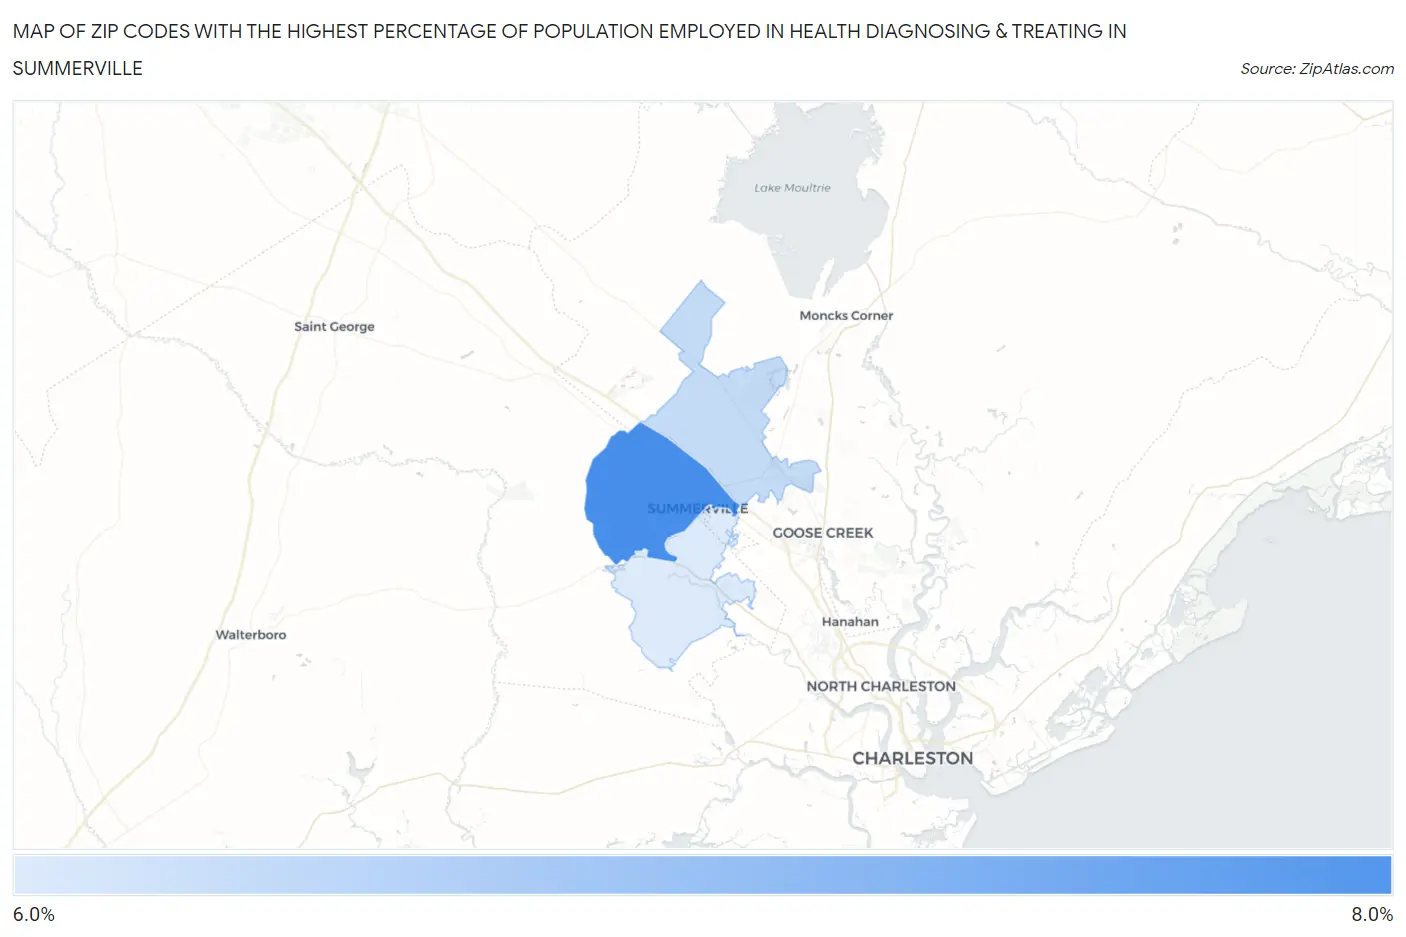
Map of Zip Codes with the Highest Percentage of Population Employed in Health Diagnosing & Treating in Summerville
6.2%
7.3%
Zip Codes with the Highest Percentage of Population Employed in Health Diagnosing & Treating in Summerville, SC
| Zip Code | % Employed | vs State | vs National | |
| 1. | 29483 | 7.3% | 6.7%(+0.529)#132 | 6.2%(+1.01)#9,553 |
| 2. | 29486 | 6.3% | 6.7%(-0.391)#167 | 6.2%(+0.087)#12,650 |
| 3. | 29485 | 6.2% | 6.7%(-0.565)#181 | 6.2%(-0.087)#13,312 |
1
Common Questions
What are the Top Zip Codes with the Highest Percentage of Population Employed in Health Diagnosing & Treating in Summerville, SC?
Top Zip Codes with the Highest Percentage of Population Employed in Health Diagnosing & Treating in Summerville, SC are:
What zip code has the Highest Percentage of Population Employed in Health Diagnosing & Treating in Summerville, SC?
29483 has the Highest Percentage of Population Employed in Health Diagnosing & Treating in Summerville, SC with 7.3%.
What is the Percentage of Population Employed in Health Diagnosing & Treating in Summerville, SC?
Percentage of Population Employed in Health Diagnosing & Treating in Summerville is 6.5%.
What is the Percentage of Population Employed in Health Diagnosing & Treating in South Carolina?
Percentage of Population Employed in Health Diagnosing & Treating in South Carolina is 6.7%.
What is the Percentage of Population Employed in Health Diagnosing & Treating in the United States?
Percentage of Population Employed in Health Diagnosing & Treating in the United States is 6.2%.