Zip Codes with the Highest Percentage of Population Employed in Health Diagnosing & Treating in Rock Hill, SC
RELATED REPORTS & OPTIONS
Health Diagnosing & Treating
Rock Hill
Compare Zip Codes
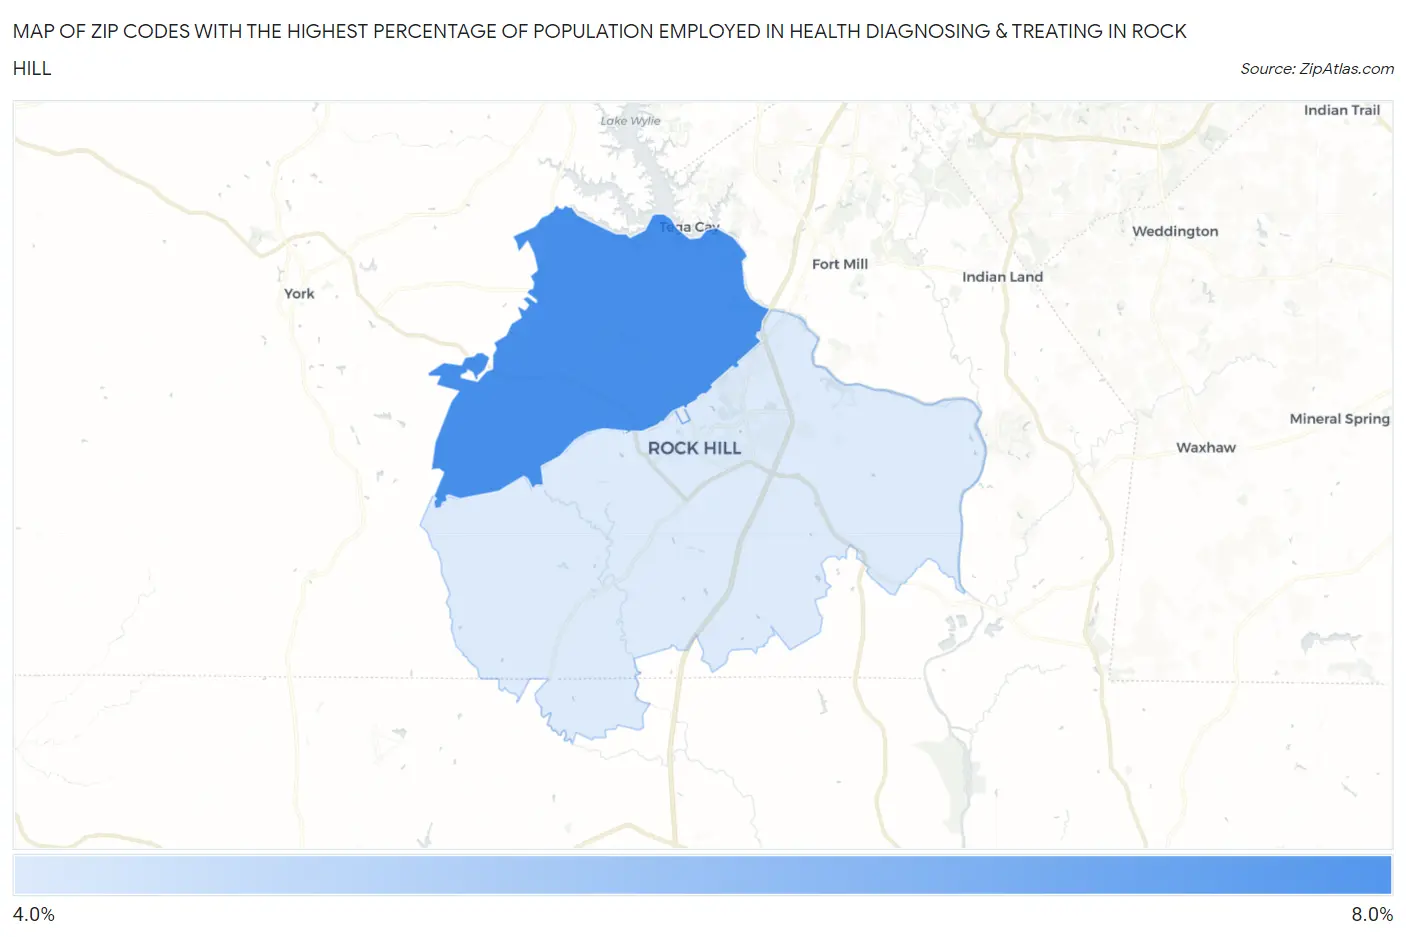
Map of Zip Codes with the Highest Percentage of Population Employed in Health Diagnosing & Treating in Rock Hill
4.6%
7.3%
Zip Codes with the Highest Percentage of Population Employed in Health Diagnosing & Treating in Rock Hill, SC
| Zip Code | % Employed | vs State | vs National | |
| 1. | 29732 | 7.3% | 6.7%(+0.613)#129 | 6.2%(+1.09)#9,306 |
| 2. | 29730 | 4.6% | 6.7%(-2.11)#255 | 6.2%(-1.63)#19,199 |
1
Common Questions
What are the Top Zip Codes with the Highest Percentage of Population Employed in Health Diagnosing & Treating in Rock Hill, SC?
Top Zip Codes with the Highest Percentage of Population Employed in Health Diagnosing & Treating in Rock Hill, SC are:
What zip code has the Highest Percentage of Population Employed in Health Diagnosing & Treating in Rock Hill, SC?
29732 has the Highest Percentage of Population Employed in Health Diagnosing & Treating in Rock Hill, SC with 7.3%.
What is the Percentage of Population Employed in Health Diagnosing & Treating in Rock Hill, SC?
Percentage of Population Employed in Health Diagnosing & Treating in Rock Hill is 6.4%.
What is the Percentage of Population Employed in Health Diagnosing & Treating in South Carolina?
Percentage of Population Employed in Health Diagnosing & Treating in South Carolina is 6.7%.
What is the Percentage of Population Employed in Health Diagnosing & Treating in the United States?
Percentage of Population Employed in Health Diagnosing & Treating in the United States is 6.2%.