Zip Codes with the Highest Percentage of Population Employed in Health Diagnosing & Treating in Greenwood, SC
RELATED REPORTS & OPTIONS
Health Diagnosing & Treating
Greenwood
Compare Zip Codes
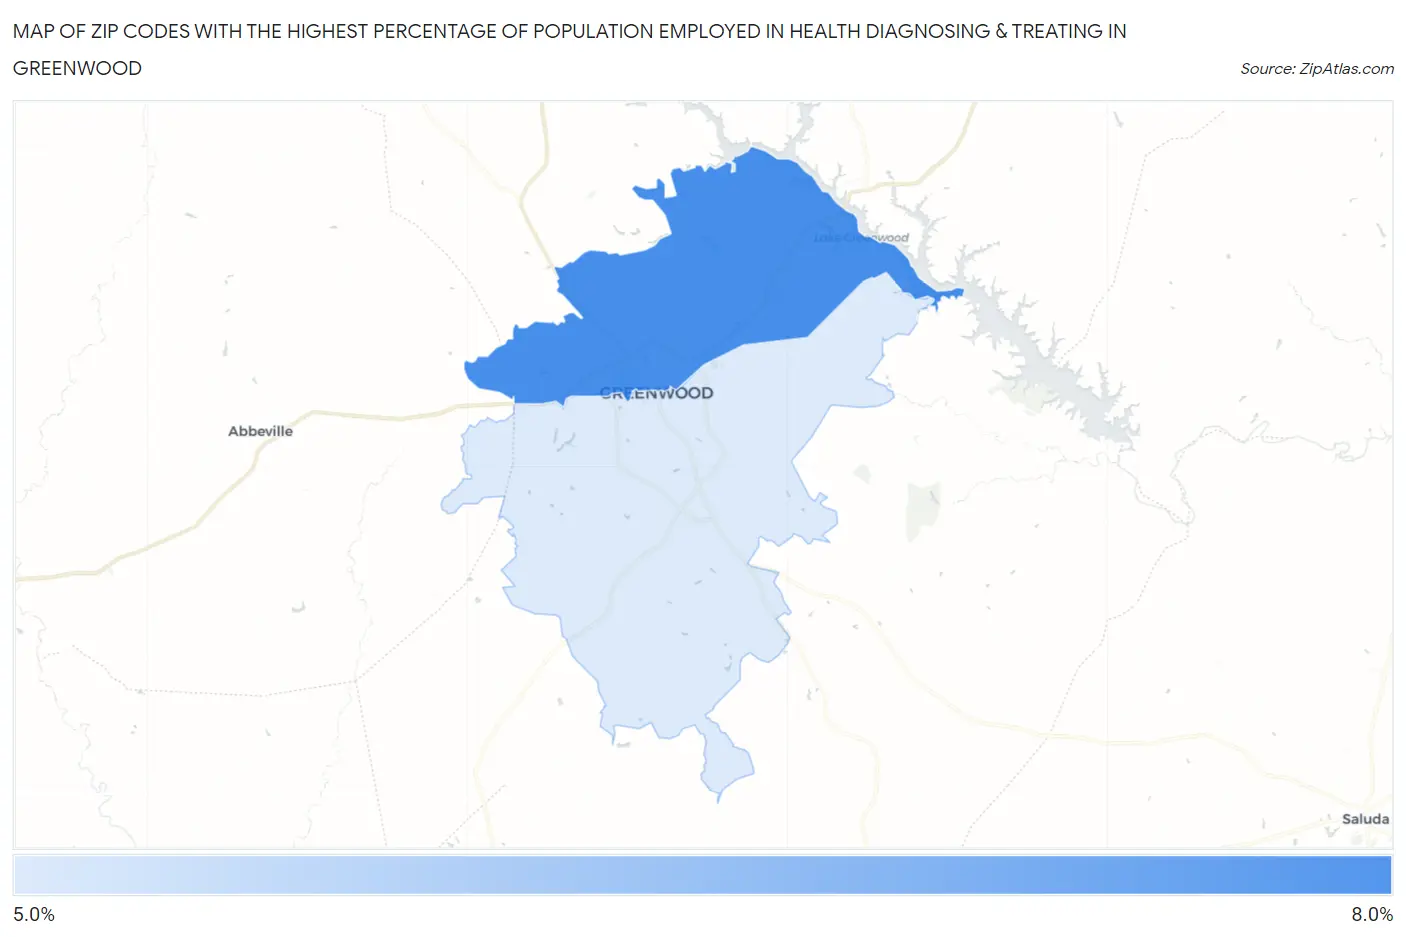
Map of Zip Codes with the Highest Percentage of Population Employed in Health Diagnosing & Treating in Greenwood
5.0%
7.5%
Zip Codes with the Highest Percentage of Population Employed in Health Diagnosing & Treating in Greenwood, SC
| Zip Code | % Employed | vs State | vs National | |
| 1. | 29649 | 7.5% | 6.7%(+0.748)#125 | 6.2%(+1.23)#8,905 |
| 2. | 29646 | 5.0% | 6.7%(-1.71)#237 | 6.2%(-1.23)#17,655 |
1
Common Questions
What are the Top Zip Codes with the Highest Percentage of Population Employed in Health Diagnosing & Treating in Greenwood, SC?
Top Zip Codes with the Highest Percentage of Population Employed in Health Diagnosing & Treating in Greenwood, SC are:
What zip code has the Highest Percentage of Population Employed in Health Diagnosing & Treating in Greenwood, SC?
29649 has the Highest Percentage of Population Employed in Health Diagnosing & Treating in Greenwood, SC with 7.5%.
What is the Percentage of Population Employed in Health Diagnosing & Treating in Greenwood, SC?
Percentage of Population Employed in Health Diagnosing & Treating in Greenwood is 5.3%.
What is the Percentage of Population Employed in Health Diagnosing & Treating in South Carolina?
Percentage of Population Employed in Health Diagnosing & Treating in South Carolina is 6.7%.
What is the Percentage of Population Employed in Health Diagnosing & Treating in the United States?
Percentage of Population Employed in Health Diagnosing & Treating in the United States is 6.2%.