Zip Codes with the Lowest Poverty Level Among Children Under the Age of 5 in South Carolina
RELATED REPORTS & OPTIONS
Lowest Poverty | Child 0-5
South Carolina
Compare Zip Codes
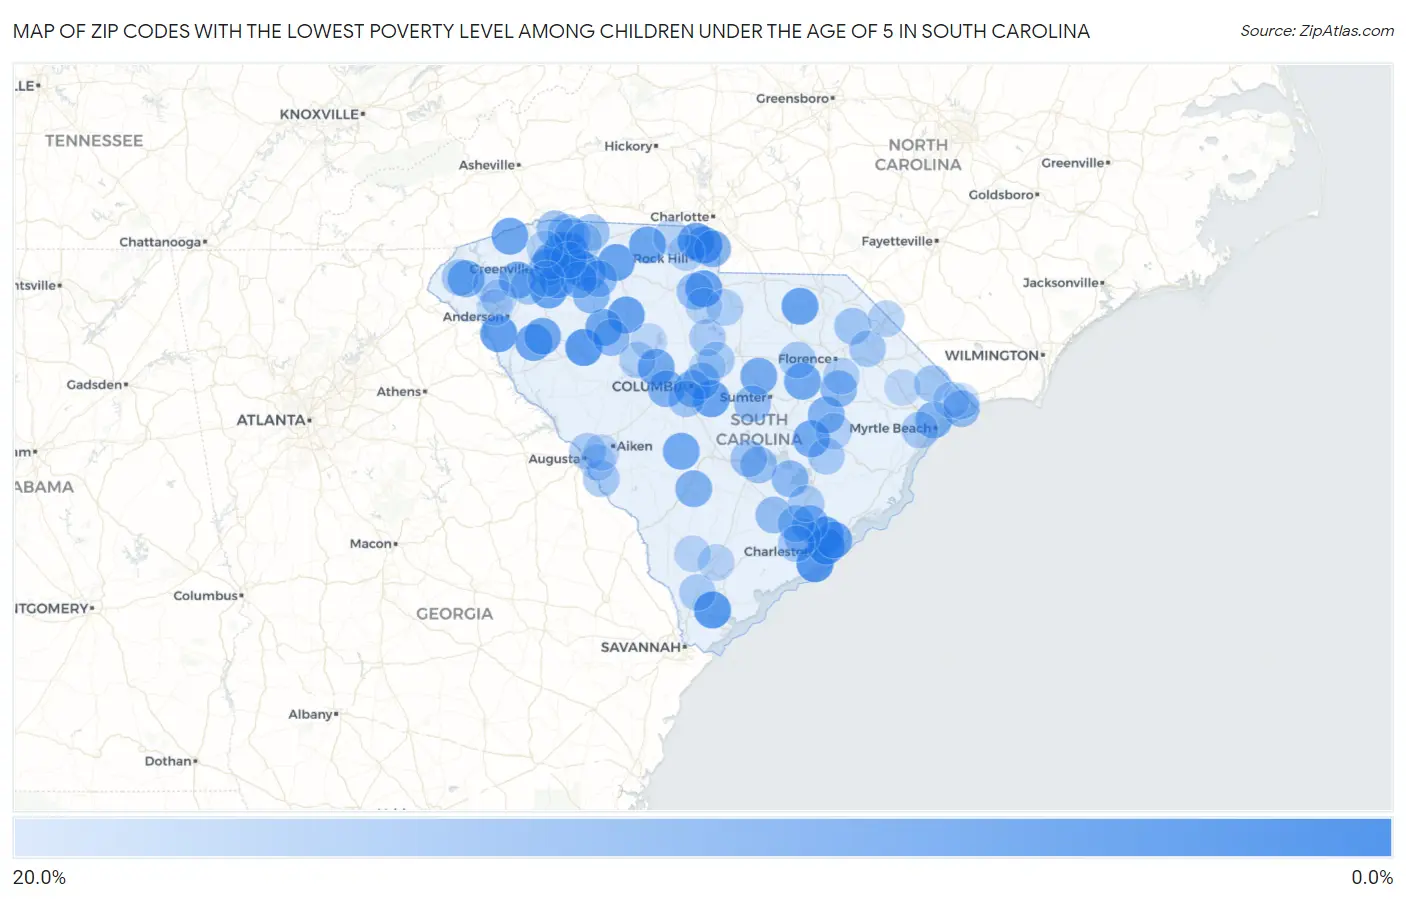
Map of Zip Codes with the Lowest Poverty Level Among Children Under the Age of 5 in South Carolina
20.0%
0.0%
Zip Codes with the Lowest Poverty Level Among Children Under the Age of 5 in South Carolina
| Zip Code | Child Poverty | vs State | vs National | |
| 1. | 29412 | 0.26% | 22.4%(-22.1)#1 | 18.1%(-17.8)#14 |
| 2. | 29909 | 0.81% | 22.4%(-21.6)#2 | 18.1%(-17.3)#176 |
| 3. | 29332 | 0.98% | 22.4%(-21.4)#3 | 18.1%(-17.1)#263 |
| 4. | 29715 | 1.6% | 22.4%(-20.8)#4 | 18.1%(-16.5)#569 |
| 5. | 29492 | 1.9% | 22.4%(-20.5)#5 | 18.1%(-16.2)#774 |
| 6. | 29684 | 2.1% | 22.4%(-20.3)#6 | 18.1%(-16.0)#871 |
| 7. | 29464 | 2.3% | 22.4%(-20.1)#7 | 18.1%(-15.8)#1,008 |
| 8. | 29178 | 2.6% | 22.4%(-19.8)#8 | 18.1%(-15.5)#1,199 |
| 9. | 29385 | 2.6% | 22.4%(-19.7)#9 | 18.1%(-15.4)#1,248 |
| 10. | 29061 | 2.7% | 22.4%(-19.7)#10 | 18.1%(-15.4)#1,264 |
| 11. | 29372 | 2.9% | 22.4%(-19.4)#11 | 18.1%(-15.1)#1,464 |
| 12. | 29680 | 3.0% | 22.4%(-19.4)#12 | 18.1%(-15.1)#1,485 |
| 13. | 29584 | 3.0% | 22.4%(-19.3)#13 | 18.1%(-15.0)#1,518 |
| 14. | 29714 | 3.1% | 22.4%(-19.2)#14 | 18.1%(-14.9)#1,585 |
| 15. | 29743 | 3.3% | 22.4%(-19.1)#15 | 18.1%(-14.8)#1,685 |
| 16. | 29639 | 3.4% | 22.4%(-18.9)#16 | 18.1%(-14.6)#1,794 |
| 17. | 29635 | 3.4% | 22.4%(-18.9)#17 | 18.1%(-14.6)#1,796 |
| 18. | 29708 | 3.5% | 22.4%(-18.9)#18 | 18.1%(-14.6)#1,806 |
| 19. | 29365 | 3.7% | 22.4%(-18.7)#19 | 18.1%(-14.4)#1,939 |
| 20. | 29466 | 3.9% | 22.4%(-18.5)#20 | 18.1%(-14.2)#2,093 |
| 21. | 29638 | 4.1% | 22.4%(-18.3)#21 | 18.1%(-14.0)#2,245 |
| 22. | 29351 | 4.3% | 22.4%(-18.1)#22 | 18.1%(-13.8)#2,378 |
| 23. | 29080 | 4.3% | 22.4%(-18.0)#23 | 18.1%(-13.7)#2,440 |
| 24. | 29036 | 4.4% | 22.4%(-18.0)#24 | 18.1%(-13.7)#2,480 |
| 25. | 29107 | 4.5% | 22.4%(-17.9)#25 | 18.1%(-13.6)#2,549 |
| 26. | 29056 | 4.5% | 22.4%(-17.8)#26 | 18.1%(-13.5)#2,588 |
| 27. | 29040 | 4.7% | 22.4%(-17.7)#27 | 18.1%(-13.4)#2,683 |
| 28. | 29615 | 4.7% | 22.4%(-17.6)#28 | 18.1%(-13.3)#2,724 |
| 29. | 29376 | 5.1% | 22.4%(-17.3)#29 | 18.1%(-12.9)#2,980 |
| 30. | 29696 | 5.4% | 22.4%(-16.9)#30 | 18.1%(-12.6)#3,196 |
| 31. | 29642 | 5.5% | 22.4%(-16.9)#31 | 18.1%(-12.6)#3,228 |
| 32. | 29369 | 5.6% | 22.4%(-16.8)#32 | 18.1%(-12.5)#3,275 |
| 33. | 29681 | 5.7% | 22.4%(-16.7)#33 | 18.1%(-12.4)#3,396 |
| 34. | 29003 | 6.2% | 22.4%(-16.2)#34 | 18.1%(-11.8)#3,743 |
| 35. | 29445 | 6.2% | 22.4%(-16.1)#35 | 18.1%(-11.8)#3,758 |
| 36. | 29072 | 6.3% | 22.4%(-16.1)#36 | 18.1%(-11.8)#3,797 |
| 37. | 29707 | 6.3% | 22.4%(-16.1)#37 | 18.1%(-11.8)#3,798 |
| 38. | 29650 | 6.3% | 22.4%(-16.1)#38 | 18.1%(-11.8)#3,801 |
| 39. | 29518 | 6.6% | 22.4%(-15.8)#39 | 18.1%(-11.5)#4,000 |
| 40. | 29201 | 6.7% | 22.4%(-15.7)#40 | 18.1%(-11.4)#4,021 |
| 41. | 29579 | 6.7% | 22.4%(-15.6)#41 | 18.1%(-11.3)#4,097 |
| 42. | 29335 | 7.7% | 22.4%(-14.6)#42 | 18.1%(-10.3)#4,764 |
| 43. | 29530 | 8.2% | 22.4%(-14.2)#43 | 18.1%(-9.88)#5,023 |
| 44. | 29436 | 8.2% | 22.4%(-14.2)#44 | 18.1%(-9.84)#5,047 |
| 45. | 29355 | 8.6% | 22.4%(-13.8)#45 | 18.1%(-9.46)#5,332 |
| 46. | 29404 | 8.6% | 22.4%(-13.7)#46 | 18.1%(-9.42)#5,360 |
| 47. | 29206 | 8.7% | 22.4%(-13.7)#47 | 18.1%(-9.40)#5,370 |
| 48. | 29582 | 8.8% | 22.4%(-13.6)#48 | 18.1%(-9.26)#5,482 |
| 49. | 29374 | 9.0% | 22.4%(-13.4)#49 | 18.1%(-9.07)#5,613 |
| 50. | 29472 | 9.2% | 22.4%(-13.1)#50 | 18.1%(-8.82)#5,781 |
| 51. | 29388 | 9.4% | 22.4%(-13.0)#51 | 18.1%(-8.69)#5,861 |
| 52. | 29154 | 9.4% | 22.4%(-13.0)#52 | 18.1%(-8.64)#5,898 |
| 53. | 29163 | 9.5% | 22.4%(-12.8)#53 | 18.1%(-8.54)#5,972 |
| 54. | 29729 | 9.7% | 22.4%(-12.6)#54 | 18.1%(-8.33)#6,101 |
| 55. | 29322 | 10.0% | 22.4%(-12.4)#55 | 18.1%(-8.09)#6,231 |
| 56. | 29356 | 10.0% | 22.4%(-12.4)#56 | 18.1%(-8.06)#6,239 |
| 57. | 29456 | 10.1% | 22.4%(-12.3)#57 | 18.1%(-8.00)#6,303 |
| 58. | 29142 | 10.2% | 22.4%(-12.1)#58 | 18.1%(-7.82)#6,404 |
| 59. | 29323 | 10.6% | 22.4%(-11.7)#59 | 18.1%(-7.42)#6,648 |
| 60. | 29673 | 10.8% | 22.4%(-11.6)#60 | 18.1%(-7.31)#6,701 |
| 61. | 29172 | 10.9% | 22.4%(-11.5)#61 | 18.1%(-7.19)#6,755 |
| 62. | 29569 | 11.1% | 22.4%(-11.3)#62 | 18.1%(-6.97)#6,884 |
| 63. | 29349 | 11.1% | 22.4%(-11.3)#63 | 18.1%(-6.96)#6,886 |
| 64. | 29516 | 11.1% | 22.4%(-11.3)#64 | 18.1%(-6.95)#6,911 |
| 65. | 29334 | 11.3% | 22.4%(-11.1)#65 | 18.1%(-6.81)#7,003 |
| 66. | 29691 | 11.3% | 22.4%(-11.1)#66 | 18.1%(-6.77)#7,018 |
| 67. | 29592 | 11.5% | 22.4%(-10.8)#67 | 18.1%(-6.52)#7,172 |
| 68. | 29588 | 11.7% | 22.4%(-10.7)#68 | 18.1%(-6.37)#7,261 |
| 69. | 29069 | 11.7% | 22.4%(-10.7)#69 | 18.1%(-6.35)#7,282 |
| 70. | 29564 | 11.8% | 22.4%(-10.6)#70 | 18.1%(-6.30)#7,312 |
| 71. | 29414 | 11.8% | 22.4%(-10.6)#71 | 18.1%(-6.25)#7,337 |
| 72. | 29831 | 11.9% | 22.4%(-10.5)#72 | 18.1%(-6.16)#7,396 |
| 73. | 29841 | 12.0% | 22.4%(-10.3)#73 | 18.1%(-6.02)#7,493 |
| 74. | 29130 | 12.2% | 22.4%(-10.1)#74 | 18.1%(-5.83)#7,594 |
| 75. | 29461 | 12.4% | 22.4%(-9.99)#75 | 18.1%(-5.68)#7,692 |
| 76. | 29045 | 12.4% | 22.4%(-9.99)#76 | 18.1%(-5.68)#7,693 |
| 77. | 29936 | 12.5% | 22.4%(-9.87)#77 | 18.1%(-5.56)#7,746 |
| 78. | 29127 | 12.6% | 22.4%(-9.78)#78 | 18.1%(-5.47)#7,817 |
| 79. | 29058 | 12.9% | 22.4%(-9.52)#79 | 18.1%(-5.21)#7,952 |
| 80. | 29316 | 13.0% | 22.4%(-9.42)#80 | 18.1%(-5.11)#8,011 |
| 81. | 29547 | 13.0% | 22.4%(-9.41)#81 | 18.1%(-5.10)#8,019 |
| 82. | 29541 | 13.0% | 22.4%(-9.37)#82 | 18.1%(-5.06)#8,043 |
| 83. | 29732 | 13.3% | 22.4%(-9.05)#83 | 18.1%(-4.74)#8,219 |
| 84. | 29556 | 13.4% | 22.4%(-9.01)#84 | 18.1%(-4.70)#8,269 |
| 85. | 29630 | 13.4% | 22.4%(-9.01)#85 | 18.1%(-4.70)#8,271 |
| 86. | 29055 | 13.6% | 22.4%(-8.76)#86 | 18.1%(-4.45)#8,407 |
| 87. | 29687 | 13.7% | 22.4%(-8.68)#87 | 18.1%(-4.37)#8,453 |
| 88. | 29662 | 13.9% | 22.4%(-8.47)#88 | 18.1%(-4.16)#8,589 |
| 89. | 29945 | 13.9% | 22.4%(-8.43)#89 | 18.1%(-4.12)#8,609 |
| 90. | 29944 | 14.0% | 22.4%(-8.38)#90 | 18.1%(-4.07)#8,636 |
| 91. | 29568 | 14.0% | 22.4%(-8.36)#91 | 18.1%(-4.05)#8,640 |
| 92. | 29710 | 14.2% | 22.4%(-8.21)#92 | 18.1%(-3.90)#8,723 |
| 93. | 29842 | 14.3% | 22.4%(-8.09)#93 | 18.1%(-3.78)#8,785 |
| 94. | 29670 | 14.3% | 22.4%(-8.06)#94 | 18.1%(-3.75)#8,857 |
| 95. | 29851 | 14.6% | 22.4%(-7.77)#95 | 18.1%(-3.46)#8,993 |
| 96. | 29229 | 14.9% | 22.4%(-7.48)#96 | 18.1%(-3.17)#9,139 |
| 97. | 29126 | 15.0% | 22.4%(-7.42)#97 | 18.1%(-3.11)#9,180 |
| 98. | 29544 | 15.2% | 22.4%(-7.17)#98 | 18.1%(-2.86)#9,325 |
| 99. | 29566 | 15.4% | 22.4%(-6.99)#99 | 18.1%(-2.68)#9,415 |
| 100. | 29625 | 15.4% | 22.4%(-6.94)#100 | 18.1%(-2.63)#9,469 |
Common Questions
What are the Top 10 Zip Codes with the Lowest Poverty Level Among Children Under the Age of 5 in South Carolina?
Top 10 Zip Codes with the Lowest Poverty Level Among Children Under the Age of 5 in South Carolina are:
What zip code has the Lowest Poverty Level Among Children Under the Age of 5 in South Carolina?
29412 has the Lowest Poverty Level Among Children Under the Age of 5 in South Carolina with 0.26%.
What is the Poverty Level Among Children Under the Age of 5 in the State of South Carolina?
Poverty Level Among Children Under the Age of 5 in South Carolina is 22.4%.
What is the Poverty Level Among Children Under the Age of 5 in the United States?
Poverty Level Among Children Under the Age of 5 in the United States is 18.1%.