Yemassee, SC Map & Demographics
Yemassee Map
Yemassee Overview
$27,794
PER CAPITA INCOME
$61,683
AVG FAMILY INCOME
$45,323
AVG HOUSEHOLD INCOME
31.1%
WAGE / INCOME GAP [ % ]
68.9¢/ $1
WAGE / INCOME GAP [ $ ]
0.49
INEQUALITY / GINI INDEX
974
TOTAL POPULATION
323
MALE POPULATION
651
FEMALE POPULATION
49.62
MALES / 100 FEMALES
201.55
FEMALES / 100 MALES
34.9
MEDIAN AGE
3.0
AVG FAMILY SIZE
2.2
AVG HOUSEHOLD SIZE
461
LABOR FORCE [ PEOPLE ]
62.8%
PERCENT IN LABOR FORCE
5.2%
UNEMPLOYMENT RATE
Yemassee Zip Codes
Yemassee Area Codes
Income in Yemassee
Income Overview in Yemassee
Per Capita Income in Yemassee is $27,794, while median incomes of families and households are $61,683 and $45,323 respectively.
| Characteristic | Number | Measure |
| Per Capita Income | 974 | $27,794 |
| Median Family Income | 255 | $61,683 |
| Mean Family Income | 255 | $66,876 |
| Median Household Income | 432 | $45,323 |
| Mean Household Income | 432 | $59,169 |
| Income Deficit | 255 | $0 |
| Wage / Income Gap (%) | 974 | 31.11% |
| Wage / Income Gap ($) | 974 | 68.89¢ per $1 |
| Gini / Inequality Index | 974 | 0.49 |
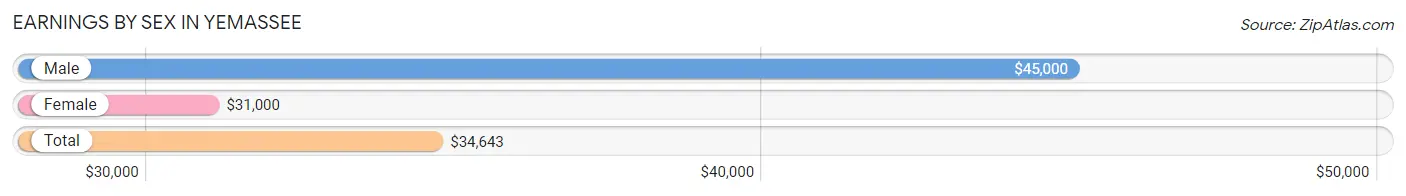
Earnings by Sex in Yemassee
Average Earnings in Yemassee are $34,643, $45,000 for men and $31,000 for women, a difference of 31.1%.
| Sex | Number | Average Earnings |
| Male | 132 (29.6%) | $45,000 |
| Female | 314 (70.4%) | $31,000 |
| Total | 446 (100.0%) | $34,643 |
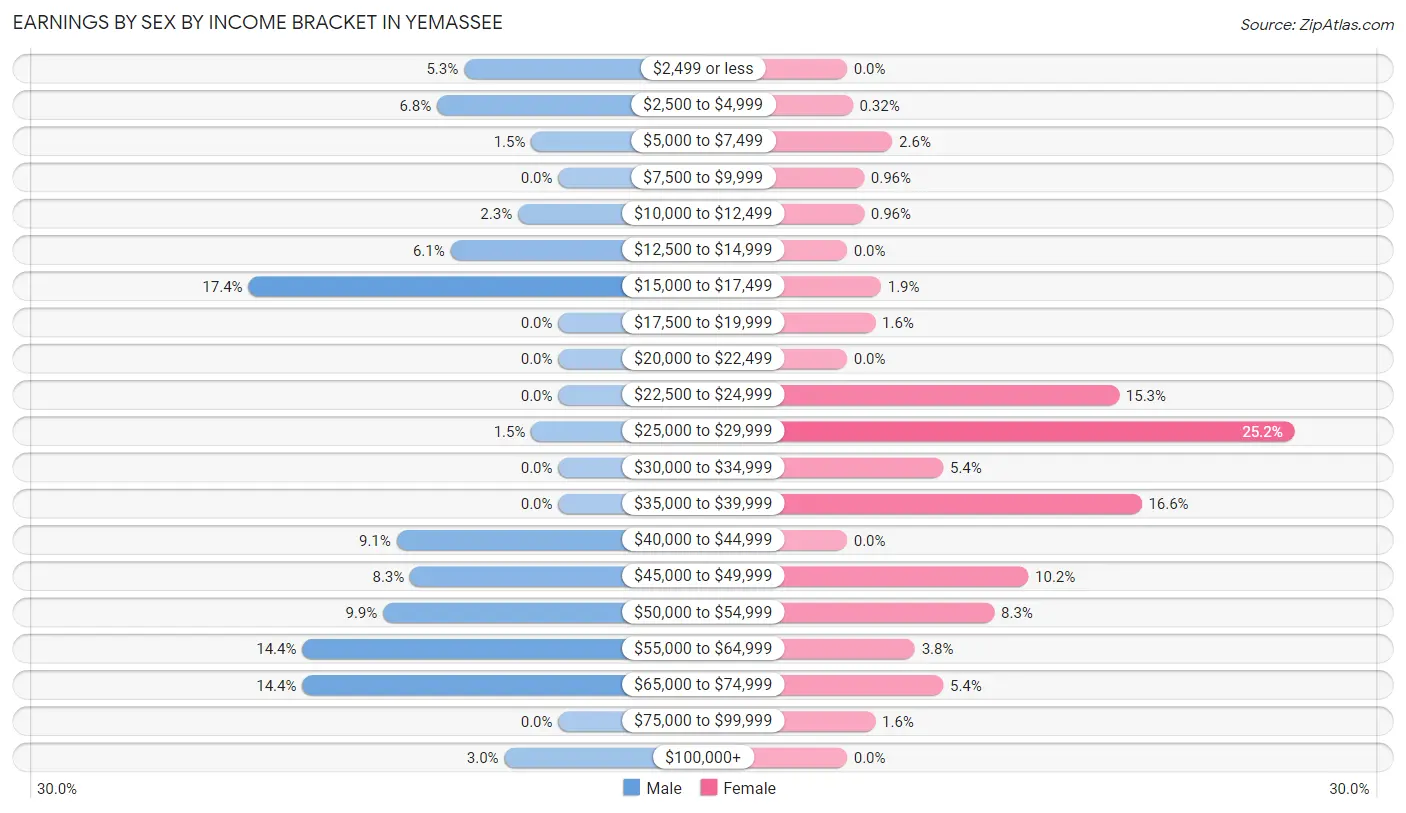
Earnings by Sex by Income Bracket in Yemassee
The most common earnings brackets in Yemassee are $15,000 to $17,499 for men (23 | 17.4%) and $25,000 to $29,999 for women (79 | 25.2%).
| Income | Male | Female |
| $2,499 or less | 7 (5.3%) | 0 (0.0%) |
| $2,500 to $4,999 | 9 (6.8%) | 1 (0.3%) |
| $5,000 to $7,499 | 2 (1.5%) | 8 (2.5%) |
| $7,500 to $9,999 | 0 (0.0%) | 3 (1.0%) |
| $10,000 to $12,499 | 3 (2.3%) | 3 (1.0%) |
| $12,500 to $14,999 | 8 (6.1%) | 0 (0.0%) |
| $15,000 to $17,499 | 23 (17.4%) | 6 (1.9%) |
| $17,500 to $19,999 | 0 (0.0%) | 5 (1.6%) |
| $20,000 to $22,499 | 0 (0.0%) | 0 (0.0%) |
| $22,500 to $24,999 | 0 (0.0%) | 48 (15.3%) |
| $25,000 to $29,999 | 2 (1.5%) | 79 (25.2%) |
| $30,000 to $34,999 | 0 (0.0%) | 17 (5.4%) |
| $35,000 to $39,999 | 0 (0.0%) | 52 (16.6%) |
| $40,000 to $44,999 | 12 (9.1%) | 0 (0.0%) |
| $45,000 to $49,999 | 11 (8.3%) | 32 (10.2%) |
| $50,000 to $54,999 | 13 (9.9%) | 26 (8.3%) |
| $55,000 to $64,999 | 19 (14.4%) | 12 (3.8%) |
| $65,000 to $74,999 | 19 (14.4%) | 17 (5.4%) |
| $75,000 to $99,999 | 0 (0.0%) | 5 (1.6%) |
| $100,000+ | 4 (3.0%) | 0 (0.0%) |
| Total | 132 (100.0%) | 314 (100.0%) |
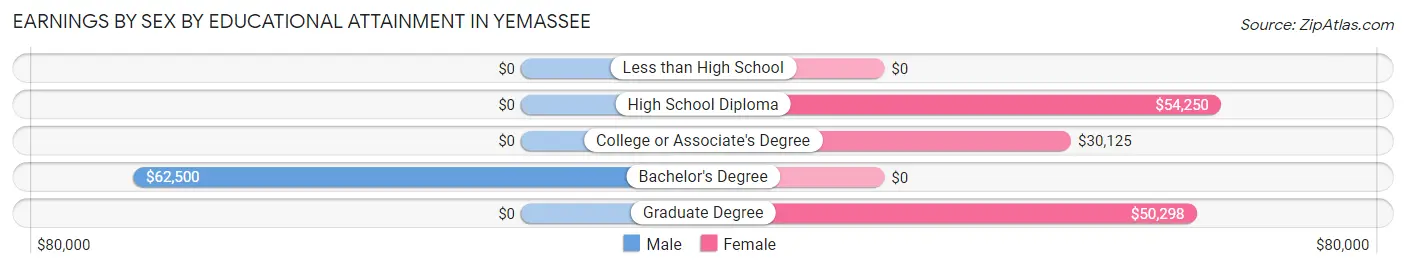
Earnings by Sex by Educational Attainment in Yemassee
Average earnings in Yemassee are $41,667 for men and $32,000 for women, a difference of 23.2%. Men with an educational attainment of bachelor's degree enjoy the highest average annual earnings of $62,500, while those with bachelor's degree education earn the least with $62,500. Women with an educational attainment of high school diploma earn the most with the average annual earnings of $54,250, while those with college or associate's degree education have the smallest earnings of $30,125.
| Educational Attainment | Male Income | Female Income |
| Less than High School | - | - |
| High School Diploma | - | - |
| College or Associate's Degree | - | - |
| Bachelor's Degree | $62,500 | $0 |
| Graduate Degree | - | - |
| Total | $41,667 | $32,000 |
Family Income in Yemassee
Family Income Brackets in Yemassee
According to the Yemassee family income data, there are 77 families falling into the $50,000 to $74,999 income range, which is the most common income bracket and makes up 30.2% of all families.
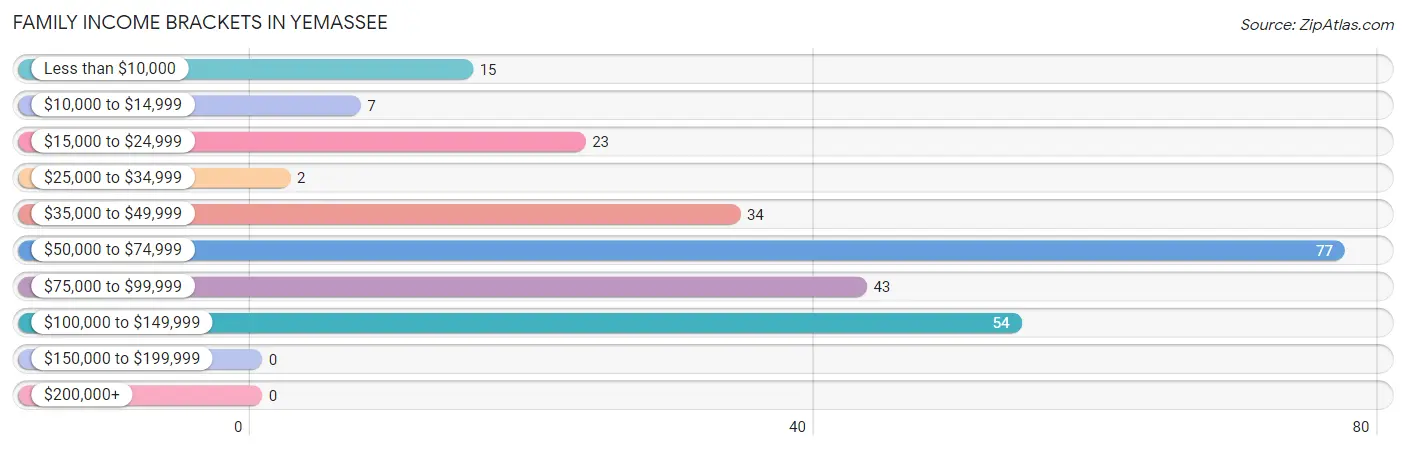
| Income Bracket | # Families | % Families |
| Less than $10,000 | 15 | 5.9% |
| $10,000 to $14,999 | 7 | 2.7% |
| $15,000 to $24,999 | 23 | 9.0% |
| $25,000 to $34,999 | 2 | 0.8% |
| $35,000 to $49,999 | 34 | 13.3% |
| $50,000 to $74,999 | 77 | 30.2% |
| $75,000 to $99,999 | 43 | 16.9% |
| $100,000 to $149,999 | 54 | 21.2% |
| $150,000 to $199,999 | 0 | 0.0% |
| $200,000+ | 0 | 0.0% |
Family Income by Famaliy Size in Yemassee
2-person families (136 | 53.3%) account for the highest median family income in Yemassee with $83,190 per family, while 2-person families (136 | 53.3%) have the highest median income of $41,595 per family member.
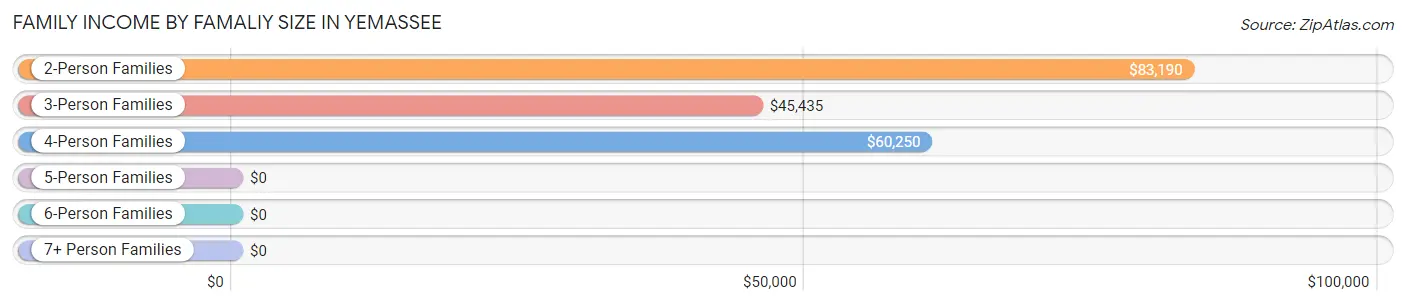
| Income Bracket | # Families | Median Income |
| 2-Person Families | 136 (53.3%) | $83,190 |
| 3-Person Families | 74 (29.0%) | $45,435 |
| 4-Person Families | 29 (11.4%) | $60,250 |
| 5-Person Families | 16 (6.3%) | $0 |
| 6-Person Families | 0 (0.0%) | $0 |
| 7+ Person Families | 0 (0.0%) | $0 |
| Total | 255 (100.0%) | $61,683 |
Family Income by Number of Earners in Yemassee
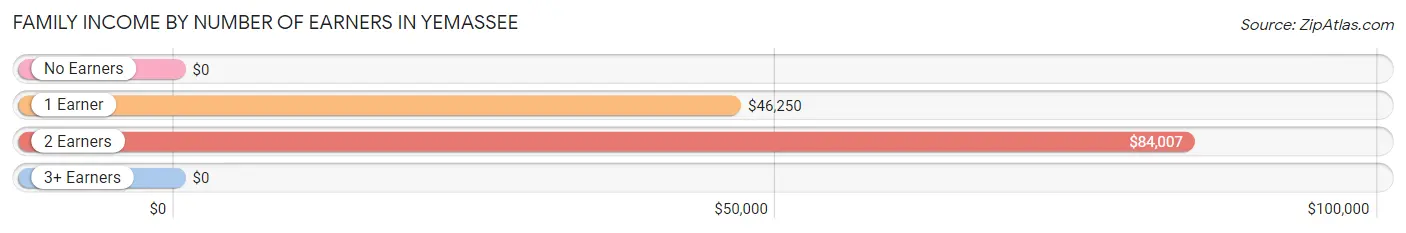
| Number of Earners | # Families | Median Income |
| No Earners | 45 (17.6%) | $0 |
| 1 Earner | 131 (51.4%) | $46,250 |
| 2 Earners | 77 (30.2%) | $84,007 |
| 3+ Earners | 2 (0.8%) | $0 |
| Total | 255 (100.0%) | $61,683 |
Household Income in Yemassee
Household Income Brackets in Yemassee
With 83 households falling in the category, the $50,000 to $74,999 income range is the most frequent in Yemassee, accounting for 19.2% of all households.
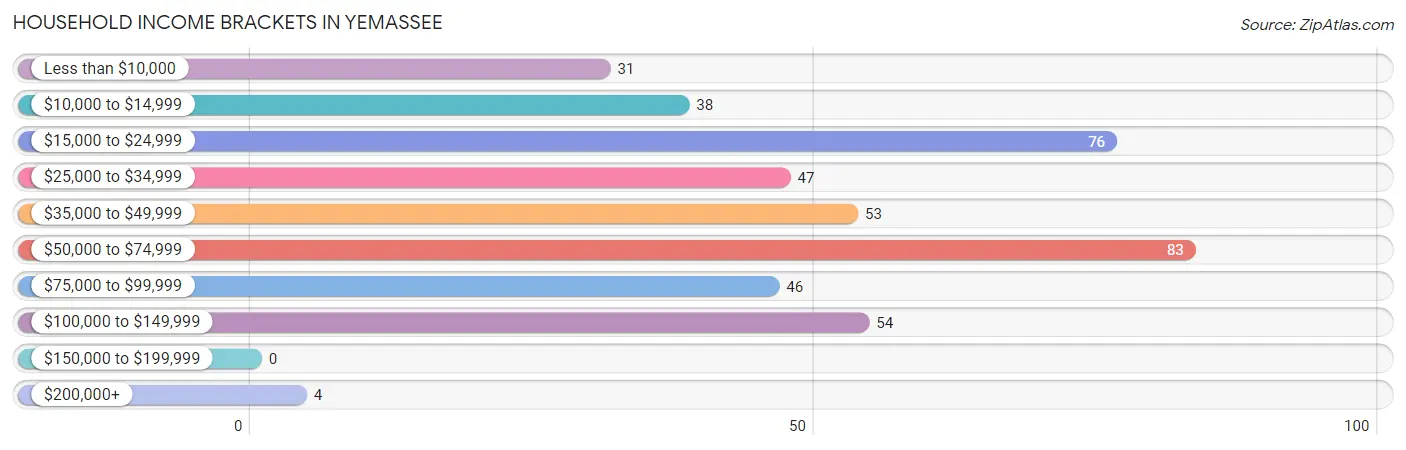
| Income Bracket | # Households | % Households |
| Less than $10,000 | 31 | 7.2% |
| $10,000 to $14,999 | 38 | 8.8% |
| $15,000 to $24,999 | 76 | 17.6% |
| $25,000 to $34,999 | 47 | 10.9% |
| $35,000 to $49,999 | 53 | 12.3% |
| $50,000 to $74,999 | 83 | 19.2% |
| $75,000 to $99,999 | 46 | 10.6% |
| $100,000 to $149,999 | 54 | 12.5% |
| $150,000 to $199,999 | 0 | 0.0% |
| $200,000+ | 4 | 0.9% |
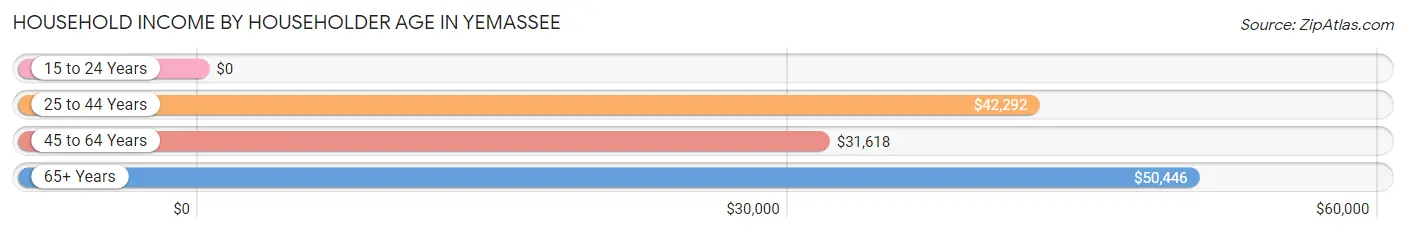
Household Income by Householder Age in Yemassee
The median household income in Yemassee is $45,323, with the highest median household income of $50,446 found in the 65+ years age bracket for the primary householder. A total of 125 households (28.9%) fall into this category. Meanwhile, the 15 to 24 years age bracket for the primary householder has the lowest median household income of $0, with 34 households (7.9%) in this group.
| Income Bracket | # Households | Median Income |
| 15 to 24 Years | 34 (7.9%) | $0 |
| 25 to 44 Years | 123 (28.5%) | $42,292 |
| 45 to 64 Years | 150 (34.7%) | $31,618 |
| 65+ Years | 125 (28.9%) | $50,446 |
| Total | 432 (100.0%) | $45,323 |
Poverty in Yemassee
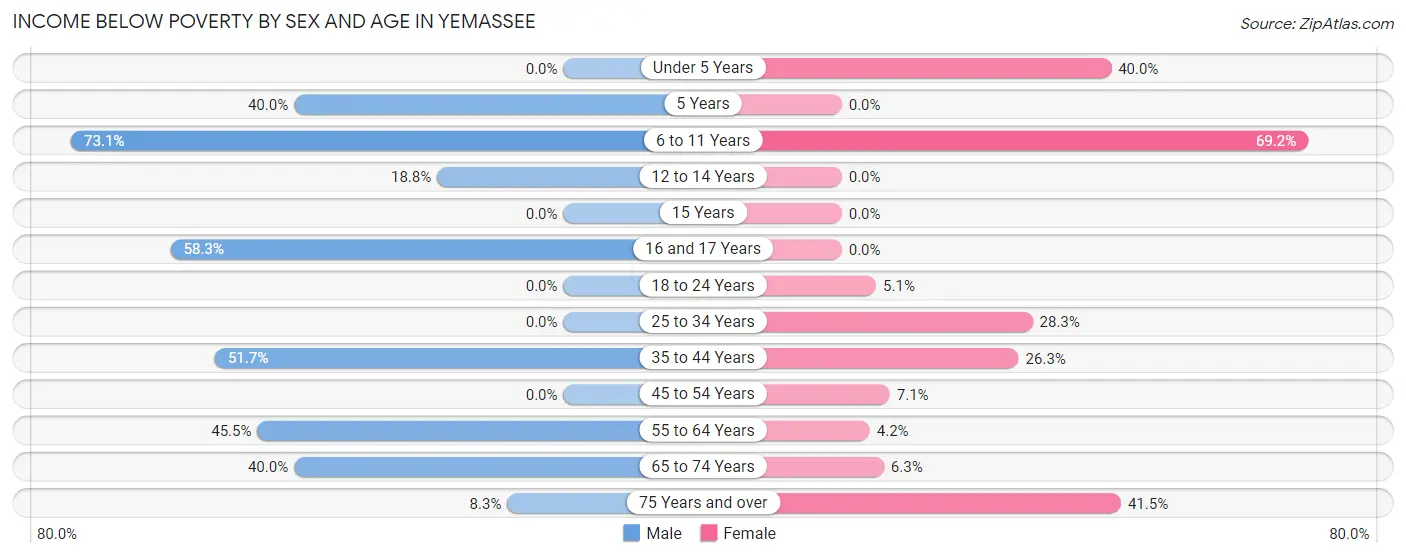
Income Below Poverty by Sex and Age in Yemassee
With 25.4% poverty level for males and 20.1% for females among the residents of Yemassee, 6 to 11 year old males and 6 to 11 year old females are the most vulnerable to poverty, with 19 males (73.1%) and 45 females (69.2%) in their respective age groups living below the poverty level.
| Age Bracket | Male | Female |
| Under 5 Years | 0 (0.0%) | 10 (40.0%) |
| 5 Years | 4 (40.0%) | 0 (0.0%) |
| 6 to 11 Years | 19 (73.1%) | 45 (69.2%) |
| 12 to 14 Years | 3 (18.8%) | 0 (0.0%) |
| 15 Years | 0 (0.0%) | 0 (0.0%) |
| 16 and 17 Years | 7 (58.3%) | 0 (0.0%) |
| 18 to 24 Years | 0 (0.0%) | 5 (5.1%) |
| 25 to 34 Years | 0 (0.0%) | 17 (28.3%) |
| 35 to 44 Years | 15 (51.7%) | 26 (26.3%) |
| 45 to 54 Years | 0 (0.0%) | 3 (7.1%) |
| 55 to 64 Years | 10 (45.5%) | 4 (4.2%) |
| 65 to 74 Years | 20 (40.0%) | 4 (6.2%) |
| 75 Years and over | 2 (8.3%) | 17 (41.5%) |
| Total | 80 (25.4%) | 131 (20.1%) |
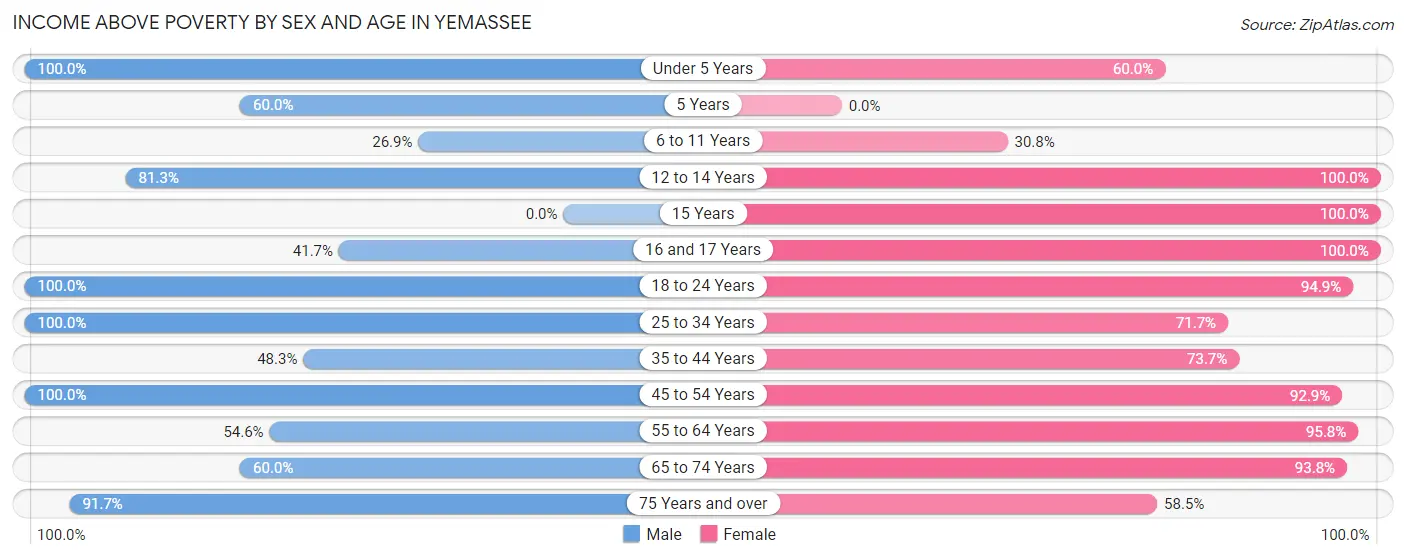
Income Above Poverty by Sex and Age in Yemassee
According to the poverty statistics in Yemassee, males aged under 5 years and females aged 12 to 14 years are the age groups that are most secure financially, with 100.0% of males and 100.0% of females in these age groups living above the poverty line.
| Age Bracket | Male | Female |
| Under 5 Years | 45 (100.0%) | 15 (60.0%) |
| 5 Years | 6 (60.0%) | 0 (0.0%) |
| 6 to 11 Years | 7 (26.9%) | 20 (30.8%) |
| 12 to 14 Years | 13 (81.2%) | 31 (100.0%) |
| 15 Years | 0 (0.0%) | 14 (100.0%) |
| 16 and 17 Years | 5 (41.7%) | 16 (100.0%) |
| 18 to 24 Years | 19 (100.0%) | 93 (94.9%) |
| 25 to 34 Years | 43 (100.0%) | 43 (71.7%) |
| 35 to 44 Years | 14 (48.3%) | 73 (73.7%) |
| 45 to 54 Years | 19 (100.0%) | 39 (92.9%) |
| 55 to 64 Years | 12 (54.5%) | 92 (95.8%) |
| 65 to 74 Years | 30 (60.0%) | 60 (93.8%) |
| 75 Years and over | 22 (91.7%) | 24 (58.5%) |
| Total | 235 (74.6%) | 520 (79.9%) |
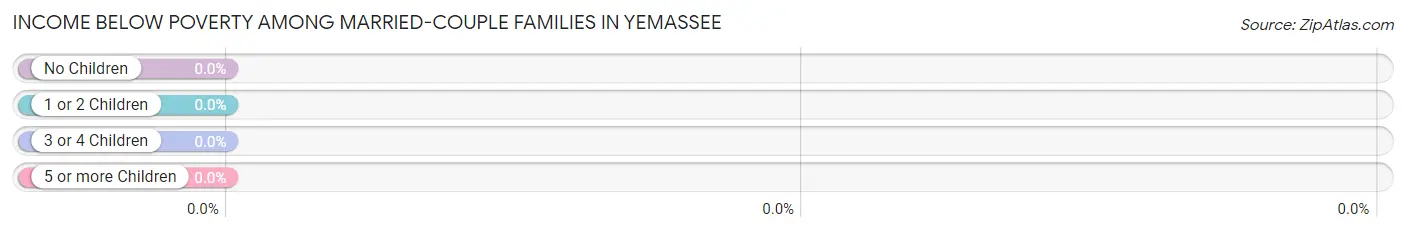
Income Below Poverty Among Married-Couple Families in Yemassee
| Children | Above Poverty | Below Poverty |
| No Children | 78 (100.0%) | 0 (0.0%) |
| 1 or 2 Children | 17 (100.0%) | 0 (0.0%) |
| 3 or 4 Children | 9 (100.0%) | 0 (0.0%) |
| 5 or more Children | 0 (0.0%) | 0 (0.0%) |
| Total | 104 (100.0%) | 0 (0.0%) |
Income Below Poverty Among Single-Parent Households in Yemassee
According to the poverty data in Yemassee, 100.0% or 15 single-father households and 23.5% or 32 single-mother households are living below the poverty line. Among single-father households, those with 1 or 2 children have the highest poverty rate, with 15 households (100.0%) experiencing poverty. Likewise, among single-mother households, those with 1 or 2 children have the highest poverty rate, with 26 households (29.9%) falling below the poverty line.
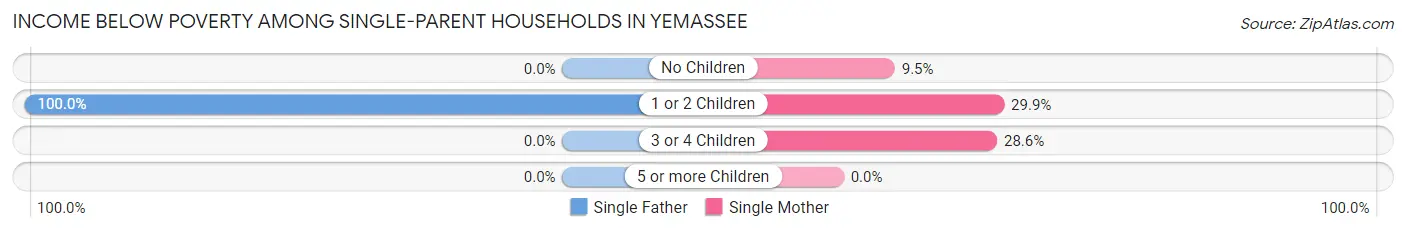
| Children | Single Father | Single Mother |
| No Children | 0 (0.0%) | 4 (9.5%) |
| 1 or 2 Children | 15 (100.0%) | 26 (29.9%) |
| 3 or 4 Children | 0 (0.0%) | 2 (28.6%) |
| 5 or more Children | 0 (0.0%) | 0 (0.0%) |
| Total | 15 (100.0%) | 32 (23.5%) |
Income Below Poverty Among Married-Couple vs Single-Parent Households in Yemassee
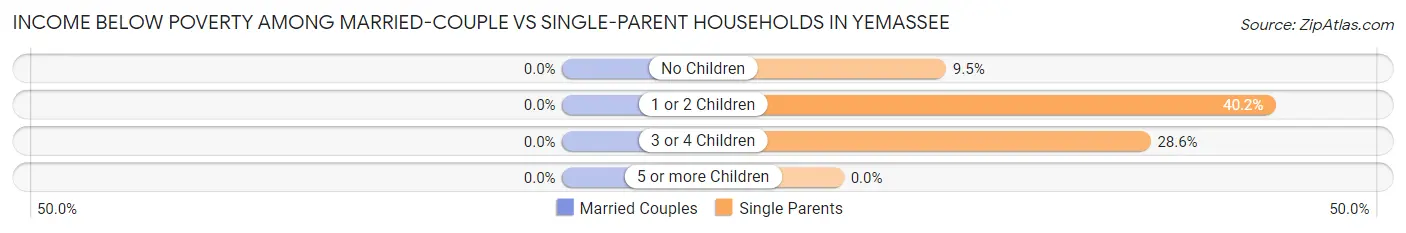
| Children | Married-Couple Families | Single-Parent Households |
| No Children | 0 (0.0%) | 4 (9.5%) |
| 1 or 2 Children | 0 (0.0%) | 41 (40.2%) |
| 3 or 4 Children | 0 (0.0%) | 2 (28.6%) |
| 5 or more Children | 0 (0.0%) | 0 (0.0%) |
| Total | 0 (0.0%) | 47 (31.1%) |
Race in Yemassee
The most populous races in Yemassee are Black / African American (582 | 59.8%), White / Caucasian (353 | 36.2%), and Two or more Races (39 | 4.0%).
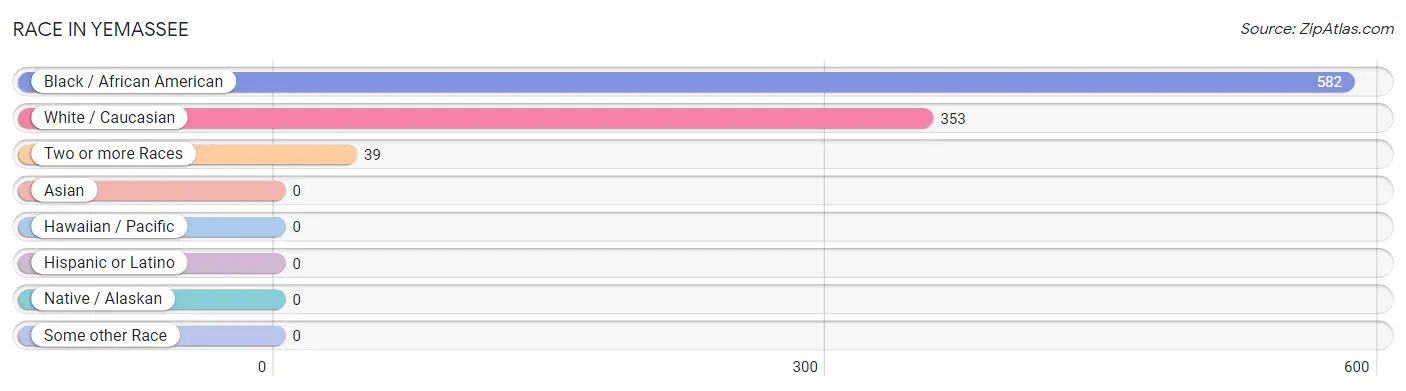
| Race | # Population | % Population |
| Asian | 0 | 0.0% |
| Black / African American | 582 | 59.8% |
| Hawaiian / Pacific | 0 | 0.0% |
| Hispanic or Latino | 0 | 0.0% |
| Native / Alaskan | 0 | 0.0% |
| White / Caucasian | 353 | 36.2% |
| Two or more Races | 39 | 4.0% |
| Some other Race | 0 | 0.0% |
| Total | 974 | 100.0% |
Ancestry in Yemassee
The most populous ancestries reported in Yemassee are American (50 | 5.1%), European (48 | 4.9%), English (29 | 3.0%), African (22 | 2.3%), and Subsaharan African (22 | 2.3%), together accounting for 17.6% of all Yemassee residents.
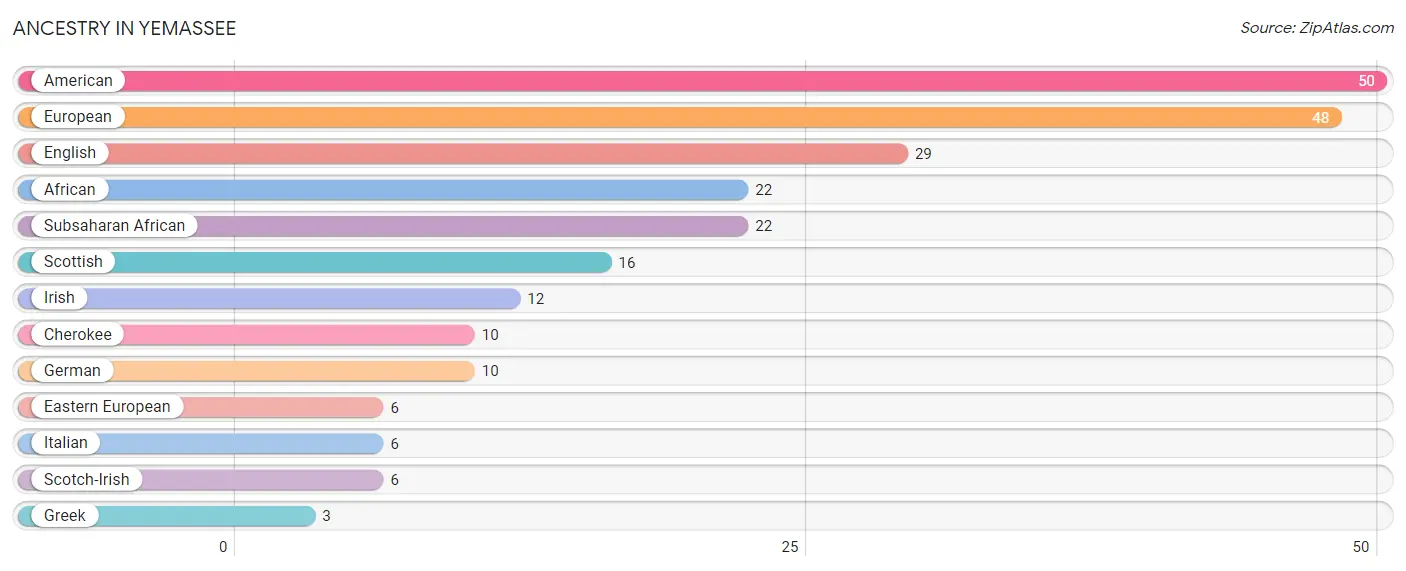
| Ancestry | # Population | % Population |
| African | 22 | 2.3% |
| American | 50 | 5.1% |
| Cherokee | 10 | 1.0% |
| Eastern European | 6 | 0.6% |
| English | 29 | 3.0% |
| European | 48 | 4.9% |
| German | 10 | 1.0% |
| Greek | 3 | 0.3% |
| Irish | 12 | 1.2% |
| Italian | 6 | 0.6% |
| Scotch-Irish | 6 | 0.6% |
| Scottish | 16 | 1.6% |
| Subsaharan African | 22 | 2.3% | View All 13 Rows |
Immigrants in Yemassee
The most numerous immigrant groups reported in Yemassee came from Australia (6 | 0.6%), and Oceania (6 | 0.6%), together accounting for 1.2% of all Yemassee residents.
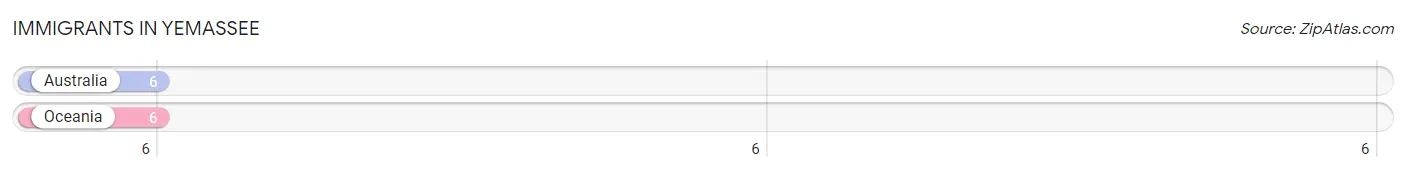
| Immigration Origin | # Population | % Population |
| Australia | 6 | 0.6% |
| Oceania | 6 | 0.6% | View All 2 Rows |
Sex and Age in Yemassee
Sex and Age in Yemassee
The most populous age groups in Yemassee are Under 5 Years (53 | 16.4%) for men and 20 to 24 Years (82 | 12.6%) for women.
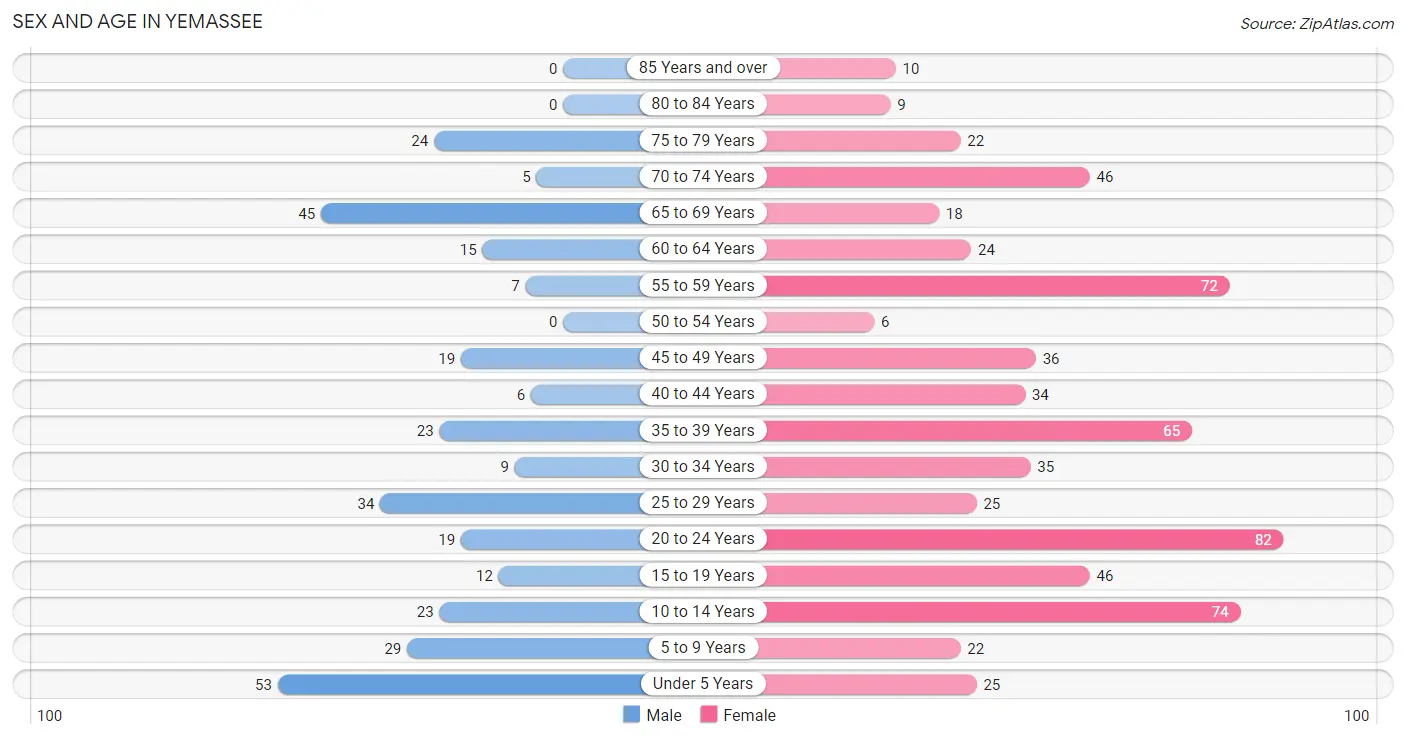
| Age Bracket | Male | Female |
| Under 5 Years | 53 (16.4%) | 25 (3.8%) |
| 5 to 9 Years | 29 (9.0%) | 22 (3.4%) |
| 10 to 14 Years | 23 (7.1%) | 74 (11.4%) |
| 15 to 19 Years | 12 (3.7%) | 46 (7.1%) |
| 20 to 24 Years | 19 (5.9%) | 82 (12.6%) |
| 25 to 29 Years | 34 (10.5%) | 25 (3.8%) |
| 30 to 34 Years | 9 (2.8%) | 35 (5.4%) |
| 35 to 39 Years | 23 (7.1%) | 65 (10.0%) |
| 40 to 44 Years | 6 (1.9%) | 34 (5.2%) |
| 45 to 49 Years | 19 (5.9%) | 36 (5.5%) |
| 50 to 54 Years | 0 (0.0%) | 6 (0.9%) |
| 55 to 59 Years | 7 (2.2%) | 72 (11.1%) |
| 60 to 64 Years | 15 (4.6%) | 24 (3.7%) |
| 65 to 69 Years | 45 (13.9%) | 18 (2.8%) |
| 70 to 74 Years | 5 (1.5%) | 46 (7.1%) |
| 75 to 79 Years | 24 (7.4%) | 22 (3.4%) |
| 80 to 84 Years | 0 (0.0%) | 9 (1.4%) |
| 85 Years and over | 0 (0.0%) | 10 (1.5%) |
| Total | 323 (100.0%) | 651 (100.0%) |
Families and Households in Yemassee
Median Family Size in Yemassee
The median family size in Yemassee is 2.97 persons per family, with single female/mother families (136 | 53.3%) accounting for the largest median family size of 3.44 persons per family. On the other hand, single male/father families (15 | 5.9%) represent the smallest median family size with 1.73 persons per family.
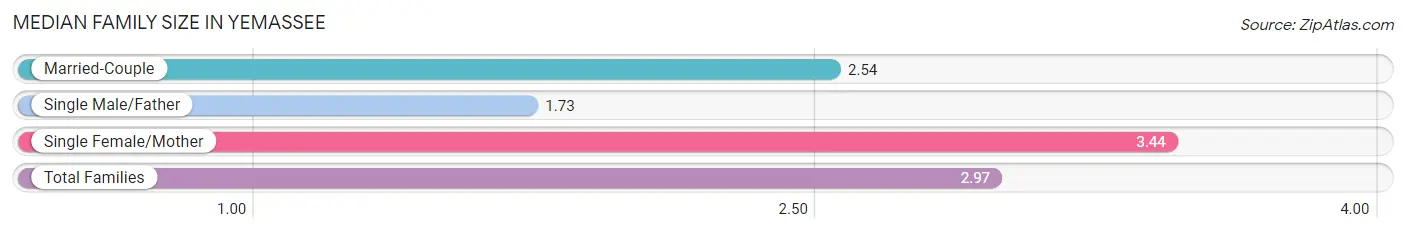
| Family Type | # Families | Family Size |
| Married-Couple | 104 (40.8%) | 2.54 |
| Single Male/Father | 15 (5.9%) | 1.73 |
| Single Female/Mother | 136 (53.3%) | 3.44 |
| Total Families | 255 (100.0%) | 2.97 |
Median Household Size in Yemassee
The median household size in Yemassee is 2.25 persons per household, with single female/mother households (136 | 31.5%) accounting for the largest median household size of 3.46 persons per household. non-family households (177 | 41.0%) represent the smallest median household size with 1.07 persons per household.
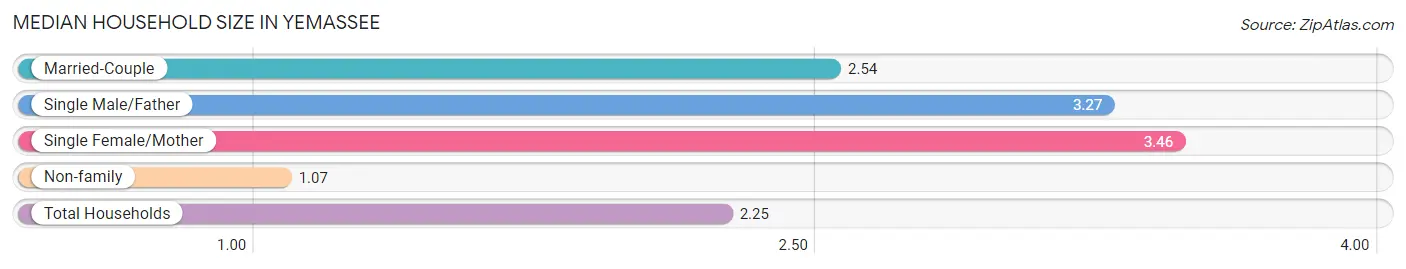
| Household Type | # Households | Household Size |
| Married-Couple | 104 (24.1%) | 2.54 |
| Single Male/Father | 15 (3.5%) | 3.27 |
| Single Female/Mother | 136 (31.5%) | 3.46 |
| Non-family | 177 (41.0%) | 1.07 |
| Total Households | 432 (100.0%) | 2.25 |
Household Size by Marriage Status in Yemassee
Out of a total of 432 households in Yemassee, 255 (59.0%) are family households, while 177 (41.0%) are nonfamily households. The most numerous type of family households are 2-person households, comprising 136, and the most common type of nonfamily households are 1-person households, comprising 165.
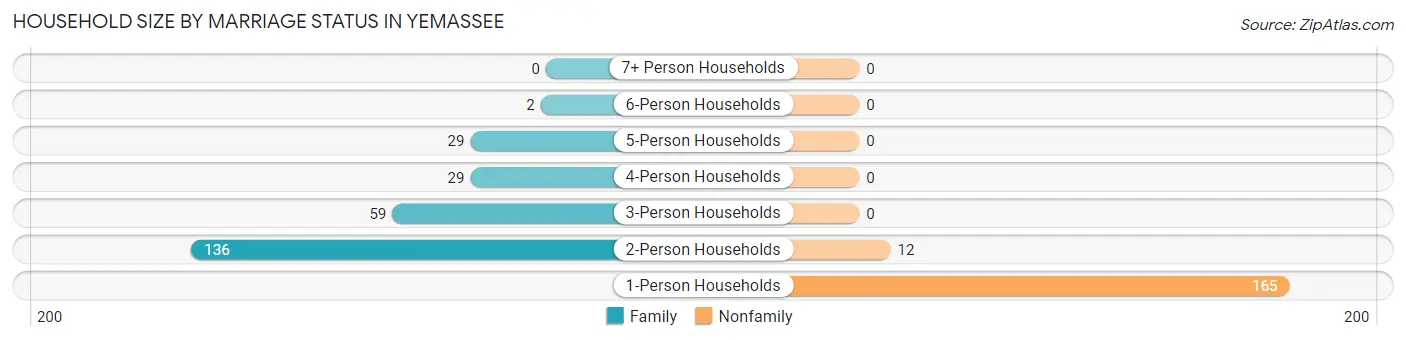
| Household Size | Family Households | Nonfamily Households |
| 1-Person Households | - | 165 (38.2%) |
| 2-Person Households | 136 (31.5%) | 12 (2.8%) |
| 3-Person Households | 59 (13.7%) | 0 (0.0%) |
| 4-Person Households | 29 (6.7%) | 0 (0.0%) |
| 5-Person Households | 29 (6.7%) | 0 (0.0%) |
| 6-Person Households | 2 (0.5%) | 0 (0.0%) |
| 7+ Person Households | 0 (0.0%) | 0 (0.0%) |
| Total | 255 (59.0%) | 177 (41.0%) |
Female Fertility in Yemassee
Fertility by Age in Yemassee
Average fertility rate in Yemassee is 6.0 births per 1,000 women. Women in the age bracket of 35 to 50 years have the highest fertility rate with 15.0 births per 1,000 women. Women in the age bracket of 35 to 50 years acount for 100.0% of all women with births.
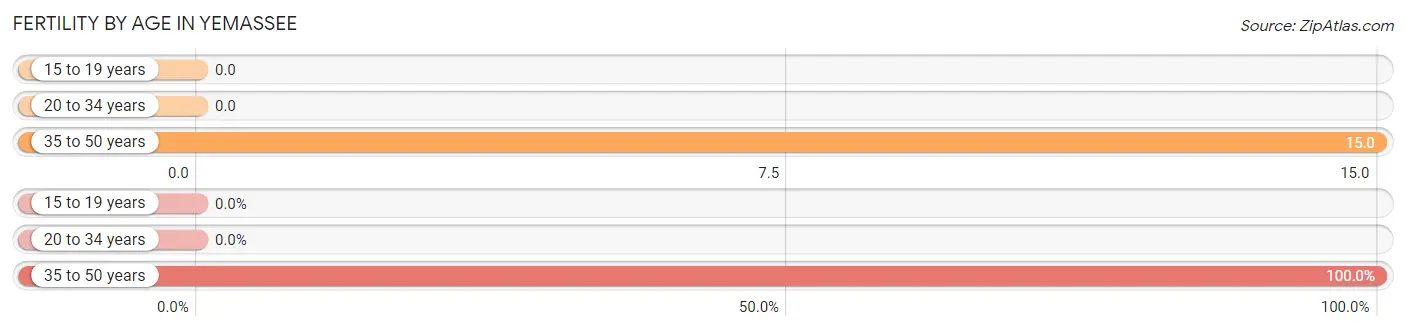
| Age Bracket | Women with Births | Births / 1,000 Women |
| 15 to 19 years | 0 (0.0%) | 0.0 |
| 20 to 34 years | 0 (0.0%) | 0.0 |
| 35 to 50 years | 2 (100.0%) | 15.0 |
| Total | 2 (100.0%) | 6.0 |
Fertility by Age by Marriage Status in Yemassee
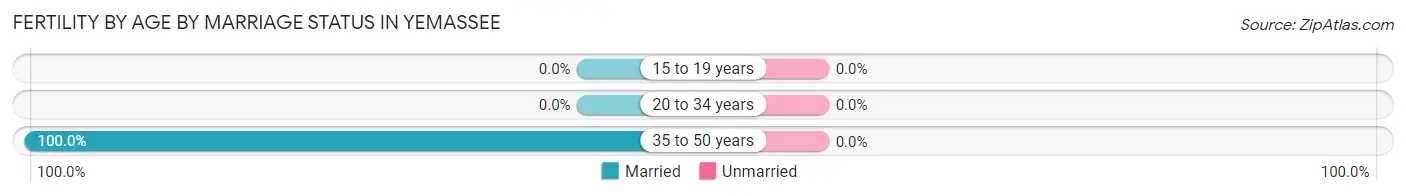
| Age Bracket | Married | Unmarried |
| 15 to 19 years | 0 (0.0%) | 0 (0.0%) |
| 20 to 34 years | 0 (0.0%) | 0 (0.0%) |
| 35 to 50 years | 2 (100.0%) | 0 (0.0%) |
| Total | 2 (100.0%) | 0 (0.0%) |
Fertility by Education in Yemassee
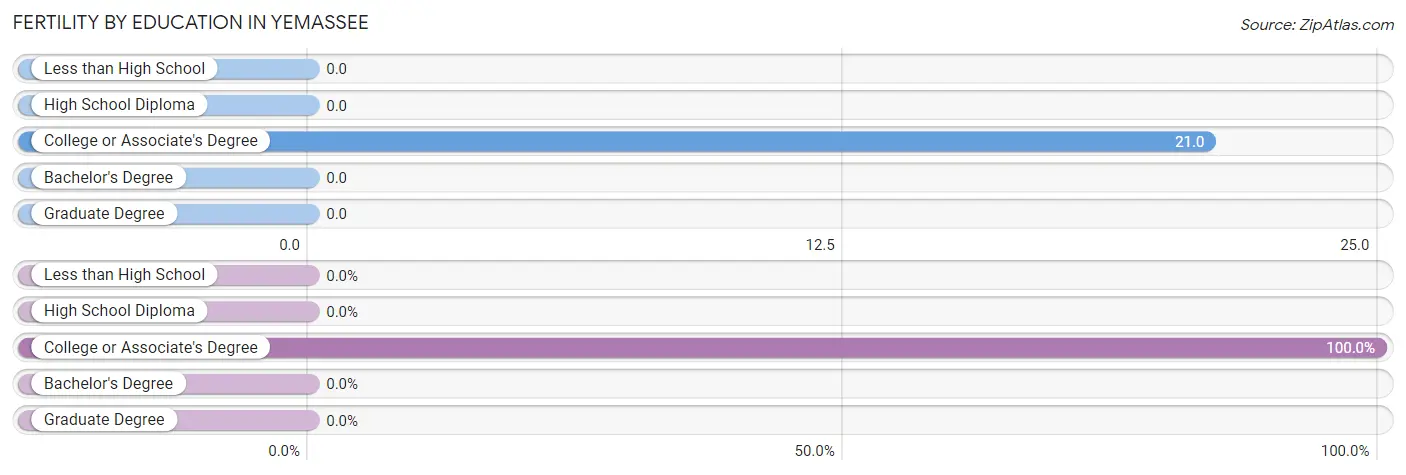
| Educational Attainment | Women with Births | Births / 1,000 Women |
| Less than High School | 0 (0.0%) | 0.0 |
| High School Diploma | 0 (0.0%) | 0.0 |
| College or Associate's Degree | 2 (100.0%) | 21.0 |
| Bachelor's Degree | 0 (0.0%) | 0.0 |
| Graduate Degree | 0 (0.0%) | 0.0 |
| Total | 2 (100.0%) | 6.0 |
Fertility by Education by Marriage Status in Yemassee
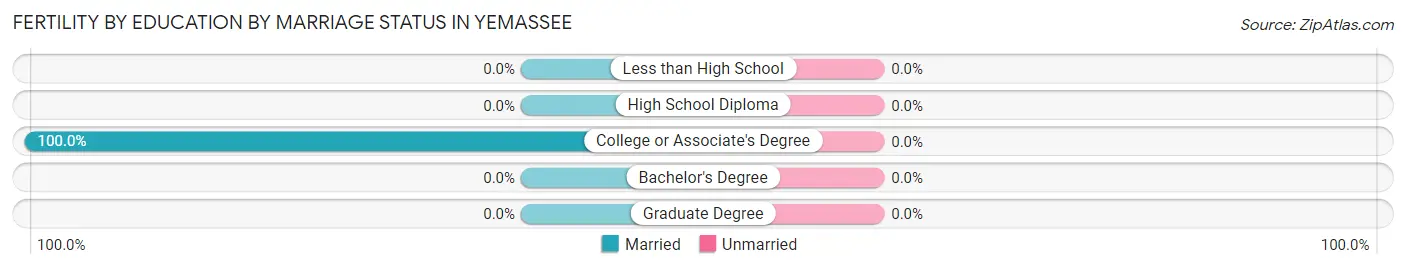
| Educational Attainment | Married | Unmarried |
| Less than High School | 0 (0.0%) | 0 (0.0%) |
| High School Diploma | 0 (0.0%) | 0 (0.0%) |
| College or Associate's Degree | 2 (100.0%) | 0 (0.0%) |
| Bachelor's Degree | 0 (0.0%) | 0 (0.0%) |
| Graduate Degree | 0 (0.0%) | 0 (0.0%) |
| Total | 2 (100.0%) | 0 (0.0%) |
Employment Characteristics in Yemassee
Employment by Class of Employer in Yemassee
Among the 429 employed individuals in Yemassee, private company employees (199 | 46.4%), state government employees (88 | 20.5%), and local government employees (68 | 15.9%) make up the most common classes of employment.
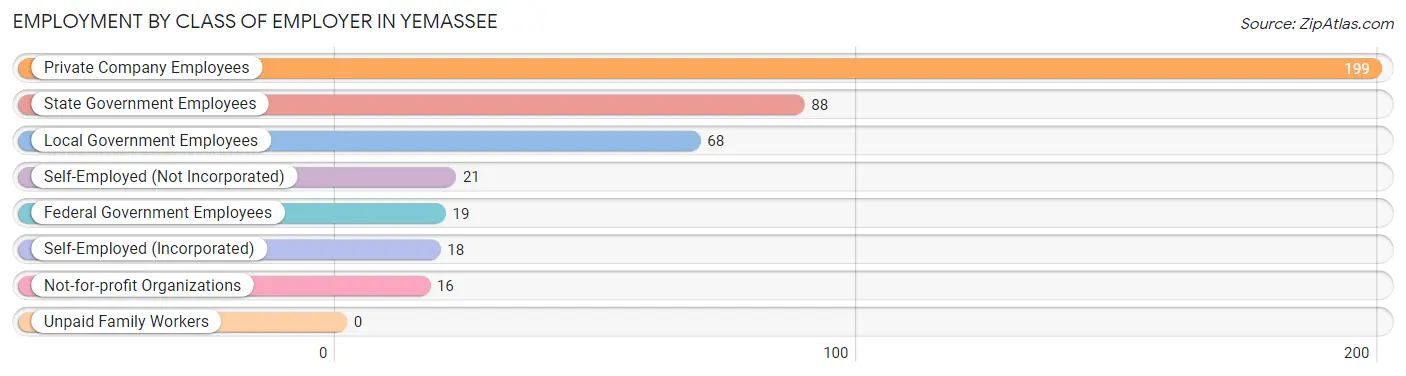
| Employer Class | # Employees | % Employees |
| Private Company Employees | 199 | 46.4% |
| Self-Employed (Incorporated) | 18 | 4.2% |
| Self-Employed (Not Incorporated) | 21 | 4.9% |
| Not-for-profit Organizations | 16 | 3.7% |
| Local Government Employees | 68 | 15.9% |
| State Government Employees | 88 | 20.5% |
| Federal Government Employees | 19 | 4.4% |
| Unpaid Family Workers | 0 | 0.0% |
| Total | 429 | 100.0% |
Employment Status by Age in Yemassee
According to the labor force statistics for Yemassee, out of the total population over 16 years of age (734), 62.8% or 461 individuals are in the labor force, with 5.2% or 24 of them unemployed. The age group with the highest labor force participation rate is 45 to 54 years, with 100.0% or 61 individuals in the labor force. Within the labor force, the 35 to 44 years age range has the highest percentage of unemployed individuals, with 13.5% or 15 of them being unemployed.
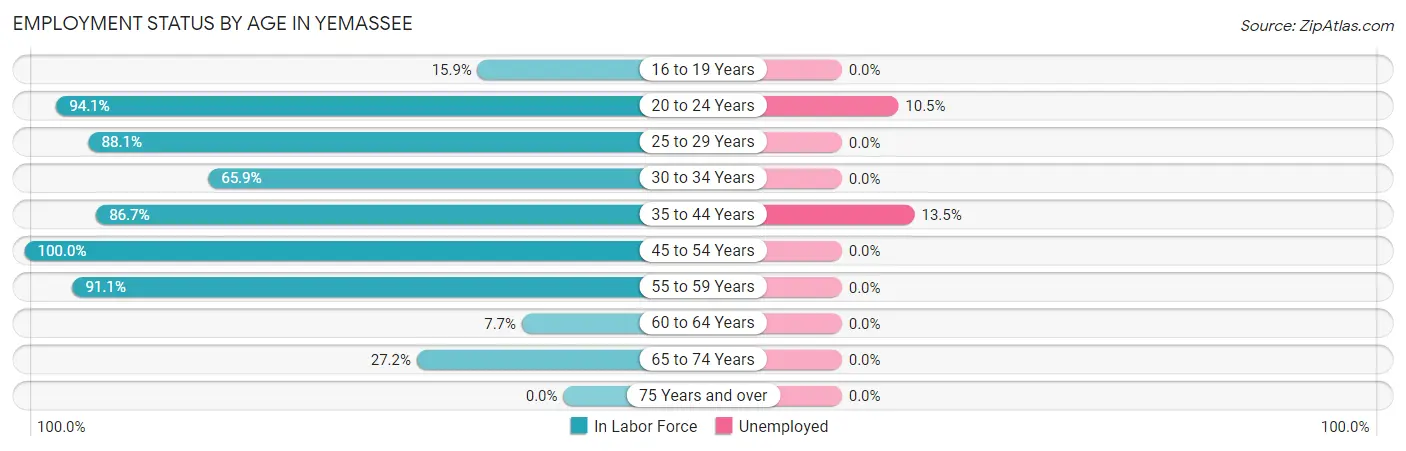
| Age Bracket | In Labor Force | Unemployed |
| 16 to 19 Years | 7 (15.9%) | 0 (0.0%) |
| 20 to 24 Years | 95 (94.1%) | 10 (10.5%) |
| 25 to 29 Years | 52 (88.1%) | 0 (0.0%) |
| 30 to 34 Years | 29 (65.9%) | 0 (0.0%) |
| 35 to 44 Years | 111 (86.7%) | 15 (13.5%) |
| 45 to 54 Years | 61 (100.0%) | 0 (0.0%) |
| 55 to 59 Years | 72 (91.1%) | 0 (0.0%) |
| 60 to 64 Years | 3 (7.7%) | 0 (0.0%) |
| 65 to 74 Years | 31 (27.2%) | 0 (0.0%) |
| 75 Years and over | 0 (0.0%) | 0 (0.0%) |
| Total | 461 (62.8%) | 24 (5.2%) |
Employment Status by Educational Attainment in Yemassee
According to labor force statistics for Yemassee, 80.0% of individuals (328) out of the total population between 25 and 64 years of age (410) are in the labor force, with 4.6% or 15 of them being unemployed. The group with the highest labor force participation rate are those with the educational attainment of bachelor's degree or higher, with 100.0% or 70 individuals in the labor force. Within the labor force, individuals with less than high school education have the highest percentage of unemployment, with 71.4% or 15 of them being unemployed.
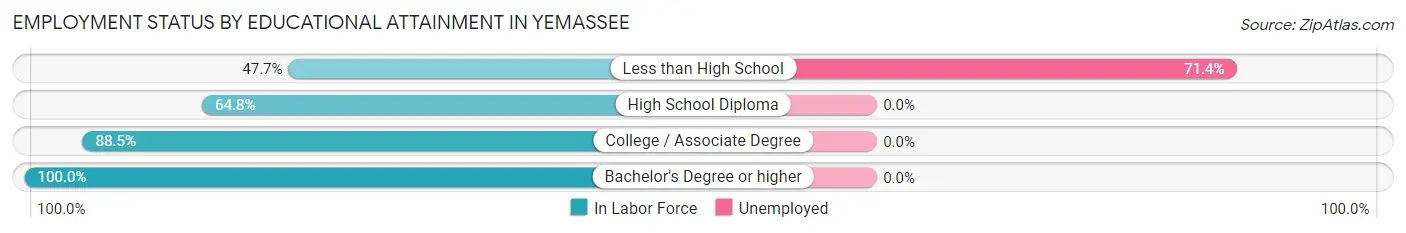
| Educational Attainment | In Labor Force | Unemployed |
| Less than High School | 21 (47.7%) | 31 (71.4%) |
| High School Diploma | 68 (64.8%) | 0 (0.0%) |
| College / Associate Degree | 169 (88.5%) | 0 (0.0%) |
| Bachelor's Degree or higher | 70 (100.0%) | 0 (0.0%) |
| Total | 328 (80.0%) | 19 (4.6%) |
Employment Occupations by Sex in Yemassee
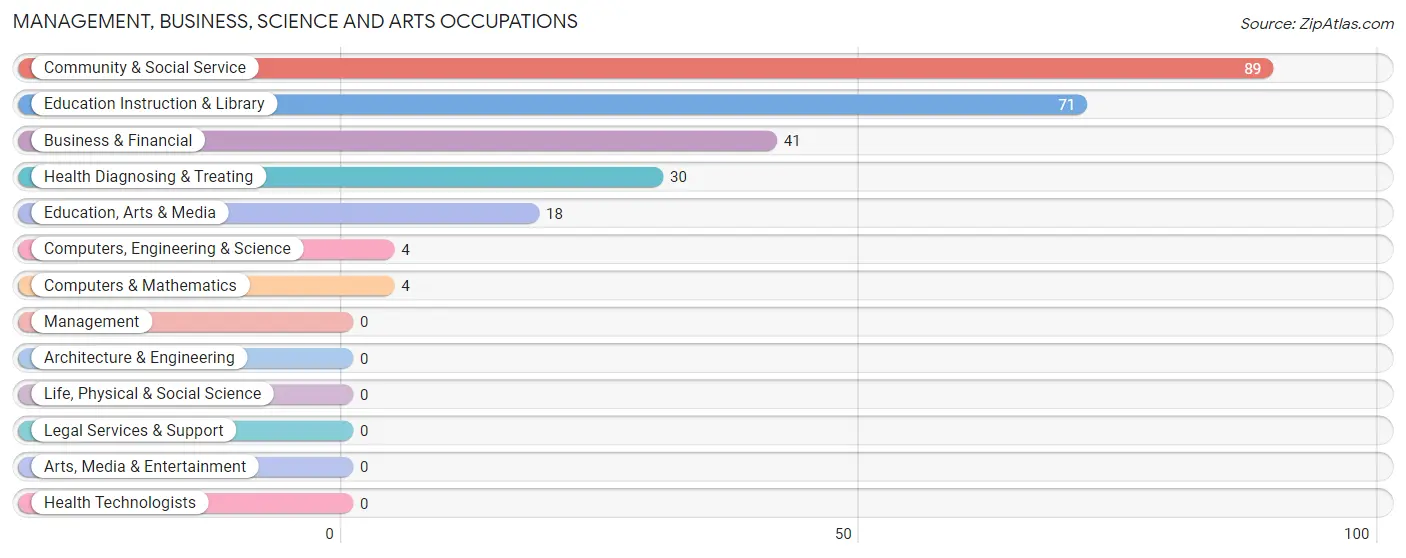
Management, Business, Science and Arts Occupations
The most common Management, Business, Science and Arts occupations in Yemassee are Community & Social Service (89 | 21.2%), Education Instruction & Library (71 | 17.0%), Business & Financial (41 | 9.8%), Health Diagnosing & Treating (30 | 7.2%), and Education, Arts & Media (18 | 4.3%).
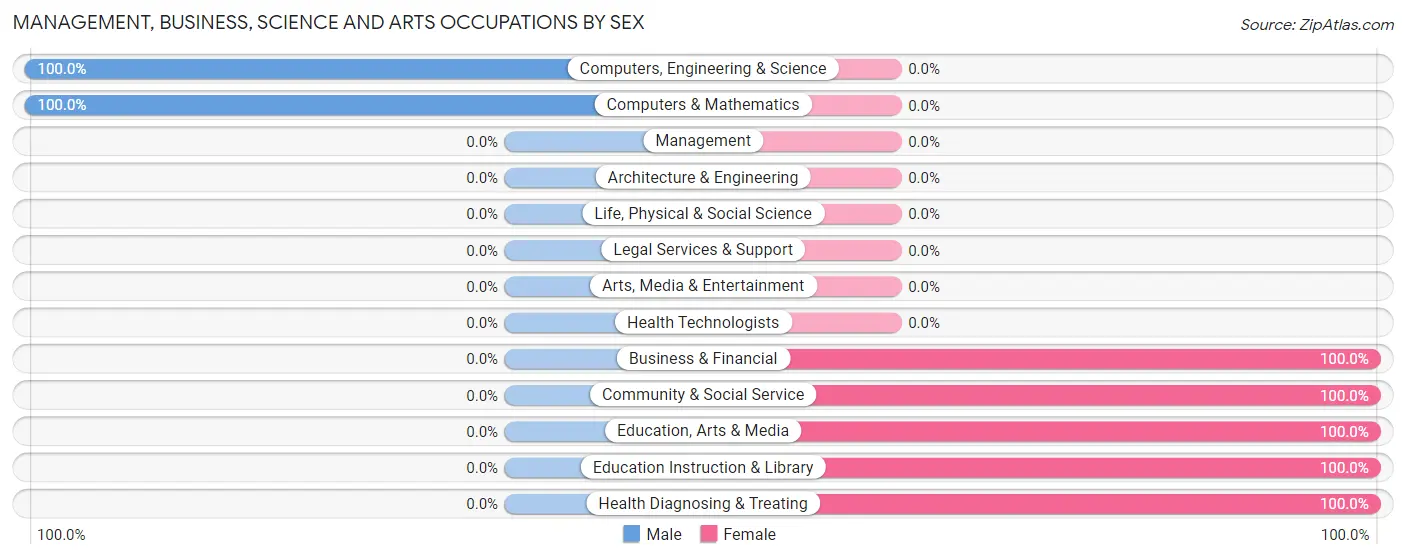
Management, Business, Science and Arts Occupations by Sex
Within the Management, Business, Science and Arts occupations in Yemassee, the most male-oriented occupations are Computers, Engineering & Science (100.0%), and Computers & Mathematics (100.0%), while the most female-oriented occupations are Business & Financial (100.0%), Community & Social Service (100.0%), and Education, Arts & Media (100.0%).
| Occupation | Male | Female |
| Management | 0 (0.0%) | 0 (0.0%) |
| Business & Financial | 0 (0.0%) | 41 (100.0%) |
| Computers, Engineering & Science | 4 (100.0%) | 0 (0.0%) |
| Computers & Mathematics | 4 (100.0%) | 0 (0.0%) |
| Architecture & Engineering | 0 (0.0%) | 0 (0.0%) |
| Life, Physical & Social Science | 0 (0.0%) | 0 (0.0%) |
| Community & Social Service | 0 (0.0%) | 89 (100.0%) |
| Education, Arts & Media | 0 (0.0%) | 18 (100.0%) |
| Legal Services & Support | 0 (0.0%) | 0 (0.0%) |
| Education Instruction & Library | 0 (0.0%) | 71 (100.0%) |
| Arts, Media & Entertainment | 0 (0.0%) | 0 (0.0%) |
| Health Diagnosing & Treating | 0 (0.0%) | 30 (100.0%) |
| Health Technologists | 0 (0.0%) | 0 (0.0%) |
| Total (Category) | 4 (2.4%) | 160 (97.6%) |
| Total (Overall) | 113 (27.0%) | 306 (73.0%) |
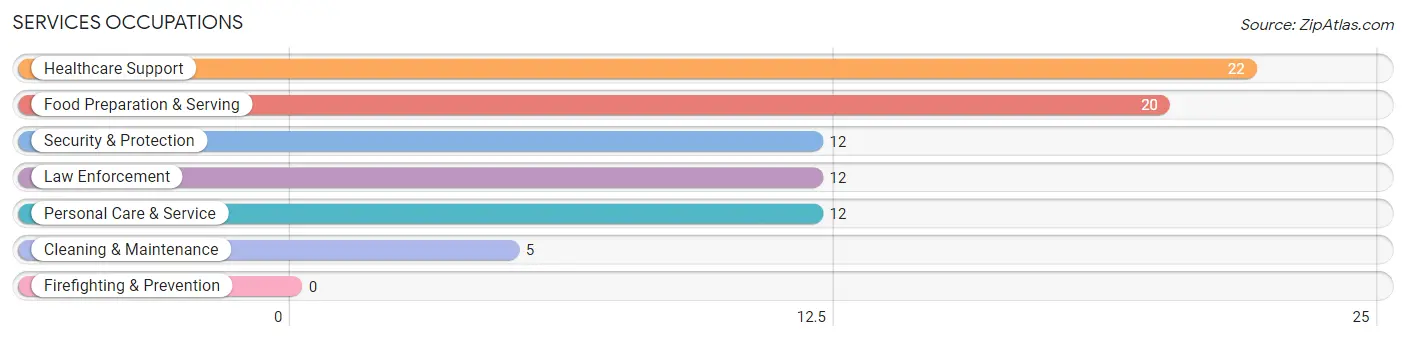
Services Occupations
The most common Services occupations in Yemassee are Healthcare Support (22 | 5.2%), Food Preparation & Serving (20 | 4.8%), Security & Protection (12 | 2.9%), Law Enforcement (12 | 2.9%), and Personal Care & Service (12 | 2.9%).
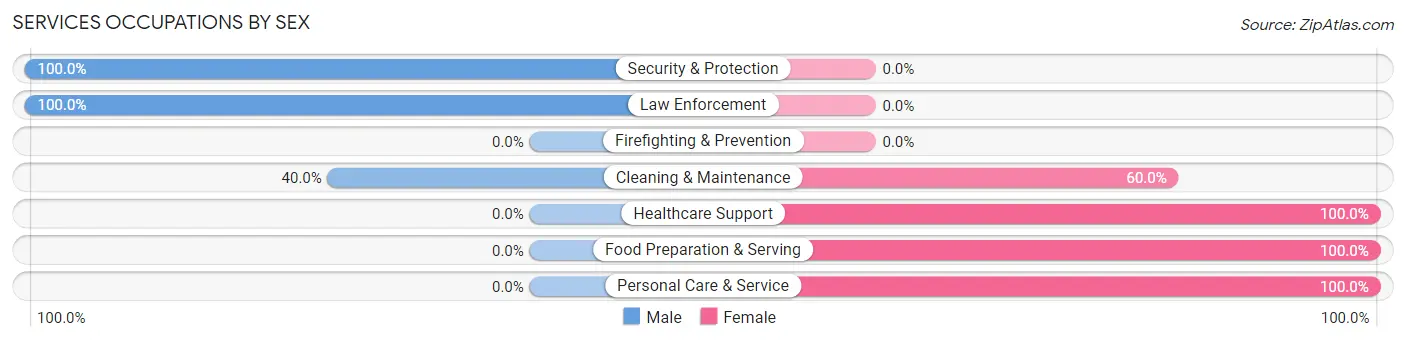
Services Occupations by Sex
Within the Services occupations in Yemassee, the most male-oriented occupations are Security & Protection (100.0%), Law Enforcement (100.0%), and Cleaning & Maintenance (40.0%), while the most female-oriented occupations are Healthcare Support (100.0%), Food Preparation & Serving (100.0%), and Personal Care & Service (100.0%).
| Occupation | Male | Female |
| Healthcare Support | 0 (0.0%) | 22 (100.0%) |
| Security & Protection | 12 (100.0%) | 0 (0.0%) |
| Firefighting & Prevention | 0 (0.0%) | 0 (0.0%) |
| Law Enforcement | 12 (100.0%) | 0 (0.0%) |
| Food Preparation & Serving | 0 (0.0%) | 20 (100.0%) |
| Cleaning & Maintenance | 2 (40.0%) | 3 (60.0%) |
| Personal Care & Service | 0 (0.0%) | 12 (100.0%) |
| Total (Category) | 14 (19.7%) | 57 (80.3%) |
| Total (Overall) | 113 (27.0%) | 306 (73.0%) |
Sales and Office Occupations
The most common Sales and Office occupations in Yemassee are Office & Administration (49 | 11.7%), and Sales & Related (19 | 4.5%).
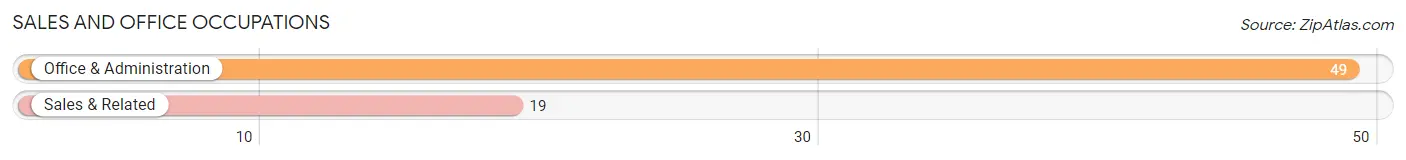
Sales and Office Occupations by Sex
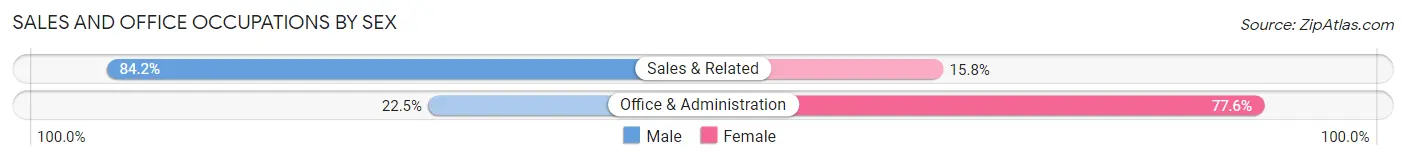
| Occupation | Male | Female |
| Sales & Related | 16 (84.2%) | 3 (15.8%) |
| Office & Administration | 11 (22.5%) | 38 (77.5%) |
| Total (Category) | 27 (39.7%) | 41 (60.3%) |
| Total (Overall) | 113 (27.0%) | 306 (73.0%) |
Natural Resources, Construction and Maintenance Occupations
The most common Natural Resources, Construction and Maintenance occupations in Yemassee are Construction & Extraction (23 | 5.5%), Farming, Fishing & Forestry (15 | 3.6%), and Installation, Maintenance & Repair (4 | 0.9%).
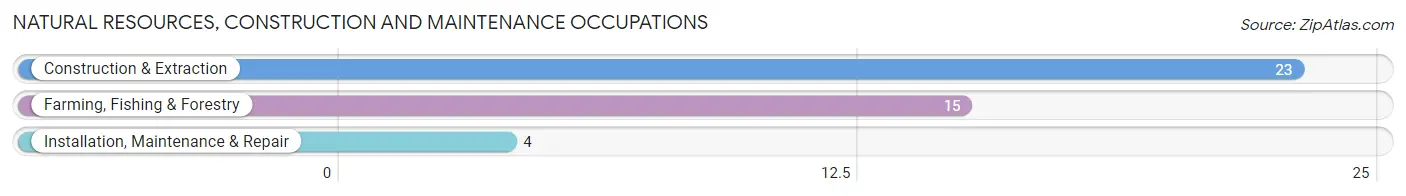
Natural Resources, Construction and Maintenance Occupations by Sex
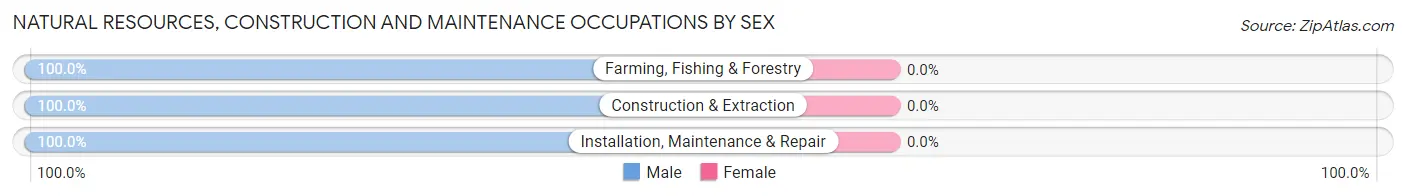
| Occupation | Male | Female |
| Farming, Fishing & Forestry | 15 (100.0%) | 0 (0.0%) |
| Construction & Extraction | 23 (100.0%) | 0 (0.0%) |
| Installation, Maintenance & Repair | 4 (100.0%) | 0 (0.0%) |
| Total (Category) | 42 (100.0%) | 0 (0.0%) |
| Total (Overall) | 113 (27.0%) | 306 (73.0%) |
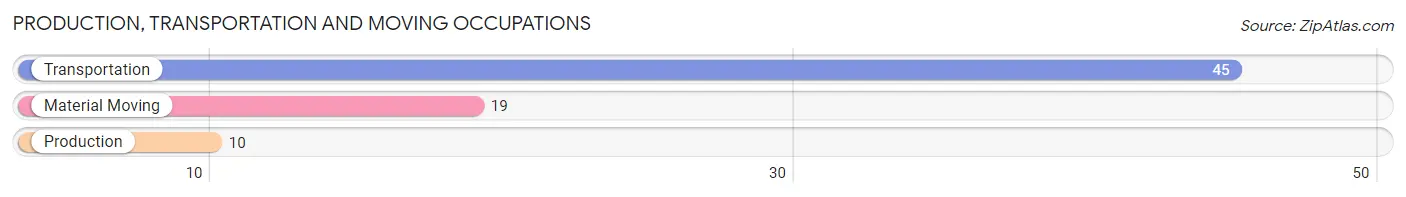
Production, Transportation and Moving Occupations
The most common Production, Transportation and Moving occupations in Yemassee are Transportation (45 | 10.7%), Material Moving (19 | 4.5%), and Production (10 | 2.4%).
Production, Transportation and Moving Occupations by Sex
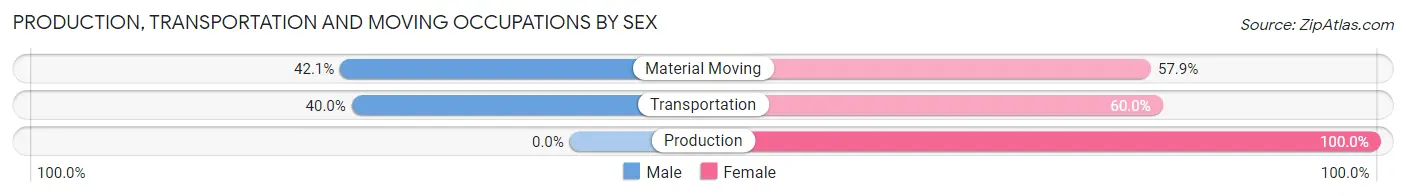
| Occupation | Male | Female |
| Production | 0 (0.0%) | 10 (100.0%) |
| Transportation | 18 (40.0%) | 27 (60.0%) |
| Material Moving | 8 (42.1%) | 11 (57.9%) |
| Total (Category) | 26 (35.1%) | 48 (64.9%) |
| Total (Overall) | 113 (27.0%) | 306 (73.0%) |
Employment Industries by Sex in Yemassee
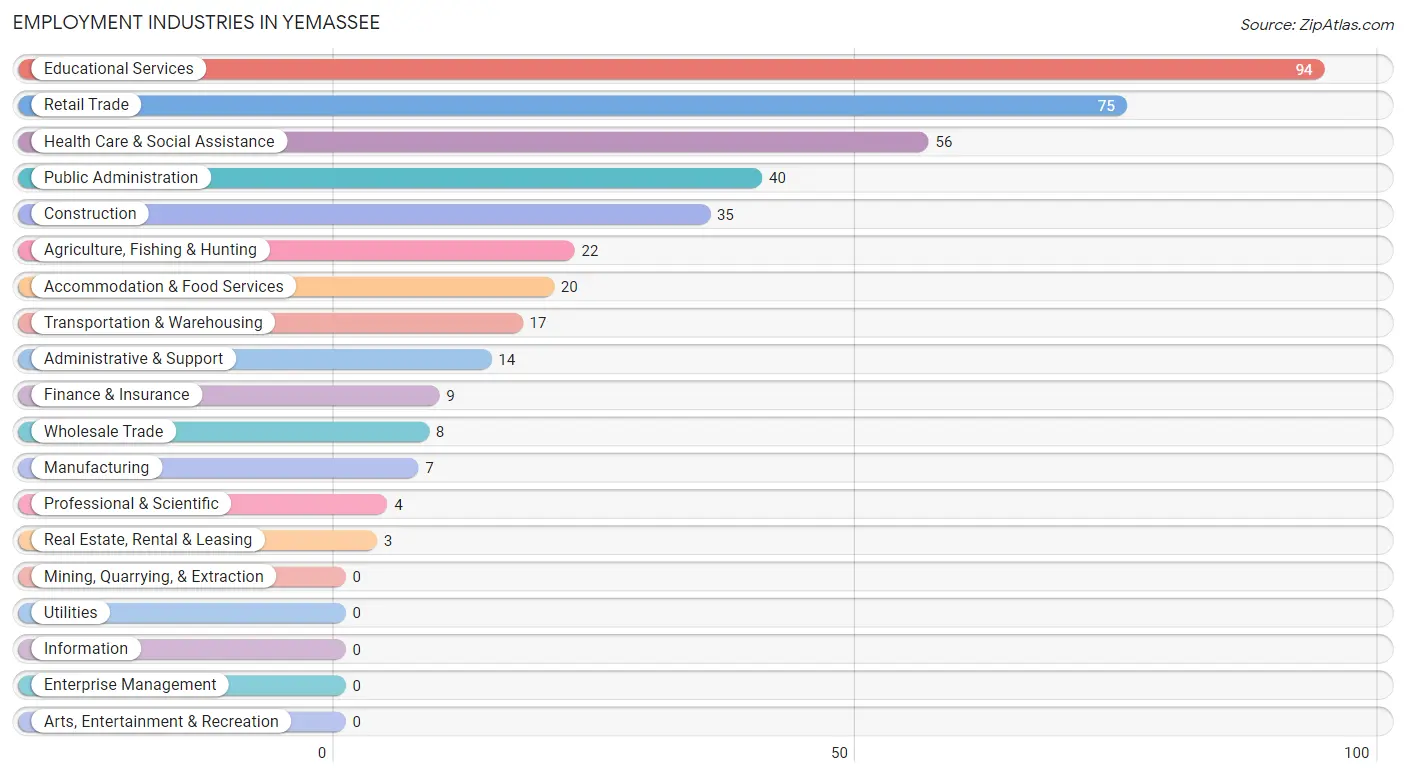
Employment Industries in Yemassee
The major employment industries in Yemassee include Educational Services (94 | 22.4%), Retail Trade (75 | 17.9%), Health Care & Social Assistance (56 | 13.4%), Public Administration (40 | 9.6%), and Construction (35 | 8.4%).
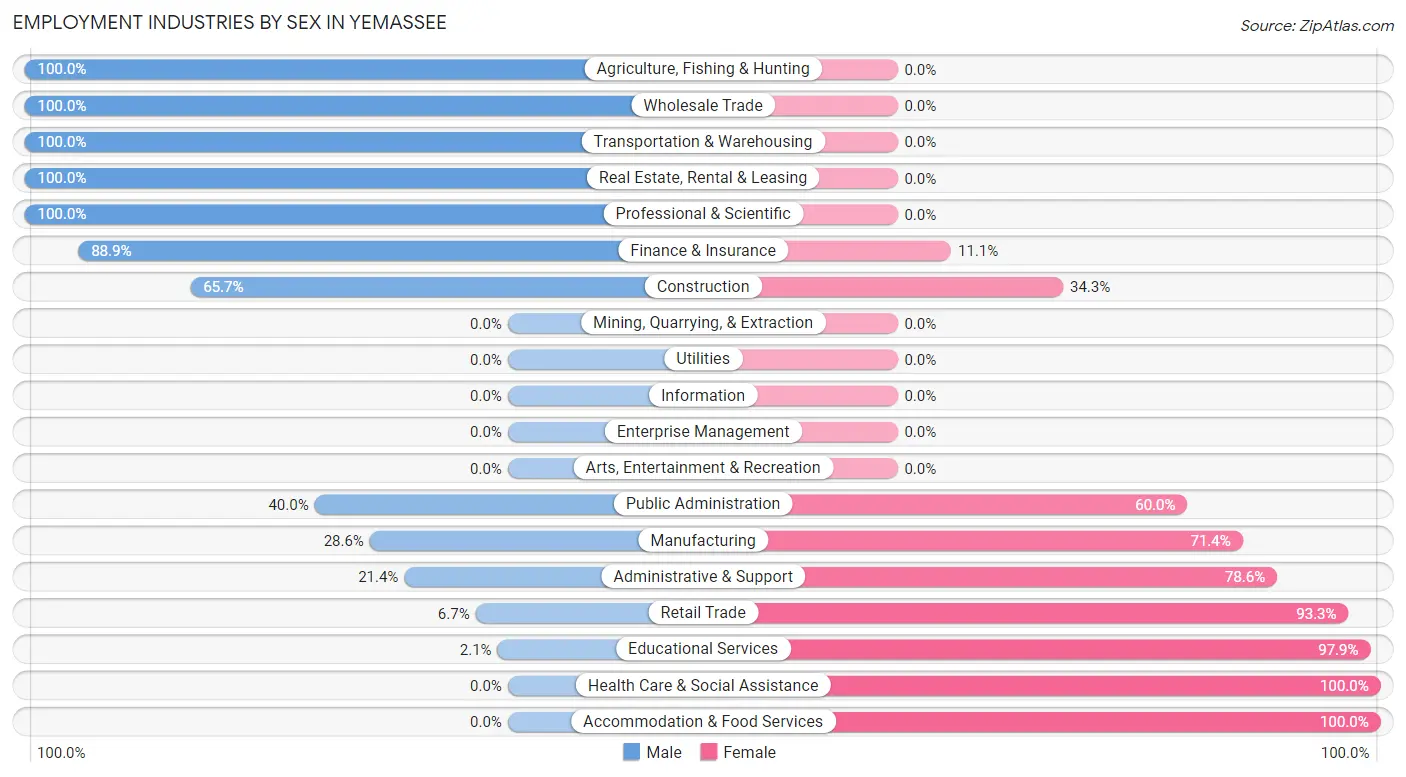
Employment Industries by Sex in Yemassee
The Yemassee industries that see more men than women are Agriculture, Fishing & Hunting (100.0%), Wholesale Trade (100.0%), and Transportation & Warehousing (100.0%), whereas the industries that tend to have a higher number of women are Health Care & Social Assistance (100.0%), Accommodation & Food Services (100.0%), and Educational Services (97.9%).
| Industry | Male | Female |
| Agriculture, Fishing & Hunting | 22 (100.0%) | 0 (0.0%) |
| Mining, Quarrying, & Extraction | 0 (0.0%) | 0 (0.0%) |
| Construction | 23 (65.7%) | 12 (34.3%) |
| Manufacturing | 2 (28.6%) | 5 (71.4%) |
| Wholesale Trade | 8 (100.0%) | 0 (0.0%) |
| Retail Trade | 5 (6.7%) | 70 (93.3%) |
| Transportation & Warehousing | 17 (100.0%) | 0 (0.0%) |
| Utilities | 0 (0.0%) | 0 (0.0%) |
| Information | 0 (0.0%) | 0 (0.0%) |
| Finance & Insurance | 8 (88.9%) | 1 (11.1%) |
| Real Estate, Rental & Leasing | 3 (100.0%) | 0 (0.0%) |
| Professional & Scientific | 4 (100.0%) | 0 (0.0%) |
| Enterprise Management | 0 (0.0%) | 0 (0.0%) |
| Administrative & Support | 3 (21.4%) | 11 (78.6%) |
| Educational Services | 2 (2.1%) | 92 (97.9%) |
| Health Care & Social Assistance | 0 (0.0%) | 56 (100.0%) |
| Arts, Entertainment & Recreation | 0 (0.0%) | 0 (0.0%) |
| Accommodation & Food Services | 0 (0.0%) | 20 (100.0%) |
| Public Administration | 16 (40.0%) | 24 (60.0%) |
| Total | 113 (27.0%) | 306 (73.0%) |
Education in Yemassee
School Enrollment in Yemassee
The most common levels of schooling among the 303 students in Yemassee are middle school (93 | 30.7%), high school (62 | 20.5%), and college / undergraduate (61 | 20.1%).
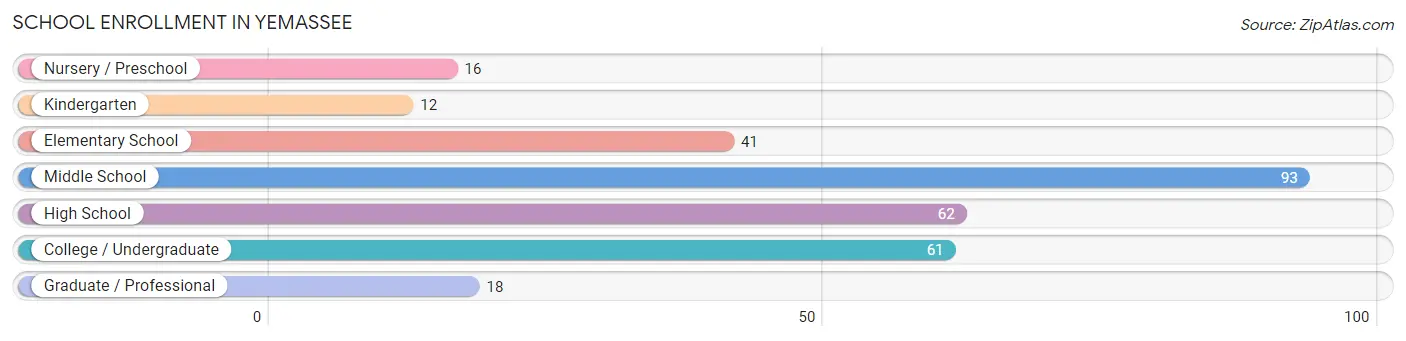
| School Level | # Students | % Students |
| Nursery / Preschool | 16 | 5.3% |
| Kindergarten | 12 | 4.0% |
| Elementary School | 41 | 13.5% |
| Middle School | 93 | 30.7% |
| High School | 62 | 20.5% |
| College / Undergraduate | 61 | 20.1% |
| Graduate / Professional | 18 | 5.9% |
| Total | 303 | 100.0% |
School Enrollment by Age by Funding Source in Yemassee
Out of a total of 303 students who are enrolled in schools in Yemassee, 35 (11.6%) attend a private institution, while the remaining 268 (88.4%) are enrolled in public schools. The age group of 35 years and over has the highest likelihood of being enrolled in private schools, with 23 (85.2% in the age bracket) enrolled. Conversely, the age group of 5 to 9 year old has the lowest likelihood of being enrolled in a private school, with 51 (100.0% in the age bracket) attending a public institution.
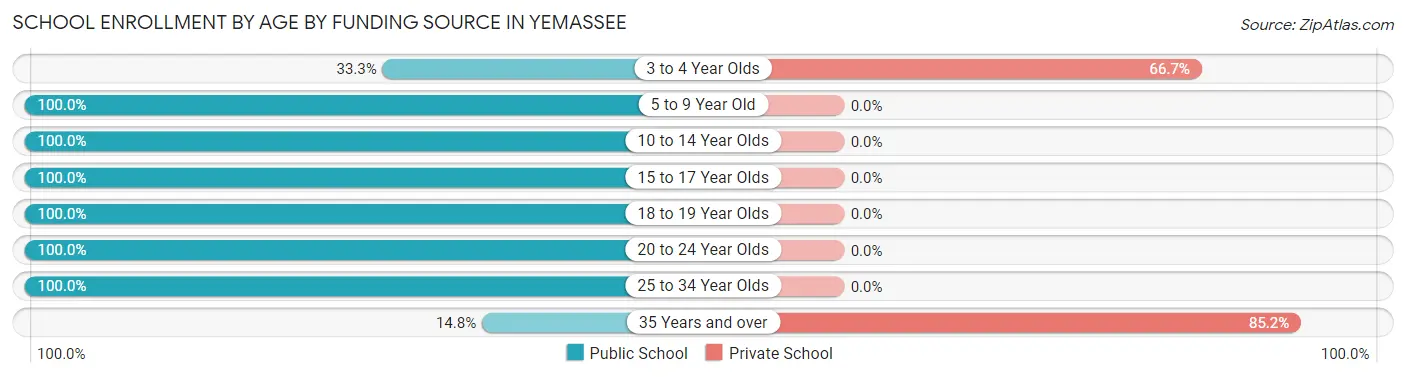
| Age Bracket | Public School | Private School |
| 3 to 4 Year Olds | 6 (33.3%) | 12 (66.7%) |
| 5 to 9 Year Old | 51 (100.0%) | 0 (0.0%) |
| 10 to 14 Year Olds | 97 (100.0%) | 0 (0.0%) |
| 15 to 17 Year Olds | 42 (100.0%) | 0 (0.0%) |
| 18 to 19 Year Olds | 16 (100.0%) | 0 (0.0%) |
| 20 to 24 Year Olds | 19 (100.0%) | 0 (0.0%) |
| 25 to 34 Year Olds | 33 (100.0%) | 0 (0.0%) |
| 35 Years and over | 4 (14.8%) | 23 (85.2%) |
| Total | 268 (88.4%) | 35 (11.6%) |
Educational Attainment by Field of Study in Yemassee
Business (27 | 31.0%), psychology (18 | 20.7%), arts & humanities (13 | 14.9%), science & technology (9 | 10.3%), and computers & mathematics (8 | 9.2%) are the most common fields of study among 87 individuals in Yemassee who have obtained a bachelor's degree or higher.
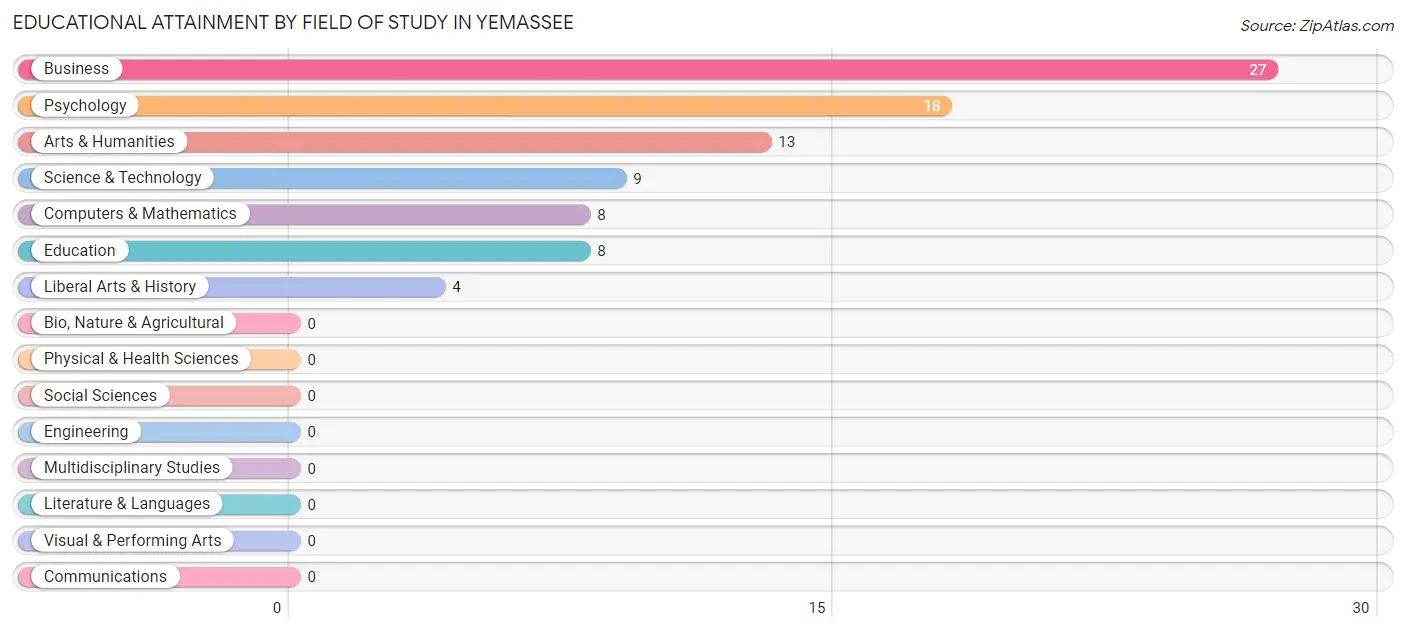
| Field of Study | # Graduates | % Graduates |
| Computers & Mathematics | 8 | 9.2% |
| Bio, Nature & Agricultural | 0 | 0.0% |
| Physical & Health Sciences | 0 | 0.0% |
| Psychology | 18 | 20.7% |
| Social Sciences | 0 | 0.0% |
| Engineering | 0 | 0.0% |
| Multidisciplinary Studies | 0 | 0.0% |
| Science & Technology | 9 | 10.3% |
| Business | 27 | 31.0% |
| Education | 8 | 9.2% |
| Literature & Languages | 0 | 0.0% |
| Liberal Arts & History | 4 | 4.6% |
| Visual & Performing Arts | 0 | 0.0% |
| Communications | 0 | 0.0% |
| Arts & Humanities | 13 | 14.9% |
| Total | 87 | 100.0% |
Transportation & Commute in Yemassee
Vehicle Availability by Sex in Yemassee
The most prevalent vehicle ownership categories in Yemassee are males with 2 vehicles (74, accounting for 60.2%) and females with 2 vehicles (129, making up 24.2%).
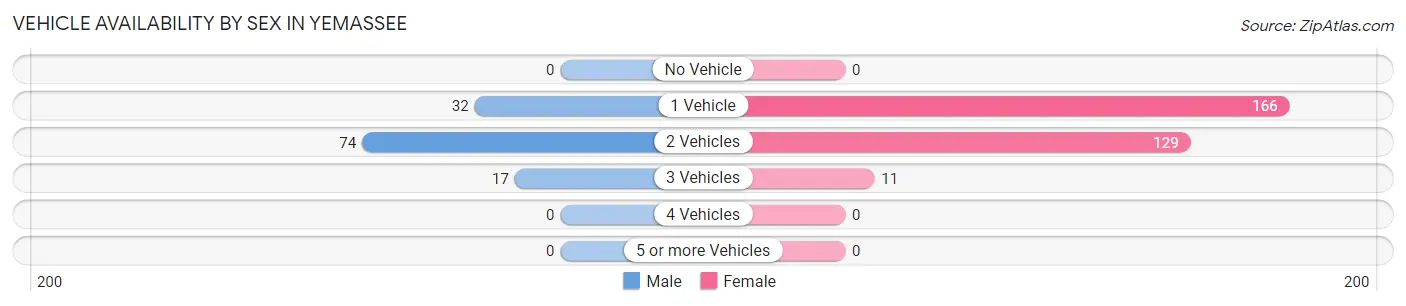
| Vehicles Available | Male | Female |
| No Vehicle | 0 (0.0%) | 0 (0.0%) |
| 1 Vehicle | 32 (26.0%) | 166 (54.2%) |
| 2 Vehicles | 74 (60.2%) | 129 (42.2%) |
| 3 Vehicles | 17 (13.8%) | 11 (3.6%) |
| 4 Vehicles | 0 (0.0%) | 0 (0.0%) |
| 5 or more Vehicles | 0 (0.0%) | 0 (0.0%) |
| Total | 123 (100.0%) | 306 (100.0%) |
Commute Time in Yemassee
The most frequently occuring commute durations in Yemassee are 30 to 34 minutes (173 commuters, 42.1%), 20 to 24 minutes (65 commuters, 15.8%), and 60 to 89 minutes (54 commuters, 13.1%).
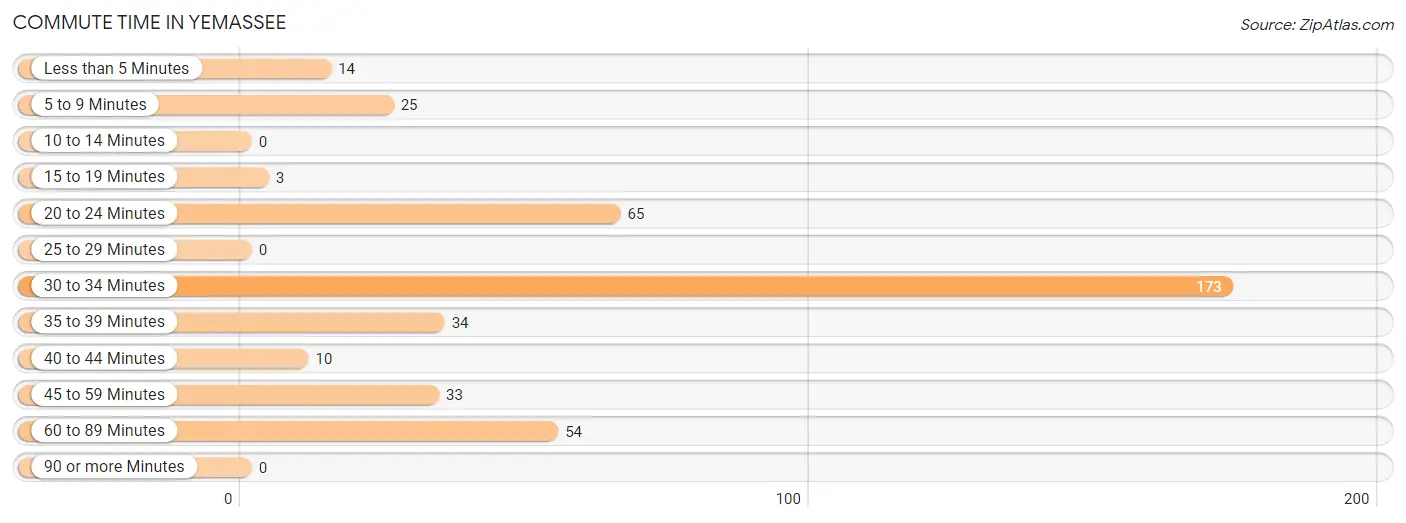
| Commute Time | # Commuters | % Commuters |
| Less than 5 Minutes | 14 | 3.4% |
| 5 to 9 Minutes | 25 | 6.1% |
| 10 to 14 Minutes | 0 | 0.0% |
| 15 to 19 Minutes | 3 | 0.7% |
| 20 to 24 Minutes | 65 | 15.8% |
| 25 to 29 Minutes | 0 | 0.0% |
| 30 to 34 Minutes | 173 | 42.1% |
| 35 to 39 Minutes | 34 | 8.3% |
| 40 to 44 Minutes | 10 | 2.4% |
| 45 to 59 Minutes | 33 | 8.0% |
| 60 to 89 Minutes | 54 | 13.1% |
| 90 or more Minutes | 0 | 0.0% |
Commute Time by Sex in Yemassee
The most common commute times in Yemassee are 30 to 34 minutes (50 commuters, 42.7%) for males and 30 to 34 minutes (123 commuters, 41.8%) for females.
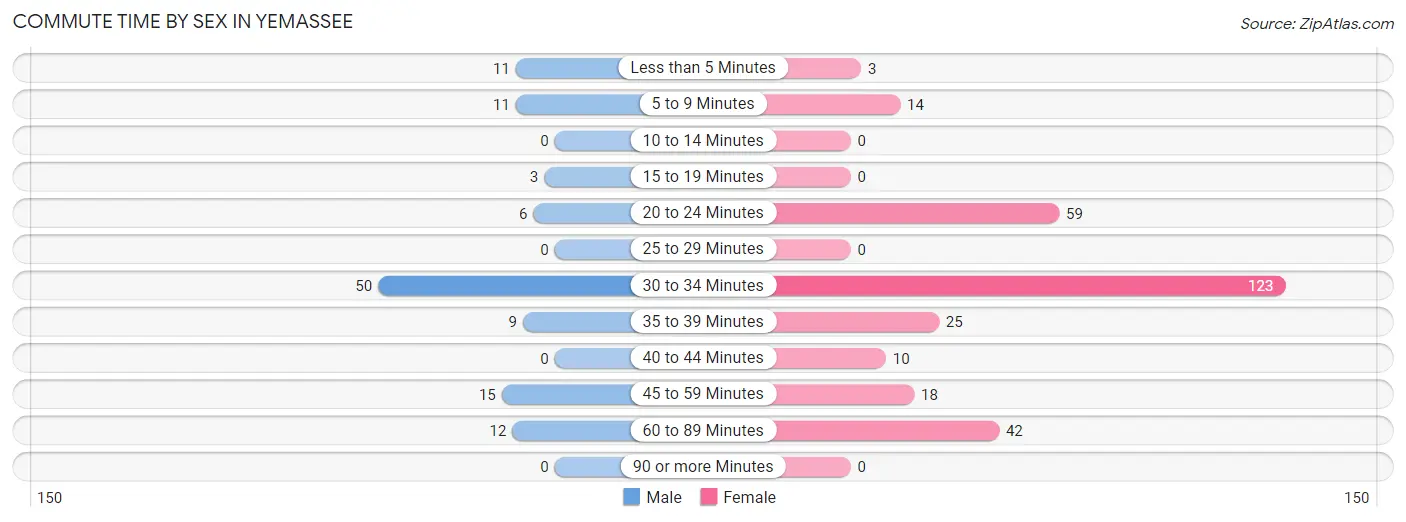
| Commute Time | Male | Female |
| Less than 5 Minutes | 11 (9.4%) | 3 (1.0%) |
| 5 to 9 Minutes | 11 (9.4%) | 14 (4.8%) |
| 10 to 14 Minutes | 0 (0.0%) | 0 (0.0%) |
| 15 to 19 Minutes | 3 (2.6%) | 0 (0.0%) |
| 20 to 24 Minutes | 6 (5.1%) | 59 (20.1%) |
| 25 to 29 Minutes | 0 (0.0%) | 0 (0.0%) |
| 30 to 34 Minutes | 50 (42.7%) | 123 (41.8%) |
| 35 to 39 Minutes | 9 (7.7%) | 25 (8.5%) |
| 40 to 44 Minutes | 0 (0.0%) | 10 (3.4%) |
| 45 to 59 Minutes | 15 (12.8%) | 18 (6.1%) |
| 60 to 89 Minutes | 12 (10.3%) | 42 (14.3%) |
| 90 or more Minutes | 0 (0.0%) | 0 (0.0%) |
Time of Departure to Work by Sex in Yemassee
The most frequent times of departure to work in Yemassee are 7:00 AM to 7:29 AM (30, 25.6%) for males and 7:30 AM to 7:59 AM (87, 29.6%) for females.
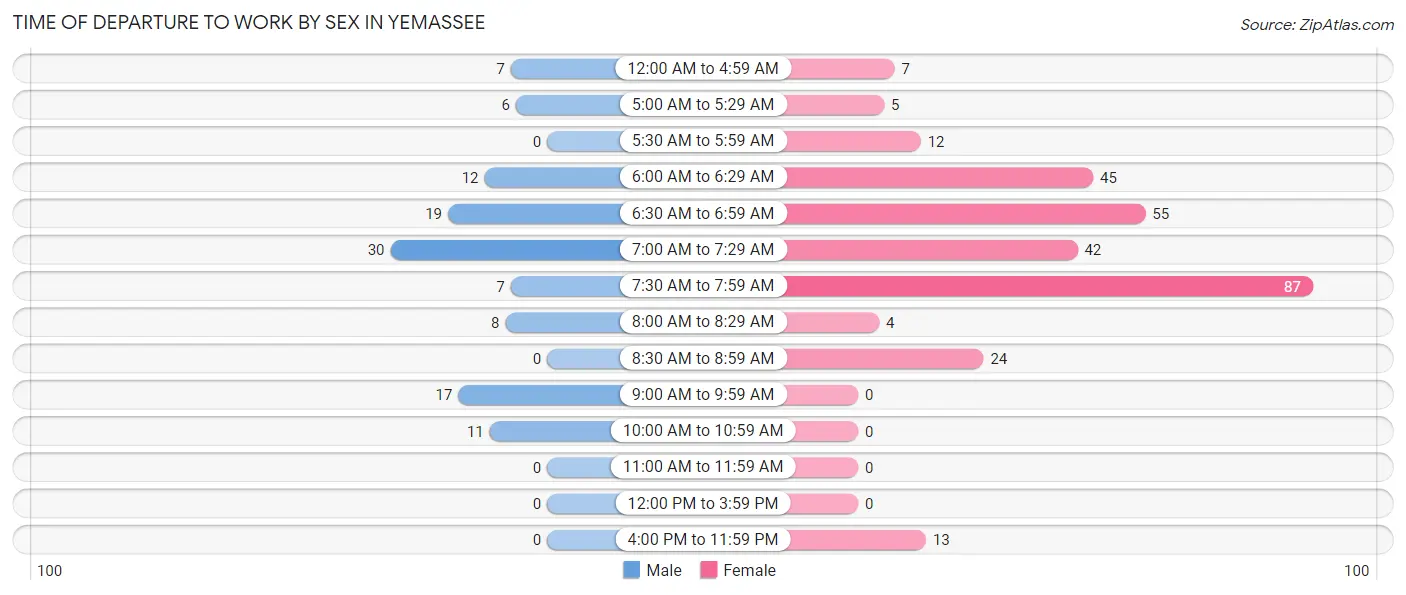
| Time of Departure | Male | Female |
| 12:00 AM to 4:59 AM | 7 (6.0%) | 7 (2.4%) |
| 5:00 AM to 5:29 AM | 6 (5.1%) | 5 (1.7%) |
| 5:30 AM to 5:59 AM | 0 (0.0%) | 12 (4.1%) |
| 6:00 AM to 6:29 AM | 12 (10.3%) | 45 (15.3%) |
| 6:30 AM to 6:59 AM | 19 (16.2%) | 55 (18.7%) |
| 7:00 AM to 7:29 AM | 30 (25.6%) | 42 (14.3%) |
| 7:30 AM to 7:59 AM | 7 (6.0%) | 87 (29.6%) |
| 8:00 AM to 8:29 AM | 8 (6.8%) | 4 (1.4%) |
| 8:30 AM to 8:59 AM | 0 (0.0%) | 24 (8.2%) |
| 9:00 AM to 9:59 AM | 17 (14.5%) | 0 (0.0%) |
| 10:00 AM to 10:59 AM | 11 (9.4%) | 0 (0.0%) |
| 11:00 AM to 11:59 AM | 0 (0.0%) | 0 (0.0%) |
| 12:00 PM to 3:59 PM | 0 (0.0%) | 0 (0.0%) |
| 4:00 PM to 11:59 PM | 0 (0.0%) | 13 (4.4%) |
| Total | 117 (100.0%) | 294 (100.0%) |
Housing Occupancy in Yemassee
Occupancy by Ownership in Yemassee
Of the total 432 dwellings in Yemassee, owner-occupied units account for 245 (56.7%), while renter-occupied units make up 187 (43.3%).
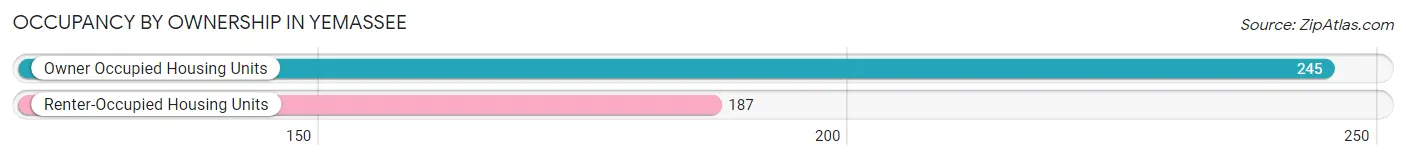
| Occupancy | # Housing Units | % Housing Units |
| Owner Occupied Housing Units | 245 | 56.7% |
| Renter-Occupied Housing Units | 187 | 43.3% |
| Total Occupied Housing Units | 432 | 100.0% |
Occupancy by Household Size in Yemassee
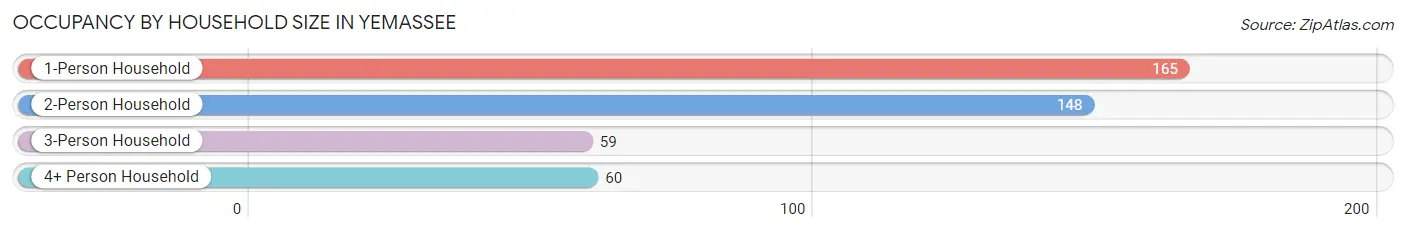
| Household Size | # Housing Units | % Housing Units |
| 1-Person Household | 165 | 38.2% |
| 2-Person Household | 148 | 34.3% |
| 3-Person Household | 59 | 13.7% |
| 4+ Person Household | 60 | 13.9% |
| Total Housing Units | 432 | 100.0% |
Occupancy by Ownership by Household Size in Yemassee
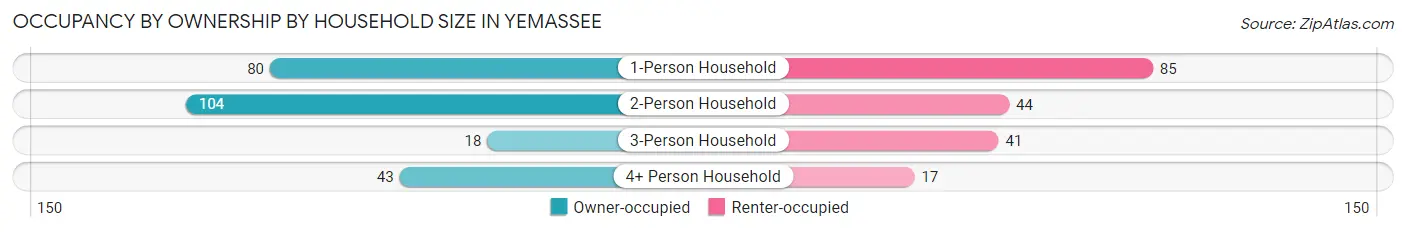
| Household Size | Owner-occupied | Renter-occupied |
| 1-Person Household | 80 (48.5%) | 85 (51.5%) |
| 2-Person Household | 104 (70.3%) | 44 (29.7%) |
| 3-Person Household | 18 (30.5%) | 41 (69.5%) |
| 4+ Person Household | 43 (71.7%) | 17 (28.3%) |
| Total Housing Units | 245 (56.7%) | 187 (43.3%) |
Occupancy by Educational Attainment in Yemassee
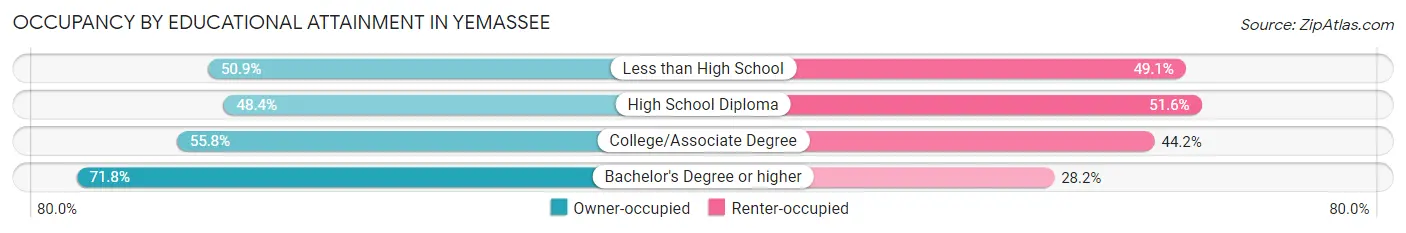
| Household Size | Owner-occupied | Renter-occupied |
| Less than High School | 28 (50.9%) | 27 (49.1%) |
| High School Diploma | 46 (48.4%) | 49 (51.6%) |
| College/Associate Degree | 110 (55.8%) | 87 (44.2%) |
| Bachelor's Degree or higher | 61 (71.8%) | 24 (28.2%) |
Occupancy by Age of Householder in Yemassee
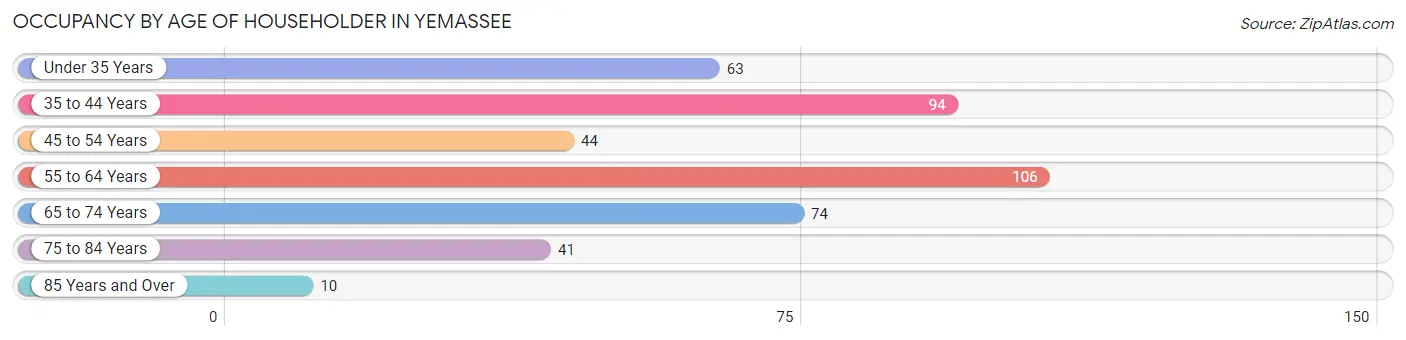
| Age Bracket | # Households | % Households |
| Under 35 Years | 63 | 14.6% |
| 35 to 44 Years | 94 | 21.8% |
| 45 to 54 Years | 44 | 10.2% |
| 55 to 64 Years | 106 | 24.5% |
| 65 to 74 Years | 74 | 17.1% |
| 75 to 84 Years | 41 | 9.5% |
| 85 Years and Over | 10 | 2.3% |
| Total | 432 | 100.0% |
Housing Finances in Yemassee
Median Income by Occupancy in Yemassee
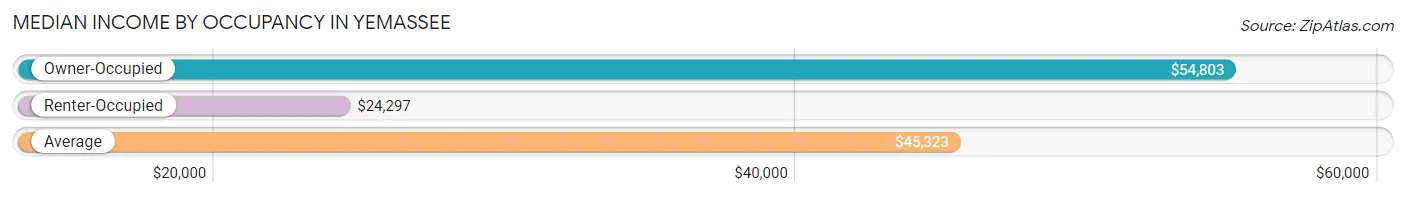
| Occupancy Type | # Households | Median Income |
| Owner-Occupied | 245 (56.7%) | $54,803 |
| Renter-Occupied | 187 (43.3%) | $24,297 |
| Average | 432 (100.0%) | $45,323 |
Occupancy by Householder Income Bracket in Yemassee
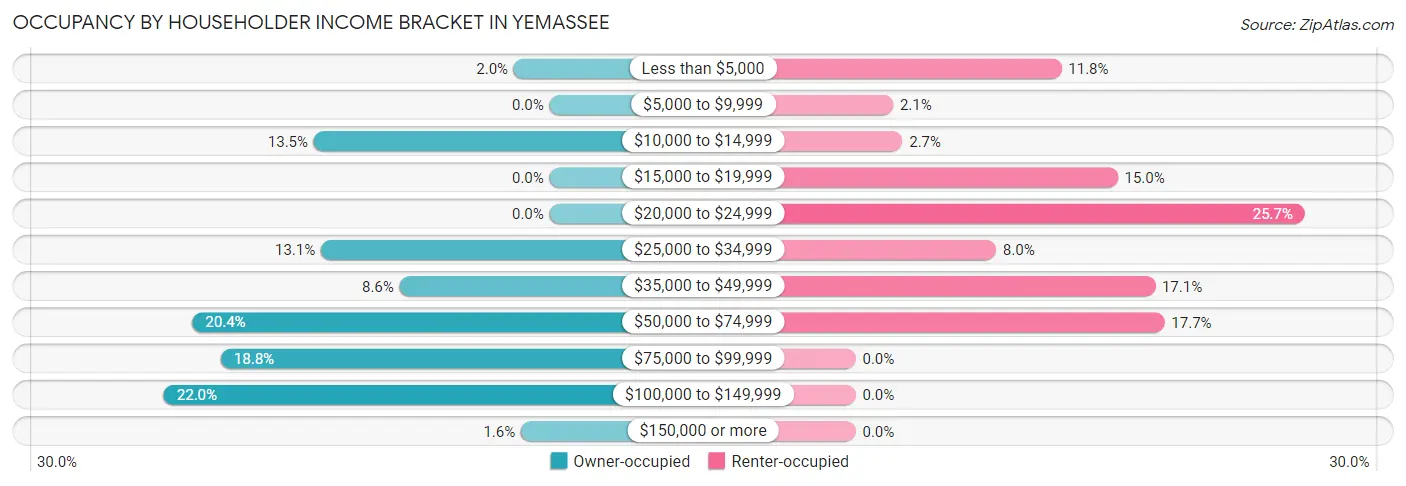
| Income Bracket | Owner-occupied | Renter-occupied |
| Less than $5,000 | 5 (2.0%) | 22 (11.8%) |
| $5,000 to $9,999 | 0 (0.0%) | 4 (2.1%) |
| $10,000 to $14,999 | 33 (13.5%) | 5 (2.7%) |
| $15,000 to $19,999 | 0 (0.0%) | 28 (15.0%) |
| $20,000 to $24,999 | 0 (0.0%) | 48 (25.7%) |
| $25,000 to $34,999 | 32 (13.1%) | 15 (8.0%) |
| $35,000 to $49,999 | 21 (8.6%) | 32 (17.1%) |
| $50,000 to $74,999 | 50 (20.4%) | 33 (17.6%) |
| $75,000 to $99,999 | 46 (18.8%) | 0 (0.0%) |
| $100,000 to $149,999 | 54 (22.0%) | 0 (0.0%) |
| $150,000 or more | 4 (1.6%) | 0 (0.0%) |
| Total | 245 (100.0%) | 187 (100.0%) |
Monthly Housing Cost Tiers in Yemassee
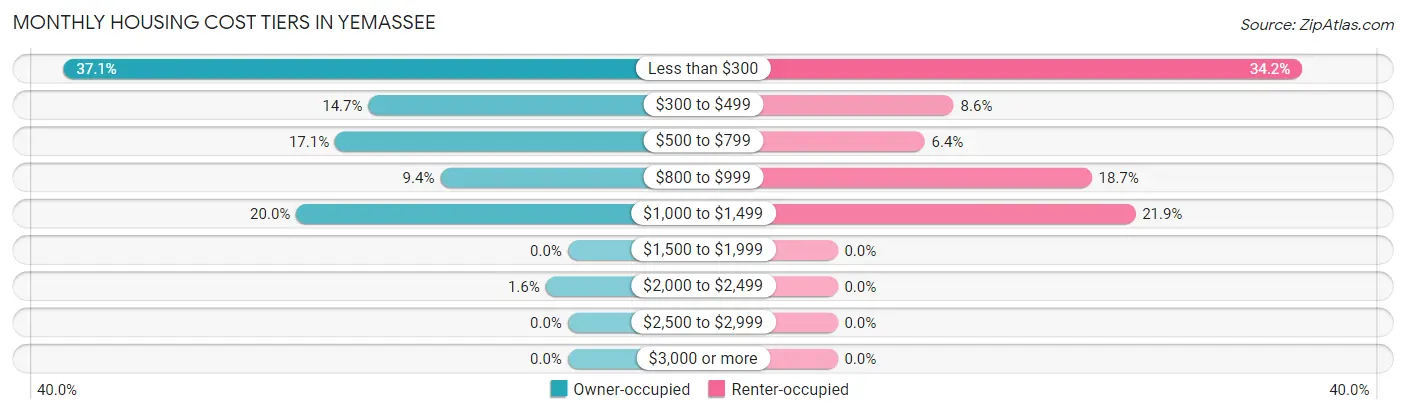
| Monthly Cost | Owner-occupied | Renter-occupied |
| Less than $300 | 91 (37.1%) | 64 (34.2%) |
| $300 to $499 | 36 (14.7%) | 16 (8.6%) |
| $500 to $799 | 42 (17.1%) | 12 (6.4%) |
| $800 to $999 | 23 (9.4%) | 35 (18.7%) |
| $1,000 to $1,499 | 49 (20.0%) | 41 (21.9%) |
| $1,500 to $1,999 | 0 (0.0%) | 0 (0.0%) |
| $2,000 to $2,499 | 4 (1.6%) | 0 (0.0%) |
| $2,500 to $2,999 | 0 (0.0%) | 0 (0.0%) |
| $3,000 or more | 0 (0.0%) | 0 (0.0%) |
| Total | 245 (100.0%) | 187 (100.0%) |
Physical Housing Characteristics in Yemassee
Housing Structures in Yemassee
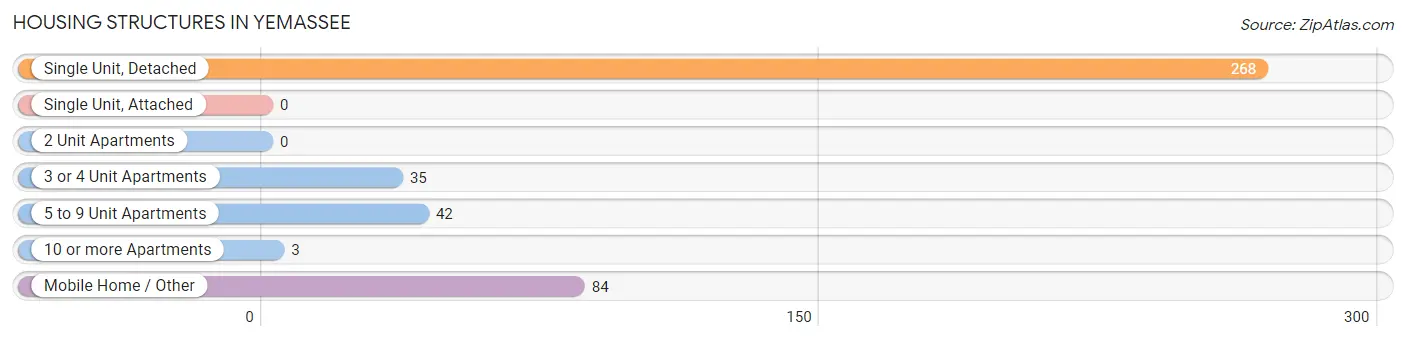
| Structure Type | # Housing Units | % Housing Units |
| Single Unit, Detached | 268 | 62.0% |
| Single Unit, Attached | 0 | 0.0% |
| 2 Unit Apartments | 0 | 0.0% |
| 3 or 4 Unit Apartments | 35 | 8.1% |
| 5 to 9 Unit Apartments | 42 | 9.7% |
| 10 or more Apartments | 3 | 0.7% |
| Mobile Home / Other | 84 | 19.4% |
| Total | 432 | 100.0% |
Housing Structures by Occupancy in Yemassee
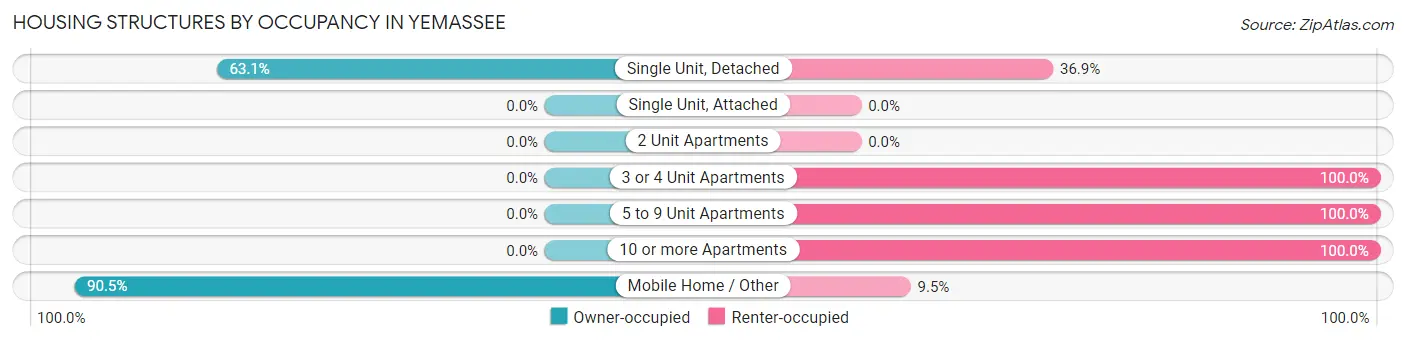
| Structure Type | Owner-occupied | Renter-occupied |
| Single Unit, Detached | 169 (63.1%) | 99 (36.9%) |
| Single Unit, Attached | 0 (0.0%) | 0 (0.0%) |
| 2 Unit Apartments | 0 (0.0%) | 0 (0.0%) |
| 3 or 4 Unit Apartments | 0 (0.0%) | 35 (100.0%) |
| 5 to 9 Unit Apartments | 0 (0.0%) | 42 (100.0%) |
| 10 or more Apartments | 0 (0.0%) | 3 (100.0%) |
| Mobile Home / Other | 76 (90.5%) | 8 (9.5%) |
| Total | 245 (56.7%) | 187 (43.3%) |
Housing Structures by Number of Rooms in Yemassee
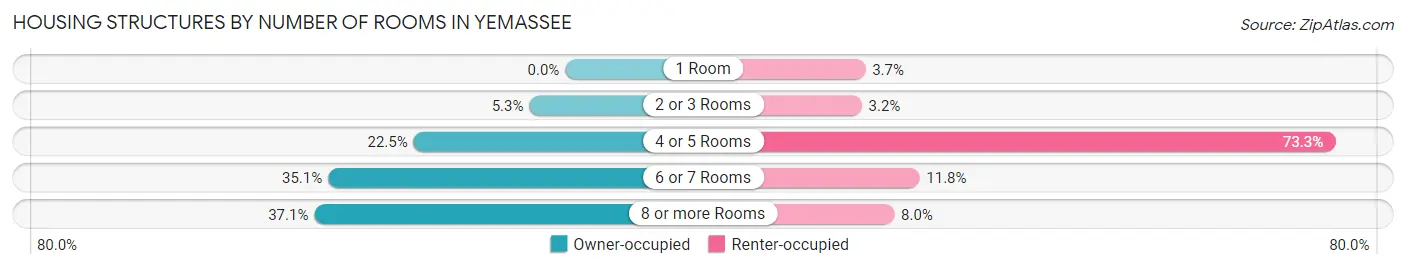
| Number of Rooms | Owner-occupied | Renter-occupied |
| 1 Room | 0 (0.0%) | 7 (3.7%) |
| 2 or 3 Rooms | 13 (5.3%) | 6 (3.2%) |
| 4 or 5 Rooms | 55 (22.5%) | 137 (73.3%) |
| 6 or 7 Rooms | 86 (35.1%) | 22 (11.8%) |
| 8 or more Rooms | 91 (37.1%) | 15 (8.0%) |
| Total | 245 (100.0%) | 187 (100.0%) |
Housing Structure by Heating Type in Yemassee
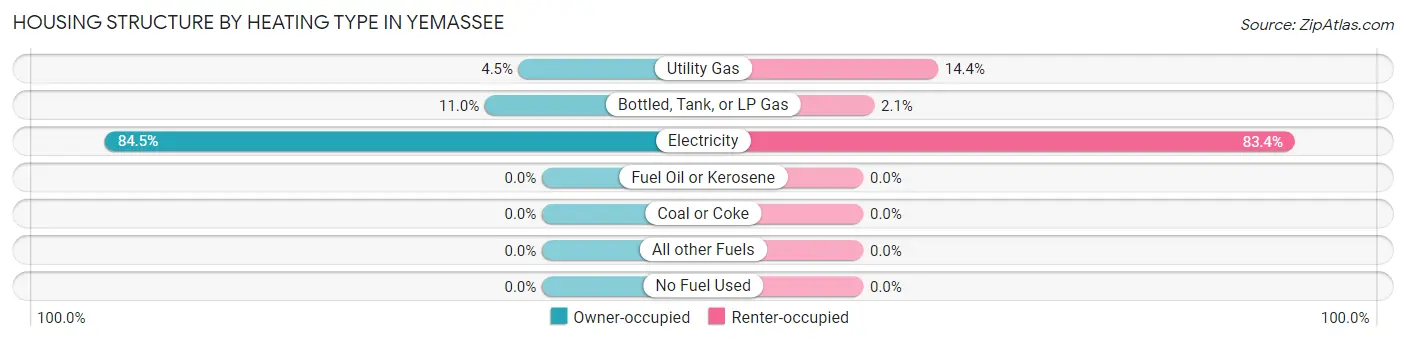
| Heating Type | Owner-occupied | Renter-occupied |
| Utility Gas | 11 (4.5%) | 27 (14.4%) |
| Bottled, Tank, or LP Gas | 27 (11.0%) | 4 (2.1%) |
| Electricity | 207 (84.5%) | 156 (83.4%) |
| Fuel Oil or Kerosene | 0 (0.0%) | 0 (0.0%) |
| Coal or Coke | 0 (0.0%) | 0 (0.0%) |
| All other Fuels | 0 (0.0%) | 0 (0.0%) |
| No Fuel Used | 0 (0.0%) | 0 (0.0%) |
| Total | 245 (100.0%) | 187 (100.0%) |
Household Vehicle Usage in Yemassee
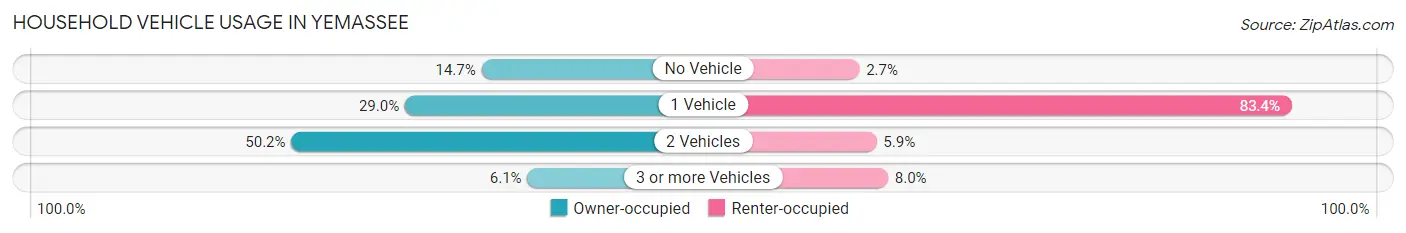
| Vehicles per Household | Owner-occupied | Renter-occupied |
| No Vehicle | 36 (14.7%) | 5 (2.7%) |
| 1 Vehicle | 71 (29.0%) | 156 (83.4%) |
| 2 Vehicles | 123 (50.2%) | 11 (5.9%) |
| 3 or more Vehicles | 15 (6.1%) | 15 (8.0%) |
| Total | 245 (100.0%) | 187 (100.0%) |
Real Estate & Mortgages in Yemassee
Real Estate and Mortgage Overview in Yemassee
| Characteristic | Without Mortgage | With Mortgage |
| Housing Units | 190 | 55 |
| Median Property Value | $82,900 | $183,700 |
| Median Household Income | $50,714 | $0 |
| Monthly Housing Costs | $325 | $0 |
| Real Estate Taxes | $535 | $0 |
Property Value by Mortgage Status in Yemassee
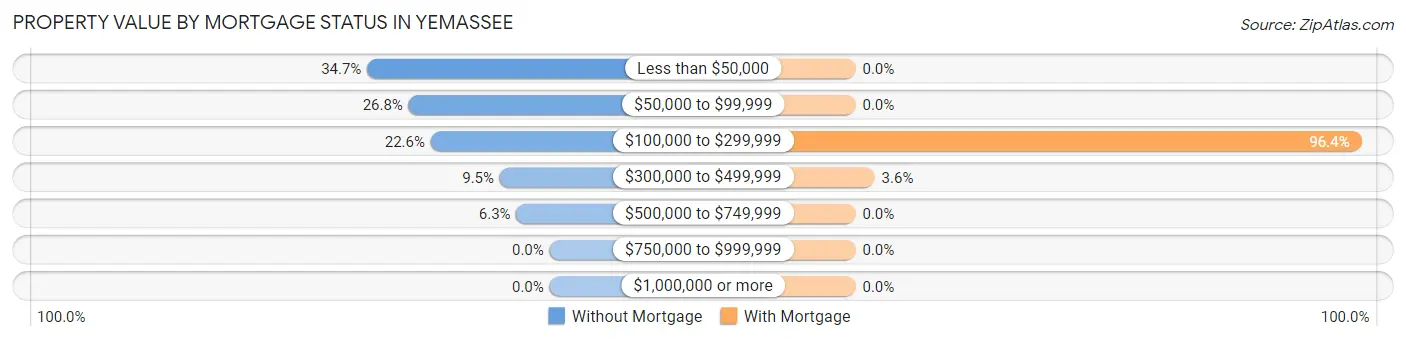
| Property Value | Without Mortgage | With Mortgage |
| Less than $50,000 | 66 (34.7%) | 0 (0.0%) |
| $50,000 to $99,999 | 51 (26.8%) | 0 (0.0%) |
| $100,000 to $299,999 | 43 (22.6%) | 53 (96.4%) |
| $300,000 to $499,999 | 18 (9.5%) | 2 (3.6%) |
| $500,000 to $749,999 | 12 (6.3%) | 0 (0.0%) |
| $750,000 to $999,999 | 0 (0.0%) | 0 (0.0%) |
| $1,000,000 or more | 0 (0.0%) | 0 (0.0%) |
| Total | 190 (100.0%) | 55 (100.0%) |
Household Income by Mortgage Status in Yemassee
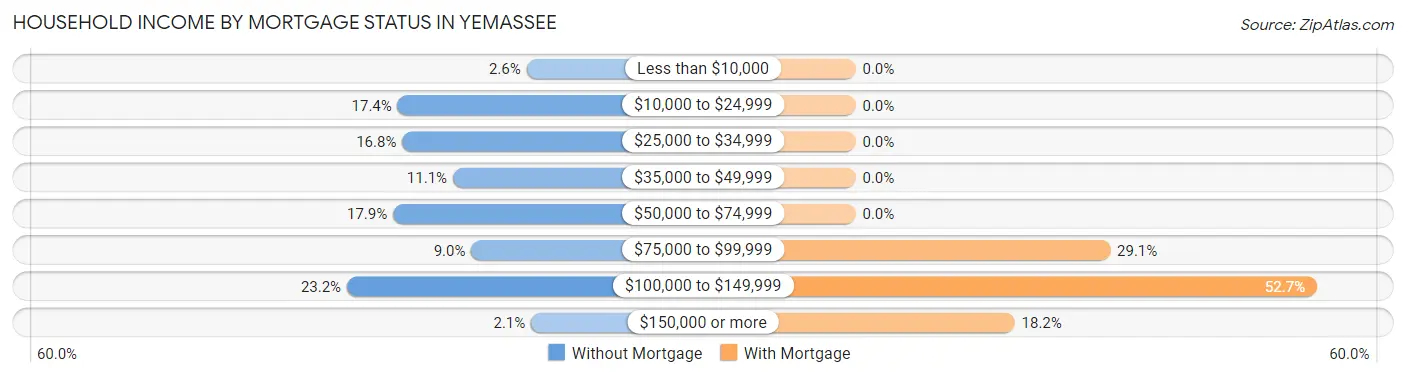
| Household Income | Without Mortgage | With Mortgage |
| Less than $10,000 | 5 (2.6%) | 0 (0.0%) |
| $10,000 to $24,999 | 33 (17.4%) | 0 (0.0%) |
| $25,000 to $34,999 | 32 (16.8%) | 0 (0.0%) |
| $35,000 to $49,999 | 21 (11.1%) | 0 (0.0%) |
| $50,000 to $74,999 | 34 (17.9%) | 0 (0.0%) |
| $75,000 to $99,999 | 17 (8.9%) | 16 (29.1%) |
| $100,000 to $149,999 | 44 (23.2%) | 29 (52.7%) |
| $150,000 or more | 4 (2.1%) | 10 (18.2%) |
| Total | 190 (100.0%) | 55 (100.0%) |
Property Value to Household Income Ratio in Yemassee
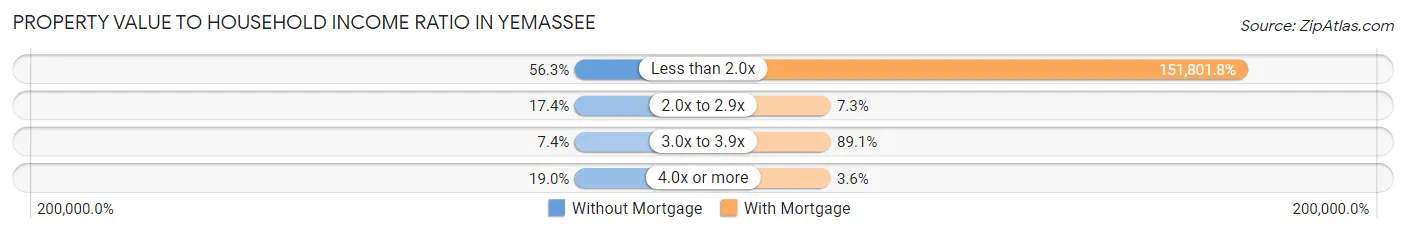
| Value-to-Income Ratio | Without Mortgage | With Mortgage |
| Less than 2.0x | 107 (56.3%) | 83,491 (151,801.8%) |
| 2.0x to 2.9x | 33 (17.4%) | 4 (7.3%) |
| 3.0x to 3.9x | 14 (7.4%) | 49 (89.1%) |
| 4.0x or more | 36 (19.0%) | 2 (3.6%) |
| Total | 190 (100.0%) | 55 (100.0%) |
Real Estate Taxes by Mortgage Status in Yemassee
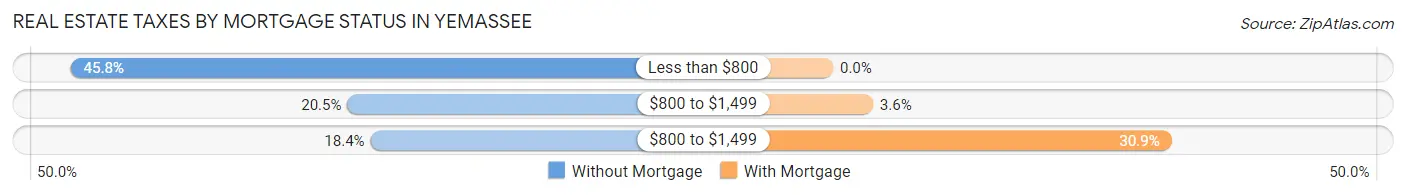
| Property Taxes | Without Mortgage | With Mortgage |
| Less than $800 | 87 (45.8%) | 0 (0.0%) |
| $800 to $1,499 | 39 (20.5%) | 2 (3.6%) |
| $800 to $1,499 | 35 (18.4%) | 17 (30.9%) |
| Total | 190 (100.0%) | 55 (100.0%) |
Health & Disability in Yemassee
Health Insurance Coverage by Age in Yemassee
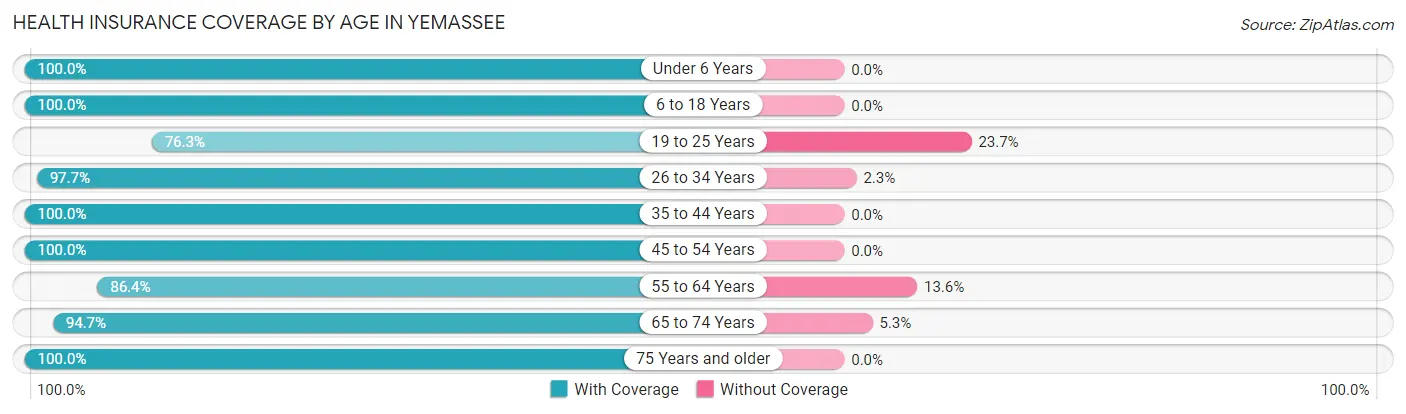
| Age Bracket | With Coverage | Without Coverage |
| Under 6 Years | 88 (100.0%) | 0 (0.0%) |
| 6 to 18 Years | 196 (100.0%) | 0 (0.0%) |
| 19 to 25 Years | 74 (76.3%) | 23 (23.7%) |
| 26 to 34 Years | 86 (97.7%) | 2 (2.3%) |
| 35 to 44 Years | 128 (100.0%) | 0 (0.0%) |
| 45 to 54 Years | 61 (100.0%) | 0 (0.0%) |
| 55 to 64 Years | 102 (86.4%) | 16 (13.6%) |
| 65 to 74 Years | 108 (94.7%) | 6 (5.3%) |
| 75 Years and older | 65 (100.0%) | 0 (0.0%) |
| Total | 908 (95.1%) | 47 (4.9%) |
Health Insurance Coverage by Citizenship Status in Yemassee
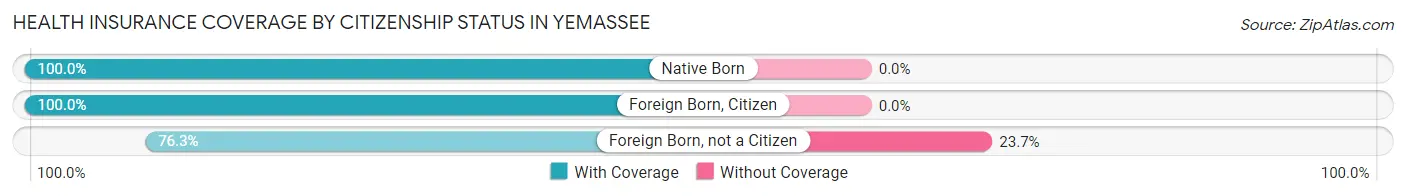
| Citizenship Status | With Coverage | Without Coverage |
| Native Born | 88 (100.0%) | 0 (0.0%) |
| Foreign Born, Citizen | 196 (100.0%) | 0 (0.0%) |
| Foreign Born, not a Citizen | 74 (76.3%) | 23 (23.7%) |
Health Insurance Coverage by Household Income in Yemassee
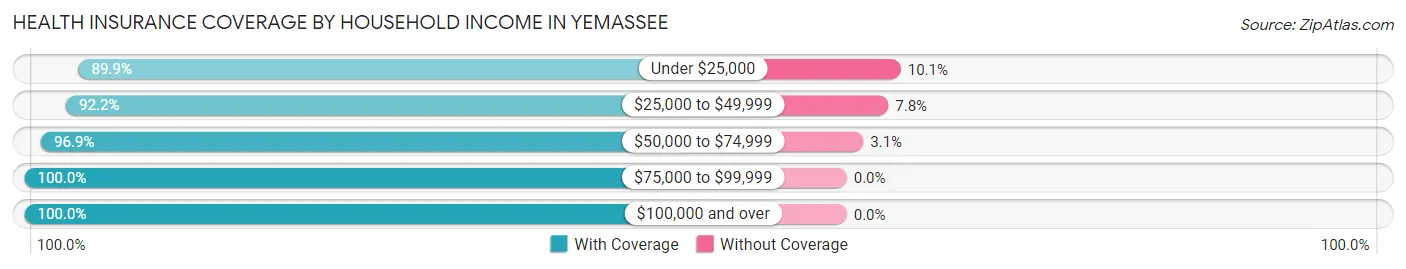
| Household Income | With Coverage | Without Coverage |
| Under $25,000 | 222 (89.9%) | 25 (10.1%) |
| $25,000 to $49,999 | 142 (92.2%) | 12 (7.8%) |
| $50,000 to $74,999 | 313 (96.9%) | 10 (3.1%) |
| $75,000 to $99,999 | 72 (100.0%) | 0 (0.0%) |
| $100,000 and over | 159 (100.0%) | 0 (0.0%) |
Public vs Private Health Insurance Coverage by Age in Yemassee
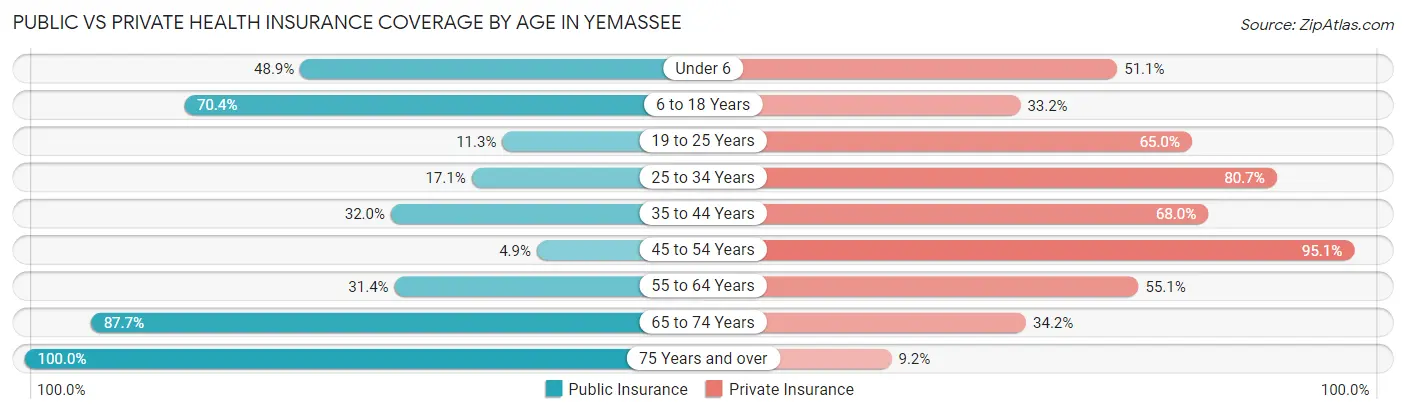
| Age Bracket | Public Insurance | Private Insurance |
| Under 6 | 43 (48.9%) | 45 (51.1%) |
| 6 to 18 Years | 138 (70.4%) | 65 (33.2%) |
| 19 to 25 Years | 11 (11.3%) | 63 (64.9%) |
| 25 to 34 Years | 15 (17.1%) | 71 (80.7%) |
| 35 to 44 Years | 41 (32.0%) | 87 (68.0%) |
| 45 to 54 Years | 3 (4.9%) | 58 (95.1%) |
| 55 to 64 Years | 37 (31.4%) | 65 (55.1%) |
| 65 to 74 Years | 100 (87.7%) | 39 (34.2%) |
| 75 Years and over | 65 (100.0%) | 6 (9.2%) |
| Total | 453 (47.4%) | 499 (52.2%) |
Disability Status by Sex by Age in Yemassee
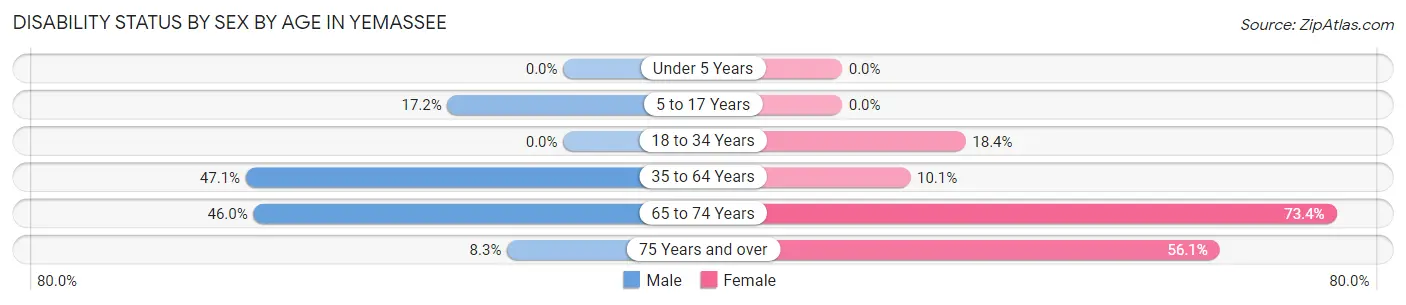
| Age Bracket | Male | Female |
| Under 5 Years | 0 (0.0%) | 0 (0.0%) |
| 5 to 17 Years | 11 (17.2%) | 0 (0.0%) |
| 18 to 34 Years | 0 (0.0%) | 29 (18.3%) |
| 35 to 64 Years | 33 (47.1%) | 24 (10.1%) |
| 65 to 74 Years | 23 (46.0%) | 47 (73.4%) |
| 75 Years and over | 2 (8.3%) | 23 (56.1%) |
Disability Class by Sex by Age in Yemassee
Disability Class: Hearing Difficulty
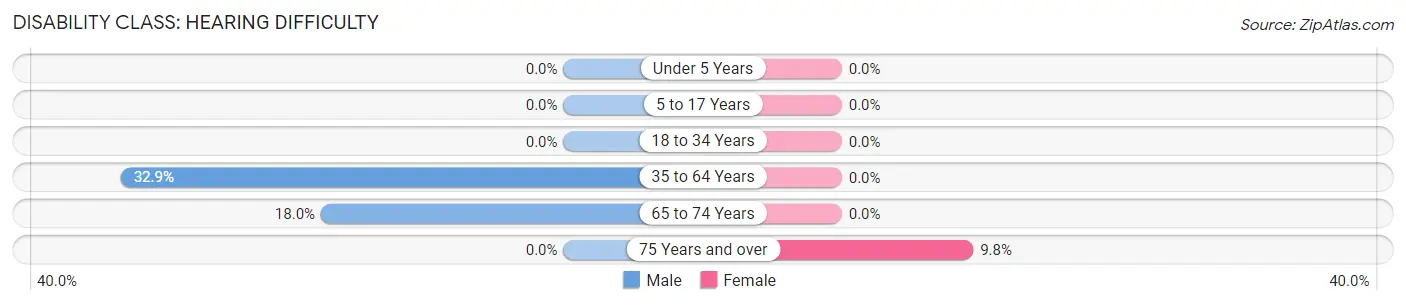
| Age Bracket | Male | Female |
| Under 5 Years | 0 (0.0%) | 0 (0.0%) |
| 5 to 17 Years | 0 (0.0%) | 0 (0.0%) |
| 18 to 34 Years | 0 (0.0%) | 0 (0.0%) |
| 35 to 64 Years | 23 (32.9%) | 0 (0.0%) |
| 65 to 74 Years | 9 (18.0%) | 0 (0.0%) |
| 75 Years and over | 0 (0.0%) | 4 (9.8%) |
Disability Class: Vision Difficulty
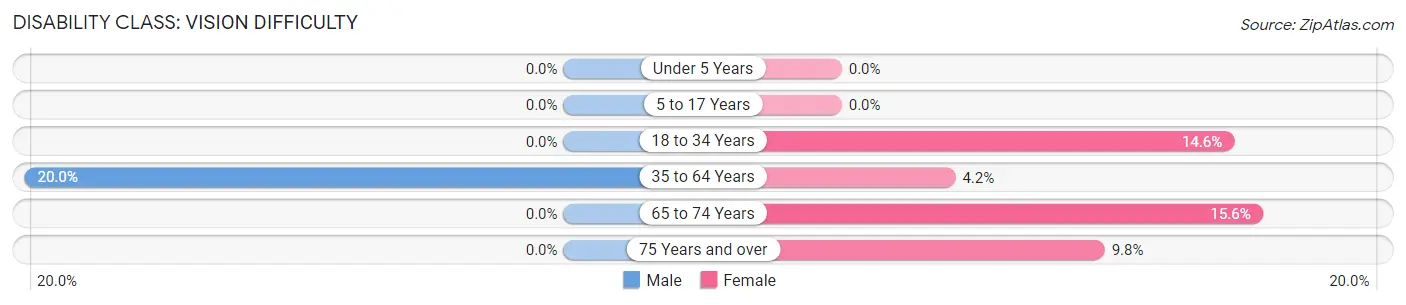
| Age Bracket | Male | Female |
| Under 5 Years | 0 (0.0%) | 0 (0.0%) |
| 5 to 17 Years | 0 (0.0%) | 0 (0.0%) |
| 18 to 34 Years | 0 (0.0%) | 23 (14.6%) |
| 35 to 64 Years | 14 (20.0%) | 10 (4.2%) |
| 65 to 74 Years | 0 (0.0%) | 10 (15.6%) |
| 75 Years and over | 0 (0.0%) | 4 (9.8%) |
Disability Class: Cognitive Difficulty
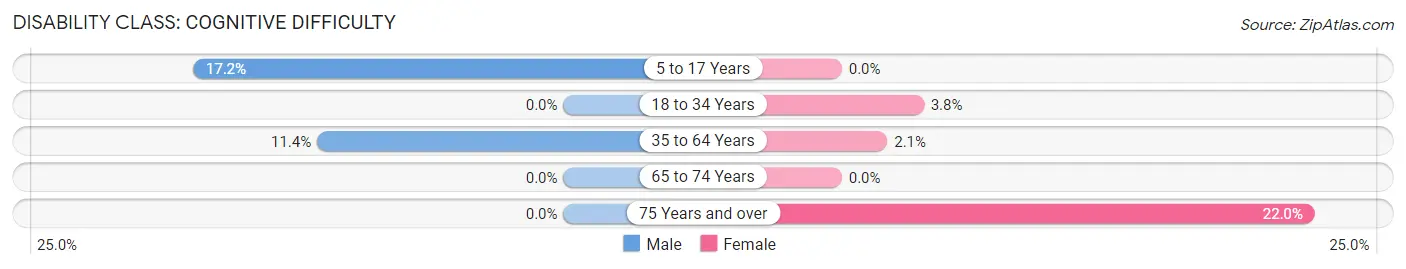
| Age Bracket | Male | Female |
| 5 to 17 Years | 11 (17.2%) | 0 (0.0%) |
| 18 to 34 Years | 0 (0.0%) | 6 (3.8%) |
| 35 to 64 Years | 8 (11.4%) | 5 (2.1%) |
| 65 to 74 Years | 0 (0.0%) | 0 (0.0%) |
| 75 Years and over | 0 (0.0%) | 9 (22.0%) |
Disability Class: Ambulatory Difficulty
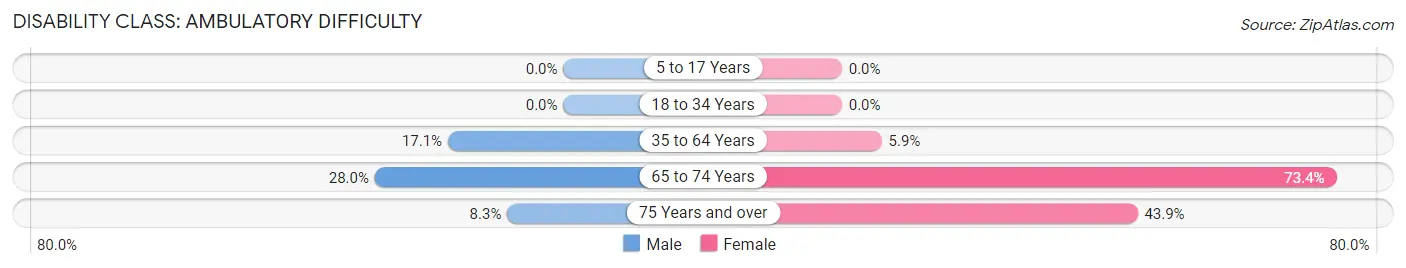
| Age Bracket | Male | Female |
| 5 to 17 Years | 0 (0.0%) | 0 (0.0%) |
| 18 to 34 Years | 0 (0.0%) | 0 (0.0%) |
| 35 to 64 Years | 12 (17.1%) | 14 (5.9%) |
| 65 to 74 Years | 14 (28.0%) | 47 (73.4%) |
| 75 Years and over | 2 (8.3%) | 18 (43.9%) |
Disability Class: Self-Care Difficulty
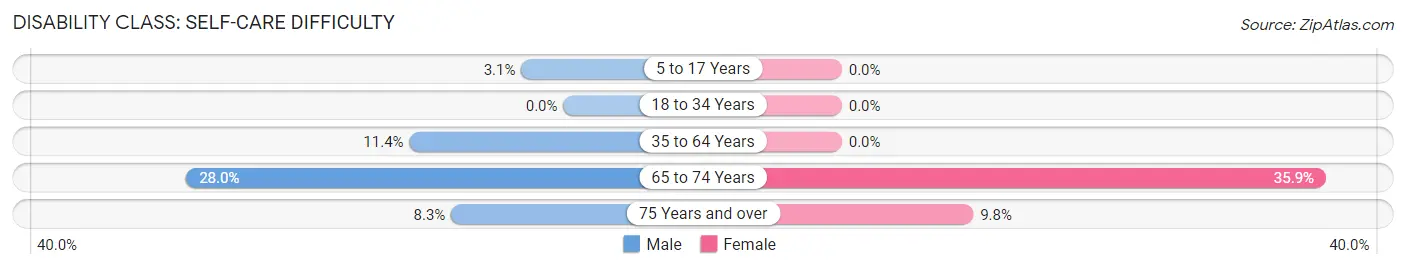
| Age Bracket | Male | Female |
| 5 to 17 Years | 2 (3.1%) | 0 (0.0%) |
| 18 to 34 Years | 0 (0.0%) | 0 (0.0%) |
| 35 to 64 Years | 8 (11.4%) | 0 (0.0%) |
| 65 to 74 Years | 14 (28.0%) | 23 (35.9%) |
| 75 Years and over | 2 (8.3%) | 4 (9.8%) |
Technology Access in Yemassee
Computing Device Access in Yemassee
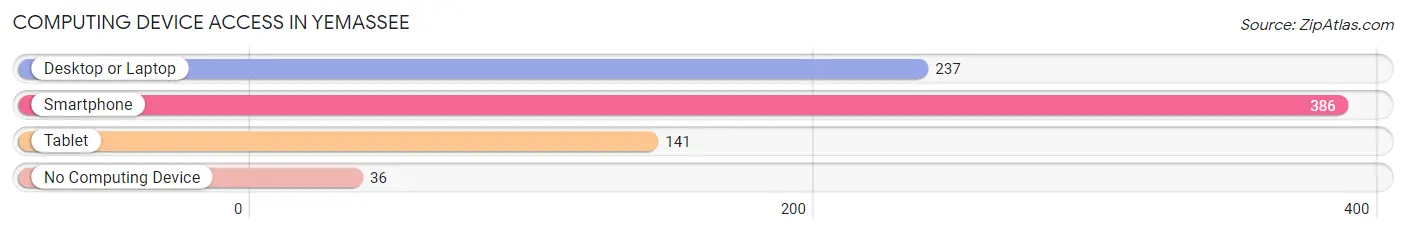
| Device Type | # Households | % Households |
| Desktop or Laptop | 237 | 54.9% |
| Smartphone | 386 | 89.3% |
| Tablet | 141 | 32.6% |
| No Computing Device | 36 | 8.3% |
| Total | 432 | 100.0% |
Internet Access in Yemassee
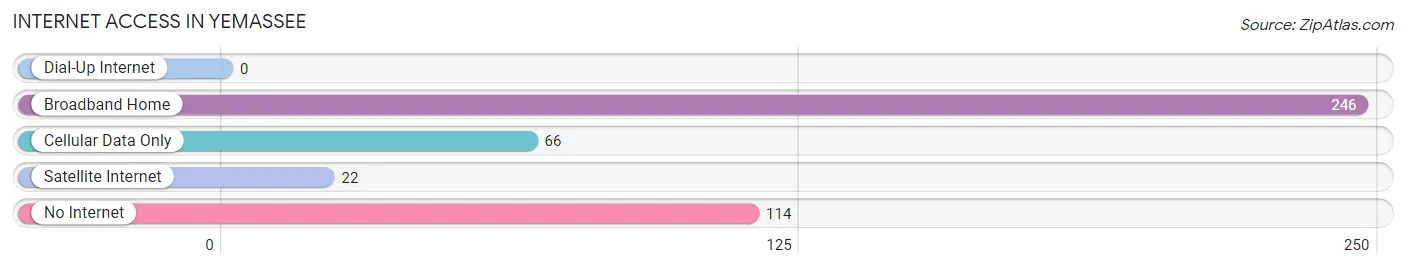
| Internet Type | # Households | % Households |
| Dial-Up Internet | 0 | 0.0% |
| Broadband Home | 246 | 56.9% |
| Cellular Data Only | 66 | 15.3% |
| Satellite Internet | 22 | 5.1% |
| No Internet | 114 | 26.4% |
| Total | 432 | 100.0% |
Yemassee Summary
Yemassee is a small town located in the Lowcountry region of South Carolina. It is situated in the southeastern corner of the state, about halfway between Charleston and Savannah, Georgia. The town is part of Beaufort County and is home to a population of just over 1,000 people.
History
Yemassee was founded in 1735 by a group of settlers from the British Isles. The town was named after the Yemassee Indians, who were the original inhabitants of the area. The town was originally a trading post and was used as a stopover for travelers heading to and from Charleston.
In the late 1700s, Yemassee became a major port for the export of cotton and other goods. The town was also a major stop on the stagecoach route between Charleston and Savannah. During the Civil War, Yemassee was the site of a major battle between Union and Confederate forces.
Geography
Yemassee is located in the Lowcountry region of South Carolina. The town is situated in the southeastern corner of the state, about halfway between Charleston and Savannah, Georgia. The town is part of Beaufort County and is home to a population of just over 1,000 people.
The town is located on the banks of the Combahee River, which is a tributary of the Savannah River. The town is surrounded by a number of small towns and villages, including Coosawhatchie, Lobeco, and Tillman.
The town is located in a humid subtropical climate zone, with hot, humid summers and mild winters. The average annual temperature is around 70 degrees Fahrenheit.
Economy
Yemassee is a small town with a limited economy. The town is home to a number of small businesses, including restaurants, retail stores, and service providers. The town is also home to a number of small manufacturing companies, including a paper mill and a furniture factory.
The town is also home to a number of agricultural operations, including a number of farms and nurseries. The town is also home to a number of seafood processing plants, which process and package seafood for export.
Demographics
As of the 2010 census, Yemassee had a population of 1,039 people. The town is predominantly white, with a small African American population. The median household income in the town is $31,250, and the median home value is $117,000.
The town is home to a number of churches, including the Yemassee United Methodist Church, the Yemassee Baptist Church, and the Yemassee Presbyterian Church. The town is also home to a number of schools, including the Yemassee Elementary School, the Yemassee Middle School, and the Yemassee High School.
Conclusion
Yemassee is a small town located in the Lowcountry region of South Carolina. It is situated in the southeastern corner of the state, about halfway between Charleston and Savannah, Georgia. The town is part of Beaufort County and is home to a population of just over 1,000 people. The town has a limited economy, with a number of small businesses, manufacturing companies, and agricultural operations. The town is predominantly white, with a small African American population. The town is home to a number of churches and schools, and is a popular stopover for travelers heading to and from Charleston and Savannah.
Common Questions
What is Per Capita Income in Yemassee?
Per Capita income in Yemassee is $27,794.
What is the Median Family Income in Yemassee?
Median Family Income in Yemassee is $61,683.
What is the Median Household income in Yemassee?
Median Household Income in Yemassee is $45,323.
What is Income or Wage Gap in Yemassee?
Income or Wage Gap in Yemassee is 31.1%.
Women in Yemassee earn 68.9 cents for every dollar earned by a man.
What is Inequality or Gini Index in Yemassee?
Inequality or Gini Index in Yemassee is 0.49.
What is the Total Population of Yemassee?
Total Population of Yemassee is 974.
What is the Total Male Population of Yemassee?
Total Male Population of Yemassee is 323.
What is the Total Female Population of Yemassee?
Total Female Population of Yemassee is 651.
What is the Ratio of Males per 100 Females in Yemassee?
There are 49.62 Males per 100 Females in Yemassee.
What is the Ratio of Females per 100 Males in Yemassee?
There are 201.55 Females per 100 Males in Yemassee.
What is the Median Population Age in Yemassee?
Median Population Age in Yemassee is 34.9 Years.
What is the Average Family Size in Yemassee
Average Family Size in Yemassee is 3.0 People.
What is the Average Household Size in Yemassee
Average Household Size in Yemassee is 2.2 People.
How Large is the Labor Force in Yemassee?
There are 461 People in the Labor Forcein in Yemassee.
What is the Percentage of People in the Labor Force in Yemassee?
62.8% of People are in the Labor Force in Yemassee.
What is the Unemployment Rate in Yemassee?
Unemployment Rate in Yemassee is 5.2%.