Platte City, MO Map & Demographics
Platte City Map
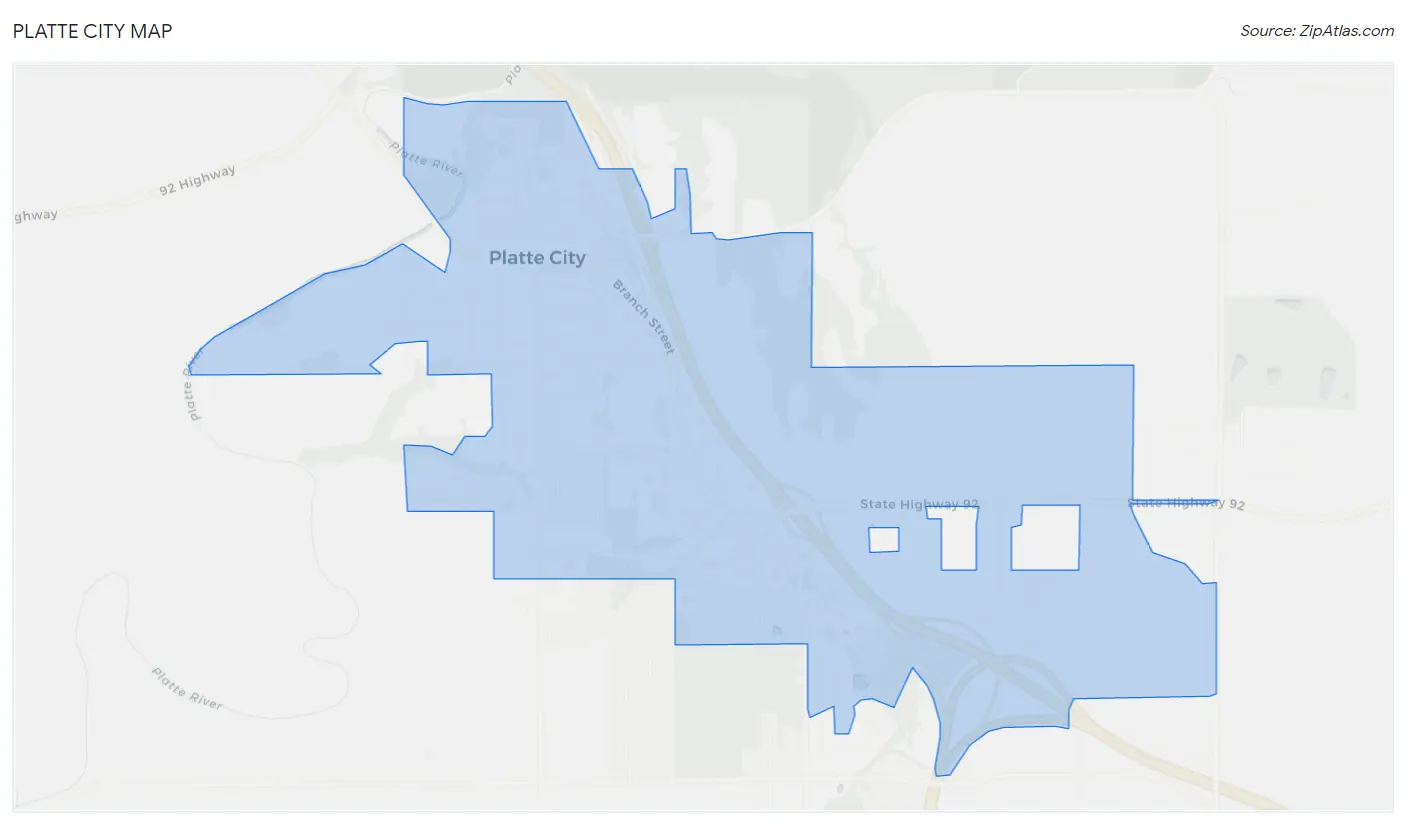
Platte City Overview
$29,690
PER CAPITA INCOME
$61,932
AVG FAMILY INCOME
$58,802
AVG HOUSEHOLD INCOME
22.2%
WAGE / INCOME GAP [ % ]
77.8¢/ $1
WAGE / INCOME GAP [ $ ]
0.40
INEQUALITY / GINI INDEX
4,781
TOTAL POPULATION
2,282
MALE POPULATION
2,499
FEMALE POPULATION
91.32
MALES / 100 FEMALES
109.51
FEMALES / 100 MALES
34.1
MEDIAN AGE
3.0
AVG FAMILY SIZE
2.4
AVG HOUSEHOLD SIZE
2,636
LABOR FORCE [ PEOPLE ]
72.0%
PERCENT IN LABOR FORCE
4.0%
UNEMPLOYMENT RATE
Platte City Zip Codes
Platte City Area Codes
Income in Platte City
Income Overview in Platte City
Per Capita Income in Platte City is $29,690, while median incomes of families and households are $61,932 and $58,802 respectively.
| Characteristic | Number | Measure |
| Per Capita Income | 4,781 | $29,690 |
| Median Family Income | 1,167 | $61,932 |
| Mean Family Income | 1,167 | $74,074 |
| Median Household Income | 1,932 | $58,802 |
| Mean Household Income | 1,932 | $71,558 |
| Income Deficit | 1,167 | $0 |
| Wage / Income Gap (%) | 4,781 | 22.24% |
| Wage / Income Gap ($) | 4,781 | 77.76¢ per $1 |
| Gini / Inequality Index | 4,781 | 0.40 |
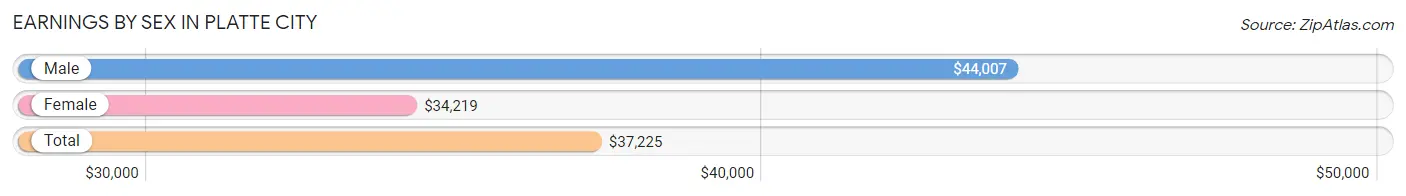
Earnings by Sex in Platte City
Average Earnings in Platte City are $37,225, $44,007 for men and $34,219 for women, a difference of 22.2%.
| Sex | Number | Average Earnings |
| Male | 1,317 (47.0%) | $44,007 |
| Female | 1,483 (53.0%) | $34,219 |
| Total | 2,800 (100.0%) | $37,225 |
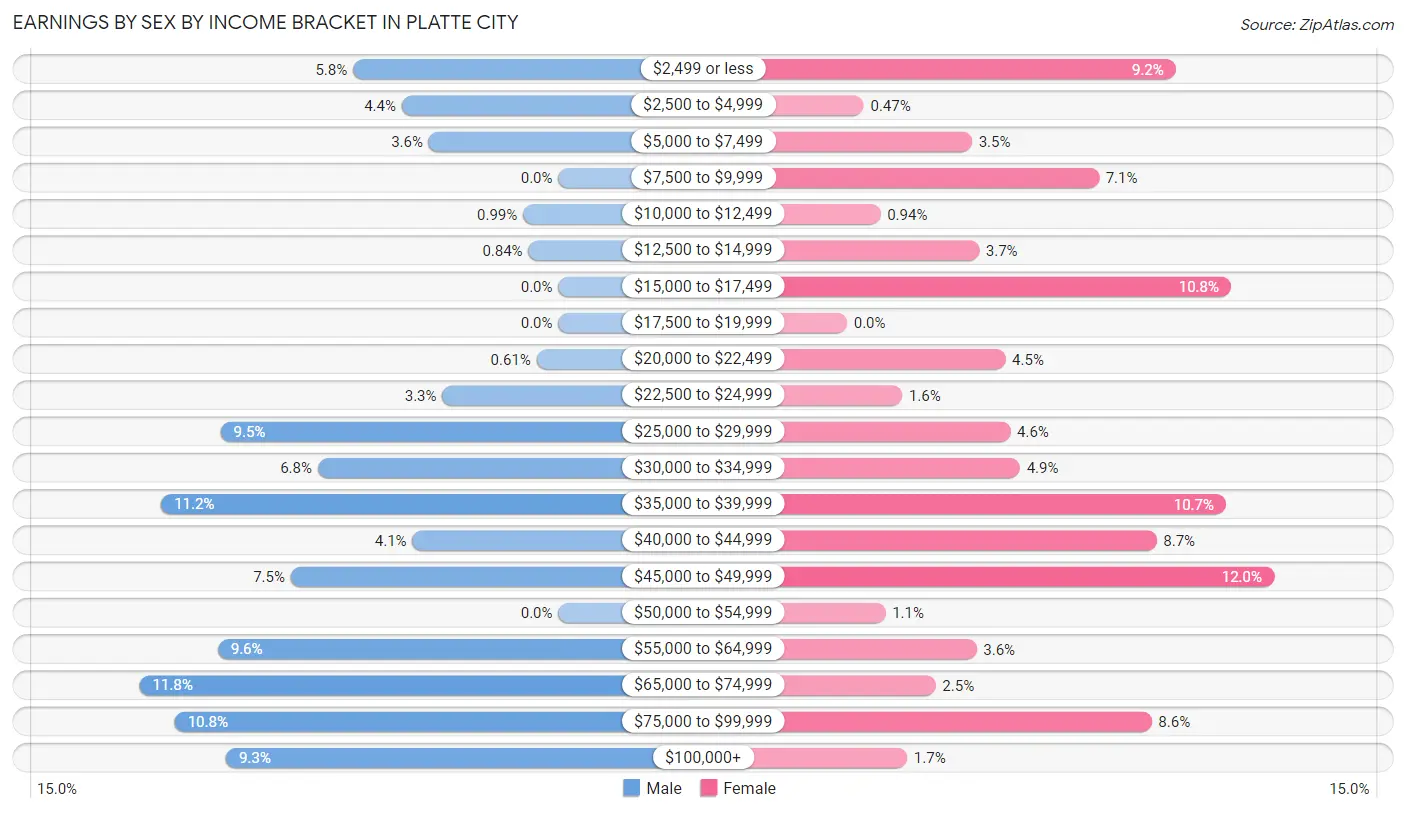
Earnings by Sex by Income Bracket in Platte City
The most common earnings brackets in Platte City are $65,000 to $74,999 for men (155 | 11.8%) and $45,000 to $49,999 for women (178 | 12.0%).
| Income | Male | Female |
| $2,499 or less | 76 (5.8%) | 137 (9.2%) |
| $2,500 to $4,999 | 58 (4.4%) | 7 (0.5%) |
| $5,000 to $7,499 | 48 (3.6%) | 52 (3.5%) |
| $7,500 to $9,999 | 0 (0.0%) | 105 (7.1%) |
| $10,000 to $12,499 | 13 (1.0%) | 14 (0.9%) |
| $12,500 to $14,999 | 11 (0.8%) | 55 (3.7%) |
| $15,000 to $17,499 | 0 (0.0%) | 160 (10.8%) |
| $17,500 to $19,999 | 0 (0.0%) | 0 (0.0%) |
| $20,000 to $22,499 | 8 (0.6%) | 66 (4.4%) |
| $22,500 to $24,999 | 43 (3.3%) | 23 (1.5%) |
| $25,000 to $29,999 | 125 (9.5%) | 68 (4.6%) |
| $30,000 to $34,999 | 89 (6.8%) | 72 (4.9%) |
| $35,000 to $39,999 | 147 (11.2%) | 158 (10.6%) |
| $40,000 to $44,999 | 54 (4.1%) | 129 (8.7%) |
| $45,000 to $49,999 | 99 (7.5%) | 178 (12.0%) |
| $50,000 to $54,999 | 0 (0.0%) | 16 (1.1%) |
| $55,000 to $64,999 | 126 (9.6%) | 54 (3.6%) |
| $65,000 to $74,999 | 155 (11.8%) | 37 (2.5%) |
| $75,000 to $99,999 | 142 (10.8%) | 127 (8.6%) |
| $100,000+ | 123 (9.3%) | 25 (1.7%) |
| Total | 1,317 (100.0%) | 1,483 (100.0%) |
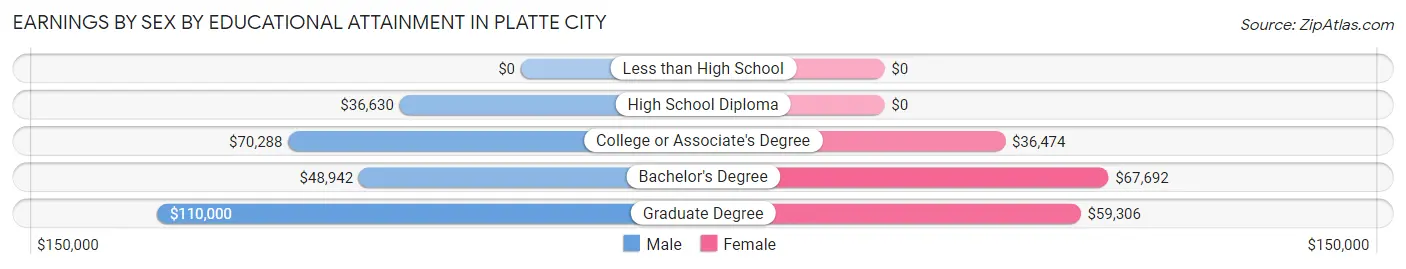
Earnings by Sex by Educational Attainment in Platte City
Average earnings in Platte City are $55,200 for men and $40,164 for women, a difference of 27.2%. Men with an educational attainment of graduate degree enjoy the highest average annual earnings of $110,000, while those with high school diploma education earn the least with $36,630. Women with an educational attainment of bachelor's degree earn the most with the average annual earnings of $67,692, while those with college or associate's degree education have the smallest earnings of $36,474.
| Educational Attainment | Male Income | Female Income |
| Less than High School | - | - |
| High School Diploma | $36,630 | $0 |
| College or Associate's Degree | $70,288 | $36,474 |
| Bachelor's Degree | $48,942 | $67,692 |
| Graduate Degree | $110,000 | $59,306 |
| Total | $55,200 | $40,164 |
Family Income in Platte City
Family Income Brackets in Platte City
According to the Platte City family income data, there are 286 families falling into the $35,000 to $49,999 income range, which is the most common income bracket and makes up 24.5% of all families. Conversely, the $10,000 to $14,999 income bracket is the least frequent group with only 14 families (1.2%) belonging to this category.
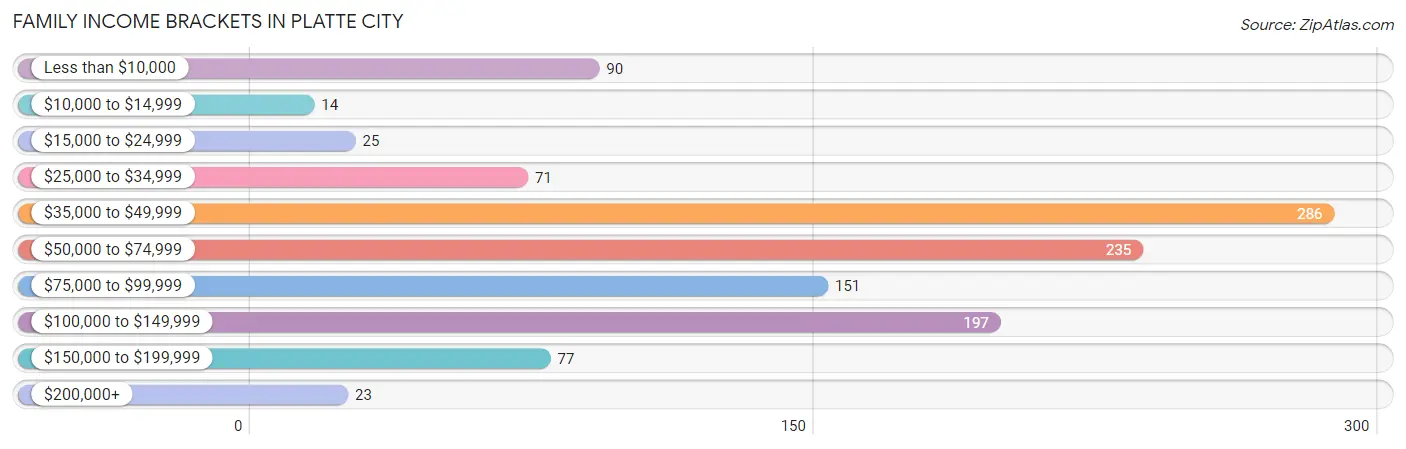
| Income Bracket | # Families | % Families |
| Less than $10,000 | 90 | 7.7% |
| $10,000 to $14,999 | 14 | 1.2% |
| $15,000 to $24,999 | 25 | 2.1% |
| $25,000 to $34,999 | 71 | 6.1% |
| $35,000 to $49,999 | 286 | 24.5% |
| $50,000 to $74,999 | 235 | 20.1% |
| $75,000 to $99,999 | 151 | 12.9% |
| $100,000 to $149,999 | 197 | 16.9% |
| $150,000 to $199,999 | 77 | 6.6% |
| $200,000+ | 23 | 2.0% |
Family Income by Famaliy Size in Platte City
4-person families (209 | 17.9%) account for the highest median family income in Platte City with $97,625 per family, while 2-person families (593 | 50.8%) have the highest median income of $29,299 per family member.
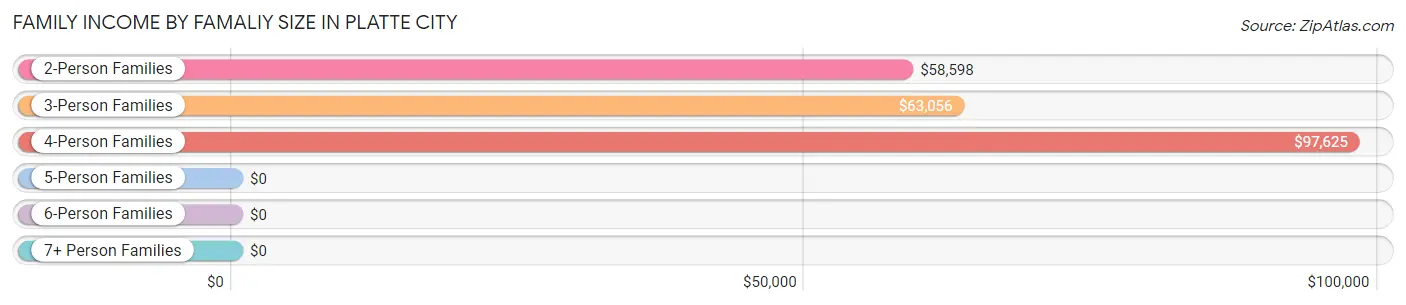
| Income Bracket | # Families | Median Income |
| 2-Person Families | 593 (50.8%) | $58,598 |
| 3-Person Families | 208 (17.8%) | $63,056 |
| 4-Person Families | 209 (17.9%) | $97,625 |
| 5-Person Families | 125 (10.7%) | $0 |
| 6-Person Families | 15 (1.3%) | $0 |
| 7+ Person Families | 17 (1.5%) | $0 |
| Total | 1,167 (100.0%) | $61,932 |
Family Income by Number of Earners in Platte City
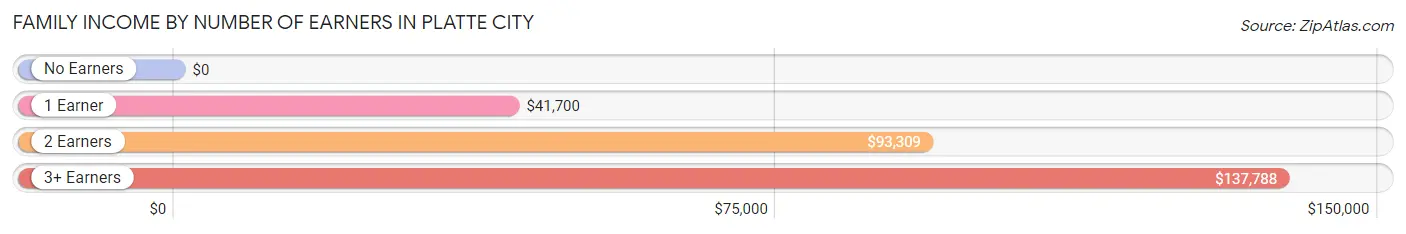
| Number of Earners | # Families | Median Income |
| No Earners | 35 (3.0%) | $0 |
| 1 Earner | 612 (52.4%) | $41,700 |
| 2 Earners | 403 (34.5%) | $93,309 |
| 3+ Earners | 117 (10.0%) | $137,788 |
| Total | 1,167 (100.0%) | $61,932 |
Household Income in Platte City
Household Income Brackets in Platte City
With 406 households falling in the category, the $35,000 to $49,999 income range is the most frequent in Platte City, accounting for 21.0% of all households. In contrast, only 41 households (2.1%) fall into the $10,000 to $14,999 income bracket, making it the least populous group.
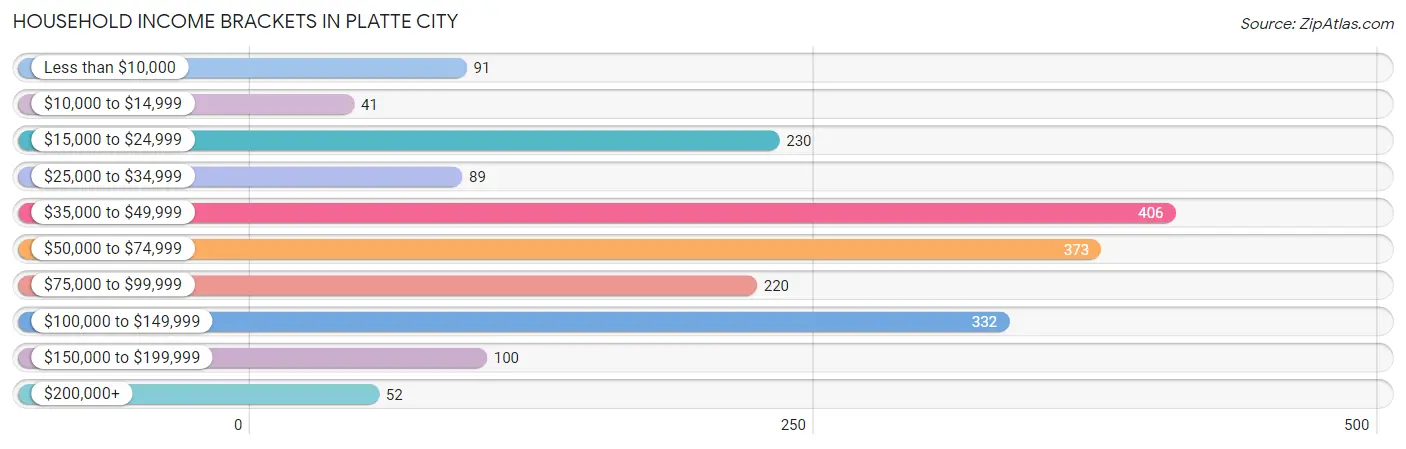
| Income Bracket | # Households | % Households |
| Less than $10,000 | 91 | 4.7% |
| $10,000 to $14,999 | 41 | 2.1% |
| $15,000 to $24,999 | 230 | 11.9% |
| $25,000 to $34,999 | 89 | 4.6% |
| $35,000 to $49,999 | 406 | 21.0% |
| $50,000 to $74,999 | 373 | 19.3% |
| $75,000 to $99,999 | 220 | 11.4% |
| $100,000 to $149,999 | 332 | 17.2% |
| $150,000 to $199,999 | 100 | 5.2% |
| $200,000+ | 52 | 2.7% |
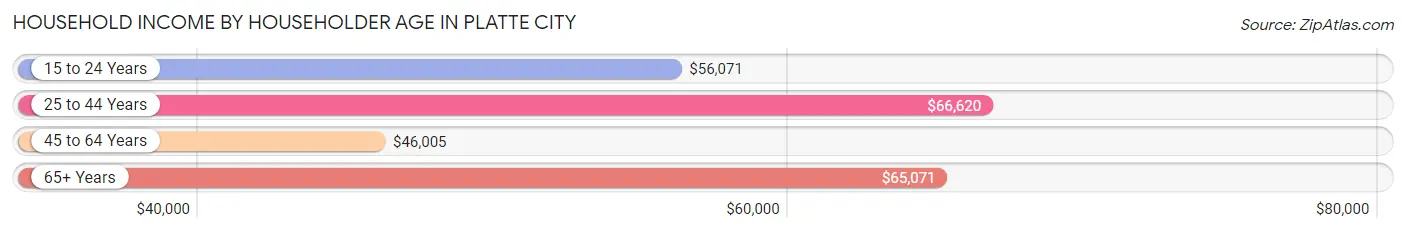
Household Income by Householder Age in Platte City
The median household income in Platte City is $58,802, with the highest median household income of $66,620 found in the 25 to 44 years age bracket for the primary householder. A total of 821 households (42.5%) fall into this category. Meanwhile, the 45 to 64 years age bracket for the primary householder has the lowest median household income of $46,005, with 621 households (32.1%) in this group.
| Income Bracket | # Households | Median Income |
| 15 to 24 Years | 252 (13.0%) | $56,071 |
| 25 to 44 Years | 821 (42.5%) | $66,620 |
| 45 to 64 Years | 621 (32.1%) | $46,005 |
| 65+ Years | 238 (12.3%) | $65,071 |
| Total | 1,932 (100.0%) | $58,802 |
Poverty in Platte City
Income Below Poverty by Sex and Age in Platte City
With 7.4% poverty level for males and 5.6% for females among the residents of Platte City, under 5 year old males and 15 year old females are the most vulnerable to poverty, with 85 males (48.0%) and 9 females (39.1%) in their respective age groups living below the poverty level.
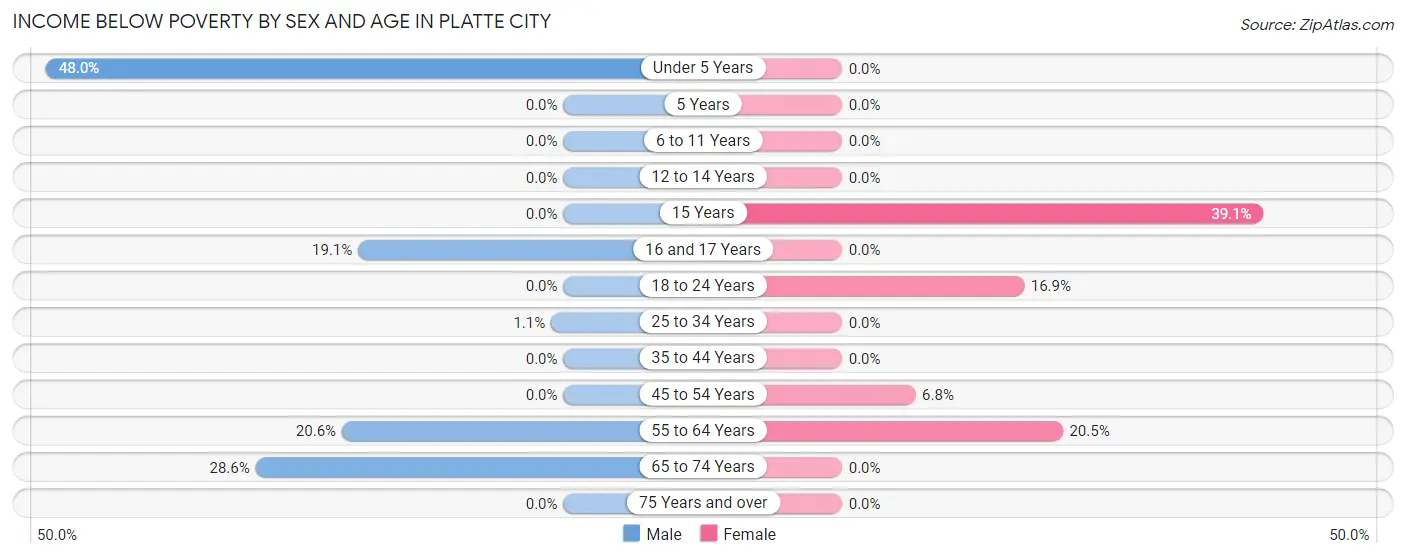
| Age Bracket | Male | Female |
| Under 5 Years | 85 (48.0%) | 0 (0.0%) |
| 5 Years | 0 (0.0%) | 0 (0.0%) |
| 6 to 11 Years | 0 (0.0%) | 0 (0.0%) |
| 12 to 14 Years | 0 (0.0%) | 0 (0.0%) |
| 15 Years | 0 (0.0%) | 9 (39.1%) |
| 16 and 17 Years | 16 (19.1%) | 0 (0.0%) |
| 18 to 24 Years | 0 (0.0%) | 50 (16.9%) |
| 25 to 34 Years | 2 (1.1%) | 0 (0.0%) |
| 35 to 44 Years | 0 (0.0%) | 0 (0.0%) |
| 45 to 54 Years | 0 (0.0%) | 32 (6.8%) |
| 55 to 64 Years | 15 (20.5%) | 43 (20.5%) |
| 65 to 74 Years | 42 (28.6%) | 0 (0.0%) |
| 75 Years and over | 0 (0.0%) | 0 (0.0%) |
| Total | 160 (7.4%) | 134 (5.6%) |
Income Above Poverty by Sex and Age in Platte City
According to the poverty statistics in Platte City, males aged 5 years and females aged under 5 years are the age groups that are most secure financially, with 100.0% of males and 100.0% of females in these age groups living above the poverty line.
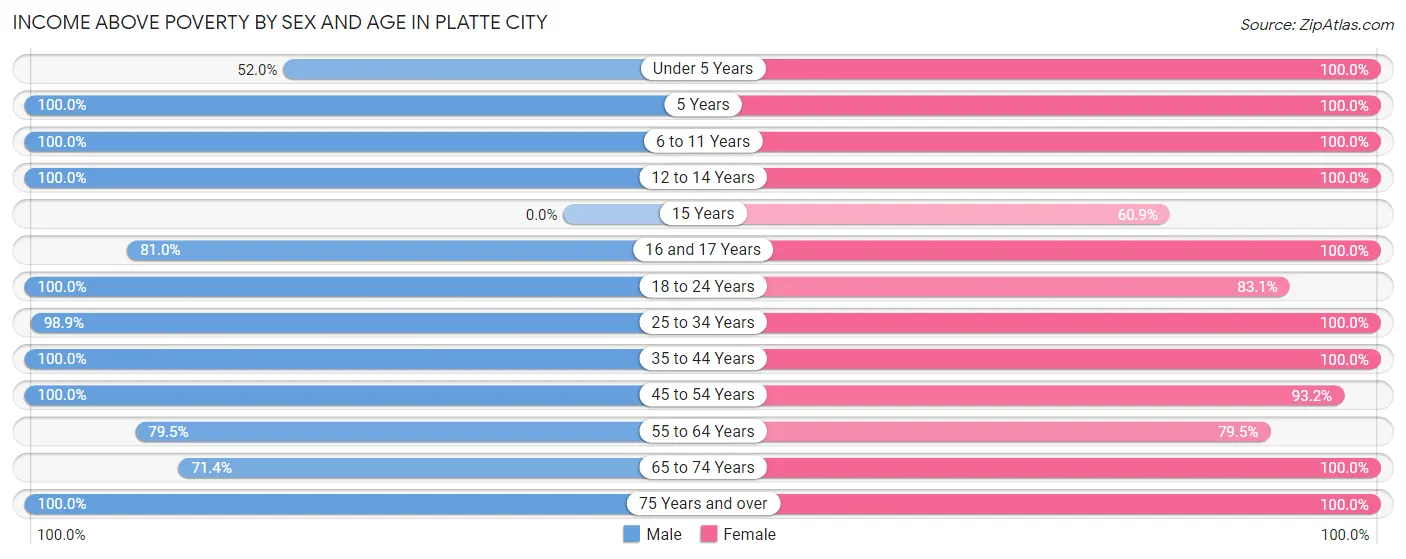
| Age Bracket | Male | Female |
| Under 5 Years | 92 (52.0%) | 100 (100.0%) |
| 5 Years | 68 (100.0%) | 71 (100.0%) |
| 6 to 11 Years | 135 (100.0%) | 177 (100.0%) |
| 12 to 14 Years | 234 (100.0%) | 120 (100.0%) |
| 15 Years | 0 (0.0%) | 14 (60.9%) |
| 16 and 17 Years | 68 (80.9%) | 157 (100.0%) |
| 18 to 24 Years | 339 (100.0%) | 246 (83.1%) |
| 25 to 34 Years | 174 (98.9%) | 235 (100.0%) |
| 35 to 44 Years | 442 (100.0%) | 313 (100.0%) |
| 45 to 54 Years | 221 (100.0%) | 438 (93.2%) |
| 55 to 64 Years | 58 (79.4%) | 167 (79.5%) |
| 65 to 74 Years | 105 (71.4%) | 161 (100.0%) |
| 75 Years and over | 56 (100.0%) | 43 (100.0%) |
| Total | 1,992 (92.6%) | 2,242 (94.4%) |
Income Below Poverty Among Married-Couple Families in Platte City
The poverty statistics for married-couple families in Platte City show that 7.5% or 40 of the total 536 families live below the poverty line. Families with no children have the highest poverty rate of 14.3%, comprising of 40 families. On the other hand, families with 1 or 2 children have the lowest poverty rate of 0.0%, which includes 0 families.
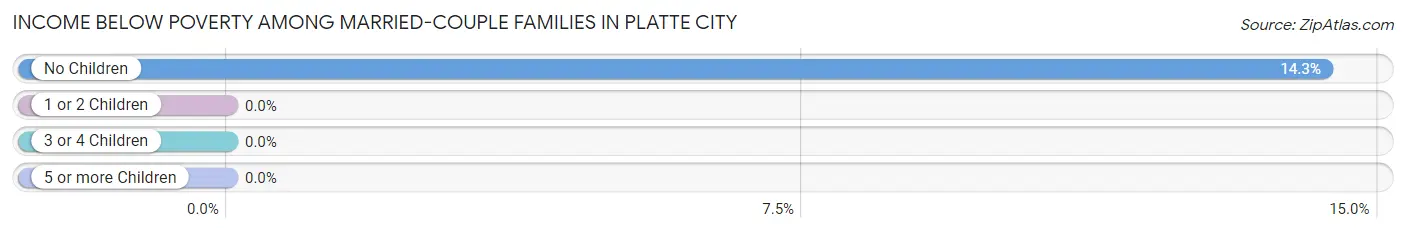
| Children | Above Poverty | Below Poverty |
| No Children | 240 (85.7%) | 40 (14.3%) |
| 1 or 2 Children | 167 (100.0%) | 0 (0.0%) |
| 3 or 4 Children | 89 (100.0%) | 0 (0.0%) |
| 5 or more Children | 0 (0.0%) | 0 (0.0%) |
| Total | 496 (92.5%) | 40 (7.5%) |
Income Below Poverty Among Single-Parent Households in Platte City
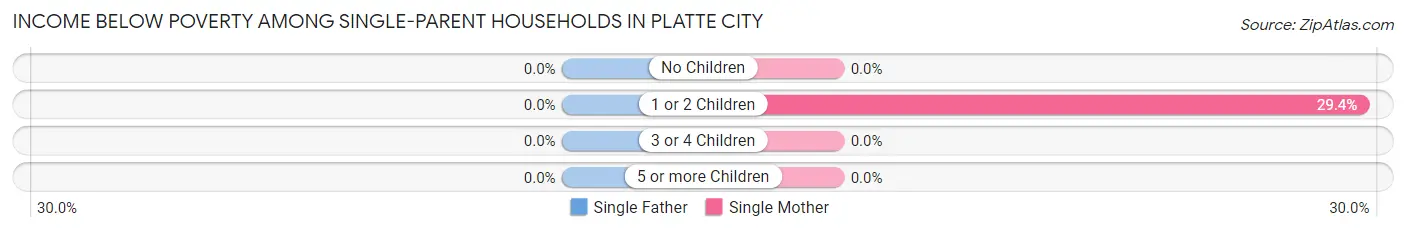
| Children | Single Father | Single Mother |
| No Children | 0 (0.0%) | 0 (0.0%) |
| 1 or 2 Children | 0 (0.0%) | 64 (29.4%) |
| 3 or 4 Children | 0 (0.0%) | 0 (0.0%) |
| 5 or more Children | 0 (0.0%) | 0 (0.0%) |
| Total | 0 (0.0%) | 64 (14.5%) |
Income Below Poverty Among Married-Couple vs Single-Parent Households in Platte City
The poverty data for Platte City shows that 40 of the married-couple family households (7.5%) and 64 of the single-parent households (10.1%) are living below the poverty level. Within the married-couple family households, those with no children have the highest poverty rate, with 40 households (14.3%) falling below the poverty line. Among the single-parent households, those with 1 or 2 children have the highest poverty rate, with 64 household (15.7%) living below poverty.
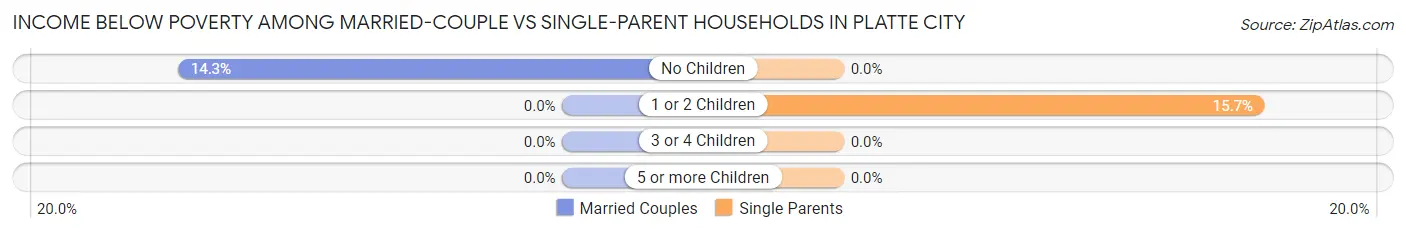
| Children | Married-Couple Families | Single-Parent Households |
| No Children | 40 (14.3%) | 0 (0.0%) |
| 1 or 2 Children | 0 (0.0%) | 64 (15.7%) |
| 3 or 4 Children | 0 (0.0%) | 0 (0.0%) |
| 5 or more Children | 0 (0.0%) | 0 (0.0%) |
| Total | 40 (7.5%) | 64 (10.1%) |
Race in Platte City
The most populous races in Platte City are White / Caucasian (4,296 | 89.9%), Hispanic or Latino (282 | 5.9%), and Some other Race (112 | 2.3%).
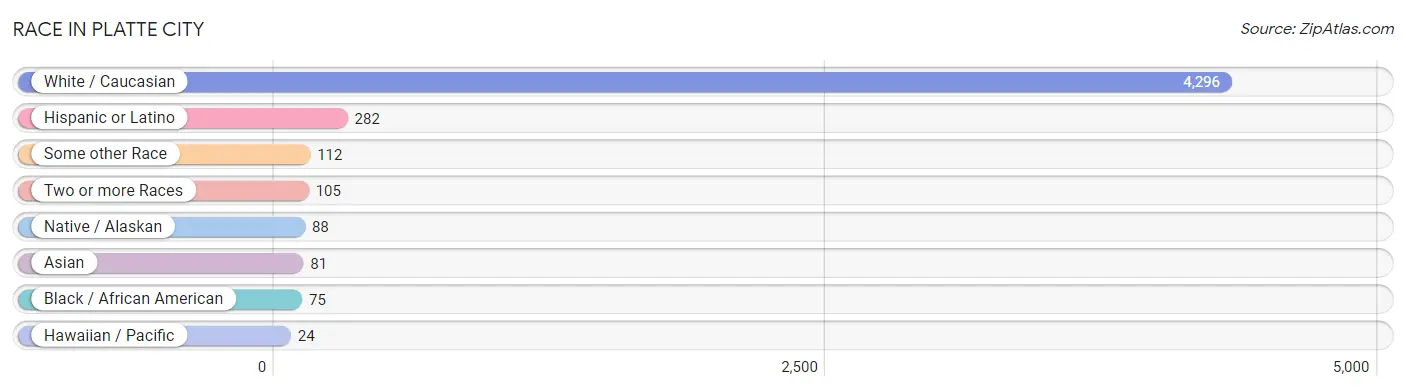
| Race | # Population | % Population |
| Asian | 81 | 1.7% |
| Black / African American | 75 | 1.6% |
| Hawaiian / Pacific | 24 | 0.5% |
| Hispanic or Latino | 282 | 5.9% |
| Native / Alaskan | 88 | 1.8% |
| White / Caucasian | 4,296 | 89.9% |
| Two or more Races | 105 | 2.2% |
| Some other Race | 112 | 2.3% |
| Total | 4,781 | 100.0% |
Ancestry in Platte City
The most populous ancestries reported in Platte City are Irish (882 | 18.4%), German (852 | 17.8%), English (715 | 15.0%), American (436 | 9.1%), and Mexican (228 | 4.8%), together accounting for 65.1% of all Platte City residents.
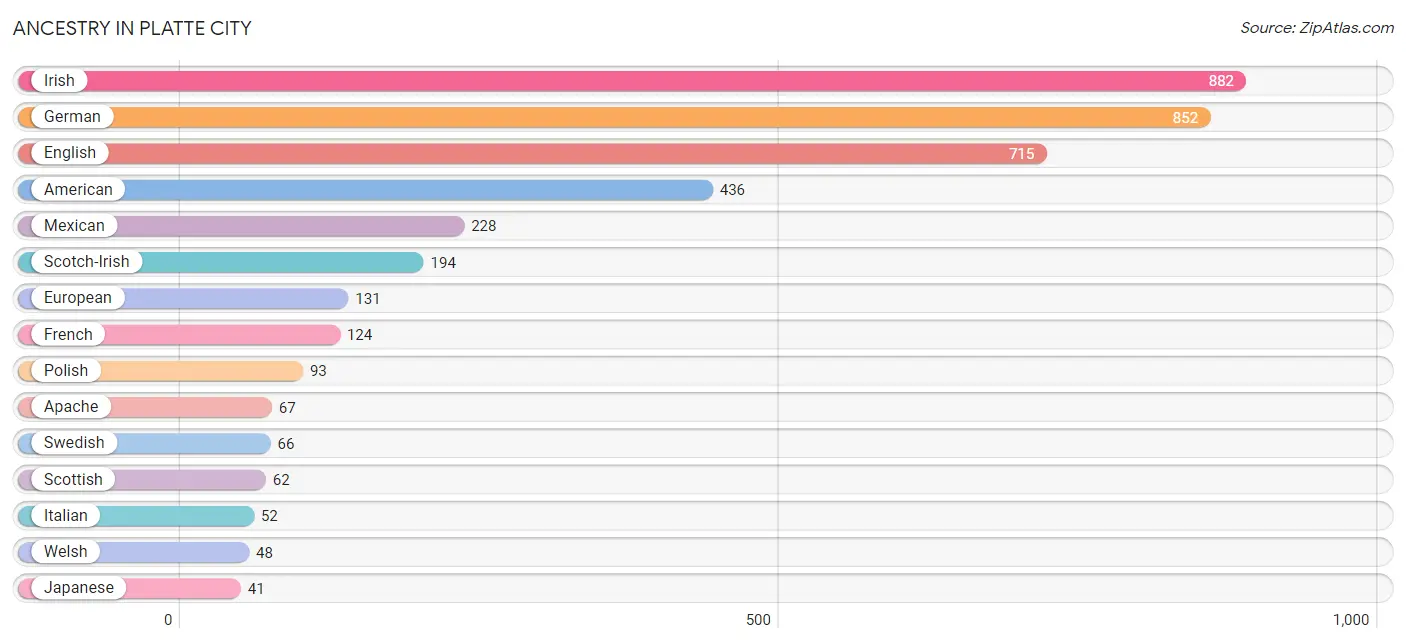
| Ancestry | # Population | % Population |
| American | 436 | 9.1% |
| Apache | 67 | 1.4% |
| Bhutanese | 12 | 0.3% |
| Blackfeet | 3 | 0.1% |
| British | 6 | 0.1% |
| Cape Verdean | 4 | 0.1% |
| Central American | 17 | 0.4% |
| Cherokee | 32 | 0.7% |
| Chippewa | 21 | 0.4% |
| Dutch | 9 | 0.2% |
| Eastern European | 33 | 0.7% |
| English | 715 | 15.0% |
| European | 131 | 2.7% |
| French | 124 | 2.6% |
| German | 852 | 17.8% |
| Greek | 33 | 0.7% |
| Icelander | 33 | 0.7% |
| Indian (Asian) | 12 | 0.3% |
| Irish | 882 | 18.4% |
| Italian | 52 | 1.1% |
| Japanese | 41 | 0.9% |
| Korean | 20 | 0.4% |
| Mexican | 228 | 4.8% |
| Native Hawaiian | 18 | 0.4% |
| Northern European | 6 | 0.1% |
| Norwegian | 4 | 0.1% |
| Polish | 93 | 1.9% |
| Salvadoran | 17 | 0.4% |
| Samoan | 6 | 0.1% |
| Scotch-Irish | 194 | 4.1% |
| Scottish | 62 | 1.3% |
| Slavic | 19 | 0.4% |
| Spaniard | 24 | 0.5% |
| Spanish | 6 | 0.1% |
| Subsaharan African | 4 | 0.1% |
| Swedish | 66 | 1.4% |
| Swiss | 35 | 0.7% |
| Thai | 20 | 0.4% |
| Welsh | 48 | 1.0% | View All 39 Rows |
Immigrants in Platte City
The most numerous immigrant groups reported in Platte City came from Central America (84 | 1.8%), Latin America (84 | 1.8%), Mexico (84 | 1.8%), Europe (39 | 0.8%), and Germany (32 | 0.7%), together accounting for 6.8% of all Platte City residents.
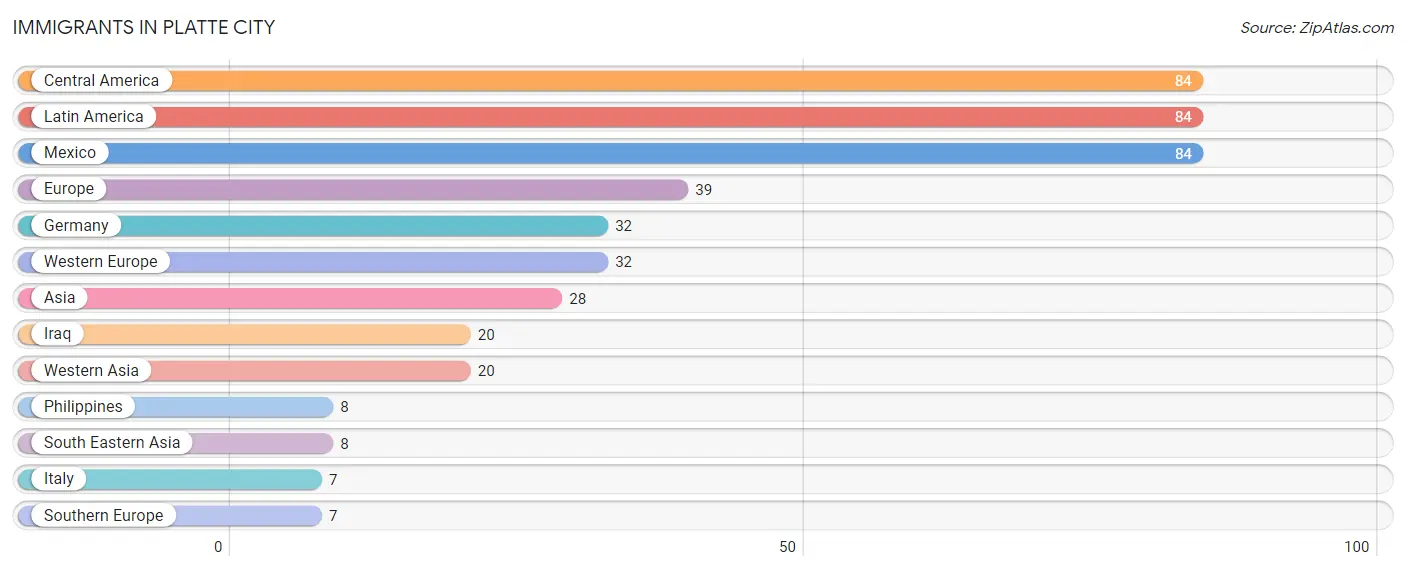
| Immigration Origin | # Population | % Population |
| Asia | 28 | 0.6% |
| Central America | 84 | 1.8% |
| Europe | 39 | 0.8% |
| Germany | 32 | 0.7% |
| Iraq | 20 | 0.4% |
| Italy | 7 | 0.2% |
| Latin America | 84 | 1.8% |
| Mexico | 84 | 1.8% |
| Philippines | 8 | 0.2% |
| South Eastern Asia | 8 | 0.2% |
| Southern Europe | 7 | 0.2% |
| Western Asia | 20 | 0.4% |
| Western Europe | 32 | 0.7% | View All 13 Rows |
Sex and Age in Platte City
Sex and Age in Platte City
The most populous age groups in Platte City are 40 to 44 Years (357 | 15.6%) for men and 20 to 24 Years (296 | 11.8%) for women.
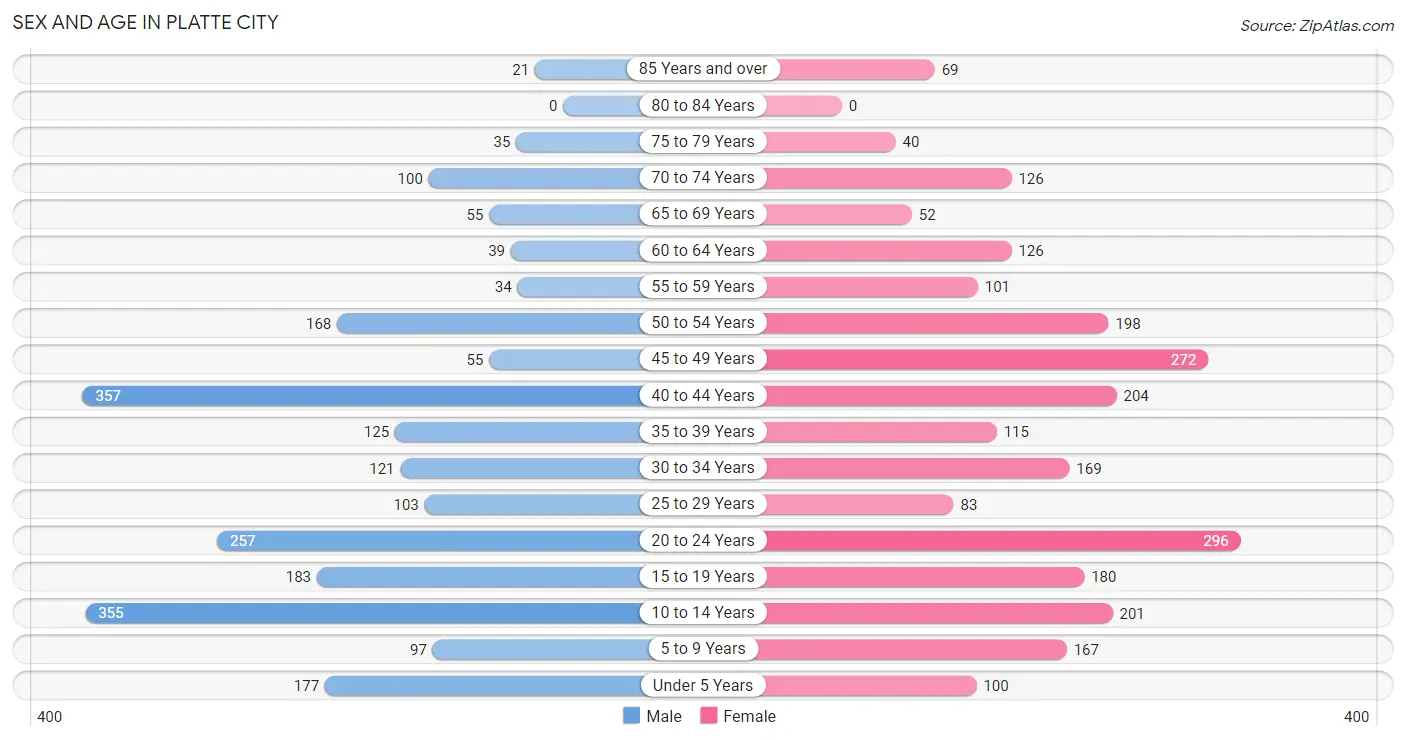
| Age Bracket | Male | Female |
| Under 5 Years | 177 (7.8%) | 100 (4.0%) |
| 5 to 9 Years | 97 (4.3%) | 167 (6.7%) |
| 10 to 14 Years | 355 (15.6%) | 201 (8.0%) |
| 15 to 19 Years | 183 (8.0%) | 180 (7.2%) |
| 20 to 24 Years | 257 (11.3%) | 296 (11.8%) |
| 25 to 29 Years | 103 (4.5%) | 83 (3.3%) |
| 30 to 34 Years | 121 (5.3%) | 169 (6.8%) |
| 35 to 39 Years | 125 (5.5%) | 115 (4.6%) |
| 40 to 44 Years | 357 (15.6%) | 204 (8.2%) |
| 45 to 49 Years | 55 (2.4%) | 272 (10.9%) |
| 50 to 54 Years | 168 (7.4%) | 198 (7.9%) |
| 55 to 59 Years | 34 (1.5%) | 101 (4.0%) |
| 60 to 64 Years | 39 (1.7%) | 126 (5.0%) |
| 65 to 69 Years | 55 (2.4%) | 52 (2.1%) |
| 70 to 74 Years | 100 (4.4%) | 126 (5.0%) |
| 75 to 79 Years | 35 (1.5%) | 40 (1.6%) |
| 80 to 84 Years | 0 (0.0%) | 0 (0.0%) |
| 85 Years and over | 21 (0.9%) | 69 (2.8%) |
| Total | 2,282 (100.0%) | 2,499 (100.0%) |
Families and Households in Platte City
Median Family Size in Platte City
The median family size in Platte City is 2.95 persons per family, with married-couple families (536 | 45.9%) accounting for the largest median family size of 3.18 persons per family. On the other hand, single male/father families (190 | 16.3%) represent the smallest median family size with 2.45 persons per family.
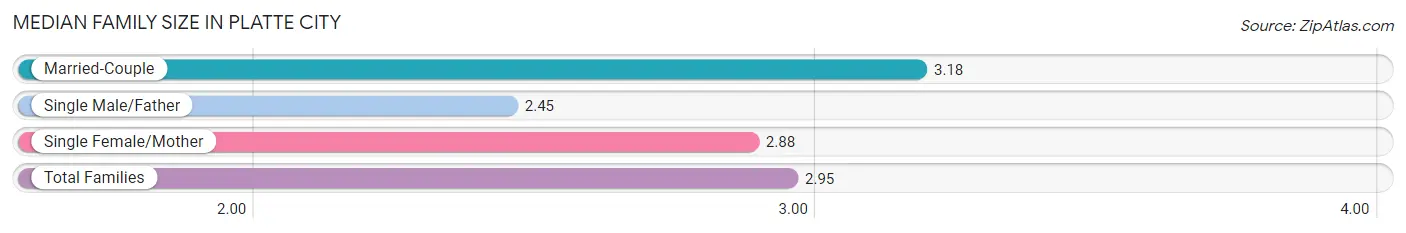
| Family Type | # Families | Family Size |
| Married-Couple | 536 (45.9%) | 3.18 |
| Single Male/Father | 190 (16.3%) | 2.45 |
| Single Female/Mother | 441 (37.8%) | 2.88 |
| Total Families | 1,167 (100.0%) | 2.95 |
Median Household Size in Platte City
The median household size in Platte City is 2.35 persons per household, with married-couple households (536 | 27.7%) accounting for the largest median household size of 3.18 persons per household. non-family households (765 | 39.6%) represent the smallest median household size with 1.34 persons per household.
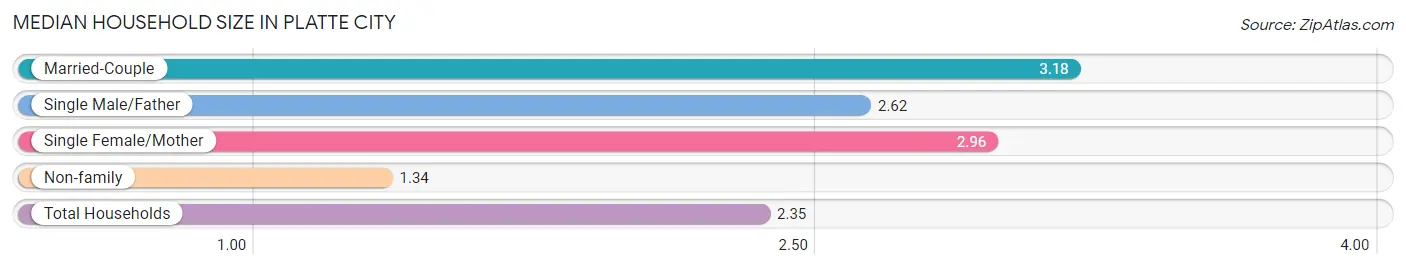
| Household Type | # Households | Household Size |
| Married-Couple | 536 (27.7%) | 3.18 |
| Single Male/Father | 190 (9.8%) | 2.62 |
| Single Female/Mother | 441 (22.8%) | 2.96 |
| Non-family | 765 (39.6%) | 1.34 |
| Total Households | 1,932 (100.0%) | 2.35 |
Household Size by Marriage Status in Platte City
Out of a total of 1,932 households in Platte City, 1,167 (60.4%) are family households, while 765 (39.6%) are nonfamily households. The most numerous type of family households are 2-person households, comprising 549, and the most common type of nonfamily households are 1-person households, comprising 486.
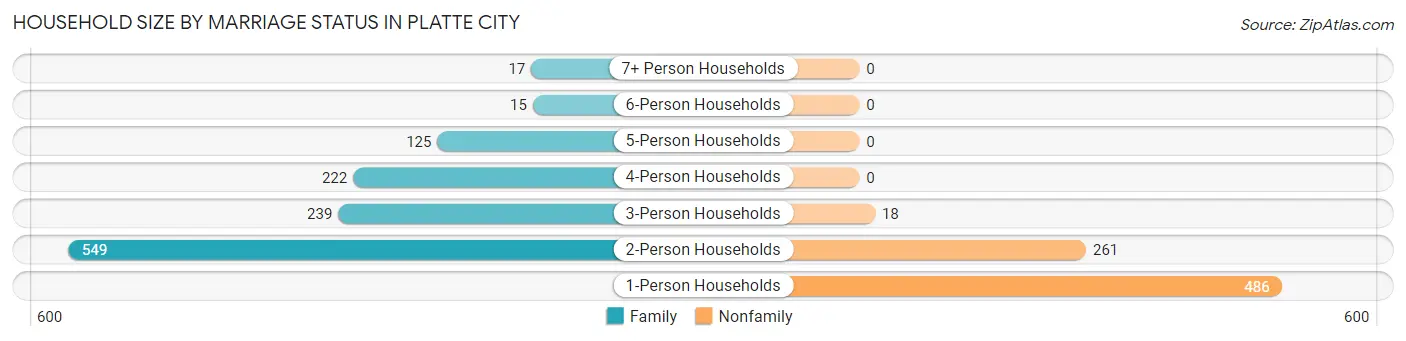
| Household Size | Family Households | Nonfamily Households |
| 1-Person Households | - | 486 (25.2%) |
| 2-Person Households | 549 (28.4%) | 261 (13.5%) |
| 3-Person Households | 239 (12.4%) | 18 (0.9%) |
| 4-Person Households | 222 (11.5%) | 0 (0.0%) |
| 5-Person Households | 125 (6.5%) | 0 (0.0%) |
| 6-Person Households | 15 (0.8%) | 0 (0.0%) |
| 7+ Person Households | 17 (0.9%) | 0 (0.0%) |
| Total | 1,167 (60.4%) | 765 (39.6%) |
Female Fertility in Platte City
Fertility by Age in Platte City
Average fertility rate in Platte City is 91.0 births per 1,000 women. Women in the age bracket of 20 to 34 years have the highest fertility rate with 179.0 births per 1,000 women. Women in the age bracket of 20 to 34 years acount for 81.7% of all women with births.
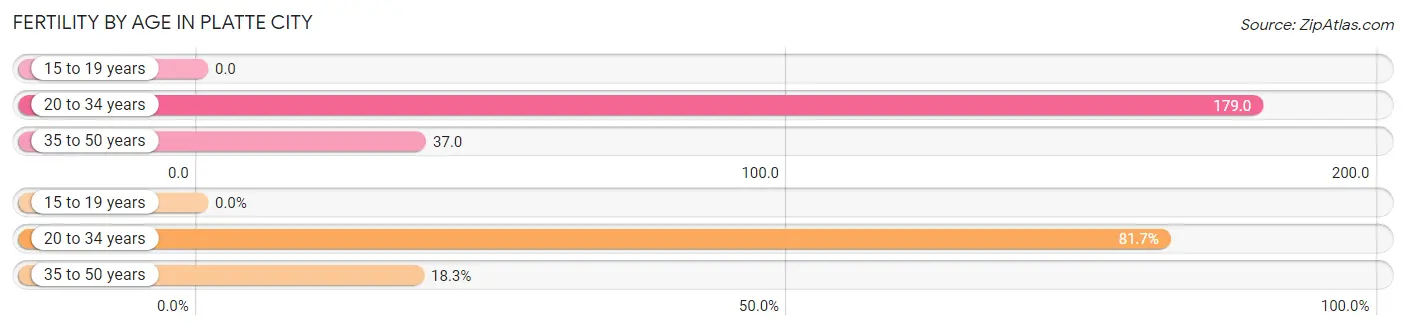
| Age Bracket | Women with Births | Births / 1,000 Women |
| 15 to 19 years | 0 (0.0%) | 0.0 |
| 20 to 34 years | 98 (81.7%) | 179.0 |
| 35 to 50 years | 22 (18.3%) | 37.0 |
| Total | 120 (100.0%) | 91.0 |
Fertility by Age by Marriage Status in Platte City
36.7% of women with births (120) in Platte City are married. The highest percentage of unmarried women with births falls into 35 to 50 years age bracket with 72.7% of them unmarried at the time of birth, while the lowest percentage of unmarried women with births belong to 20 to 34 years age bracket with 61.2% of them unmarried.
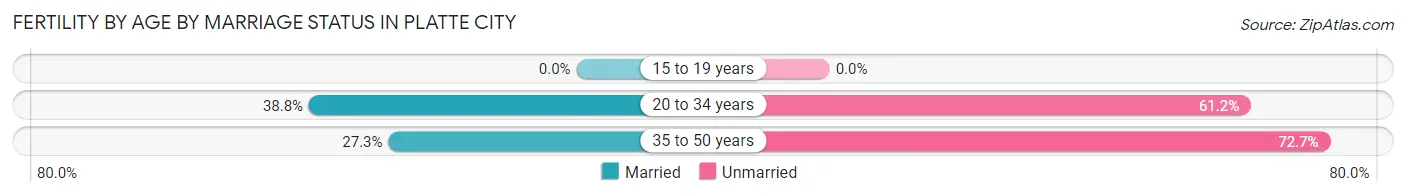
| Age Bracket | Married | Unmarried |
| 15 to 19 years | 0 (0.0%) | 0 (0.0%) |
| 20 to 34 years | 38 (38.8%) | 60 (61.2%) |
| 35 to 50 years | 6 (27.3%) | 16 (72.7%) |
| Total | 44 (36.7%) | 76 (63.3%) |
Fertility by Education in Platte City
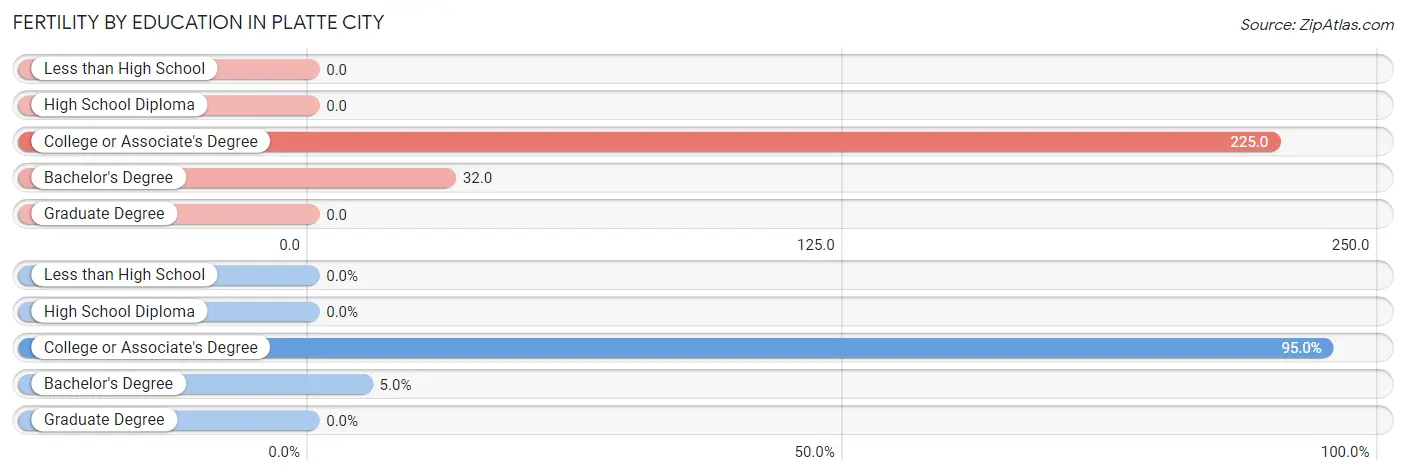
| Educational Attainment | Women with Births | Births / 1,000 Women |
| Less than High School | 0 (0.0%) | 0.0 |
| High School Diploma | 0 (0.0%) | 0.0 |
| College or Associate's Degree | 114 (95.0%) | 225.0 |
| Bachelor's Degree | 6 (5.0%) | 32.0 |
| Graduate Degree | 0 (0.0%) | 0.0 |
| Total | 120 (100.0%) | 91.0 |
Fertility by Education by Marriage Status in Platte City
63.3% of women with births in Platte City are unmarried. Women with the educational attainment of bachelor's degree are most likely to be married with 100.0% of them married at childbirth, while women with the educational attainment of college or associate's degree are least likely to be married with 66.7% of them unmarried at childbirth.
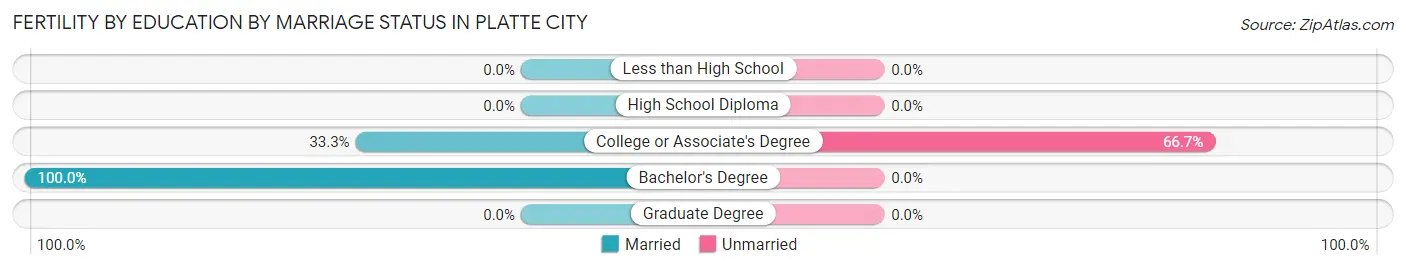
| Educational Attainment | Married | Unmarried |
| Less than High School | 0 (0.0%) | 0 (0.0%) |
| High School Diploma | 0 (0.0%) | 0 (0.0%) |
| College or Associate's Degree | 38 (33.3%) | 76 (66.7%) |
| Bachelor's Degree | 6 (100.0%) | 0 (0.0%) |
| Graduate Degree | 0 (0.0%) | 0 (0.0%) |
| Total | 44 (36.7%) | 76 (63.3%) |
Employment Characteristics in Platte City
Employment by Class of Employer in Platte City
Among the 2,525 employed individuals in Platte City, private company employees (1,860 | 73.7%), not-for-profit organizations (221 | 8.7%), and self-employed (not incorporated) (147 | 5.8%) make up the most common classes of employment.
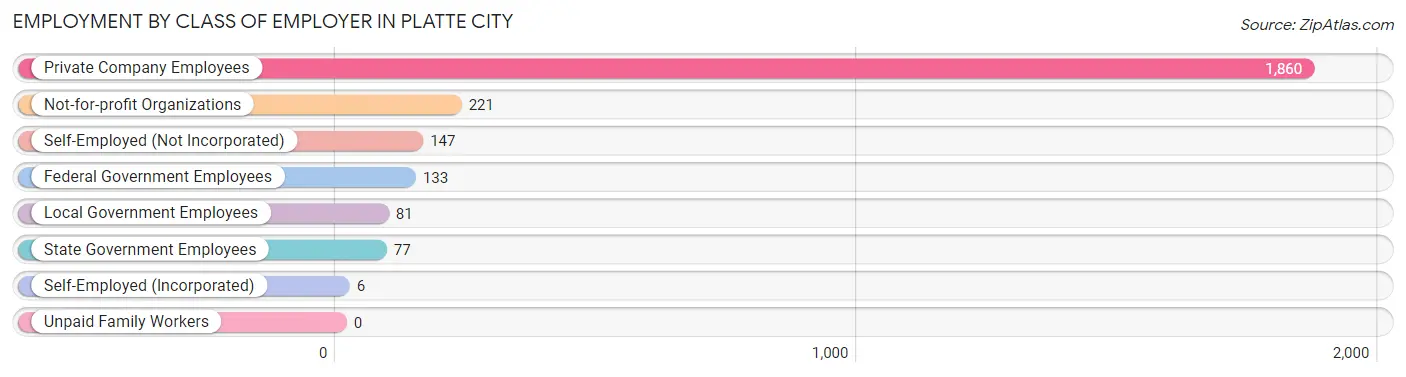
| Employer Class | # Employees | % Employees |
| Private Company Employees | 1,860 | 73.7% |
| Self-Employed (Incorporated) | 6 | 0.2% |
| Self-Employed (Not Incorporated) | 147 | 5.8% |
| Not-for-profit Organizations | 221 | 8.7% |
| Local Government Employees | 81 | 3.2% |
| State Government Employees | 77 | 3.0% |
| Federal Government Employees | 133 | 5.3% |
| Unpaid Family Workers | 0 | 0.0% |
| Total | 2,525 | 100.0% |
Employment Status by Age in Platte City
According to the labor force statistics for Platte City, out of the total population over 16 years of age (3,661), 72.0% or 2,636 individuals are in the labor force, with 4.0% or 105 of them unemployed. The age group with the highest labor force participation rate is 55 to 59 years, with 91.9% or 124 individuals in the labor force. Within the labor force, the 45 to 54 years age range has the highest percentage of unemployed individuals, with 11.1% or 64 of them being unemployed.
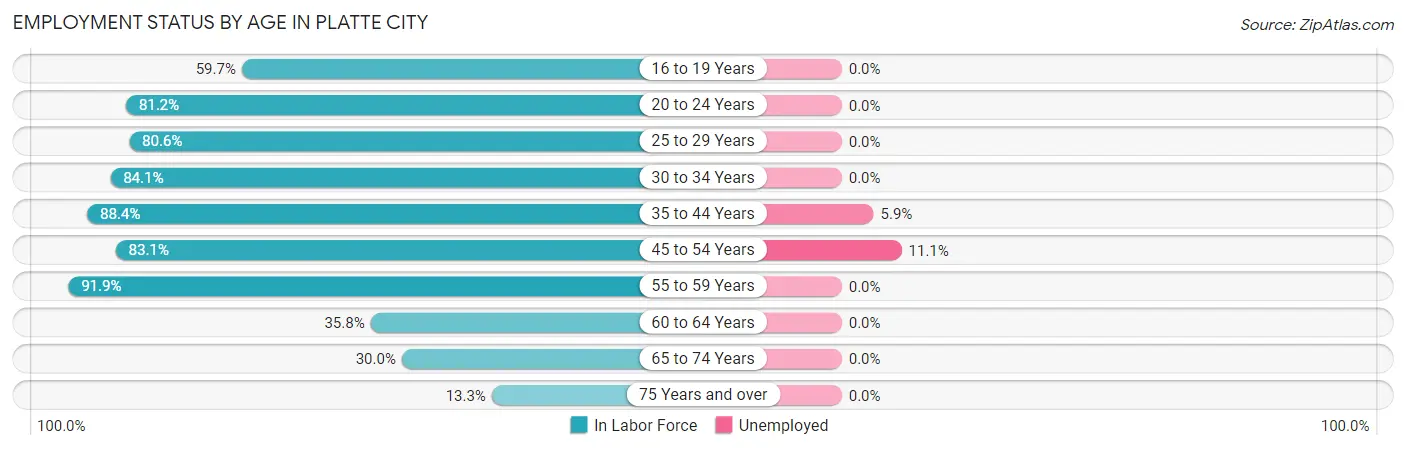
| Age Bracket | In Labor Force | Unemployed |
| 16 to 19 Years | 203 (59.7%) | 0 (0.0%) |
| 20 to 24 Years | 449 (81.2%) | 0 (0.0%) |
| 25 to 29 Years | 150 (80.6%) | 0 (0.0%) |
| 30 to 34 Years | 244 (84.1%) | 0 (0.0%) |
| 35 to 44 Years | 708 (88.4%) | 42 (5.9%) |
| 45 to 54 Years | 576 (83.1%) | 64 (11.1%) |
| 55 to 59 Years | 124 (91.9%) | 0 (0.0%) |
| 60 to 64 Years | 59 (35.8%) | 0 (0.0%) |
| 65 to 74 Years | 100 (30.0%) | 0 (0.0%) |
| 75 Years and over | 22 (13.3%) | 0 (0.0%) |
| Total | 2,636 (72.0%) | 105 (4.0%) |
Employment Status by Educational Attainment in Platte City
According to labor force statistics for Platte City, 82.0% of individuals (1,861) out of the total population between 25 and 64 years of age (2,270) are in the labor force, with 5.7% or 106 of them being unemployed. The group with the highest labor force participation rate are those with the educational attainment of bachelor's degree or higher, with 95.3% or 656 individuals in the labor force. Within the labor force, individuals with college / associate degree education have the highest percentage of unemployment, with 10.2% or 58 of them being unemployed.
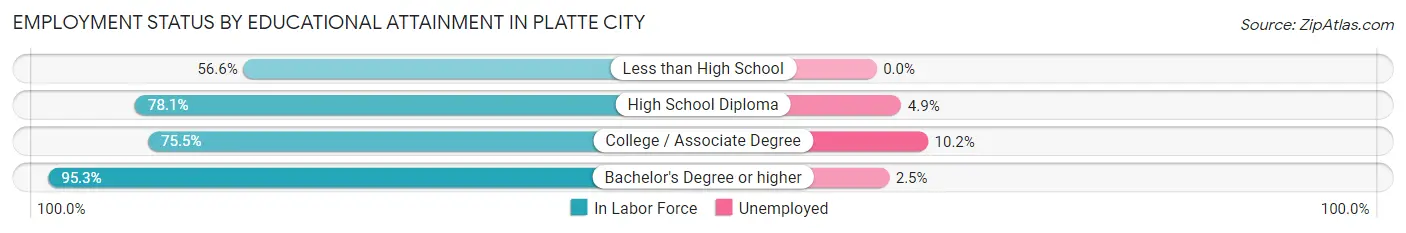
| Educational Attainment | In Labor Force | Unemployed |
| Less than High School | 30 (56.6%) | 0 (0.0%) |
| High School Diploma | 607 (78.1%) | 38 (4.9%) |
| College / Associate Degree | 568 (75.5%) | 77 (10.2%) |
| Bachelor's Degree or higher | 656 (95.3%) | 17 (2.5%) |
| Total | 1,861 (82.0%) | 129 (5.7%) |
Employment Occupations by Sex in Platte City
Management, Business, Science and Arts Occupations
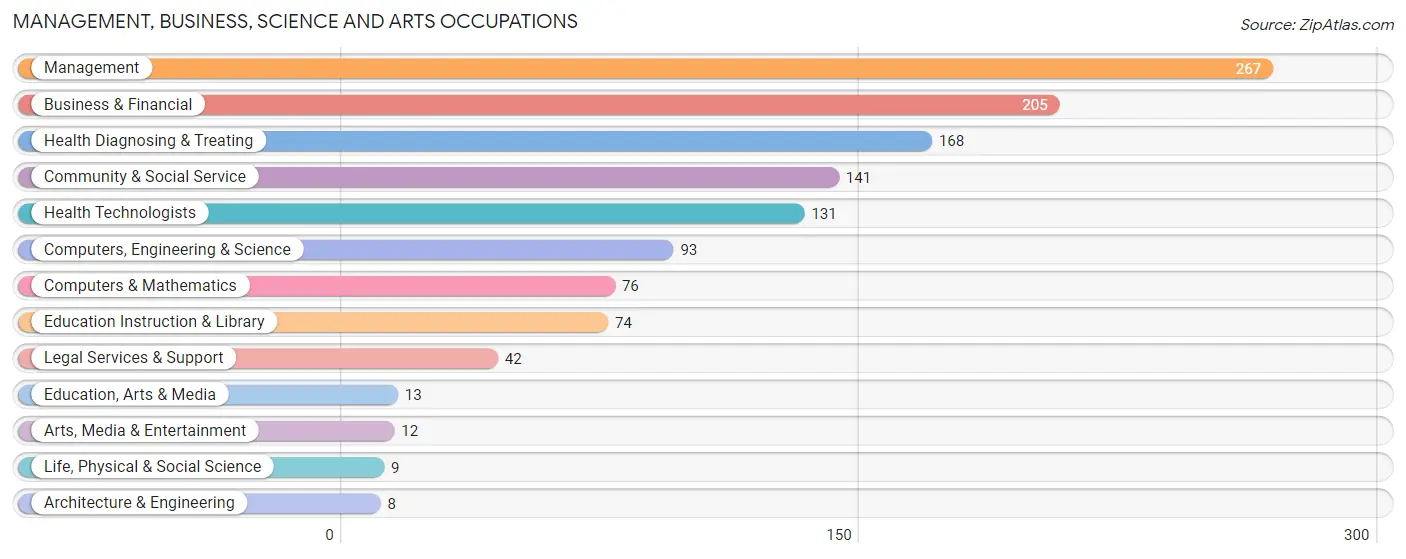
The most common Management, Business, Science and Arts occupations in Platte City are Management (267 | 10.8%), Business & Financial (205 | 8.3%), Health Diagnosing & Treating (168 | 6.8%), Community & Social Service (141 | 5.7%), and Health Technologists (131 | 5.3%).
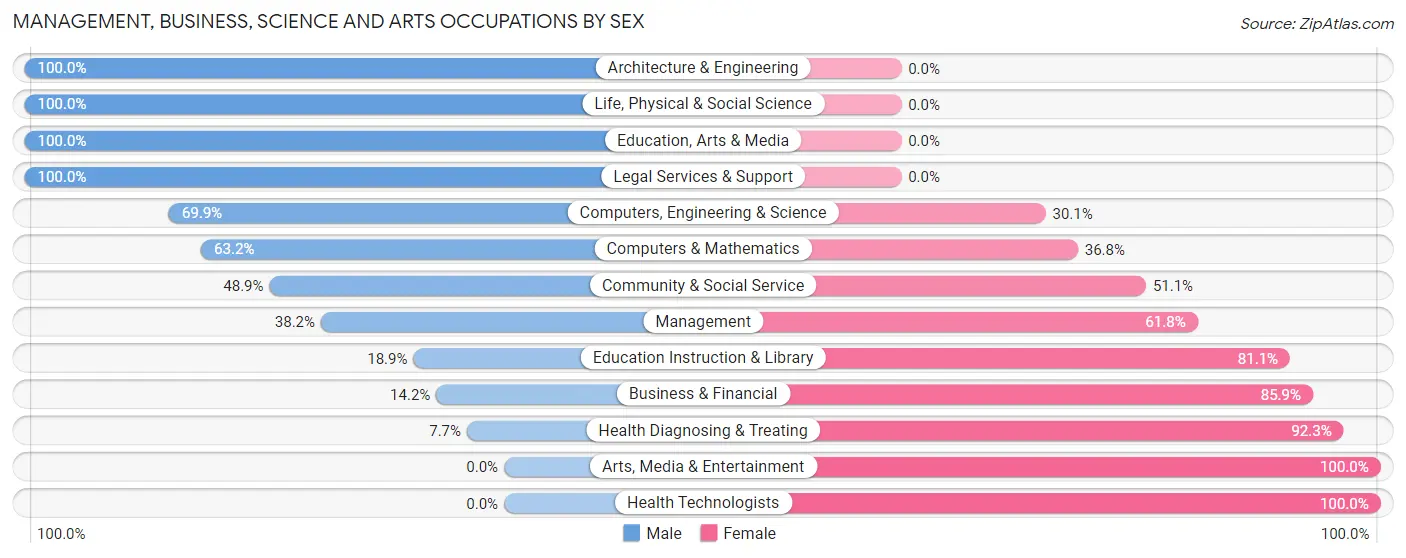
Management, Business, Science and Arts Occupations by Sex
Within the Management, Business, Science and Arts occupations in Platte City, the most male-oriented occupations are Architecture & Engineering (100.0%), Life, Physical & Social Science (100.0%), and Education, Arts & Media (100.0%), while the most female-oriented occupations are Arts, Media & Entertainment (100.0%), Health Technologists (100.0%), and Health Diagnosing & Treating (92.3%).
| Occupation | Male | Female |
| Management | 102 (38.2%) | 165 (61.8%) |
| Business & Financial | 29 (14.1%) | 176 (85.9%) |
| Computers, Engineering & Science | 65 (69.9%) | 28 (30.1%) |
| Computers & Mathematics | 48 (63.2%) | 28 (36.8%) |
| Architecture & Engineering | 8 (100.0%) | 0 (0.0%) |
| Life, Physical & Social Science | 9 (100.0%) | 0 (0.0%) |
| Community & Social Service | 69 (48.9%) | 72 (51.1%) |
| Education, Arts & Media | 13 (100.0%) | 0 (0.0%) |
| Legal Services & Support | 42 (100.0%) | 0 (0.0%) |
| Education Instruction & Library | 14 (18.9%) | 60 (81.1%) |
| Arts, Media & Entertainment | 0 (0.0%) | 12 (100.0%) |
| Health Diagnosing & Treating | 13 (7.7%) | 155 (92.3%) |
| Health Technologists | 0 (0.0%) | 131 (100.0%) |
| Total (Category) | 278 (31.8%) | 596 (68.2%) |
| Total (Overall) | 1,043 (42.1%) | 1,434 (57.9%) |
Services Occupations
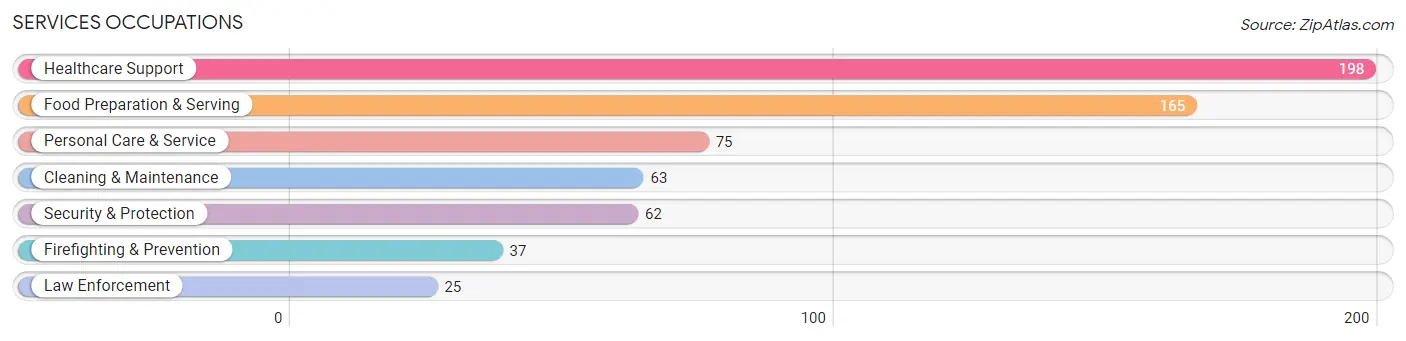
The most common Services occupations in Platte City are Healthcare Support (198 | 8.0%), Food Preparation & Serving (165 | 6.7%), Personal Care & Service (75 | 3.0%), Cleaning & Maintenance (63 | 2.5%), and Security & Protection (62 | 2.5%).
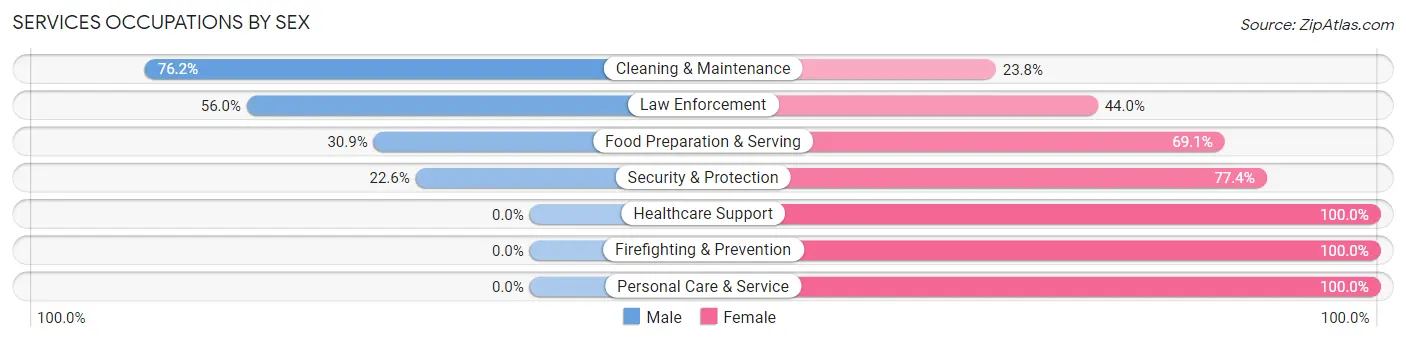
Services Occupations by Sex
Within the Services occupations in Platte City, the most male-oriented occupations are Cleaning & Maintenance (76.2%), Law Enforcement (56.0%), and Food Preparation & Serving (30.9%), while the most female-oriented occupations are Healthcare Support (100.0%), Firefighting & Prevention (100.0%), and Personal Care & Service (100.0%).
| Occupation | Male | Female |
| Healthcare Support | 0 (0.0%) | 198 (100.0%) |
| Security & Protection | 14 (22.6%) | 48 (77.4%) |
| Firefighting & Prevention | 0 (0.0%) | 37 (100.0%) |
| Law Enforcement | 14 (56.0%) | 11 (44.0%) |
| Food Preparation & Serving | 51 (30.9%) | 114 (69.1%) |
| Cleaning & Maintenance | 48 (76.2%) | 15 (23.8%) |
| Personal Care & Service | 0 (0.0%) | 75 (100.0%) |
| Total (Category) | 113 (20.1%) | 450 (79.9%) |
| Total (Overall) | 1,043 (42.1%) | 1,434 (57.9%) |
Sales and Office Occupations
The most common Sales and Office occupations in Platte City are Office & Administration (191 | 7.7%), and Sales & Related (75 | 3.0%).
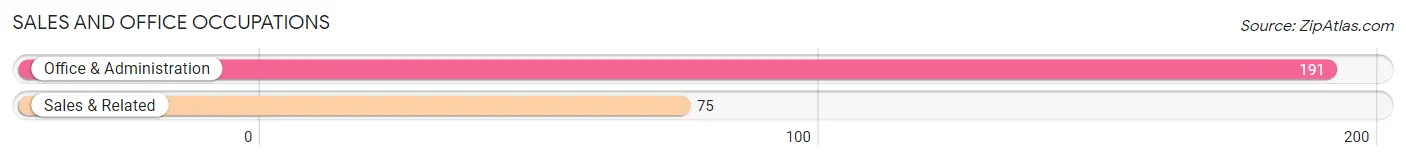
Sales and Office Occupations by Sex

| Occupation | Male | Female |
| Sales & Related | 47 (62.7%) | 28 (37.3%) |
| Office & Administration | 33 (17.3%) | 158 (82.7%) |
| Total (Category) | 80 (30.1%) | 186 (69.9%) |
| Total (Overall) | 1,043 (42.1%) | 1,434 (57.9%) |
Natural Resources, Construction and Maintenance Occupations
The most common Natural Resources, Construction and Maintenance occupations in Platte City are Installation, Maintenance & Repair (89 | 3.6%), Construction & Extraction (48 | 1.9%), and Farming, Fishing & Forestry (16 | 0.6%).
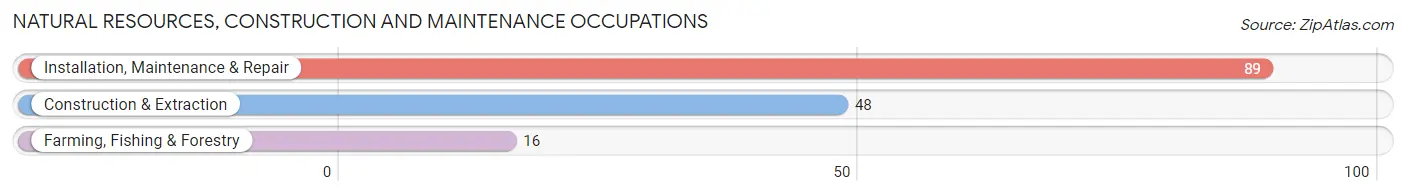
Natural Resources, Construction and Maintenance Occupations by Sex
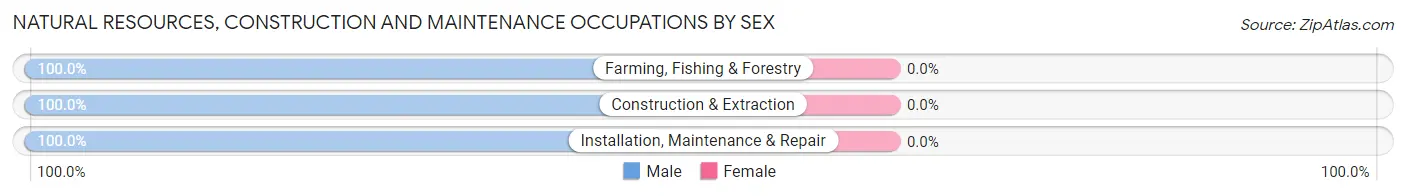
| Occupation | Male | Female |
| Farming, Fishing & Forestry | 16 (100.0%) | 0 (0.0%) |
| Construction & Extraction | 48 (100.0%) | 0 (0.0%) |
| Installation, Maintenance & Repair | 89 (100.0%) | 0 (0.0%) |
| Total (Category) | 153 (100.0%) | 0 (0.0%) |
| Total (Overall) | 1,043 (42.1%) | 1,434 (57.9%) |
Production, Transportation and Moving Occupations
The most common Production, Transportation and Moving occupations in Platte City are Transportation (353 | 14.2%), Material Moving (170 | 6.9%), and Production (98 | 4.0%).
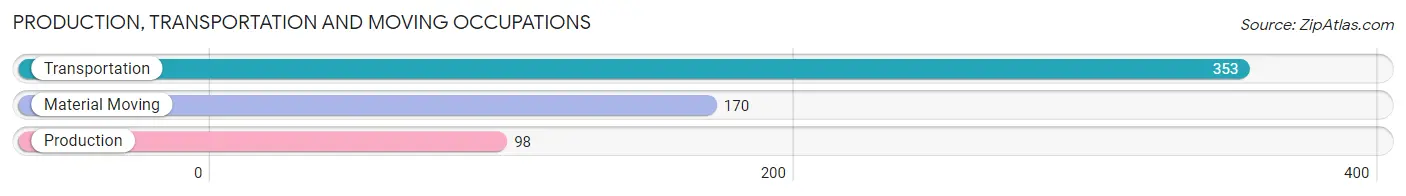
Production, Transportation and Moving Occupations by Sex
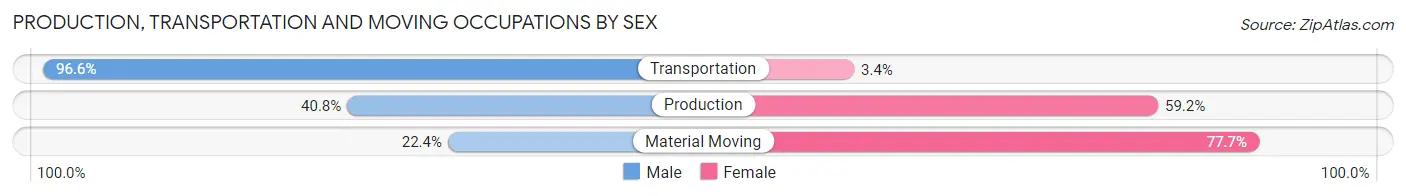
| Occupation | Male | Female |
| Production | 40 (40.8%) | 58 (59.2%) |
| Transportation | 341 (96.6%) | 12 (3.4%) |
| Material Moving | 38 (22.4%) | 132 (77.6%) |
| Total (Category) | 419 (67.5%) | 202 (32.5%) |
| Total (Overall) | 1,043 (42.1%) | 1,434 (57.9%) |
Employment Industries by Sex in Platte City
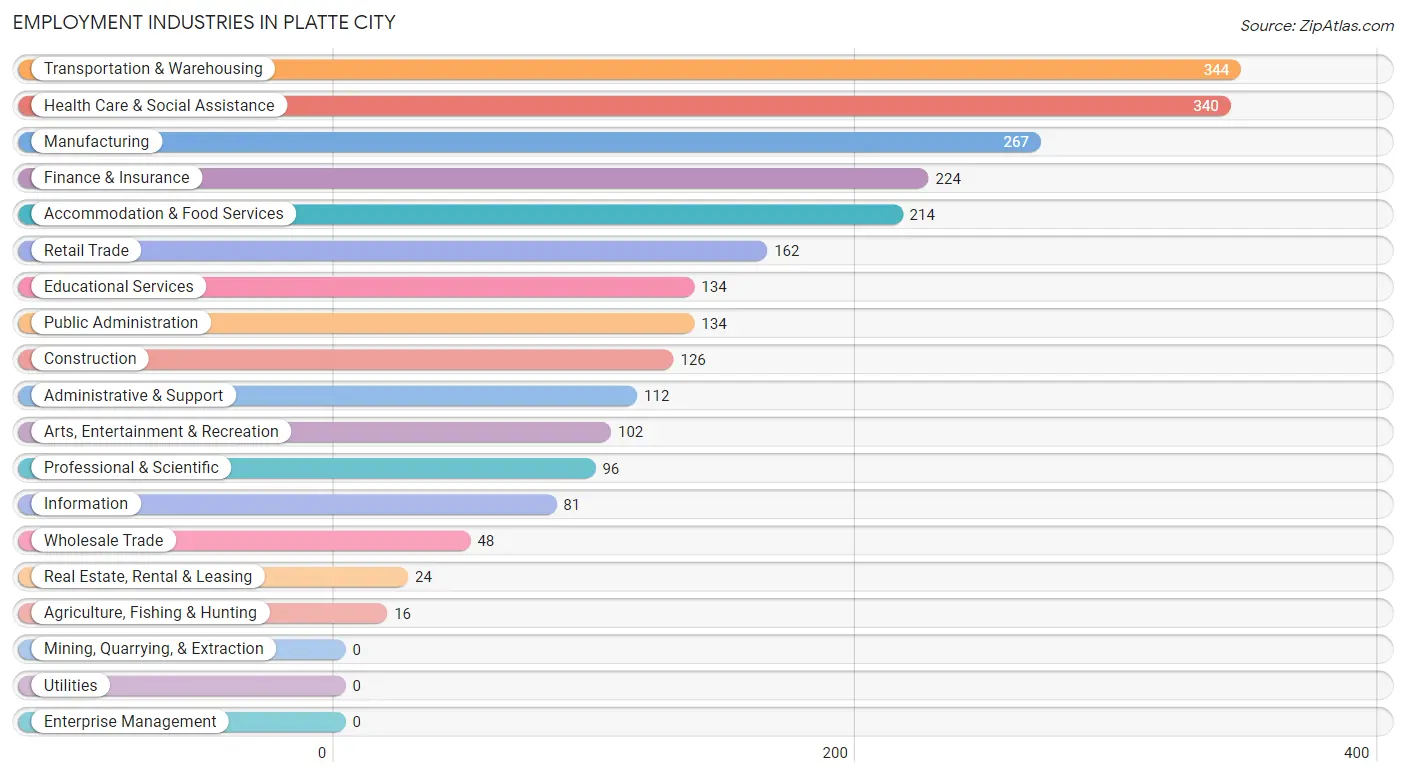
Employment Industries in Platte City
The major employment industries in Platte City include Transportation & Warehousing (344 | 13.9%), Health Care & Social Assistance (340 | 13.7%), Manufacturing (267 | 10.8%), Finance & Insurance (224 | 9.0%), and Accommodation & Food Services (214 | 8.6%).
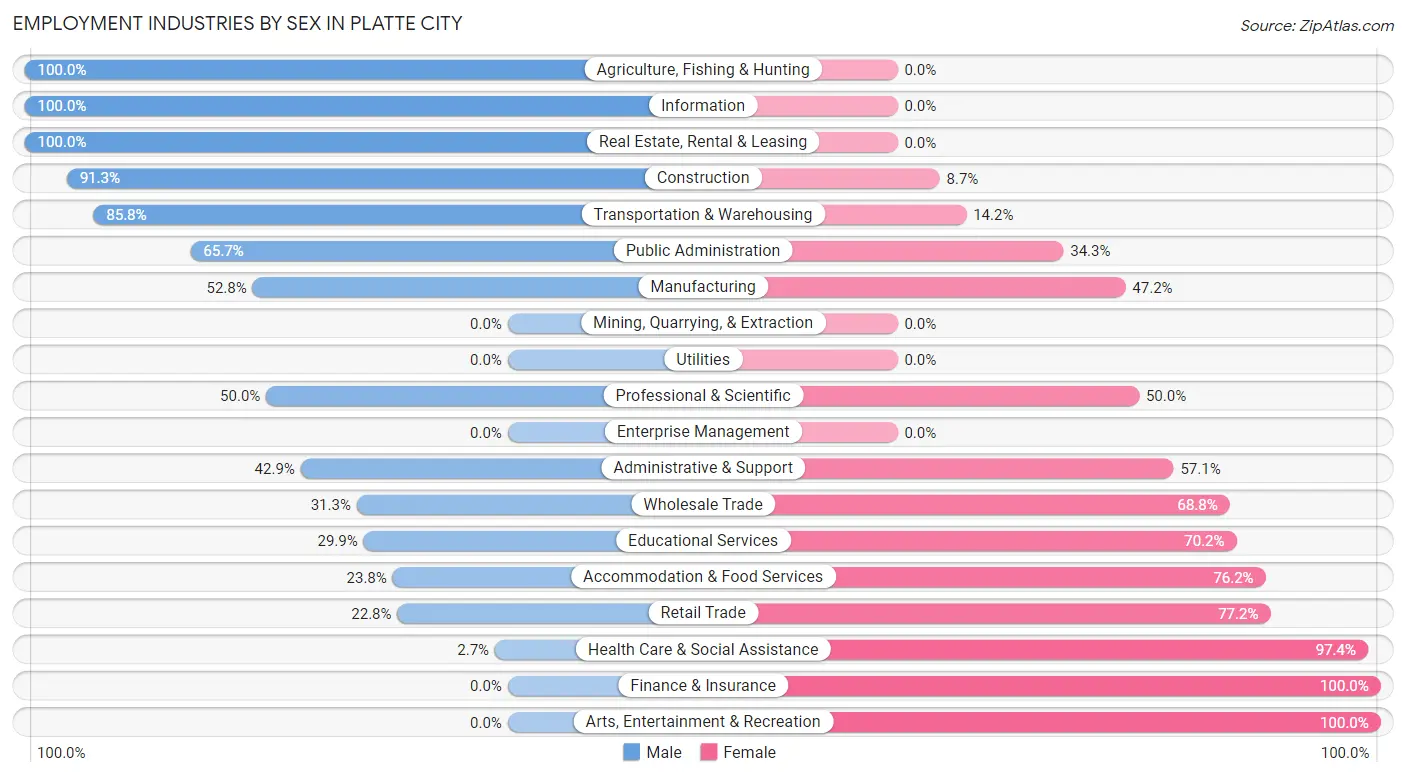
Employment Industries by Sex in Platte City
The Platte City industries that see more men than women are Agriculture, Fishing & Hunting (100.0%), Information (100.0%), and Real Estate, Rental & Leasing (100.0%), whereas the industries that tend to have a higher number of women are Finance & Insurance (100.0%), Arts, Entertainment & Recreation (100.0%), and Health Care & Social Assistance (97.4%).
| Industry | Male | Female |
| Agriculture, Fishing & Hunting | 16 (100.0%) | 0 (0.0%) |
| Mining, Quarrying, & Extraction | 0 (0.0%) | 0 (0.0%) |
| Construction | 115 (91.3%) | 11 (8.7%) |
| Manufacturing | 141 (52.8%) | 126 (47.2%) |
| Wholesale Trade | 15 (31.2%) | 33 (68.8%) |
| Retail Trade | 37 (22.8%) | 125 (77.2%) |
| Transportation & Warehousing | 295 (85.8%) | 49 (14.2%) |
| Utilities | 0 (0.0%) | 0 (0.0%) |
| Information | 81 (100.0%) | 0 (0.0%) |
| Finance & Insurance | 0 (0.0%) | 224 (100.0%) |
| Real Estate, Rental & Leasing | 24 (100.0%) | 0 (0.0%) |
| Professional & Scientific | 48 (50.0%) | 48 (50.0%) |
| Enterprise Management | 0 (0.0%) | 0 (0.0%) |
| Administrative & Support | 48 (42.9%) | 64 (57.1%) |
| Educational Services | 40 (29.8%) | 94 (70.2%) |
| Health Care & Social Assistance | 9 (2.6%) | 331 (97.4%) |
| Arts, Entertainment & Recreation | 0 (0.0%) | 102 (100.0%) |
| Accommodation & Food Services | 51 (23.8%) | 163 (76.2%) |
| Public Administration | 88 (65.7%) | 46 (34.3%) |
| Total | 1,043 (42.1%) | 1,434 (57.9%) |
Education in Platte City
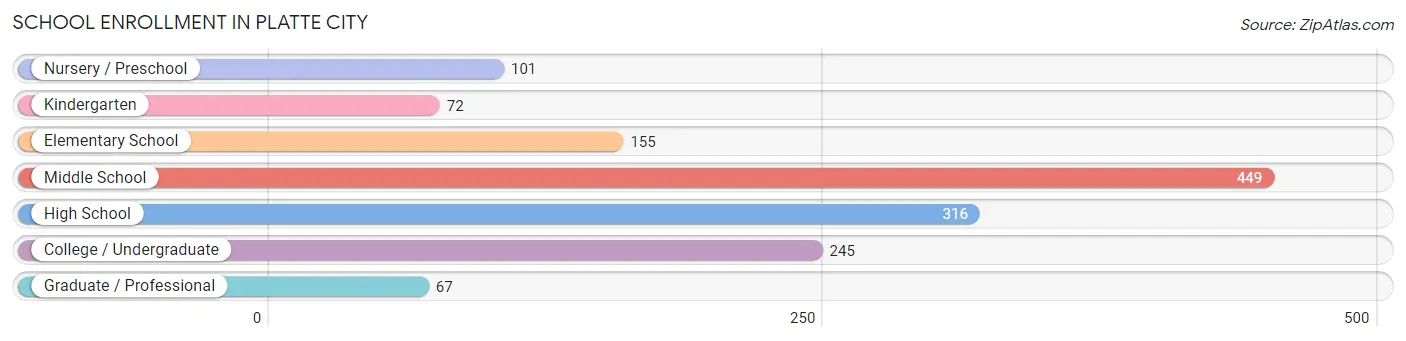
School Enrollment in Platte City
The most common levels of schooling among the 1,405 students in Platte City are middle school (449 | 32.0%), high school (316 | 22.5%), and college / undergraduate (245 | 17.4%).
| School Level | # Students | % Students |
| Nursery / Preschool | 101 | 7.2% |
| Kindergarten | 72 | 5.1% |
| Elementary School | 155 | 11.0% |
| Middle School | 449 | 32.0% |
| High School | 316 | 22.5% |
| College / Undergraduate | 245 | 17.4% |
| Graduate / Professional | 67 | 4.8% |
| Total | 1,405 | 100.0% |
School Enrollment by Age by Funding Source in Platte City
Out of a total of 1,405 students who are enrolled in schools in Platte City, 261 (18.6%) attend a private institution, while the remaining 1,144 (81.4%) are enrolled in public schools. The age group of 25 to 34 year olds has the highest likelihood of being enrolled in private schools, with 41 (43.6% in the age bracket) enrolled. Conversely, the age group of 3 to 4 year olds has the lowest likelihood of being enrolled in a private school, with 36 (100.0% in the age bracket) attending a public institution.
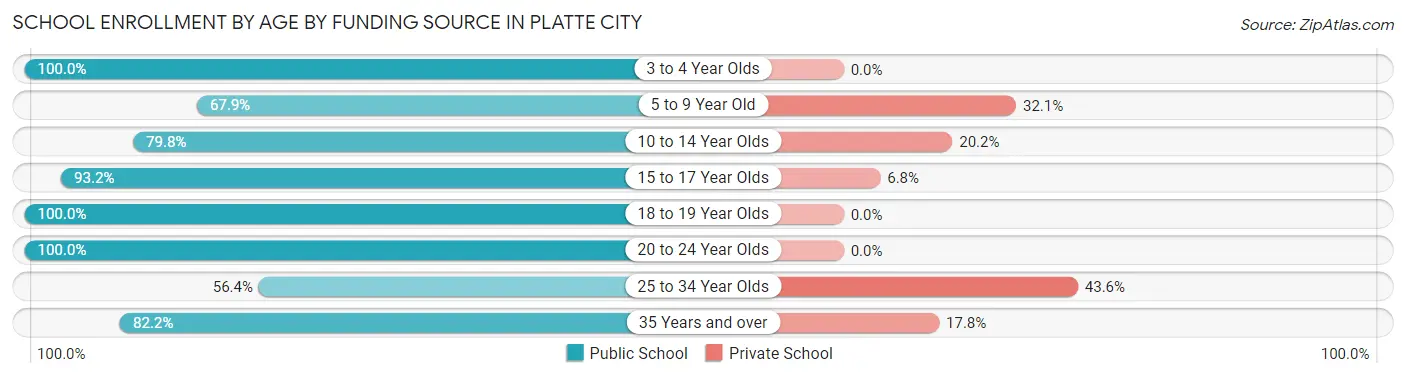
| Age Bracket | Public School | Private School |
| 3 to 4 Year Olds | 36 (100.0%) | 0 (0.0%) |
| 5 to 9 Year Old | 167 (67.9%) | 79 (32.1%) |
| 10 to 14 Year Olds | 422 (79.8%) | 107 (20.2%) |
| 15 to 17 Year Olds | 246 (93.2%) | 18 (6.8%) |
| 18 to 19 Year Olds | 45 (100.0%) | 0 (0.0%) |
| 20 to 24 Year Olds | 101 (100.0%) | 0 (0.0%) |
| 25 to 34 Year Olds | 53 (56.4%) | 41 (43.6%) |
| 35 Years and over | 74 (82.2%) | 16 (17.8%) |
| Total | 1,144 (81.4%) | 261 (18.6%) |
Educational Attainment by Field of Study in Platte City
Science & technology (149 | 19.4%), business (139 | 18.1%), psychology (104 | 13.6%), arts & humanities (99 | 12.9%), and education (95 | 12.4%) are the most common fields of study among 767 individuals in Platte City who have obtained a bachelor's degree or higher.
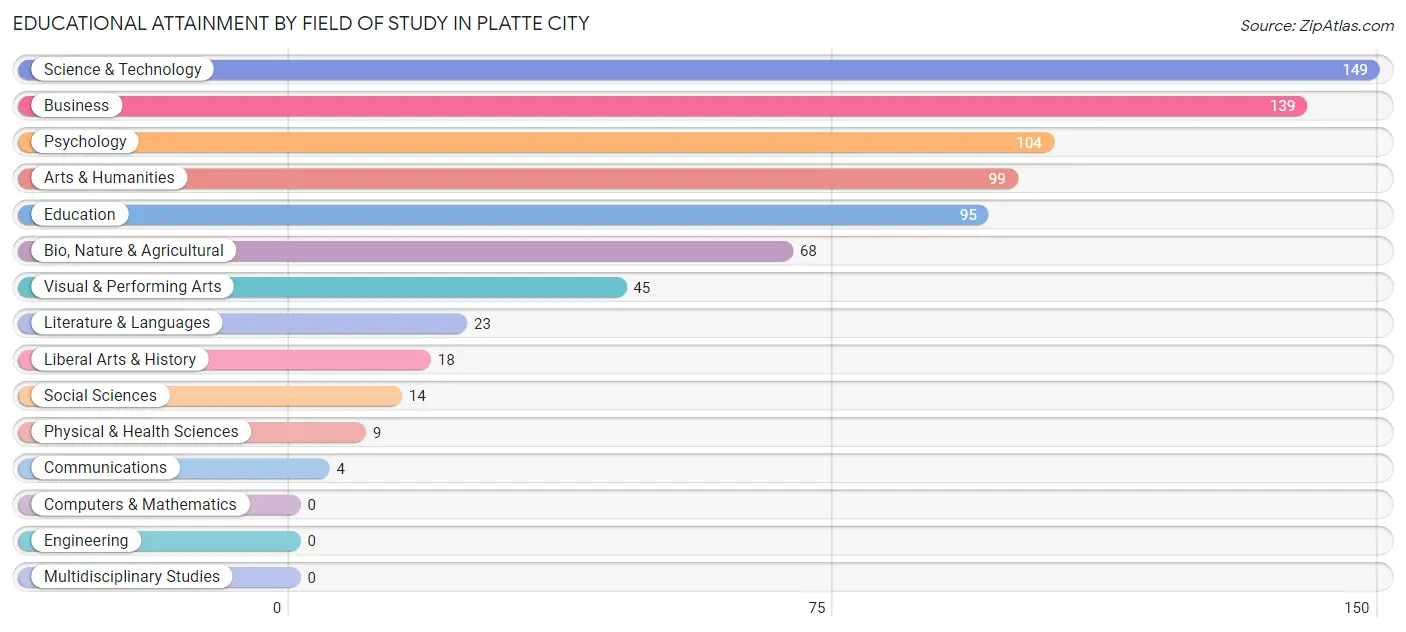
| Field of Study | # Graduates | % Graduates |
| Computers & Mathematics | 0 | 0.0% |
| Bio, Nature & Agricultural | 68 | 8.9% |
| Physical & Health Sciences | 9 | 1.2% |
| Psychology | 104 | 13.6% |
| Social Sciences | 14 | 1.8% |
| Engineering | 0 | 0.0% |
| Multidisciplinary Studies | 0 | 0.0% |
| Science & Technology | 149 | 19.4% |
| Business | 139 | 18.1% |
| Education | 95 | 12.4% |
| Literature & Languages | 23 | 3.0% |
| Liberal Arts & History | 18 | 2.4% |
| Visual & Performing Arts | 45 | 5.9% |
| Communications | 4 | 0.5% |
| Arts & Humanities | 99 | 12.9% |
| Total | 767 | 100.0% |
Transportation & Commute in Platte City
Vehicle Availability by Sex in Platte City
The most prevalent vehicle ownership categories in Platte City are males with 2 vehicles (511, accounting for 47.0%) and females with 2 vehicles (478, making up 35.7%).
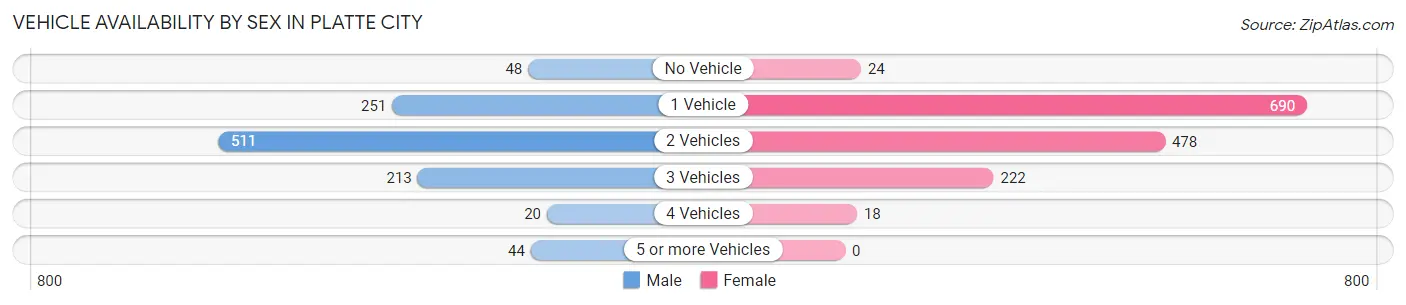
| Vehicles Available | Male | Female |
| No Vehicle | 48 (4.4%) | 24 (1.7%) |
| 1 Vehicle | 251 (23.1%) | 690 (48.2%) |
| 2 Vehicles | 511 (47.0%) | 478 (33.4%) |
| 3 Vehicles | 213 (19.6%) | 222 (15.5%) |
| 4 Vehicles | 20 (1.8%) | 18 (1.3%) |
| 5 or more Vehicles | 44 (4.1%) | 0 (0.0%) |
| Total | 1,087 (100.0%) | 1,432 (100.0%) |
Commute Time in Platte City
The most frequently occuring commute durations in Platte City are 30 to 34 minutes (410 commuters, 16.7%), 45 to 59 minutes (286 commuters, 11.7%), and 10 to 14 minutes (277 commuters, 11.3%).
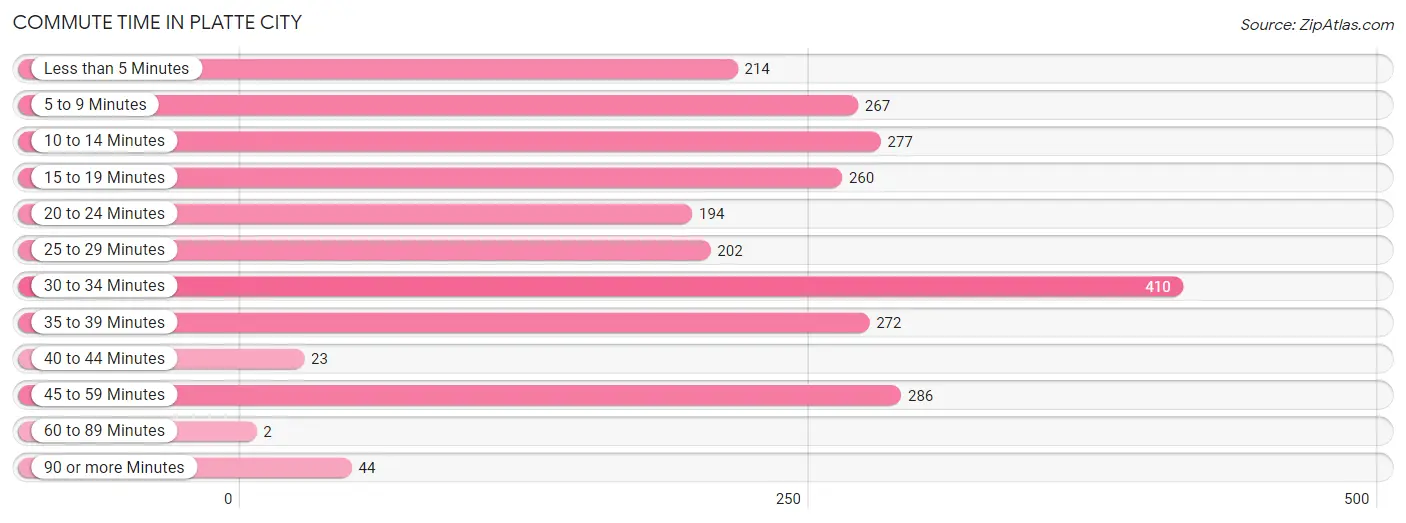
| Commute Time | # Commuters | % Commuters |
| Less than 5 Minutes | 214 | 8.7% |
| 5 to 9 Minutes | 267 | 10.9% |
| 10 to 14 Minutes | 277 | 11.3% |
| 15 to 19 Minutes | 260 | 10.6% |
| 20 to 24 Minutes | 194 | 7.9% |
| 25 to 29 Minutes | 202 | 8.2% |
| 30 to 34 Minutes | 410 | 16.7% |
| 35 to 39 Minutes | 272 | 11.1% |
| 40 to 44 Minutes | 23 | 0.9% |
| 45 to 59 Minutes | 286 | 11.7% |
| 60 to 89 Minutes | 2 | 0.1% |
| 90 or more Minutes | 44 | 1.8% |
Commute Time by Sex in Platte City
The most common commute times in Platte City are 10 to 14 minutes (196 commuters, 18.5%) for males and 30 to 34 minutes (279 commuters, 20.0%) for females.
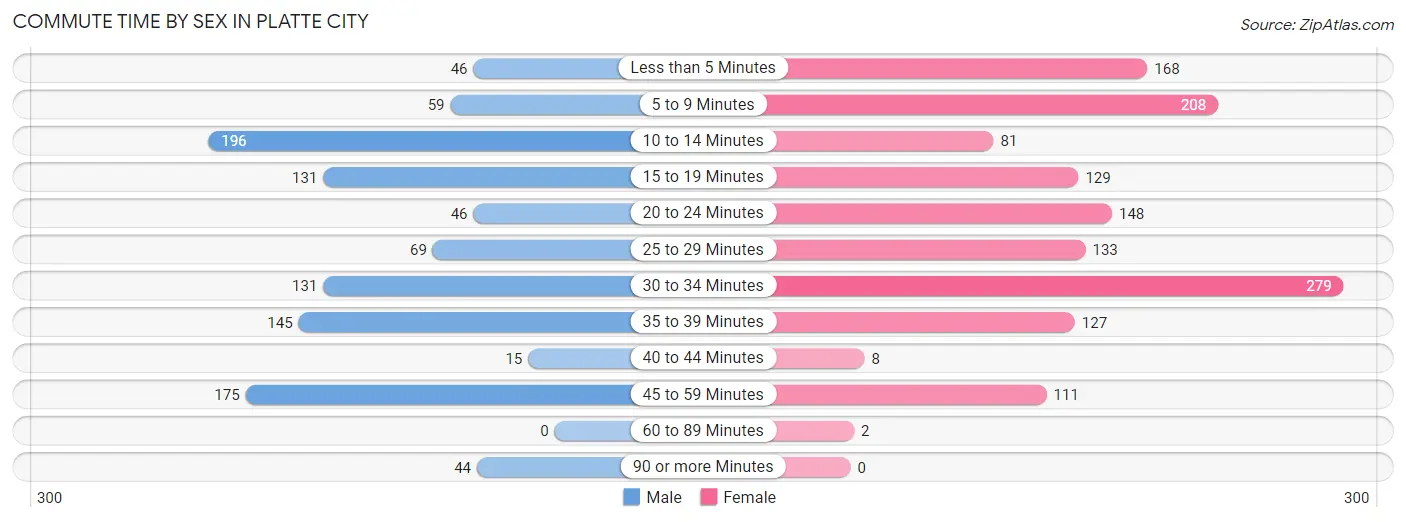
| Commute Time | Male | Female |
| Less than 5 Minutes | 46 (4.3%) | 168 (12.0%) |
| 5 to 9 Minutes | 59 (5.6%) | 208 (14.9%) |
| 10 to 14 Minutes | 196 (18.5%) | 81 (5.8%) |
| 15 to 19 Minutes | 131 (12.4%) | 129 (9.2%) |
| 20 to 24 Minutes | 46 (4.3%) | 148 (10.6%) |
| 25 to 29 Minutes | 69 (6.5%) | 133 (9.5%) |
| 30 to 34 Minutes | 131 (12.4%) | 279 (20.0%) |
| 35 to 39 Minutes | 145 (13.7%) | 127 (9.1%) |
| 40 to 44 Minutes | 15 (1.4%) | 8 (0.6%) |
| 45 to 59 Minutes | 175 (16.6%) | 111 (8.0%) |
| 60 to 89 Minutes | 0 (0.0%) | 2 (0.1%) |
| 90 or more Minutes | 44 (4.2%) | 0 (0.0%) |
Time of Departure to Work by Sex in Platte City
The most frequent times of departure to work in Platte City are 12:00 PM to 3:59 PM (173, 16.4%) for males and 6:00 AM to 6:29 AM (264, 18.9%) for females.
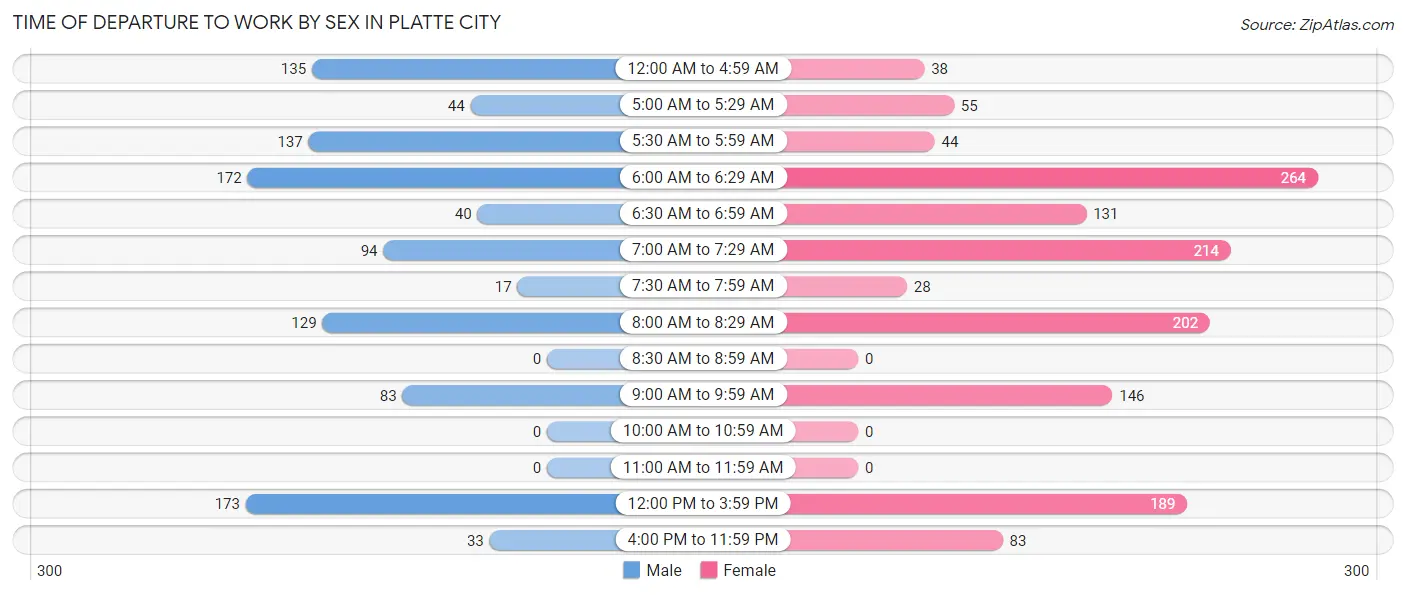
| Time of Departure | Male | Female |
| 12:00 AM to 4:59 AM | 135 (12.8%) | 38 (2.7%) |
| 5:00 AM to 5:29 AM | 44 (4.2%) | 55 (4.0%) |
| 5:30 AM to 5:59 AM | 137 (13.0%) | 44 (3.2%) |
| 6:00 AM to 6:29 AM | 172 (16.3%) | 264 (18.9%) |
| 6:30 AM to 6:59 AM | 40 (3.8%) | 131 (9.4%) |
| 7:00 AM to 7:29 AM | 94 (8.9%) | 214 (15.3%) |
| 7:30 AM to 7:59 AM | 17 (1.6%) | 28 (2.0%) |
| 8:00 AM to 8:29 AM | 129 (12.2%) | 202 (14.5%) |
| 8:30 AM to 8:59 AM | 0 (0.0%) | 0 (0.0%) |
| 9:00 AM to 9:59 AM | 83 (7.9%) | 146 (10.5%) |
| 10:00 AM to 10:59 AM | 0 (0.0%) | 0 (0.0%) |
| 11:00 AM to 11:59 AM | 0 (0.0%) | 0 (0.0%) |
| 12:00 PM to 3:59 PM | 173 (16.4%) | 189 (13.6%) |
| 4:00 PM to 11:59 PM | 33 (3.1%) | 83 (5.9%) |
| Total | 1,057 (100.0%) | 1,394 (100.0%) |
Housing Occupancy in Platte City
Occupancy by Ownership in Platte City
Of the total 1,932 dwellings in Platte City, owner-occupied units account for 950 (49.2%), while renter-occupied units make up 982 (50.8%).
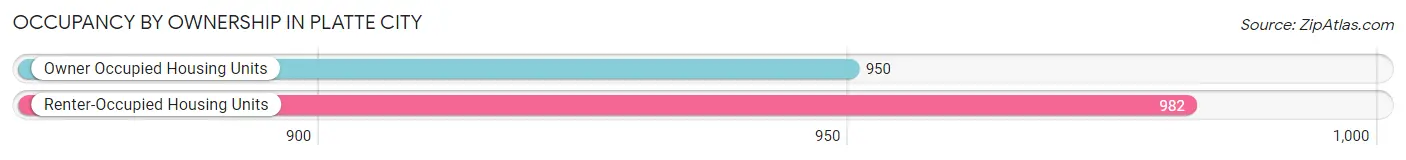
| Occupancy | # Housing Units | % Housing Units |
| Owner Occupied Housing Units | 950 | 49.2% |
| Renter-Occupied Housing Units | 982 | 50.8% |
| Total Occupied Housing Units | 1,932 | 100.0% |
Occupancy by Household Size in Platte City
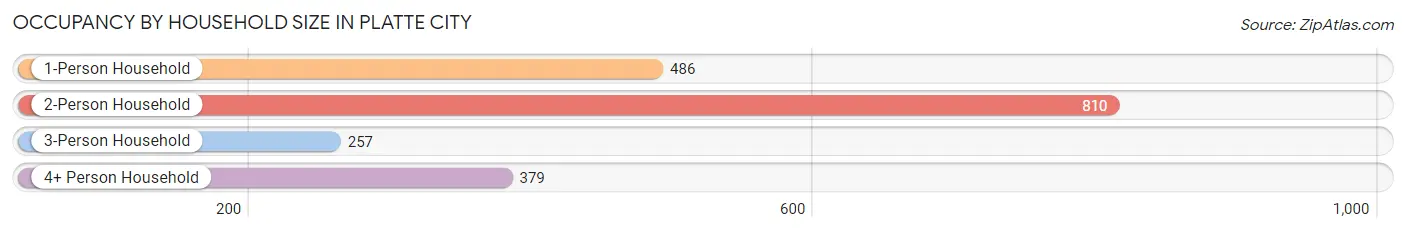
| Household Size | # Housing Units | % Housing Units |
| 1-Person Household | 486 | 25.2% |
| 2-Person Household | 810 | 41.9% |
| 3-Person Household | 257 | 13.3% |
| 4+ Person Household | 379 | 19.6% |
| Total Housing Units | 1,932 | 100.0% |
Occupancy by Ownership by Household Size in Platte City
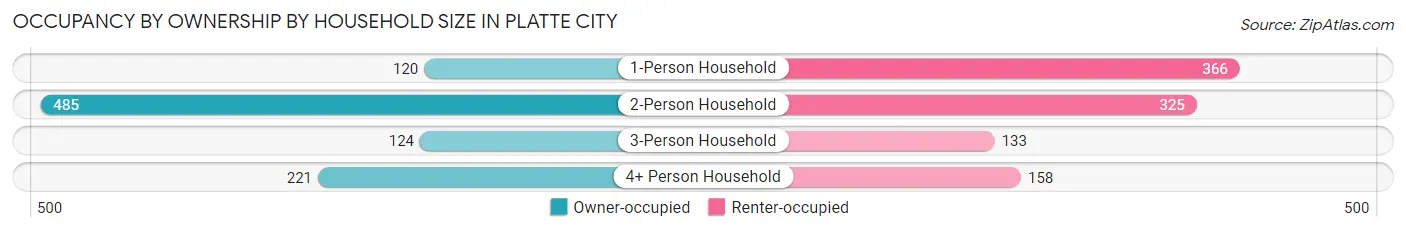
| Household Size | Owner-occupied | Renter-occupied |
| 1-Person Household | 120 (24.7%) | 366 (75.3%) |
| 2-Person Household | 485 (59.9%) | 325 (40.1%) |
| 3-Person Household | 124 (48.2%) | 133 (51.7%) |
| 4+ Person Household | 221 (58.3%) | 158 (41.7%) |
| Total Housing Units | 950 (49.2%) | 982 (50.8%) |
Occupancy by Educational Attainment in Platte City
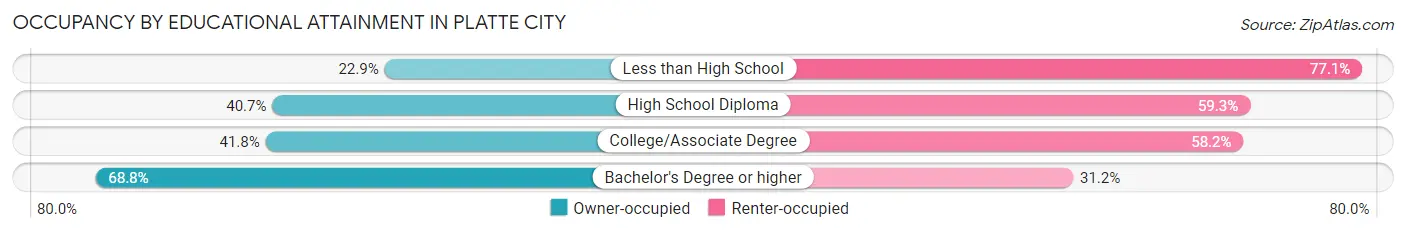
| Household Size | Owner-occupied | Renter-occupied |
| Less than High School | 11 (22.9%) | 37 (77.1%) |
| High School Diploma | 241 (40.7%) | 351 (59.3%) |
| College/Associate Degree | 295 (41.8%) | 411 (58.2%) |
| Bachelor's Degree or higher | 403 (68.8%) | 183 (31.2%) |
Occupancy by Age of Householder in Platte City
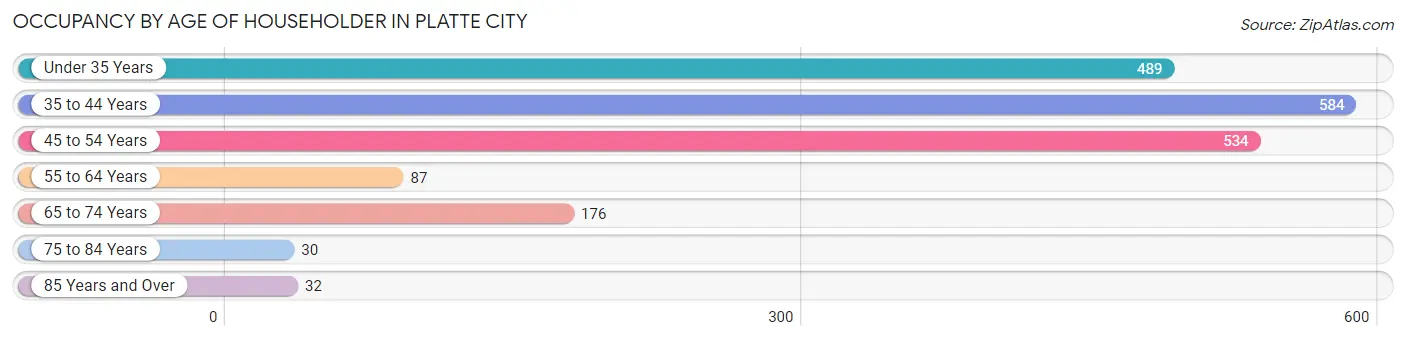
| Age Bracket | # Households | % Households |
| Under 35 Years | 489 | 25.3% |
| 35 to 44 Years | 584 | 30.2% |
| 45 to 54 Years | 534 | 27.6% |
| 55 to 64 Years | 87 | 4.5% |
| 65 to 74 Years | 176 | 9.1% |
| 75 to 84 Years | 30 | 1.5% |
| 85 Years and Over | 32 | 1.7% |
| Total | 1,932 | 100.0% |
Housing Finances in Platte City
Median Income by Occupancy in Platte City
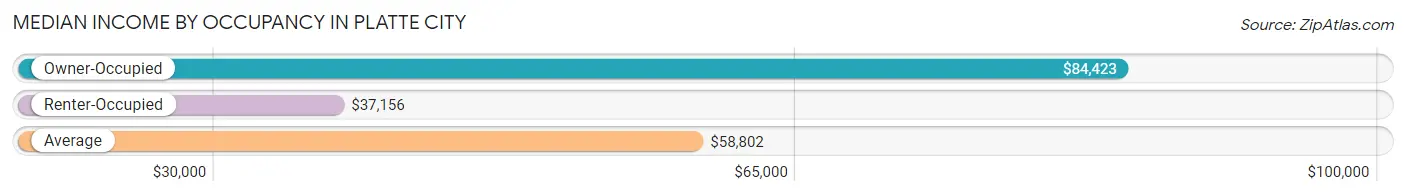
| Occupancy Type | # Households | Median Income |
| Owner-Occupied | 950 (49.2%) | $84,423 |
| Renter-Occupied | 982 (50.8%) | $37,156 |
| Average | 1,932 (100.0%) | $58,802 |
Occupancy by Householder Income Bracket in Platte City
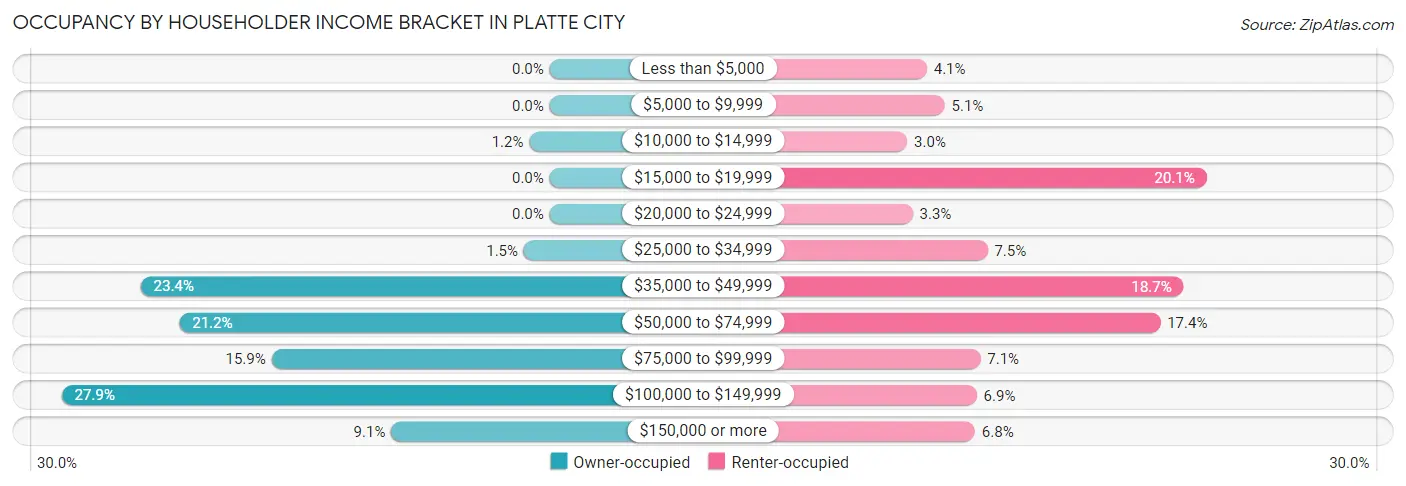
| Income Bracket | Owner-occupied | Renter-occupied |
| Less than $5,000 | 0 (0.0%) | 40 (4.1%) |
| $5,000 to $9,999 | 0 (0.0%) | 50 (5.1%) |
| $10,000 to $14,999 | 11 (1.2%) | 29 (2.9%) |
| $15,000 to $19,999 | 0 (0.0%) | 197 (20.1%) |
| $20,000 to $24,999 | 0 (0.0%) | 32 (3.3%) |
| $25,000 to $34,999 | 14 (1.5%) | 74 (7.5%) |
| $35,000 to $49,999 | 222 (23.4%) | 184 (18.7%) |
| $50,000 to $74,999 | 201 (21.2%) | 171 (17.4%) |
| $75,000 to $99,999 | 151 (15.9%) | 70 (7.1%) |
| $100,000 to $149,999 | 265 (27.9%) | 68 (6.9%) |
| $150,000 or more | 86 (9.0%) | 67 (6.8%) |
| Total | 950 (100.0%) | 982 (100.0%) |
Monthly Housing Cost Tiers in Platte City
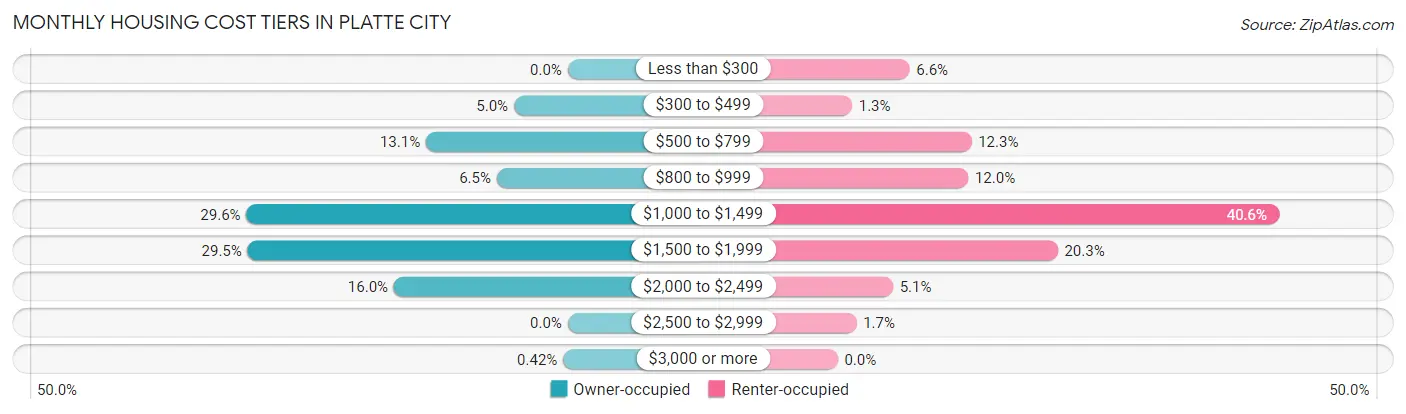
| Monthly Cost | Owner-occupied | Renter-occupied |
| Less than $300 | 0 (0.0%) | 65 (6.6%) |
| $300 to $499 | 47 (5.0%) | 13 (1.3%) |
| $500 to $799 | 124 (13.1%) | 121 (12.3%) |
| $800 to $999 | 62 (6.5%) | 118 (12.0%) |
| $1,000 to $1,499 | 281 (29.6%) | 399 (40.6%) |
| $1,500 to $1,999 | 280 (29.5%) | 199 (20.3%) |
| $2,000 to $2,499 | 152 (16.0%) | 50 (5.1%) |
| $2,500 to $2,999 | 0 (0.0%) | 17 (1.7%) |
| $3,000 or more | 4 (0.4%) | 0 (0.0%) |
| Total | 950 (100.0%) | 982 (100.0%) |
Physical Housing Characteristics in Platte City
Housing Structures in Platte City
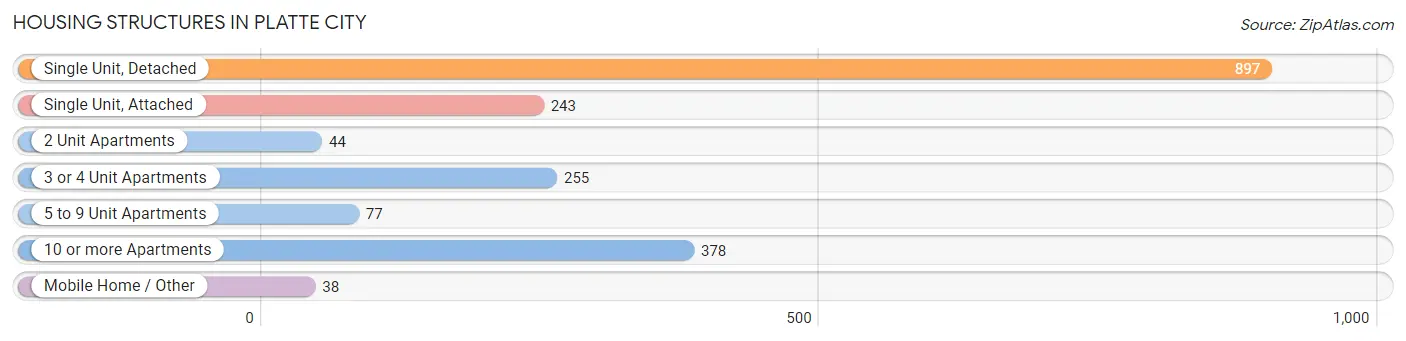
| Structure Type | # Housing Units | % Housing Units |
| Single Unit, Detached | 897 | 46.4% |
| Single Unit, Attached | 243 | 12.6% |
| 2 Unit Apartments | 44 | 2.3% |
| 3 or 4 Unit Apartments | 255 | 13.2% |
| 5 to 9 Unit Apartments | 77 | 4.0% |
| 10 or more Apartments | 378 | 19.6% |
| Mobile Home / Other | 38 | 2.0% |
| Total | 1,932 | 100.0% |
Housing Structures by Occupancy in Platte City
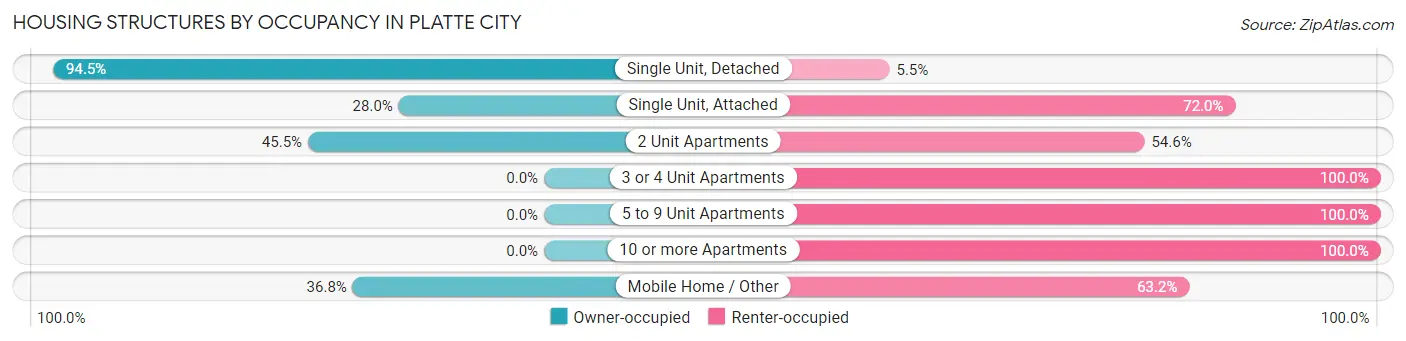
| Structure Type | Owner-occupied | Renter-occupied |
| Single Unit, Detached | 848 (94.5%) | 49 (5.5%) |
| Single Unit, Attached | 68 (28.0%) | 175 (72.0%) |
| 2 Unit Apartments | 20 (45.5%) | 24 (54.5%) |
| 3 or 4 Unit Apartments | 0 (0.0%) | 255 (100.0%) |
| 5 to 9 Unit Apartments | 0 (0.0%) | 77 (100.0%) |
| 10 or more Apartments | 0 (0.0%) | 378 (100.0%) |
| Mobile Home / Other | 14 (36.8%) | 24 (63.2%) |
| Total | 950 (49.2%) | 982 (50.8%) |
Housing Structures by Number of Rooms in Platte City
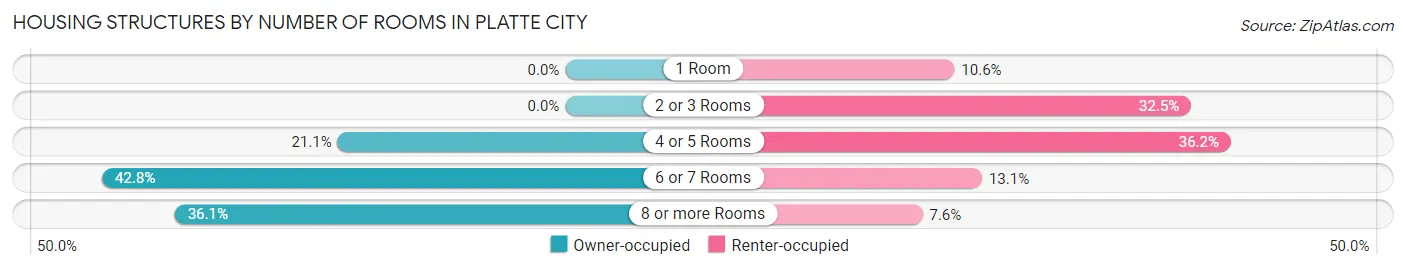
| Number of Rooms | Owner-occupied | Renter-occupied |
| 1 Room | 0 (0.0%) | 104 (10.6%) |
| 2 or 3 Rooms | 0 (0.0%) | 319 (32.5%) |
| 4 or 5 Rooms | 200 (21.0%) | 355 (36.1%) |
| 6 or 7 Rooms | 407 (42.8%) | 129 (13.1%) |
| 8 or more Rooms | 343 (36.1%) | 75 (7.6%) |
| Total | 950 (100.0%) | 982 (100.0%) |
Housing Structure by Heating Type in Platte City
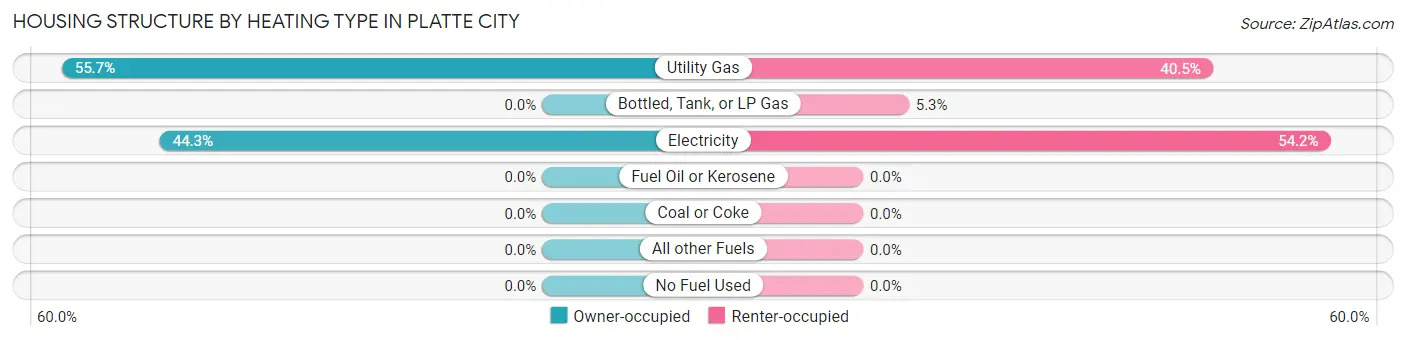
| Heating Type | Owner-occupied | Renter-occupied |
| Utility Gas | 529 (55.7%) | 398 (40.5%) |
| Bottled, Tank, or LP Gas | 0 (0.0%) | 52 (5.3%) |
| Electricity | 421 (44.3%) | 532 (54.2%) |
| Fuel Oil or Kerosene | 0 (0.0%) | 0 (0.0%) |
| Coal or Coke | 0 (0.0%) | 0 (0.0%) |
| All other Fuels | 0 (0.0%) | 0 (0.0%) |
| No Fuel Used | 0 (0.0%) | 0 (0.0%) |
| Total | 950 (100.0%) | 982 (100.0%) |
Household Vehicle Usage in Platte City
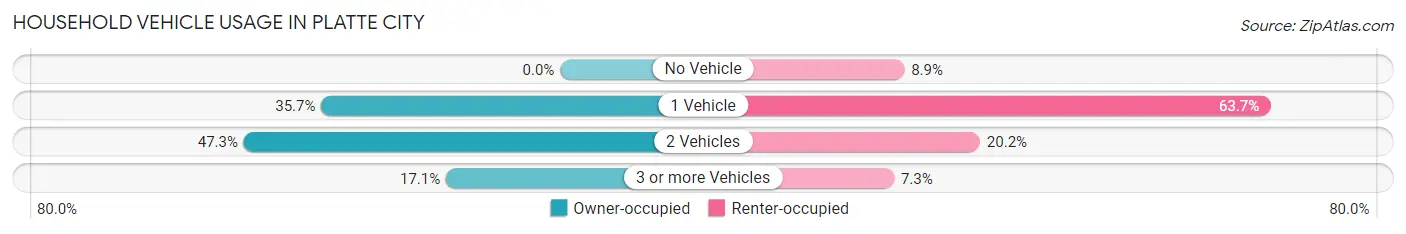
| Vehicles per Household | Owner-occupied | Renter-occupied |
| No Vehicle | 0 (0.0%) | 87 (8.9%) |
| 1 Vehicle | 339 (35.7%) | 625 (63.6%) |
| 2 Vehicles | 449 (47.3%) | 198 (20.2%) |
| 3 or more Vehicles | 162 (17.1%) | 72 (7.3%) |
| Total | 950 (100.0%) | 982 (100.0%) |
Real Estate & Mortgages in Platte City
Real Estate and Mortgage Overview in Platte City
| Characteristic | Without Mortgage | With Mortgage |
| Housing Units | 160 | 790 |
| Median Property Value | $204,500 | $198,500 |
| Median Household Income | $66,143 | $86 |
| Monthly Housing Costs | $567 | $4 |
| Real Estate Taxes | $2,446 | $0 |
Property Value by Mortgage Status in Platte City
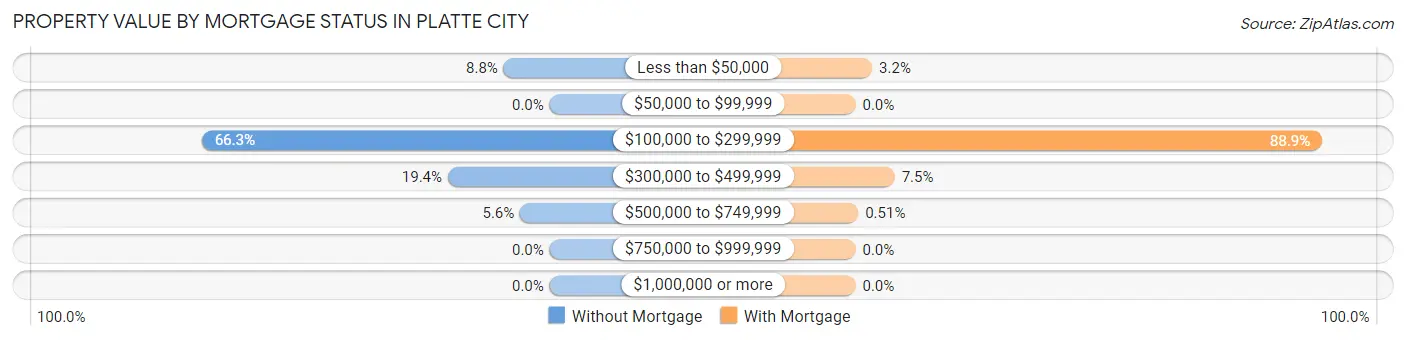
| Property Value | Without Mortgage | With Mortgage |
| Less than $50,000 | 14 (8.7%) | 25 (3.2%) |
| $50,000 to $99,999 | 0 (0.0%) | 0 (0.0%) |
| $100,000 to $299,999 | 106 (66.2%) | 702 (88.9%) |
| $300,000 to $499,999 | 31 (19.4%) | 59 (7.5%) |
| $500,000 to $749,999 | 9 (5.6%) | 4 (0.5%) |
| $750,000 to $999,999 | 0 (0.0%) | 0 (0.0%) |
| $1,000,000 or more | 0 (0.0%) | 0 (0.0%) |
| Total | 160 (100.0%) | 790 (100.0%) |
Household Income by Mortgage Status in Platte City
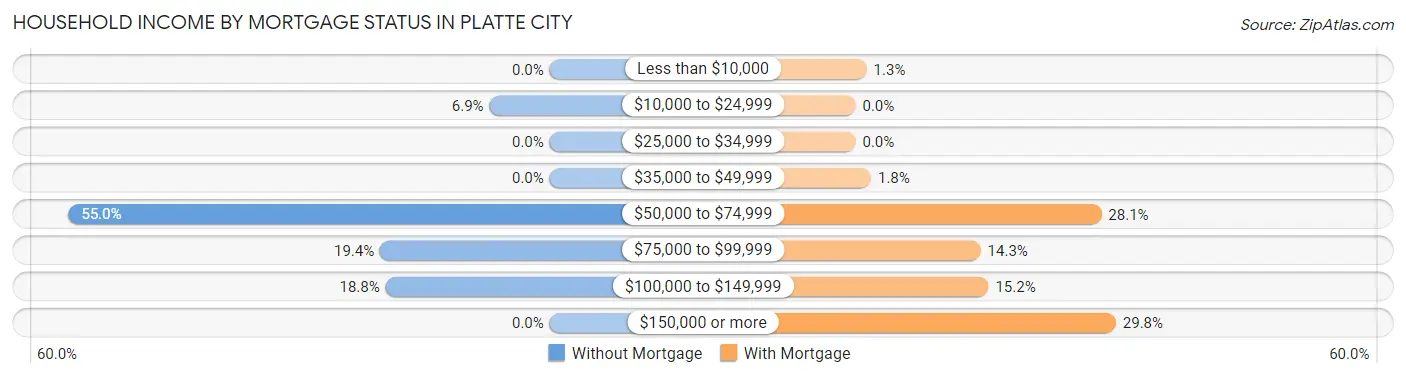
| Household Income | Without Mortgage | With Mortgage |
| Less than $10,000 | 0 (0.0%) | 10 (1.3%) |
| $10,000 to $24,999 | 11 (6.9%) | 0 (0.0%) |
| $25,000 to $34,999 | 0 (0.0%) | 0 (0.0%) |
| $35,000 to $49,999 | 0 (0.0%) | 14 (1.8%) |
| $50,000 to $74,999 | 88 (55.0%) | 222 (28.1%) |
| $75,000 to $99,999 | 31 (19.4%) | 113 (14.3%) |
| $100,000 to $149,999 | 30 (18.8%) | 120 (15.2%) |
| $150,000 or more | 0 (0.0%) | 235 (29.7%) |
| Total | 160 (100.0%) | 790 (100.0%) |
Property Value to Household Income Ratio in Platte City
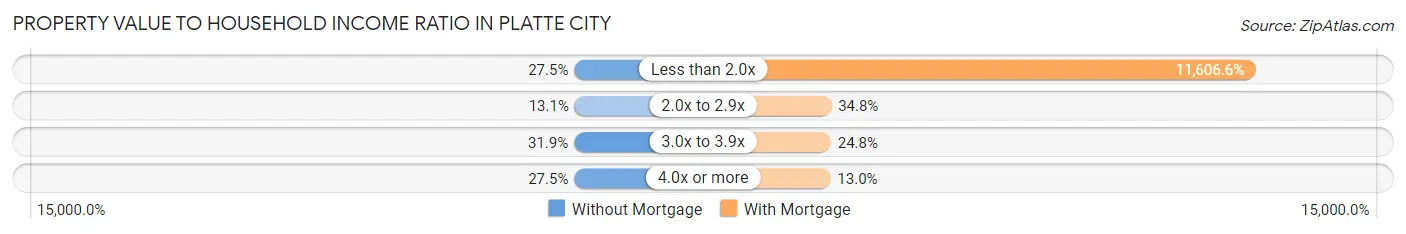
| Value-to-Income Ratio | Without Mortgage | With Mortgage |
| Less than 2.0x | 44 (27.5%) | 91,692 (11,606.6%) |
| 2.0x to 2.9x | 21 (13.1%) | 275 (34.8%) |
| 3.0x to 3.9x | 51 (31.9%) | 196 (24.8%) |
| 4.0x or more | 44 (27.5%) | 103 (13.0%) |
| Total | 160 (100.0%) | 790 (100.0%) |
Real Estate Taxes by Mortgage Status in Platte City
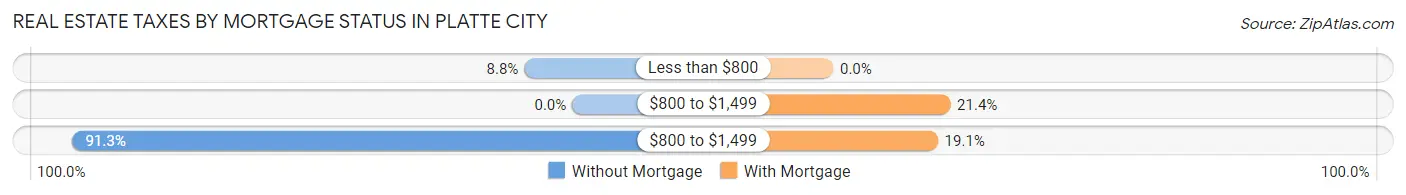
| Property Taxes | Without Mortgage | With Mortgage |
| Less than $800 | 14 (8.7%) | 0 (0.0%) |
| $800 to $1,499 | 0 (0.0%) | 169 (21.4%) |
| $800 to $1,499 | 146 (91.2%) | 151 (19.1%) |
| Total | 160 (100.0%) | 790 (100.0%) |
Health & Disability in Platte City
Health Insurance Coverage by Age in Platte City
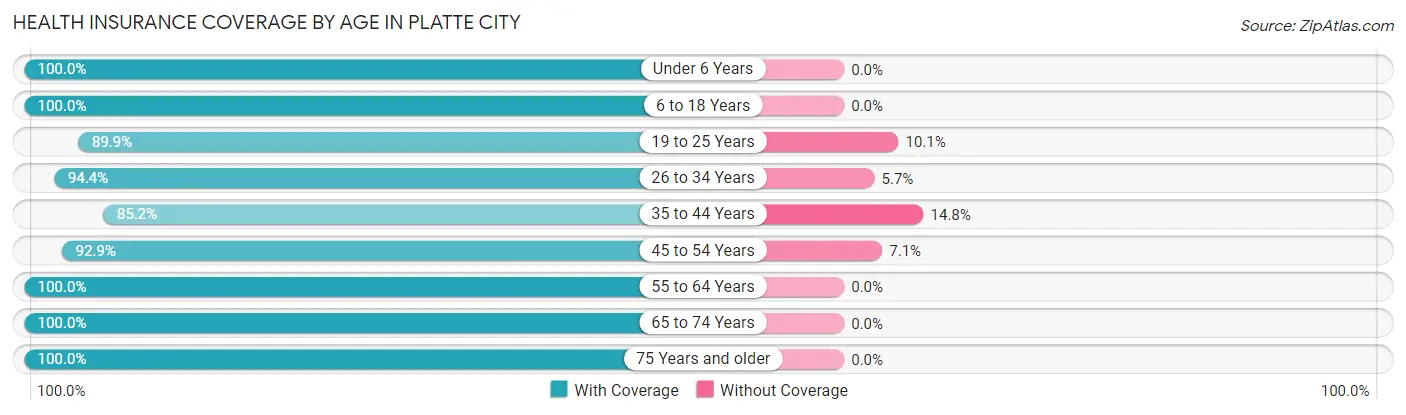
| Age Bracket | With Coverage | Without Coverage |
| Under 6 Years | 416 (100.0%) | 0 (0.0%) |
| 6 to 18 Years | 963 (100.0%) | 0 (0.0%) |
| 19 to 25 Years | 613 (89.9%) | 69 (10.1%) |
| 26 to 34 Years | 317 (94.4%) | 19 (5.7%) |
| 35 to 44 Years | 605 (85.2%) | 105 (14.8%) |
| 45 to 54 Years | 642 (92.9%) | 49 (7.1%) |
| 55 to 64 Years | 283 (100.0%) | 0 (0.0%) |
| 65 to 74 Years | 308 (100.0%) | 0 (0.0%) |
| 75 Years and older | 99 (100.0%) | 0 (0.0%) |
| Total | 4,246 (94.6%) | 242 (5.4%) |
Health Insurance Coverage by Citizenship Status in Platte City
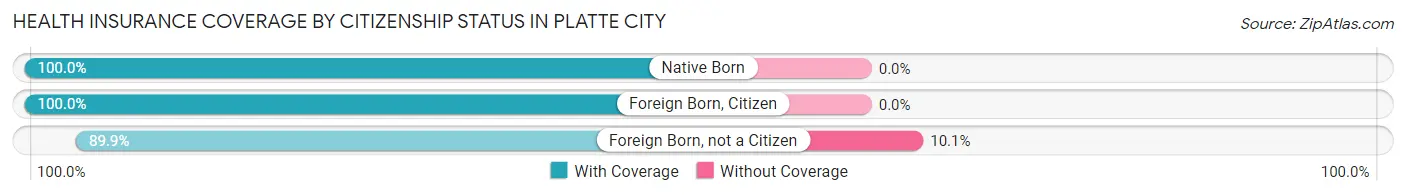
| Citizenship Status | With Coverage | Without Coverage |
| Native Born | 416 (100.0%) | 0 (0.0%) |
| Foreign Born, Citizen | 963 (100.0%) | 0 (0.0%) |
| Foreign Born, not a Citizen | 613 (89.9%) | 69 (10.1%) |
Health Insurance Coverage by Household Income in Platte City
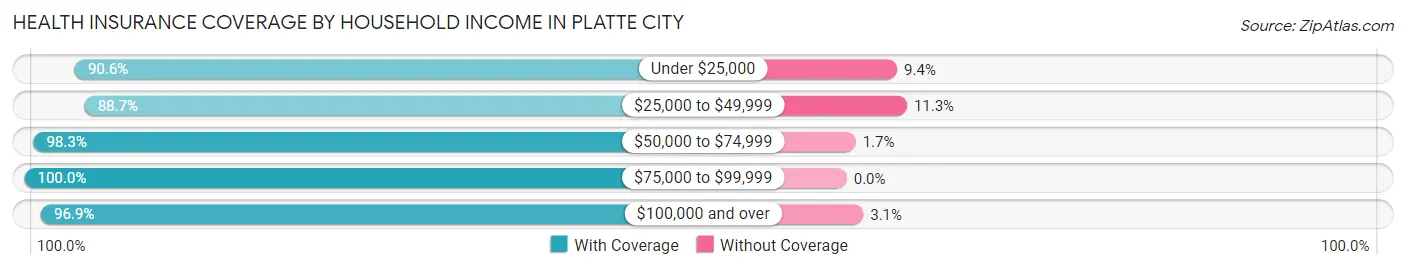
| Household Income | With Coverage | Without Coverage |
| Under $25,000 | 470 (90.6%) | 49 (9.4%) |
| $25,000 to $49,999 | 1,047 (88.7%) | 133 (11.3%) |
| $50,000 to $74,999 | 826 (98.3%) | 14 (1.7%) |
| $75,000 to $99,999 | 513 (100.0%) | 0 (0.0%) |
| $100,000 and over | 1,382 (96.9%) | 44 (3.1%) |
Public vs Private Health Insurance Coverage by Age in Platte City
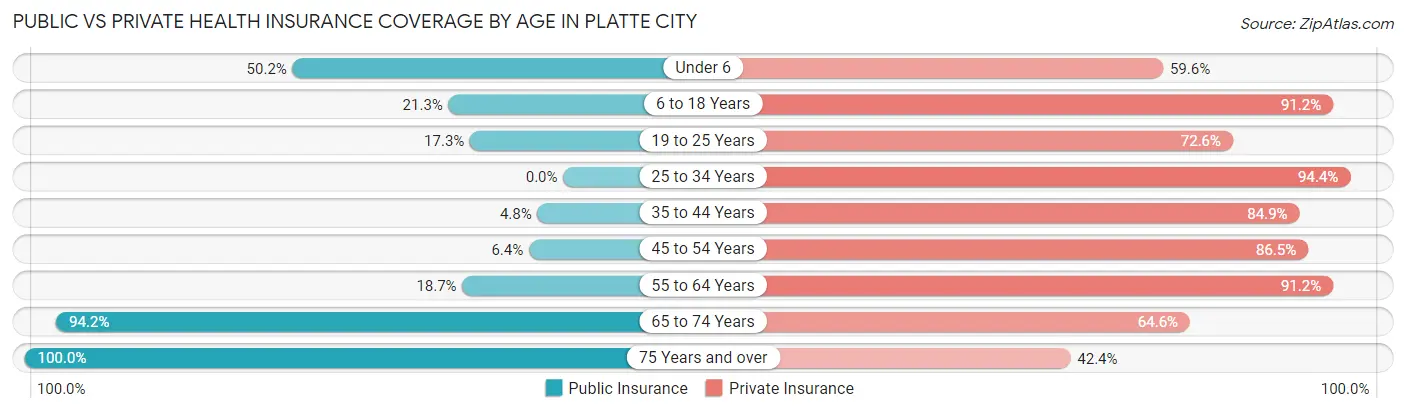
| Age Bracket | Public Insurance | Private Insurance |
| Under 6 | 209 (50.2%) | 248 (59.6%) |
| 6 to 18 Years | 205 (21.3%) | 878 (91.2%) |
| 19 to 25 Years | 118 (17.3%) | 495 (72.6%) |
| 25 to 34 Years | 0 (0.0%) | 317 (94.4%) |
| 35 to 44 Years | 34 (4.8%) | 603 (84.9%) |
| 45 to 54 Years | 44 (6.4%) | 598 (86.5%) |
| 55 to 64 Years | 53 (18.7%) | 258 (91.2%) |
| 65 to 74 Years | 290 (94.2%) | 199 (64.6%) |
| 75 Years and over | 99 (100.0%) | 42 (42.4%) |
| Total | 1,052 (23.4%) | 3,638 (81.1%) |
Disability Status by Sex by Age in Platte City
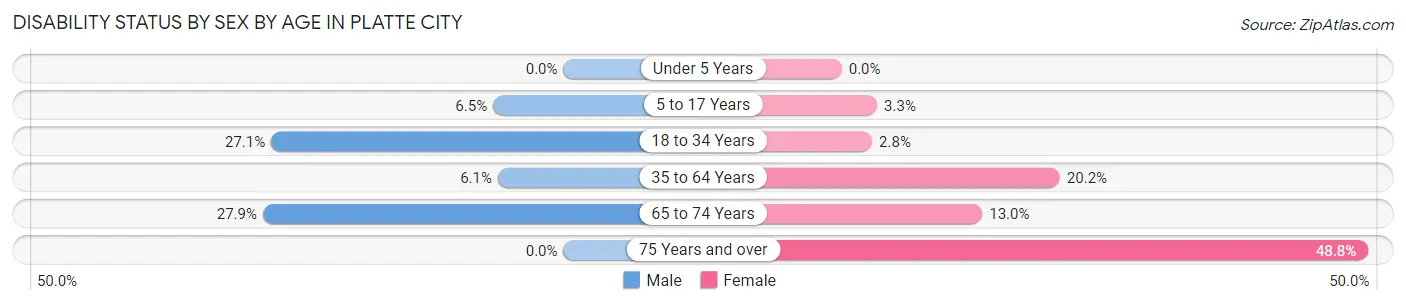
| Age Bracket | Male | Female |
| Under 5 Years | 0 (0.0%) | 0 (0.0%) |
| 5 to 17 Years | 35 (6.5%) | 18 (3.3%) |
| 18 to 34 Years | 137 (27.1%) | 15 (2.8%) |
| 35 to 64 Years | 42 (6.1%) | 201 (20.2%) |
| 65 to 74 Years | 41 (27.9%) | 21 (13.0%) |
| 75 Years and over | 0 (0.0%) | 21 (48.8%) |
Disability Class by Sex by Age in Platte City
Disability Class: Hearing Difficulty
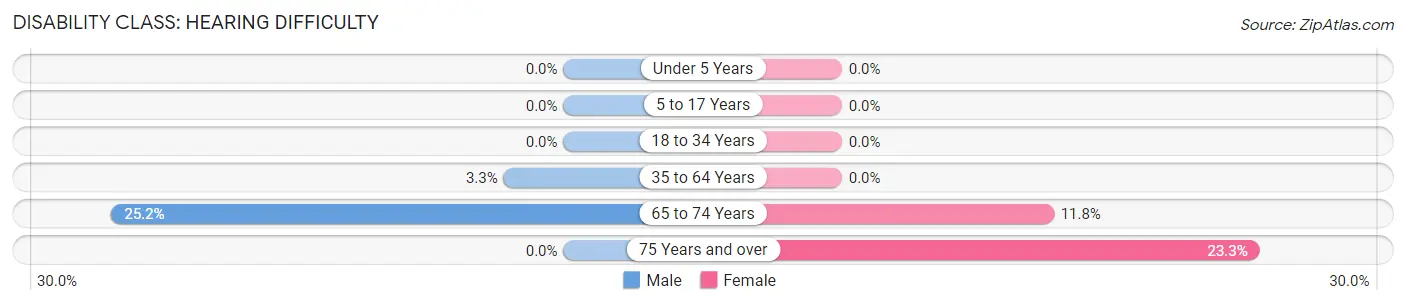
| Age Bracket | Male | Female |
| Under 5 Years | 0 (0.0%) | 0 (0.0%) |
| 5 to 17 Years | 0 (0.0%) | 0 (0.0%) |
| 18 to 34 Years | 0 (0.0%) | 0 (0.0%) |
| 35 to 64 Years | 23 (3.3%) | 0 (0.0%) |
| 65 to 74 Years | 37 (25.2%) | 19 (11.8%) |
| 75 Years and over | 0 (0.0%) | 10 (23.3%) |
Disability Class: Vision Difficulty
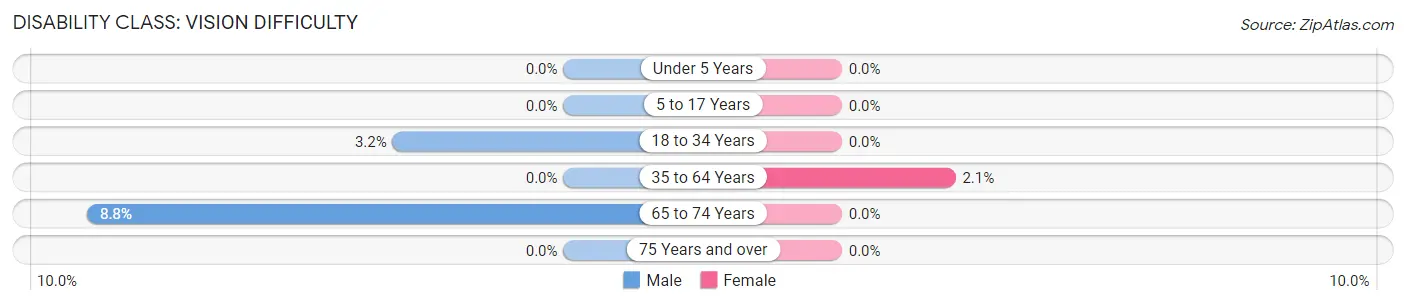
| Age Bracket | Male | Female |
| Under 5 Years | 0 (0.0%) | 0 (0.0%) |
| 5 to 17 Years | 0 (0.0%) | 0 (0.0%) |
| 18 to 34 Years | 16 (3.2%) | 0 (0.0%) |
| 35 to 64 Years | 0 (0.0%) | 21 (2.1%) |
| 65 to 74 Years | 13 (8.8%) | 0 (0.0%) |
| 75 Years and over | 0 (0.0%) | 0 (0.0%) |
Disability Class: Cognitive Difficulty
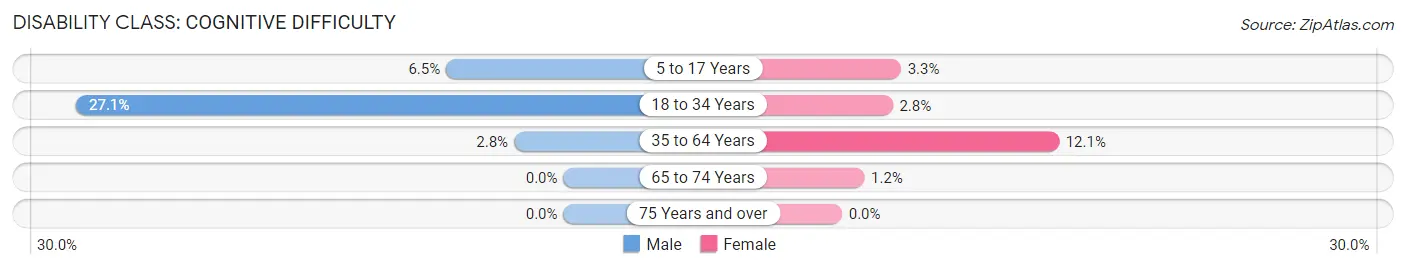
| Age Bracket | Male | Female |
| 5 to 17 Years | 35 (6.5%) | 18 (3.3%) |
| 18 to 34 Years | 137 (27.1%) | 15 (2.8%) |
| 35 to 64 Years | 19 (2.8%) | 120 (12.1%) |
| 65 to 74 Years | 0 (0.0%) | 2 (1.2%) |
| 75 Years and over | 0 (0.0%) | 0 (0.0%) |
Disability Class: Ambulatory Difficulty
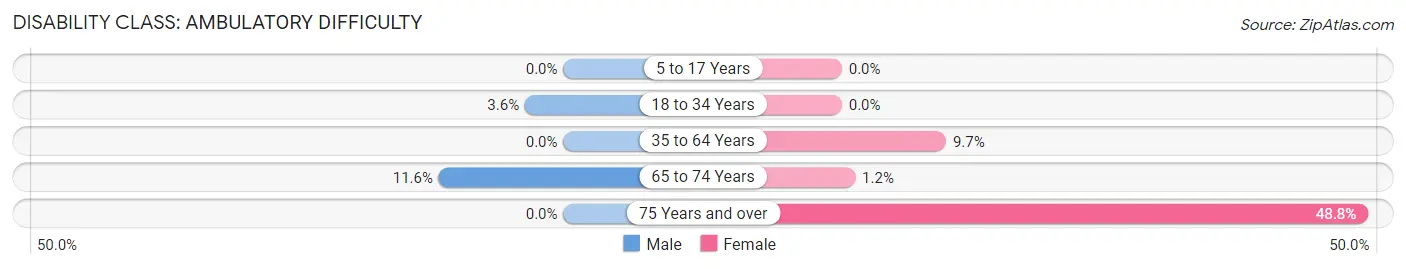
| Age Bracket | Male | Female |
| 5 to 17 Years | 0 (0.0%) | 0 (0.0%) |
| 18 to 34 Years | 18 (3.6%) | 0 (0.0%) |
| 35 to 64 Years | 0 (0.0%) | 96 (9.7%) |
| 65 to 74 Years | 17 (11.6%) | 2 (1.2%) |
| 75 Years and over | 0 (0.0%) | 21 (48.8%) |
Disability Class: Self-Care Difficulty
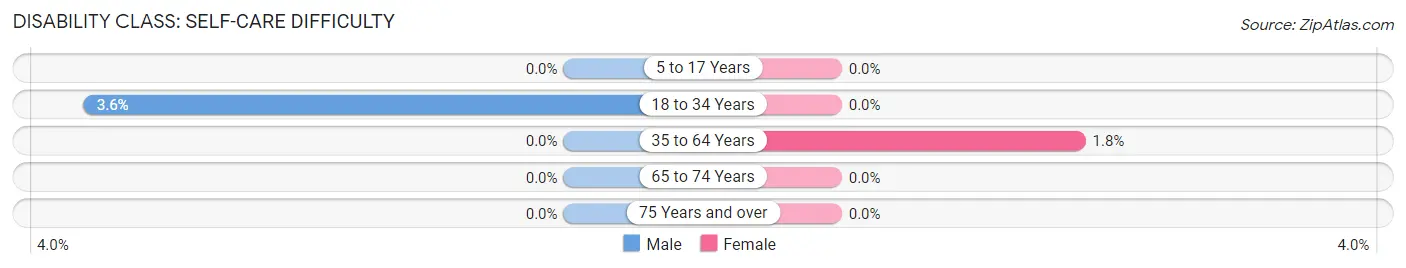
| Age Bracket | Male | Female |
| 5 to 17 Years | 0 (0.0%) | 0 (0.0%) |
| 18 to 34 Years | 18 (3.6%) | 0 (0.0%) |
| 35 to 64 Years | 0 (0.0%) | 18 (1.8%) |
| 65 to 74 Years | 0 (0.0%) | 0 (0.0%) |
| 75 Years and over | 0 (0.0%) | 0 (0.0%) |
Technology Access in Platte City
Computing Device Access in Platte City
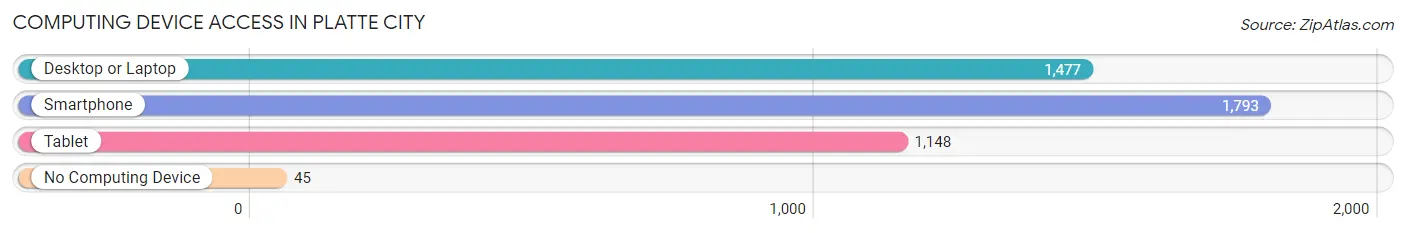
| Device Type | # Households | % Households |
| Desktop or Laptop | 1,477 | 76.4% |
| Smartphone | 1,793 | 92.8% |
| Tablet | 1,148 | 59.4% |
| No Computing Device | 45 | 2.3% |
| Total | 1,932 | 100.0% |
Internet Access in Platte City
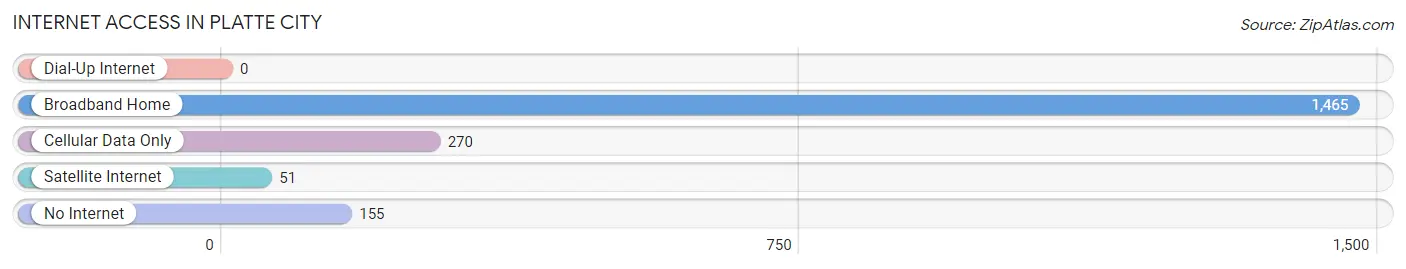
| Internet Type | # Households | % Households |
| Dial-Up Internet | 0 | 0.0% |
| Broadband Home | 1,465 | 75.8% |
| Cellular Data Only | 270 | 14.0% |
| Satellite Internet | 51 | 2.6% |
| No Internet | 155 | 8.0% |
| Total | 1,932 | 100.0% |
Platte City Summary
Platte City, Missouri is a small city located in Platte County, Missouri, United States. It is situated on the Missouri River, approximately 25 miles north of Kansas City. The city has a population of approximately 4,500 people and is the county seat of Platte County.
History
Platte City was founded in 1838 by a group of settlers from Kentucky and Virginia. The city was named after the Platte River, which runs through the area. The city was originally a trading post and was the site of a ferry crossing. In 1845, the city was incorporated and the first post office was established.
In the late 19th century, Platte City became a popular destination for tourists and travelers. The city was home to several hotels, restaurants, and other businesses. The city also had a thriving agricultural industry, with many farms located in the area.
In the early 20th century, Platte City experienced a period of growth and development. The city was home to several factories and businesses, including a flour mill, a canning factory, and a brickyard. The city also had a thriving entertainment industry, with several theaters and movie houses.
Geography
Platte City is located in Platte County, Missouri, approximately 25 miles north of Kansas City. The city is situated on the Missouri River and is surrounded by rolling hills and farmland. The city has a total area of 4.2 square miles, all of which is land.
The climate in Platte City is humid continental, with hot summers and cold winters. The average annual temperature is around 50 degrees Fahrenheit. The average annual precipitation is around 40 inches.
Economy
The economy of Platte City is largely based on agriculture and tourism. The city is home to several farms, which produce a variety of crops, including corn, soybeans, and wheat. The city also has a thriving tourism industry, with many visitors coming to the area to enjoy the natural beauty of the Missouri River and the surrounding countryside.
The city is also home to several businesses, including a flour mill, a canning factory, and a brickyard. The city also has a thriving entertainment industry, with several theaters and movie houses.
Demographics
As of the 2010 census, the population of Platte City was 4,500. The racial makeup of the city was 95.3% White, 1.2% African American, 0.3% Native American, 0.7% Asian, 0.1% Pacific Islander, 0.7% from other races, and 1.9% from two or more races. Hispanic or Latino of any race were 2.2% of the population.
The median income for a household in Platte City was $45,000, and the median income for a family was $50,000. The per capita income for the city was $20,000. About 8.3% of families and 10.2% of the population were below the poverty line, including 14.3% of those under age 18 and 6.2% of those age 65 or over.
Common Questions
What is Per Capita Income in Platte City?
Per Capita income in Platte City is $29,690.
What is the Median Family Income in Platte City?
Median Family Income in Platte City is $61,932.
What is the Median Household income in Platte City?
Median Household Income in Platte City is $58,802.
What is Income or Wage Gap in Platte City?
Income or Wage Gap in Platte City is 22.2%.
Women in Platte City earn 77.8 cents for every dollar earned by a man.
What is Inequality or Gini Index in Platte City?
Inequality or Gini Index in Platte City is 0.40.
What is the Total Population of Platte City?
Total Population of Platte City is 4,781.
What is the Total Male Population of Platte City?
Total Male Population of Platte City is 2,282.
What is the Total Female Population of Platte City?
Total Female Population of Platte City is 2,499.
What is the Ratio of Males per 100 Females in Platte City?
There are 91.32 Males per 100 Females in Platte City.
What is the Ratio of Females per 100 Males in Platte City?
There are 109.51 Females per 100 Males in Platte City.
What is the Median Population Age in Platte City?
Median Population Age in Platte City is 34.1 Years.
What is the Average Family Size in Platte City
Average Family Size in Platte City is 3.0 People.
What is the Average Household Size in Platte City
Average Household Size in Platte City is 2.4 People.
How Large is the Labor Force in Platte City?
There are 2,636 People in the Labor Forcein in Platte City.
What is the Percentage of People in the Labor Force in Platte City?
72.0% of People are in the Labor Force in Platte City.
What is the Unemployment Rate in Platte City?
Unemployment Rate in Platte City is 4.0%.