Miner, MO Map & Demographics
Miner Map
Miner Overview
$25,721
PER CAPITA INCOME
$50,250
AVG FAMILY INCOME
$38,214
AVG HOUSEHOLD INCOME
48.0%
WAGE / INCOME GAP [ % ]
52.0¢/ $1
WAGE / INCOME GAP [ $ ]
$19,612
FAMILY INCOME DEFICIT
0.46
INEQUALITY / GINI INDEX
844
TOTAL POPULATION
359
MALE POPULATION
485
FEMALE POPULATION
74.02
MALES / 100 FEMALES
135.10
FEMALES / 100 MALES
39.8
MEDIAN AGE
3.4
AVG FAMILY SIZE
2.3
AVG HOUSEHOLD SIZE
386
LABOR FORCE [ PEOPLE ]
58.1%
PERCENT IN LABOR FORCE
1.6%
UNEMPLOYMENT RATE
Miner Area Codes
Income in Miner
Income Overview in Miner
Per Capita Income in Miner is $25,721, while median incomes of families and households are $50,250 and $38,214 respectively.
| Characteristic | Number | Measure |
| Per Capita Income | 844 | $25,721 |
| Median Family Income | 155 | $50,250 |
| Mean Family Income | 155 | $73,043 |
| Median Household Income | 350 | $38,214 |
| Mean Household Income | 350 | $56,578 |
| Income Deficit | 155 | $19,612 |
| Wage / Income Gap (%) | 844 | 48.01% |
| Wage / Income Gap ($) | 844 | 51.99¢ per $1 |
| Gini / Inequality Index | 844 | 0.46 |
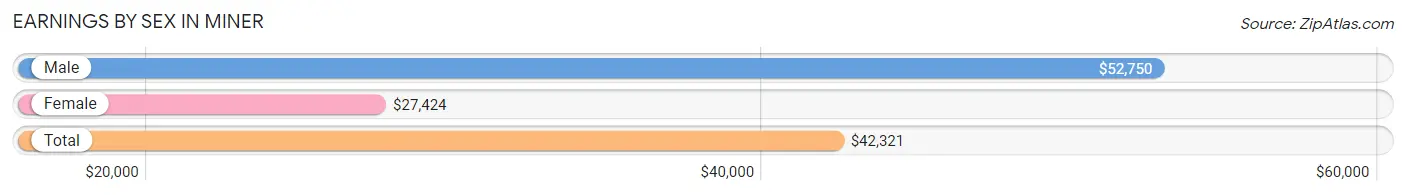
Earnings by Sex in Miner
Average Earnings in Miner are $42,321, $52,750 for men and $27,424 for women, a difference of 48.0%.
| Sex | Number | Average Earnings |
| Male | 165 (42.2%) | $52,750 |
| Female | 226 (57.8%) | $27,424 |
| Total | 391 (100.0%) | $42,321 |
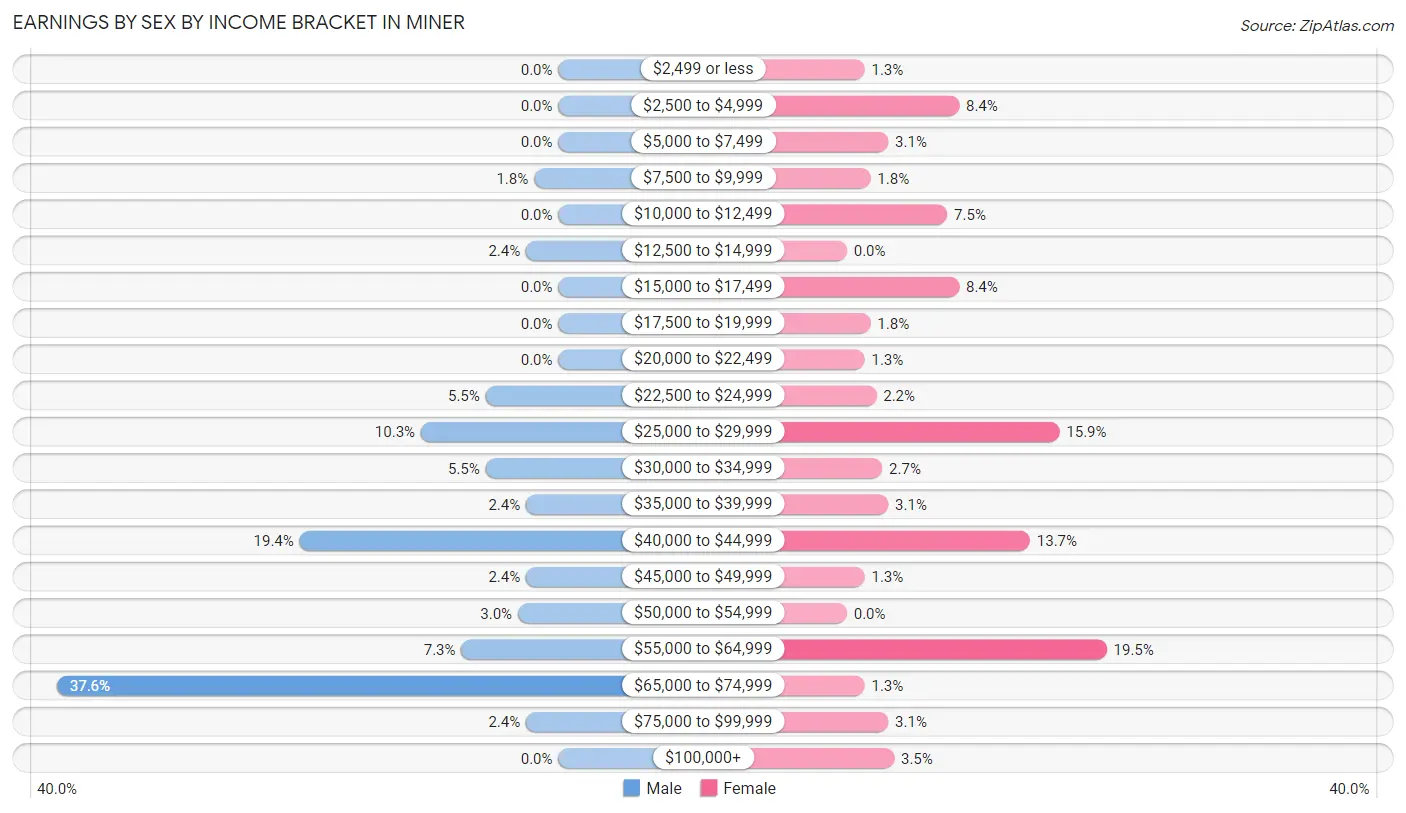
Earnings by Sex by Income Bracket in Miner
The most common earnings brackets in Miner are $65,000 to $74,999 for men (62 | 37.6%) and $55,000 to $64,999 for women (44 | 19.5%).
| Income | Male | Female |
| $2,499 or less | 0 (0.0%) | 3 (1.3%) |
| $2,500 to $4,999 | 0 (0.0%) | 19 (8.4%) |
| $5,000 to $7,499 | 0 (0.0%) | 7 (3.1%) |
| $7,500 to $9,999 | 3 (1.8%) | 4 (1.8%) |
| $10,000 to $12,499 | 0 (0.0%) | 17 (7.5%) |
| $12,500 to $14,999 | 4 (2.4%) | 0 (0.0%) |
| $15,000 to $17,499 | 0 (0.0%) | 19 (8.4%) |
| $17,500 to $19,999 | 0 (0.0%) | 4 (1.8%) |
| $20,000 to $22,499 | 0 (0.0%) | 3 (1.3%) |
| $22,500 to $24,999 | 9 (5.4%) | 5 (2.2%) |
| $25,000 to $29,999 | 17 (10.3%) | 36 (15.9%) |
| $30,000 to $34,999 | 9 (5.4%) | 6 (2.6%) |
| $35,000 to $39,999 | 4 (2.4%) | 7 (3.1%) |
| $40,000 to $44,999 | 32 (19.4%) | 31 (13.7%) |
| $45,000 to $49,999 | 4 (2.4%) | 3 (1.3%) |
| $50,000 to $54,999 | 5 (3.0%) | 0 (0.0%) |
| $55,000 to $64,999 | 12 (7.3%) | 44 (19.5%) |
| $65,000 to $74,999 | 62 (37.6%) | 3 (1.3%) |
| $75,000 to $99,999 | 4 (2.4%) | 7 (3.1%) |
| $100,000+ | 0 (0.0%) | 8 (3.5%) |
| Total | 165 (100.0%) | 226 (100.0%) |
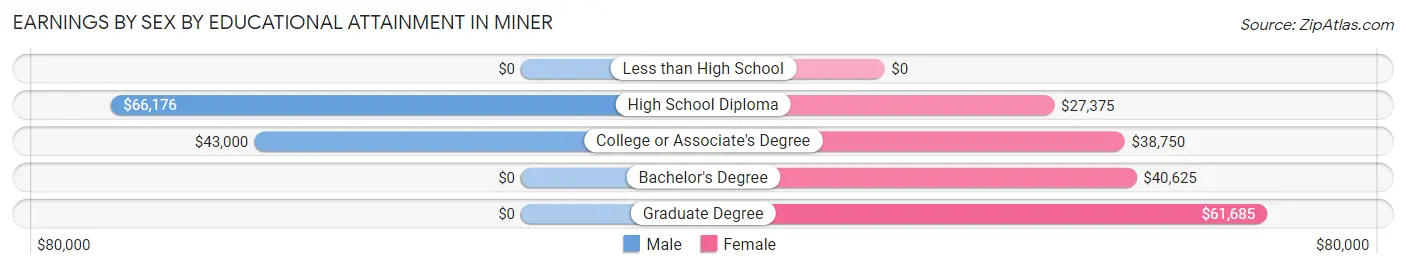
Earnings by Sex by Educational Attainment in Miner
Average earnings in Miner are $53,500 for men and $42,019 for women, a difference of 21.5%. Men with an educational attainment of high school diploma enjoy the highest average annual earnings of $66,176, while those with college or associate's degree education earn the least with $43,000. Women with an educational attainment of graduate degree earn the most with the average annual earnings of $61,685, while those with high school diploma education have the smallest earnings of $27,375.
| Educational Attainment | Male Income | Female Income |
| Less than High School | - | - |
| High School Diploma | $66,176 | $27,375 |
| College or Associate's Degree | $43,000 | $38,750 |
| Bachelor's Degree | - | - |
| Graduate Degree | - | - |
| Total | $53,500 | $42,019 |
Family Income in Miner
Family Income Brackets in Miner
According to the Miner family income data, there are 38 families falling into the $35,000 to $49,999 income range, which is the most common income bracket and makes up 24.5% of all families.
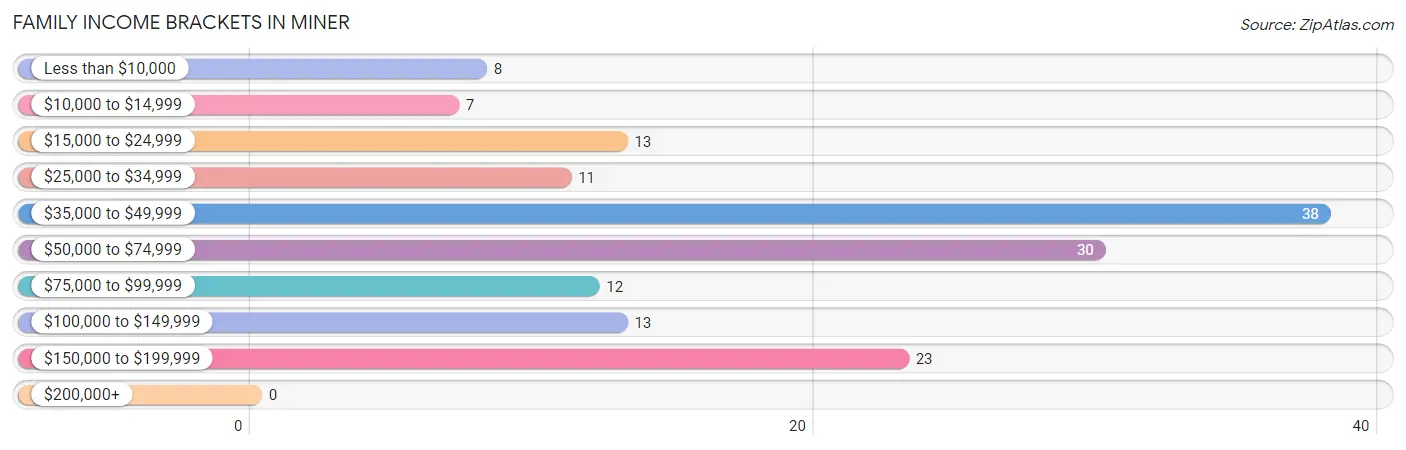
| Income Bracket | # Families | % Families |
| Less than $10,000 | 8 | 5.2% |
| $10,000 to $14,999 | 7 | 4.5% |
| $15,000 to $24,999 | 13 | 8.4% |
| $25,000 to $34,999 | 11 | 7.1% |
| $35,000 to $49,999 | 38 | 24.5% |
| $50,000 to $74,999 | 30 | 19.4% |
| $75,000 to $99,999 | 12 | 7.7% |
| $100,000 to $149,999 | 13 | 8.4% |
| $150,000 to $199,999 | 23 | 14.8% |
| $200,000+ | 0 | 0.0% |
Family Income by Famaliy Size in Miner
4-person families (12 | 7.7%) account for the highest median family income in Miner with $65,417 per family, while 2-person families (70 | 45.2%) have the highest median income of $22,500 per family member.
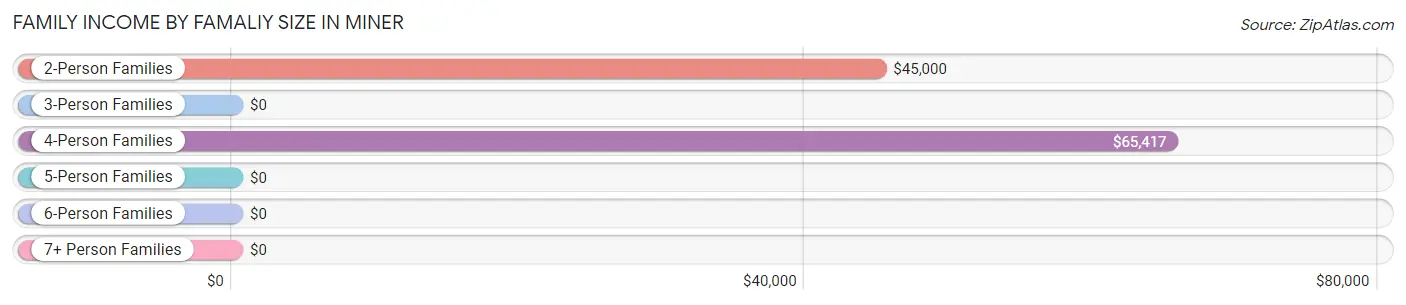
| Income Bracket | # Families | Median Income |
| 2-Person Families | 70 (45.2%) | $45,000 |
| 3-Person Families | 51 (32.9%) | $0 |
| 4-Person Families | 12 (7.7%) | $65,417 |
| 5-Person Families | 10 (6.5%) | $0 |
| 6-Person Families | 12 (7.7%) | $0 |
| 7+ Person Families | 0 (0.0%) | $0 |
| Total | 155 (100.0%) | $50,250 |
Family Income by Number of Earners in Miner
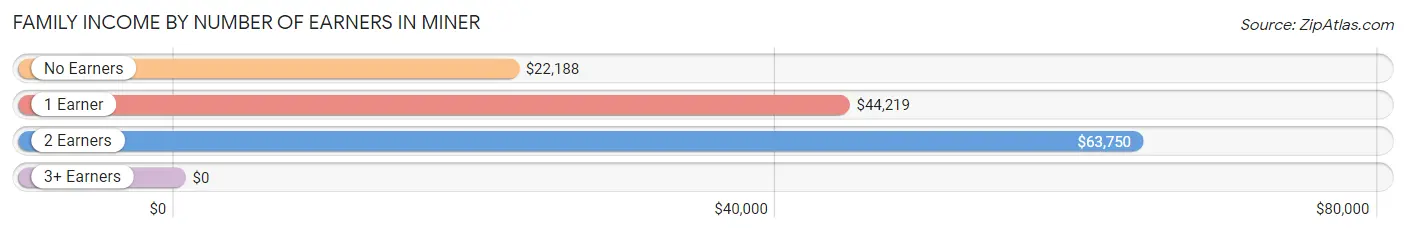
| Number of Earners | # Families | Median Income |
| No Earners | 37 (23.9%) | $22,188 |
| 1 Earner | 45 (29.0%) | $44,219 |
| 2 Earners | 49 (31.6%) | $63,750 |
| 3+ Earners | 24 (15.5%) | $0 |
| Total | 155 (100.0%) | $50,250 |
Household Income in Miner
Household Income Brackets in Miner
With 59 households falling in the category, the $50,000 to $74,999 income range is the most frequent in Miner, accounting for 16.9% of all households.
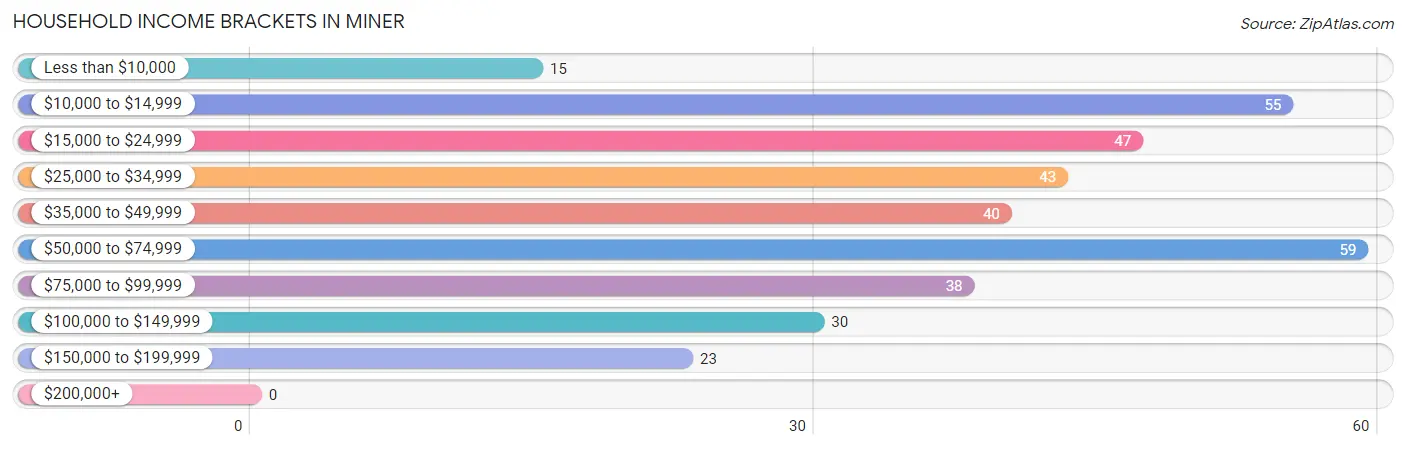
| Income Bracket | # Households | % Households |
| Less than $10,000 | 15 | 4.3% |
| $10,000 to $14,999 | 55 | 15.7% |
| $15,000 to $24,999 | 47 | 13.4% |
| $25,000 to $34,999 | 43 | 12.3% |
| $35,000 to $49,999 | 40 | 11.4% |
| $50,000 to $74,999 | 59 | 16.9% |
| $75,000 to $99,999 | 38 | 10.9% |
| $100,000 to $149,999 | 30 | 8.6% |
| $150,000 to $199,999 | 23 | 6.6% |
| $200,000+ | 0 | 0.0% |
Household Income by Householder Age in Miner
The median household income in Miner is $38,214, with the highest median household income of $61,917 found in the 25 to 44 years age bracket for the primary householder. A total of 79 households (22.6%) fall into this category. Meanwhile, the 15 to 24 years age bracket for the primary householder has the lowest median household income of $0, with 14 households (4.0%) in this group.
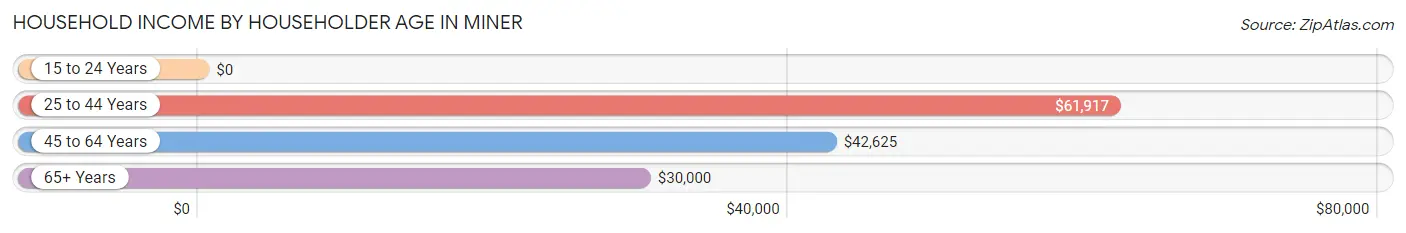
| Income Bracket | # Households | Median Income |
| 15 to 24 Years | 14 (4.0%) | $0 |
| 25 to 44 Years | 79 (22.6%) | $61,917 |
| 45 to 64 Years | 147 (42.0%) | $42,625 |
| 65+ Years | 110 (31.4%) | $30,000 |
| Total | 350 (100.0%) | $38,214 |
Poverty in Miner
Income Below Poverty by Sex and Age in Miner
With 15.7% poverty level for males and 19.0% for females among the residents of Miner, 12 to 14 year old males and 25 to 34 year old females are the most vulnerable to poverty, with 9 males (69.2%) and 22 females (40.7%) in their respective age groups living below the poverty level.
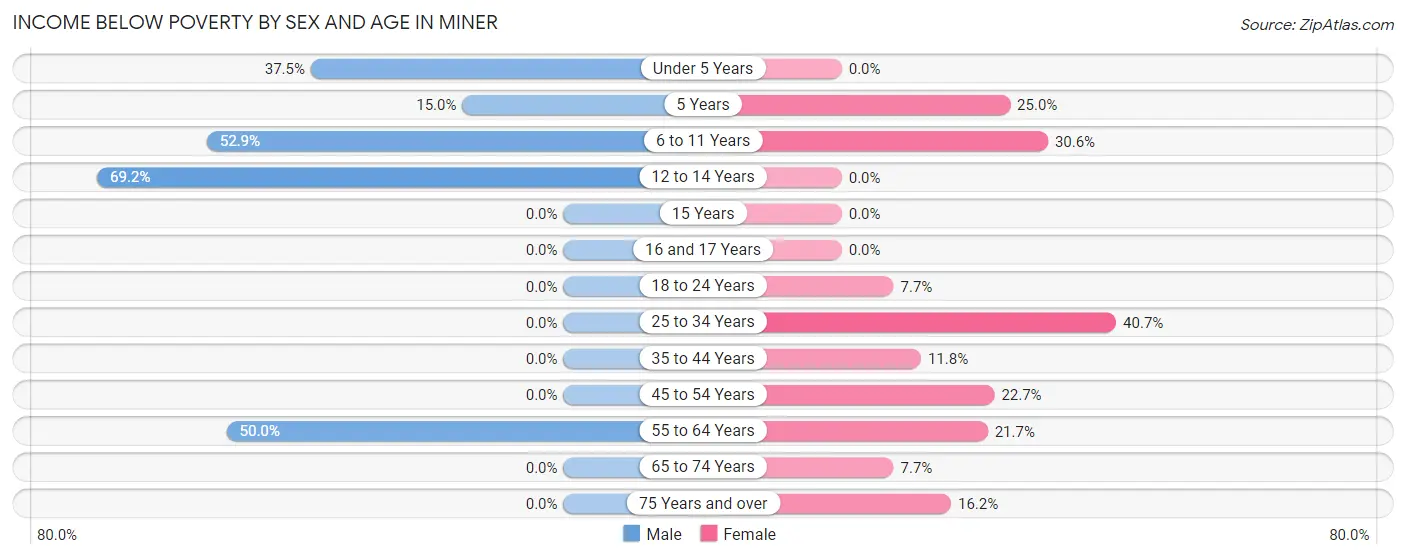
| Age Bracket | Male | Female |
| Under 5 Years | 3 (37.5%) | 0 (0.0%) |
| 5 Years | 3 (15.0%) | 4 (25.0%) |
| 6 to 11 Years | 18 (52.9%) | 15 (30.6%) |
| 12 to 14 Years | 9 (69.2%) | 0 (0.0%) |
| 15 Years | 0 (0.0%) | 0 (0.0%) |
| 16 and 17 Years | 0 (0.0%) | 0 (0.0%) |
| 18 to 24 Years | 0 (0.0%) | 5 (7.7%) |
| 25 to 34 Years | 0 (0.0%) | 22 (40.7%) |
| 35 to 44 Years | 0 (0.0%) | 4 (11.8%) |
| 45 to 54 Years | 0 (0.0%) | 17 (22.7%) |
| 55 to 64 Years | 19 (50.0%) | 13 (21.7%) |
| 65 to 74 Years | 0 (0.0%) | 4 (7.7%) |
| 75 Years and over | 0 (0.0%) | 6 (16.2%) |
| Total | 52 (15.7%) | 90 (19.0%) |
Income Above Poverty by Sex and Age in Miner
According to the poverty statistics in Miner, males aged 15 years and females aged under 5 years are the age groups that are most secure financially, with 100.0% of males and 100.0% of females in these age groups living above the poverty line.
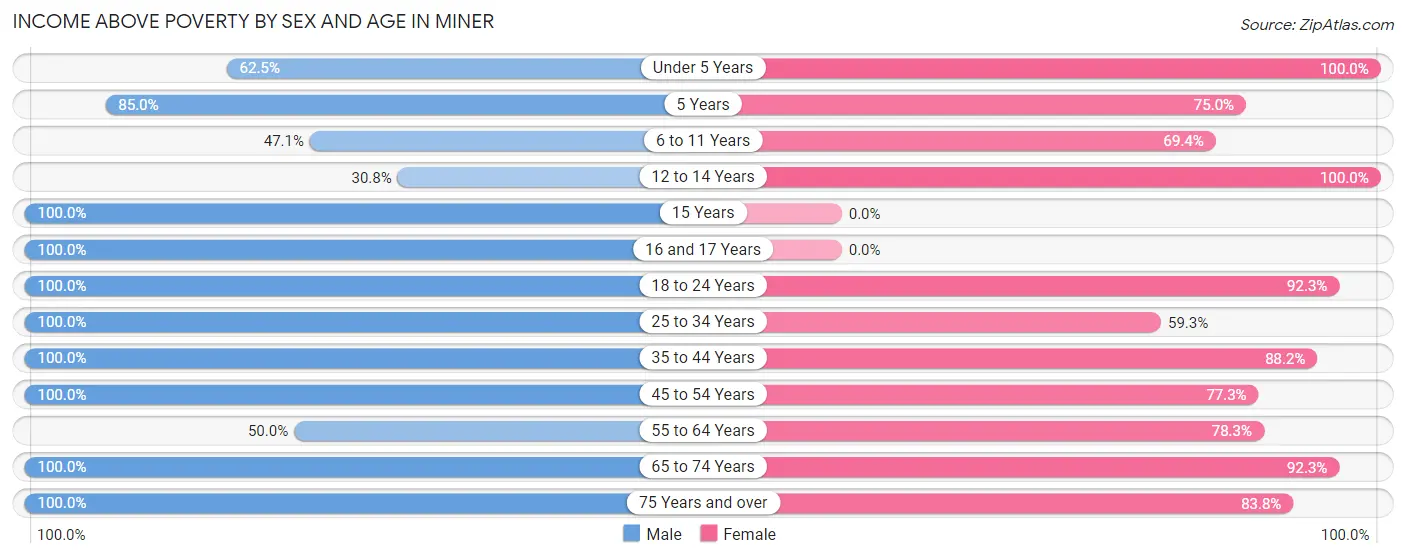
| Age Bracket | Male | Female |
| Under 5 Years | 5 (62.5%) | 29 (100.0%) |
| 5 Years | 17 (85.0%) | 12 (75.0%) |
| 6 to 11 Years | 16 (47.1%) | 34 (69.4%) |
| 12 to 14 Years | 4 (30.8%) | 3 (100.0%) |
| 15 Years | 4 (100.0%) | 0 (0.0%) |
| 16 and 17 Years | 5 (100.0%) | 0 (0.0%) |
| 18 to 24 Years | 25 (100.0%) | 60 (92.3%) |
| 25 to 34 Years | 73 (100.0%) | 32 (59.3%) |
| 35 to 44 Years | 11 (100.0%) | 30 (88.2%) |
| 45 to 54 Years | 52 (100.0%) | 58 (77.3%) |
| 55 to 64 Years | 19 (50.0%) | 47 (78.3%) |
| 65 to 74 Years | 24 (100.0%) | 48 (92.3%) |
| 75 Years and over | 24 (100.0%) | 31 (83.8%) |
| Total | 279 (84.3%) | 384 (81.0%) |
Income Below Poverty Among Married-Couple Families in Miner
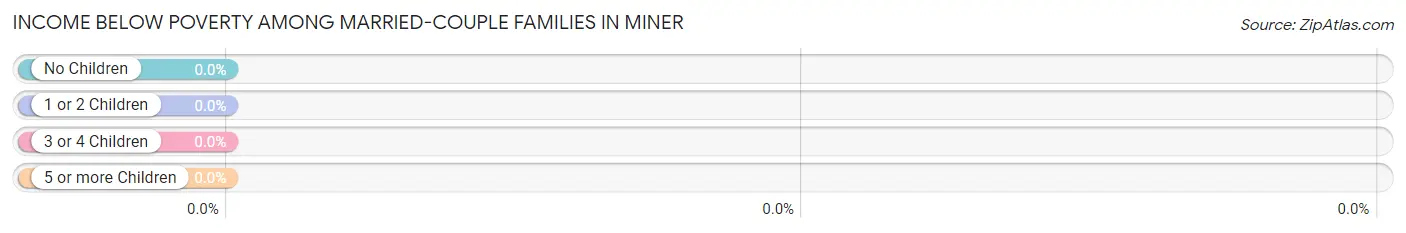
| Children | Above Poverty | Below Poverty |
| No Children | 72 (100.0%) | 0 (0.0%) |
| 1 or 2 Children | 6 (100.0%) | 0 (0.0%) |
| 3 or 4 Children | 2 (100.0%) | 0 (0.0%) |
| 5 or more Children | 0 (0.0%) | 0 (0.0%) |
| Total | 80 (100.0%) | 0 (0.0%) |
Income Below Poverty Among Single-Parent Households in Miner
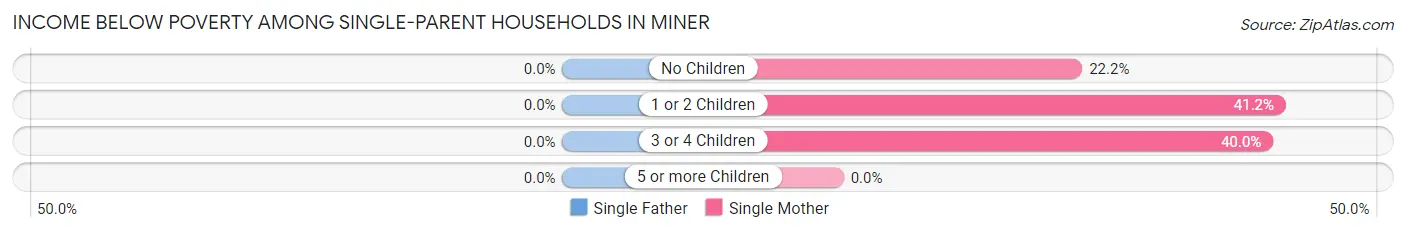
| Children | Single Father | Single Mother |
| No Children | 0 (0.0%) | 2 (22.2%) |
| 1 or 2 Children | 0 (0.0%) | 7 (41.2%) |
| 3 or 4 Children | 0 (0.0%) | 8 (40.0%) |
| 5 or more Children | 0 (0.0%) | 0 (0.0%) |
| Total | 0 (0.0%) | 17 (37.0%) |
Income Below Poverty Among Married-Couple vs Single-Parent Households in Miner
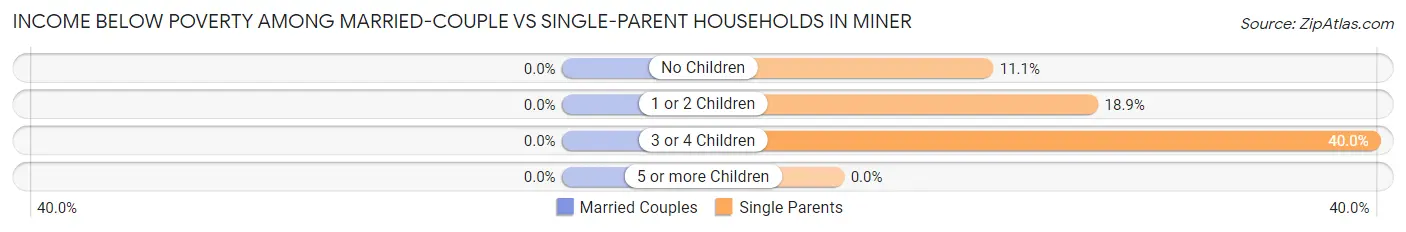
| Children | Married-Couple Families | Single-Parent Households |
| No Children | 0 (0.0%) | 2 (11.1%) |
| 1 or 2 Children | 0 (0.0%) | 7 (18.9%) |
| 3 or 4 Children | 0 (0.0%) | 8 (40.0%) |
| 5 or more Children | 0 (0.0%) | 0 (0.0%) |
| Total | 0 (0.0%) | 17 (22.7%) |
Race in Miner
The most populous races in Miner are White / Caucasian (623 | 73.8%), Two or more Races (111 | 13.2%), and Black / African American (95 | 11.3%).
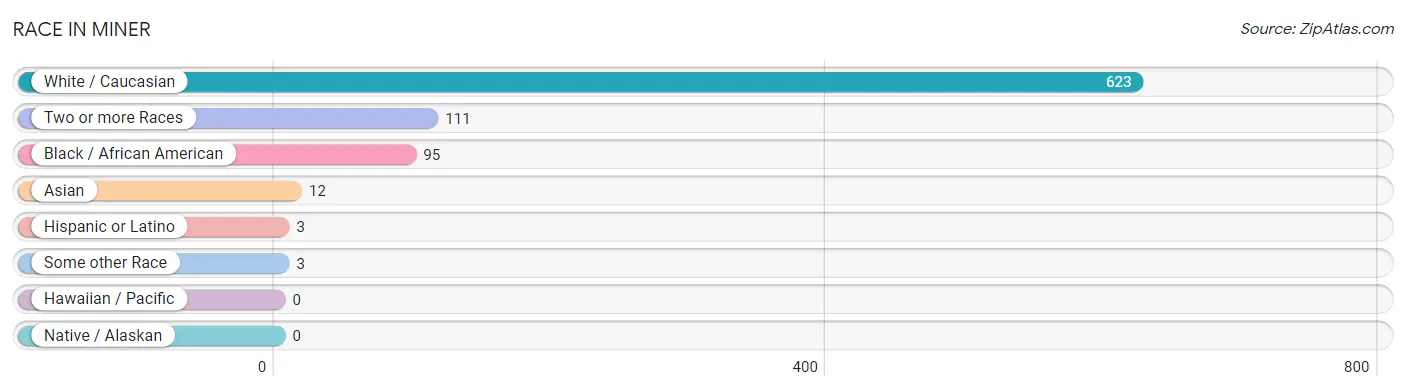
| Race | # Population | % Population |
| Asian | 12 | 1.4% |
| Black / African American | 95 | 11.3% |
| Hawaiian / Pacific | 0 | 0.0% |
| Hispanic or Latino | 3 | 0.4% |
| Native / Alaskan | 0 | 0.0% |
| White / Caucasian | 623 | 73.8% |
| Two or more Races | 111 | 13.2% |
| Some other Race | 3 | 0.4% |
| Total | 844 | 100.0% |
Ancestry in Miner
The most populous ancestries reported in Miner are American (120 | 14.2%), German (114 | 13.5%), Irish (87 | 10.3%), English (63 | 7.5%), and French (35 | 4.2%), together accounting for 49.6% of all Miner residents.
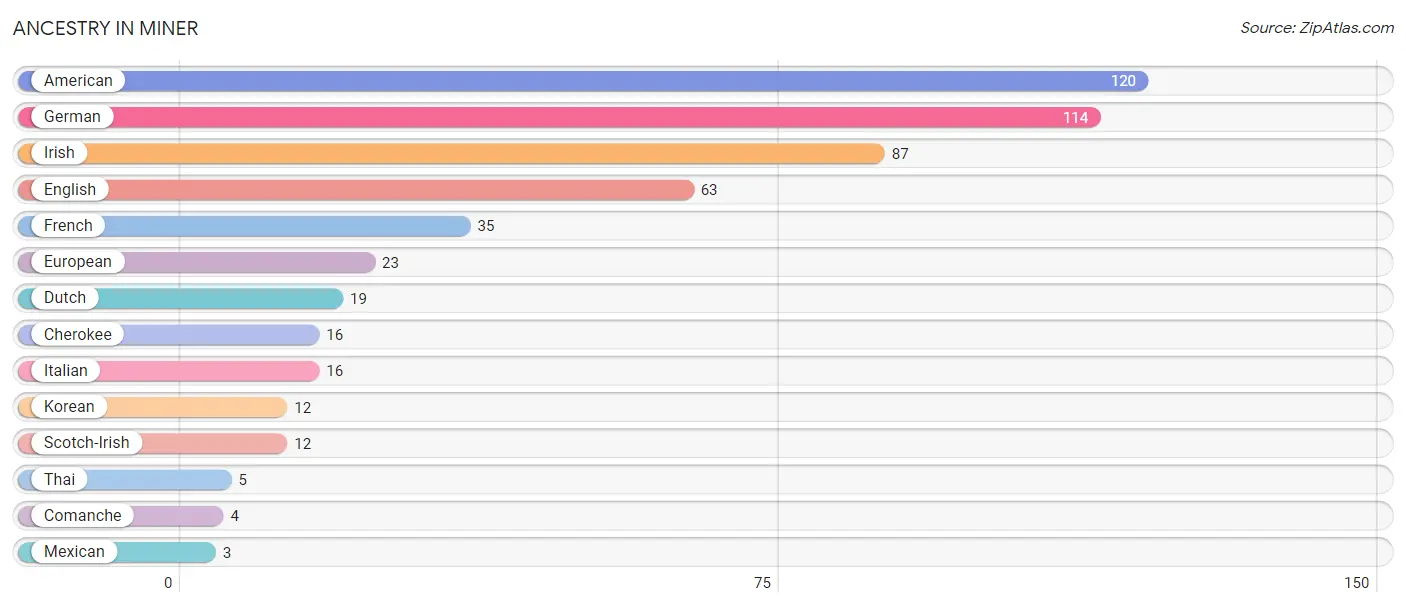
| Ancestry | # Population | % Population |
| American | 120 | 14.2% |
| Cherokee | 16 | 1.9% |
| Comanche | 4 | 0.5% |
| Dutch | 19 | 2.2% |
| English | 63 | 7.5% |
| European | 23 | 2.7% |
| French | 35 | 4.2% |
| German | 114 | 13.5% |
| Irish | 87 | 10.3% |
| Italian | 16 | 1.9% |
| Korean | 12 | 1.4% |
| Mexican | 3 | 0.4% |
| Scotch-Irish | 12 | 1.4% |
| Thai | 5 | 0.6% | View All 14 Rows |
Immigrants in Miner
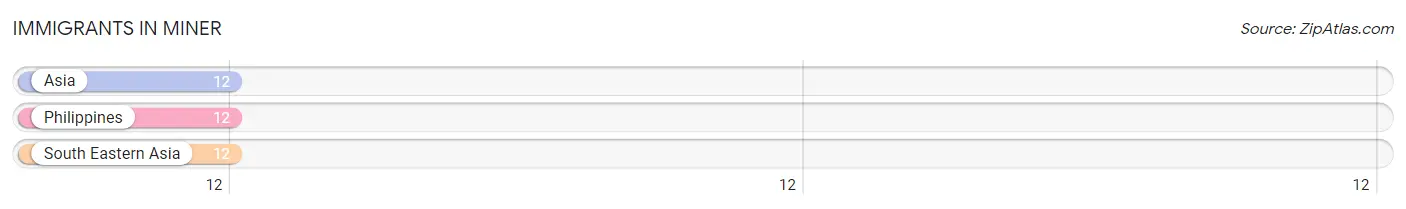
The most numerous immigrant groups reported in Miner came from Asia (12 | 1.4%), Philippines (12 | 1.4%), and South Eastern Asia (12 | 1.4%), together accounting for 4.3% of all Miner residents.
| Immigration Origin | # Population | % Population |
| Asia | 12 | 1.4% |
| Philippines | 12 | 1.4% |
| South Eastern Asia | 12 | 1.4% | View All 3 Rows |
Sex and Age in Miner
Sex and Age in Miner
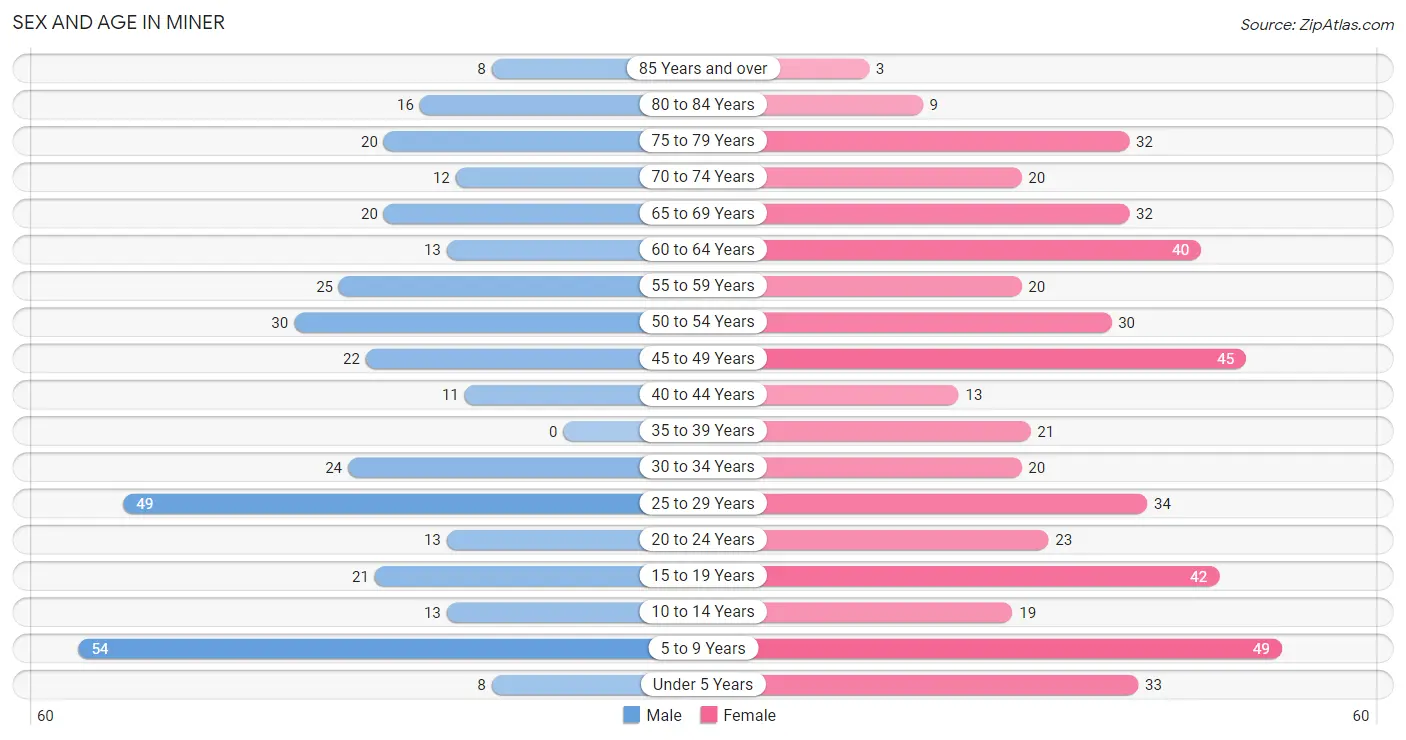
The most populous age groups in Miner are 5 to 9 Years (54 | 15.0%) for men and 5 to 9 Years (49 | 10.1%) for women.
| Age Bracket | Male | Female |
| Under 5 Years | 8 (2.2%) | 33 (6.8%) |
| 5 to 9 Years | 54 (15.0%) | 49 (10.1%) |
| 10 to 14 Years | 13 (3.6%) | 19 (3.9%) |
| 15 to 19 Years | 21 (5.9%) | 42 (8.7%) |
| 20 to 24 Years | 13 (3.6%) | 23 (4.7%) |
| 25 to 29 Years | 49 (13.7%) | 34 (7.0%) |
| 30 to 34 Years | 24 (6.7%) | 20 (4.1%) |
| 35 to 39 Years | 0 (0.0%) | 21 (4.3%) |
| 40 to 44 Years | 11 (3.1%) | 13 (2.7%) |
| 45 to 49 Years | 22 (6.1%) | 45 (9.3%) |
| 50 to 54 Years | 30 (8.4%) | 30 (6.2%) |
| 55 to 59 Years | 25 (7.0%) | 20 (4.1%) |
| 60 to 64 Years | 13 (3.6%) | 40 (8.3%) |
| 65 to 69 Years | 20 (5.6%) | 32 (6.6%) |
| 70 to 74 Years | 12 (3.3%) | 20 (4.1%) |
| 75 to 79 Years | 20 (5.6%) | 32 (6.6%) |
| 80 to 84 Years | 16 (4.5%) | 9 (1.9%) |
| 85 Years and over | 8 (2.2%) | 3 (0.6%) |
| Total | 359 (100.0%) | 485 (100.0%) |
Families and Households in Miner
Median Family Size in Miner
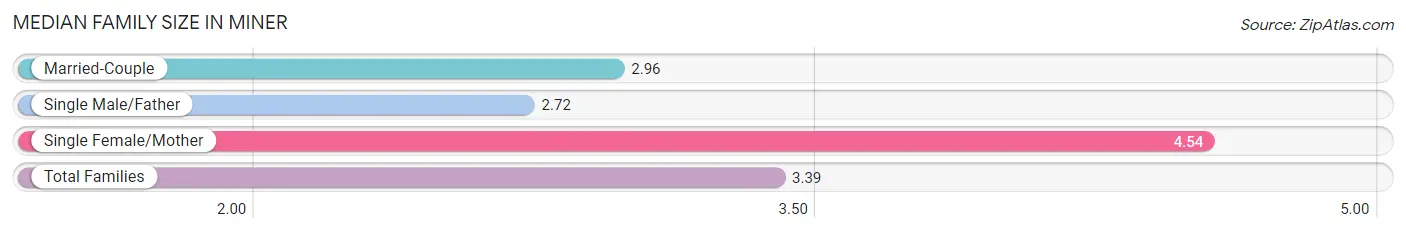
The median family size in Miner is 3.39 persons per family, with single female/mother families (46 | 29.7%) accounting for the largest median family size of 4.54 persons per family. On the other hand, single male/father families (29 | 18.7%) represent the smallest median family size with 2.72 persons per family.
| Family Type | # Families | Family Size |
| Married-Couple | 80 (51.6%) | 2.96 |
| Single Male/Father | 29 (18.7%) | 2.72 |
| Single Female/Mother | 46 (29.7%) | 4.54 |
| Total Families | 155 (100.0%) | 3.39 |
Median Household Size in Miner
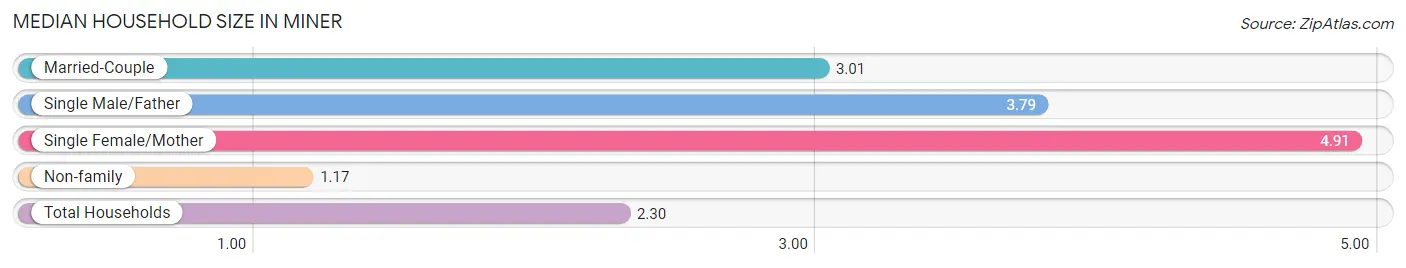
The median household size in Miner is 2.30 persons per household, with single female/mother households (46 | 13.1%) accounting for the largest median household size of 4.91 persons per household. non-family households (195 | 55.7%) represent the smallest median household size with 1.17 persons per household.
| Household Type | # Households | Household Size |
| Married-Couple | 80 (22.9%) | 3.01 |
| Single Male/Father | 29 (8.3%) | 3.79 |
| Single Female/Mother | 46 (13.1%) | 4.91 |
| Non-family | 195 (55.7%) | 1.17 |
| Total Households | 350 (100.0%) | 2.30 |
Household Size by Marriage Status in Miner
Out of a total of 350 households in Miner, 155 (44.3%) are family households, while 195 (55.7%) are nonfamily households. The most numerous type of family households are 2-person households, comprising 59, and the most common type of nonfamily households are 1-person households, comprising 173.
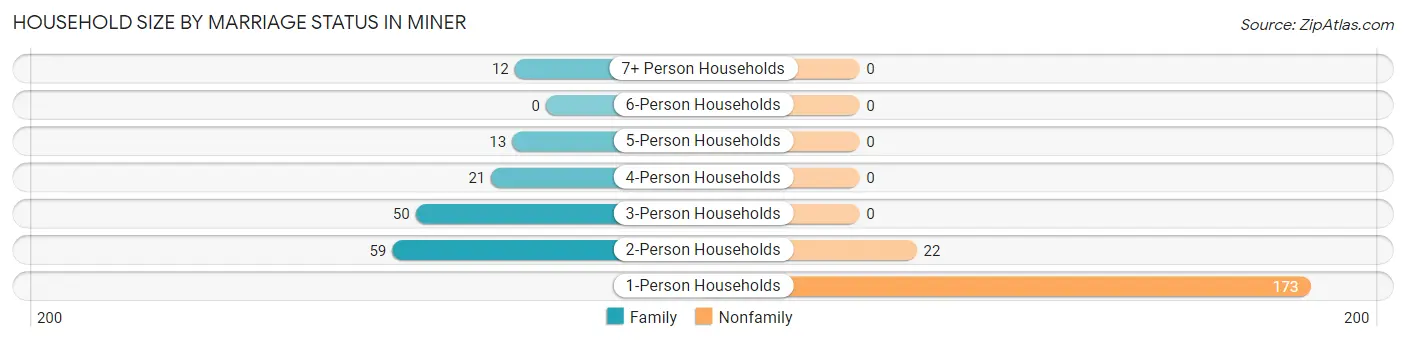
| Household Size | Family Households | Nonfamily Households |
| 1-Person Households | - | 173 (49.4%) |
| 2-Person Households | 59 (16.9%) | 22 (6.3%) |
| 3-Person Households | 50 (14.3%) | 0 (0.0%) |
| 4-Person Households | 21 (6.0%) | 0 (0.0%) |
| 5-Person Households | 13 (3.7%) | 0 (0.0%) |
| 6-Person Households | 0 (0.0%) | 0 (0.0%) |
| 7+ Person Households | 12 (3.4%) | 0 (0.0%) |
| Total | 155 (44.3%) | 195 (55.7%) |
Female Fertility in Miner
Fertility by Age in Miner
| Age Bracket | Women with Births | Births / 1,000 Women |
| 15 to 19 years | 0 (0.0%) | 0.0 |
| 20 to 34 years | 0 (0.0%) | 0.0 |
| 35 to 50 years | 0 (0.0%) | 0.0 |
| Total | 0 (0.0%) | 0.0 |
Fertility by Age by Marriage Status in Miner
| Age Bracket | Married | Unmarried |
| 15 to 19 years | 0 (0.0%) | 0 (0.0%) |
| 20 to 34 years | 0 (0.0%) | 0 (0.0%) |
| 35 to 50 years | 0 (0.0%) | 0 (0.0%) |
| Total | 0 (0.0%) | 0 (0.0%) |
Fertility by Education in Miner
| Educational Attainment | Women with Births | Births / 1,000 Women |
| Less than High School | 0 (0.0%) | 0.0 |
| High School Diploma | 0 (0.0%) | 0.0 |
| College or Associate's Degree | 0 (0.0%) | 0.0 |
| Bachelor's Degree | 0 (0.0%) | 0.0 |
| Graduate Degree | 0 (0.0%) | 0.0 |
| Total | 0 (0.0%) | 0.0 |
Fertility by Education by Marriage Status in Miner
| Educational Attainment | Married | Unmarried |
| Less than High School | 0 (0.0%) | 0 (0.0%) |
| High School Diploma | 0 (0.0%) | 0 (0.0%) |
| College or Associate's Degree | 0 (0.0%) | 0 (0.0%) |
| Bachelor's Degree | 0 (0.0%) | 0 (0.0%) |
| Graduate Degree | 0 (0.0%) | 0 (0.0%) |
| Total | 0 (0.0%) | 0 (0.0%) |
Employment Characteristics in Miner
Employment by Class of Employer in Miner
Among the 357 employed individuals in Miner, private company employees (224 | 62.7%), local government employees (35 | 9.8%), and self-employed (incorporated) (34 | 9.5%) make up the most common classes of employment.
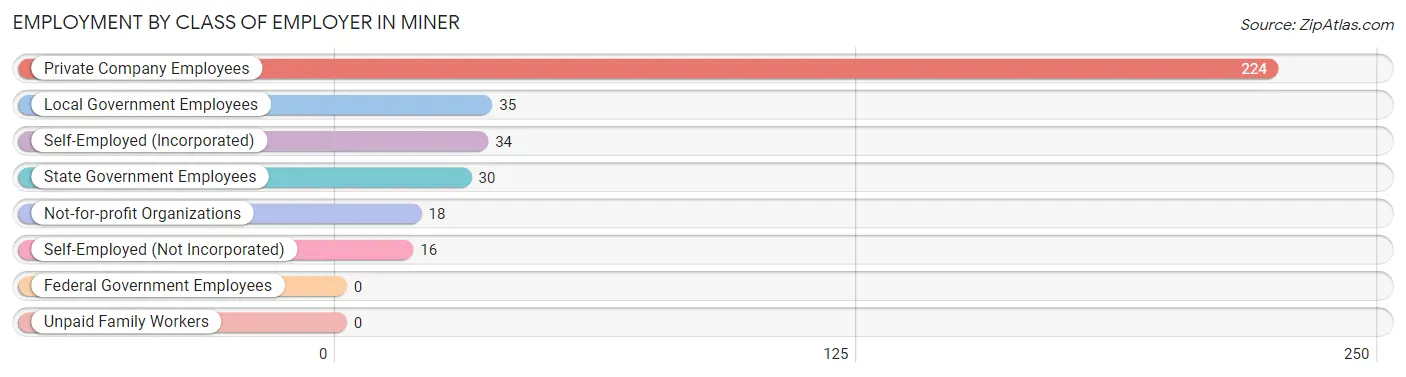
| Employer Class | # Employees | % Employees |
| Private Company Employees | 224 | 62.7% |
| Self-Employed (Incorporated) | 34 | 9.5% |
| Self-Employed (Not Incorporated) | 16 | 4.5% |
| Not-for-profit Organizations | 18 | 5.0% |
| Local Government Employees | 35 | 9.8% |
| State Government Employees | 30 | 8.4% |
| Federal Government Employees | 0 | 0.0% |
| Unpaid Family Workers | 0 | 0.0% |
| Total | 357 | 100.0% |
Employment Status by Age in Miner
According to the labor force statistics for Miner, out of the total population over 16 years of age (664), 58.1% or 386 individuals are in the labor force, with 1.6% or 6 of them unemployed. The age group with the highest labor force participation rate is 35 to 44 years, with 95.6% or 43 individuals in the labor force. Within the labor force, the 60 to 64 years age range has the highest percentage of unemployed individuals, with 13.0% or 3 of them being unemployed.
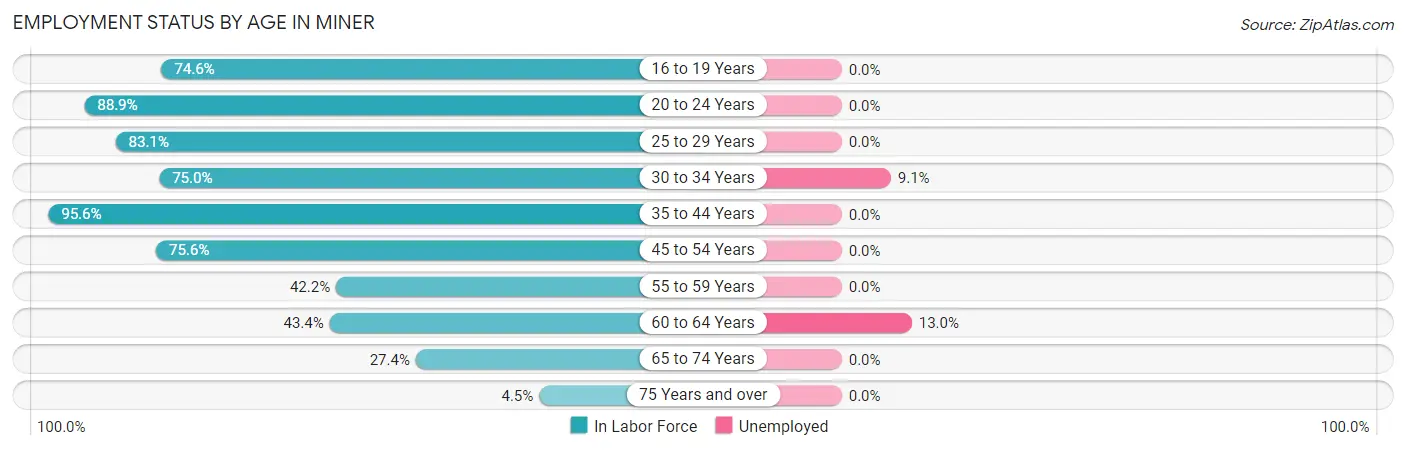
| Age Bracket | In Labor Force | Unemployed |
| 16 to 19 Years | 44 (74.6%) | 0 (0.0%) |
| 20 to 24 Years | 32 (88.9%) | 0 (0.0%) |
| 25 to 29 Years | 69 (83.1%) | 0 (0.0%) |
| 30 to 34 Years | 33 (75.0%) | 3 (9.1%) |
| 35 to 44 Years | 43 (95.6%) | 0 (0.0%) |
| 45 to 54 Years | 96 (75.6%) | 0 (0.0%) |
| 55 to 59 Years | 19 (42.2%) | 0 (0.0%) |
| 60 to 64 Years | 23 (43.4%) | 3 (13.0%) |
| 65 to 74 Years | 23 (27.4%) | 0 (0.0%) |
| 75 Years and over | 4 (4.5%) | 0 (0.0%) |
| Total | 386 (58.1%) | 6 (1.6%) |
Employment Status by Educational Attainment in Miner
According to labor force statistics for Miner, 71.3% of individuals (283) out of the total population between 25 and 64 years of age (397) are in the labor force, with 2.1% or 6 of them being unemployed. The group with the highest labor force participation rate are those with the educational attainment of bachelor's degree or higher, with 92.8% or 64 individuals in the labor force. Within the labor force, individuals with less than high school education have the highest percentage of unemployment, with 23.1% or 3 of them being unemployed.
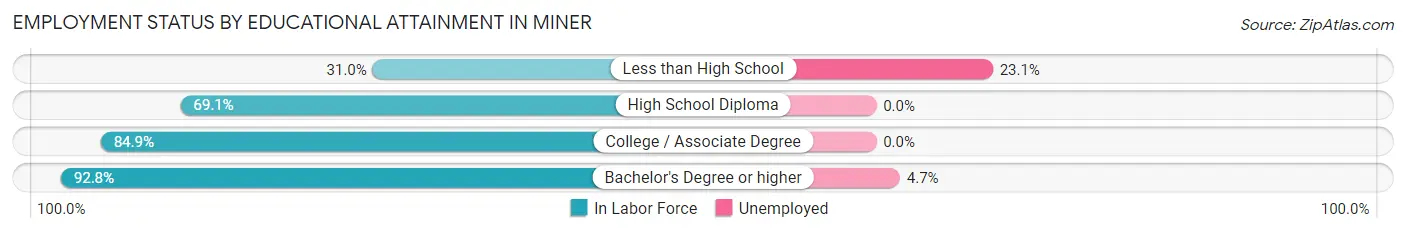
| Educational Attainment | In Labor Force | Unemployed |
| Less than High School | 13 (31.0%) | 10 (23.1%) |
| High School Diploma | 161 (69.1%) | 0 (0.0%) |
| College / Associate Degree | 45 (84.9%) | 0 (0.0%) |
| Bachelor's Degree or higher | 64 (92.8%) | 3 (4.7%) |
| Total | 283 (71.3%) | 8 (2.1%) |
Employment Occupations by Sex in Miner
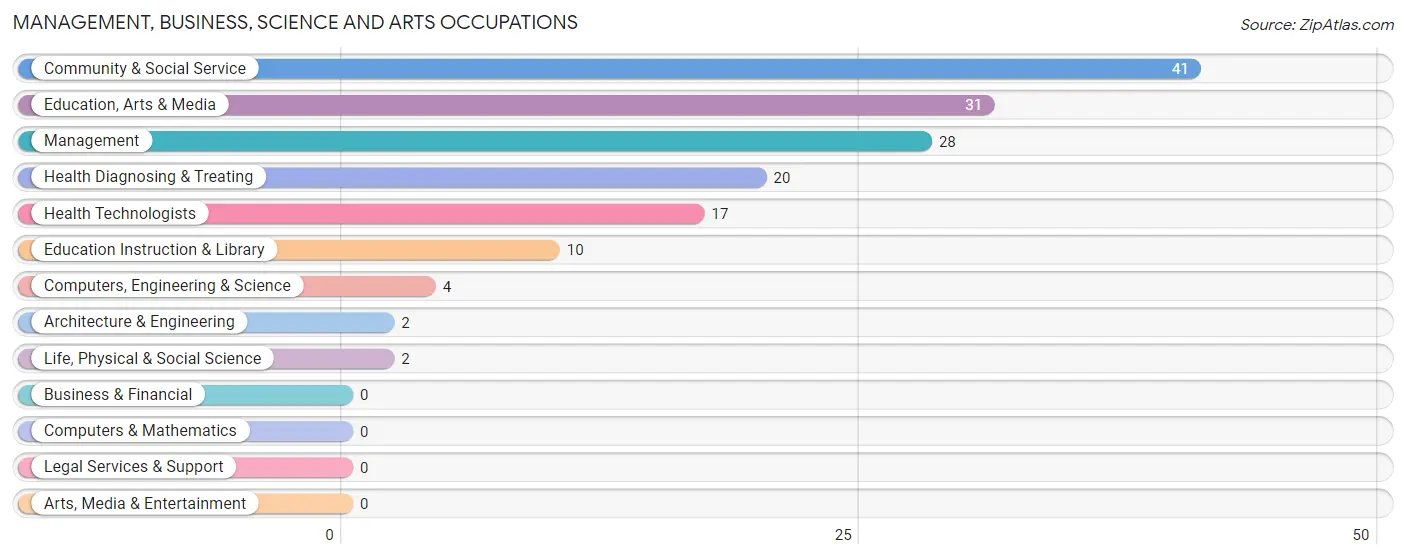
Management, Business, Science and Arts Occupations
The most common Management, Business, Science and Arts occupations in Miner are Community & Social Service (41 | 10.8%), Education, Arts & Media (31 | 8.2%), Management (28 | 7.4%), Health Diagnosing & Treating (20 | 5.3%), and Health Technologists (17 | 4.5%).
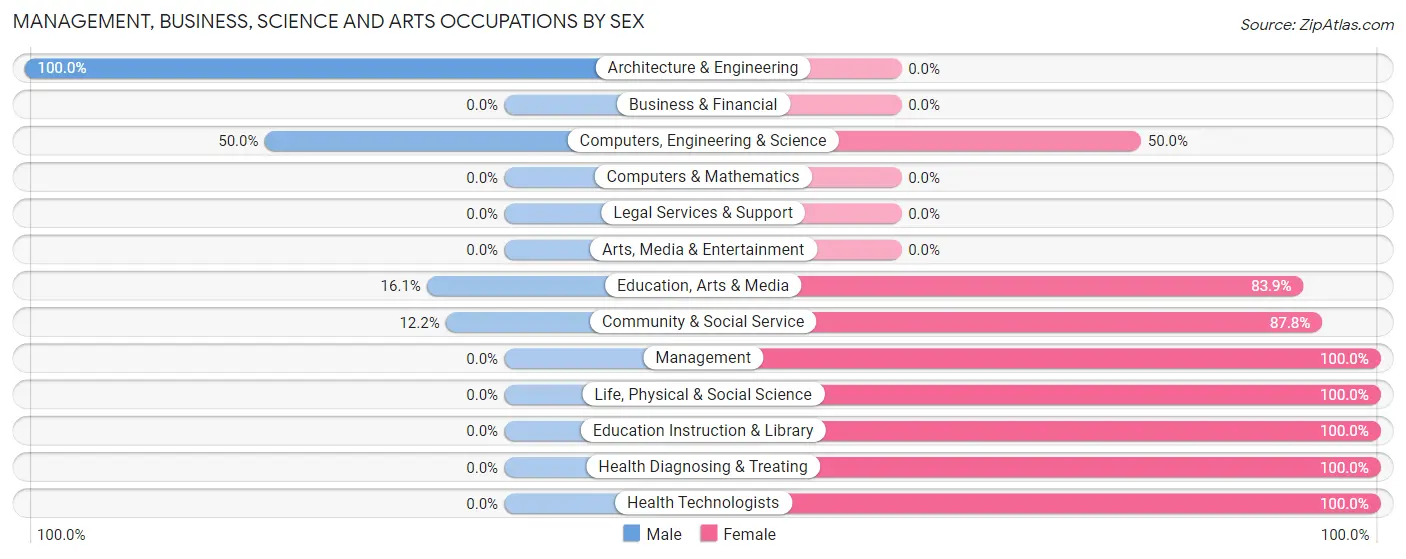
Management, Business, Science and Arts Occupations by Sex
Within the Management, Business, Science and Arts occupations in Miner, the most male-oriented occupations are Architecture & Engineering (100.0%), Computers, Engineering & Science (50.0%), and Education, Arts & Media (16.1%), while the most female-oriented occupations are Management (100.0%), Life, Physical & Social Science (100.0%), and Education Instruction & Library (100.0%).
| Occupation | Male | Female |
| Management | 0 (0.0%) | 28 (100.0%) |
| Business & Financial | 0 (0.0%) | 0 (0.0%) |
| Computers, Engineering & Science | 2 (50.0%) | 2 (50.0%) |
| Computers & Mathematics | 0 (0.0%) | 0 (0.0%) |
| Architecture & Engineering | 2 (100.0%) | 0 (0.0%) |
| Life, Physical & Social Science | 0 (0.0%) | 2 (100.0%) |
| Community & Social Service | 5 (12.2%) | 36 (87.8%) |
| Education, Arts & Media | 5 (16.1%) | 26 (83.9%) |
| Legal Services & Support | 0 (0.0%) | 0 (0.0%) |
| Education Instruction & Library | 0 (0.0%) | 10 (100.0%) |
| Arts, Media & Entertainment | 0 (0.0%) | 0 (0.0%) |
| Health Diagnosing & Treating | 0 (0.0%) | 20 (100.0%) |
| Health Technologists | 0 (0.0%) | 17 (100.0%) |
| Total (Category) | 7 (7.5%) | 86 (92.5%) |
| Total (Overall) | 161 (42.4%) | 219 (57.6%) |
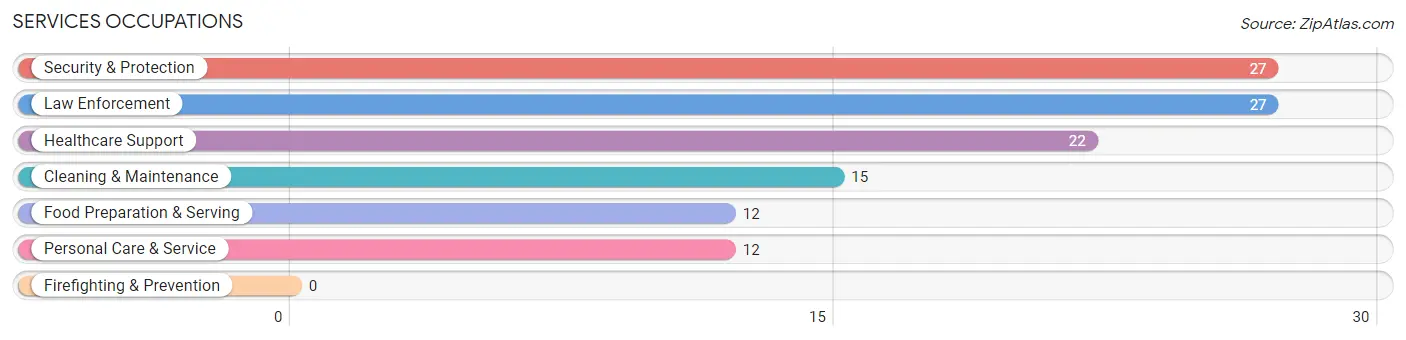
Services Occupations
The most common Services occupations in Miner are Security & Protection (27 | 7.1%), Law Enforcement (27 | 7.1%), Healthcare Support (22 | 5.8%), Cleaning & Maintenance (15 | 4.0%), and Food Preparation & Serving (12 | 3.2%).
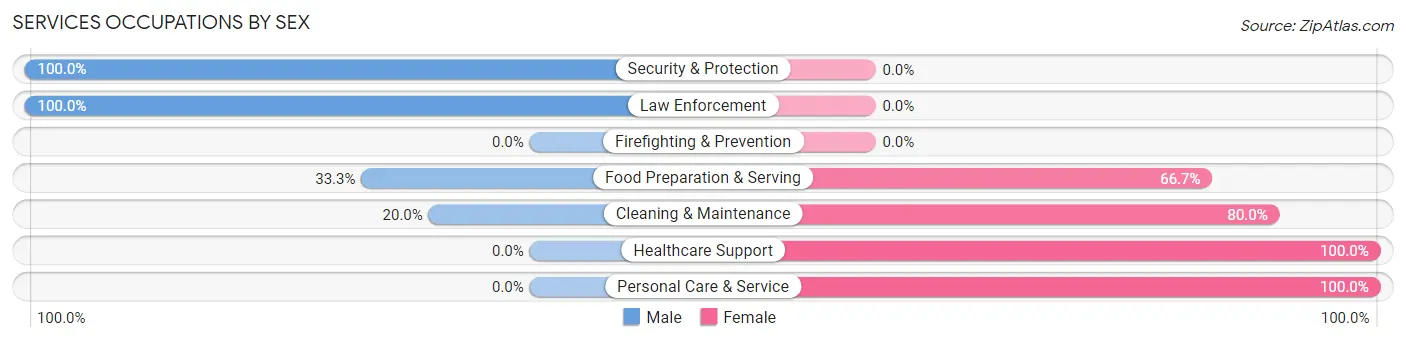
Services Occupations by Sex
Within the Services occupations in Miner, the most male-oriented occupations are Security & Protection (100.0%), Law Enforcement (100.0%), and Food Preparation & Serving (33.3%), while the most female-oriented occupations are Healthcare Support (100.0%), Personal Care & Service (100.0%), and Cleaning & Maintenance (80.0%).
| Occupation | Male | Female |
| Healthcare Support | 0 (0.0%) | 22 (100.0%) |
| Security & Protection | 27 (100.0%) | 0 (0.0%) |
| Firefighting & Prevention | 0 (0.0%) | 0 (0.0%) |
| Law Enforcement | 27 (100.0%) | 0 (0.0%) |
| Food Preparation & Serving | 4 (33.3%) | 8 (66.7%) |
| Cleaning & Maintenance | 3 (20.0%) | 12 (80.0%) |
| Personal Care & Service | 0 (0.0%) | 12 (100.0%) |
| Total (Category) | 34 (38.6%) | 54 (61.4%) |
| Total (Overall) | 161 (42.4%) | 219 (57.6%) |
Sales and Office Occupations
The most common Sales and Office occupations in Miner are Sales & Related (35 | 9.2%), and Office & Administration (34 | 8.9%).
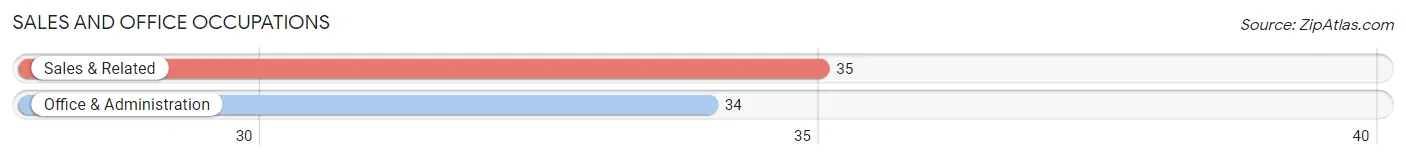
Sales and Office Occupations by Sex
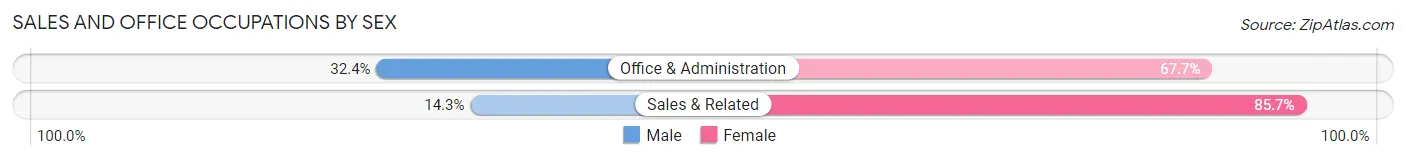
| Occupation | Male | Female |
| Sales & Related | 5 (14.3%) | 30 (85.7%) |
| Office & Administration | 11 (32.4%) | 23 (67.6%) |
| Total (Category) | 16 (23.2%) | 53 (76.8%) |
| Total (Overall) | 161 (42.4%) | 219 (57.6%) |
Natural Resources, Construction and Maintenance Occupations
The most common Natural Resources, Construction and Maintenance occupations in Miner are Installation, Maintenance & Repair (12 | 3.2%), and Construction & Extraction (4 | 1.1%).
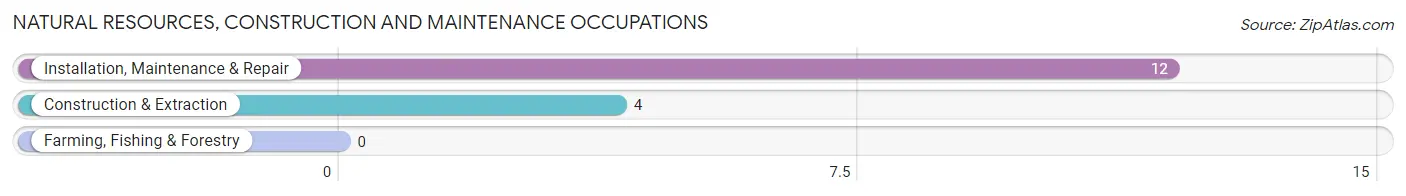
Natural Resources, Construction and Maintenance Occupations by Sex
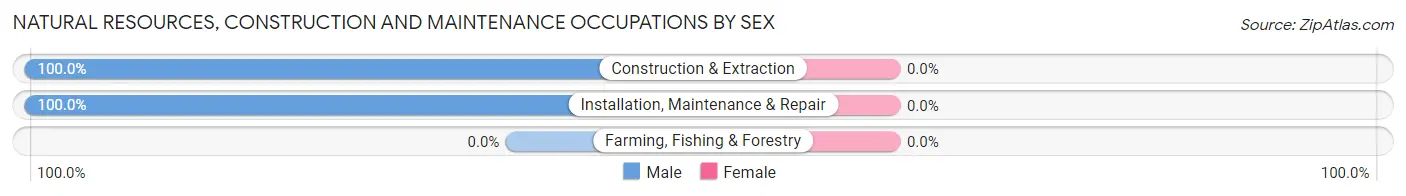
| Occupation | Male | Female |
| Farming, Fishing & Forestry | 0 (0.0%) | 0 (0.0%) |
| Construction & Extraction | 4 (100.0%) | 0 (0.0%) |
| Installation, Maintenance & Repair | 12 (100.0%) | 0 (0.0%) |
| Total (Category) | 16 (100.0%) | 0 (0.0%) |
| Total (Overall) | 161 (42.4%) | 219 (57.6%) |
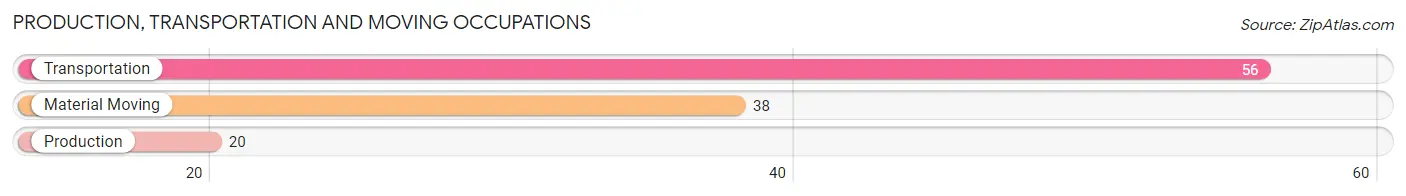
Production, Transportation and Moving Occupations
The most common Production, Transportation and Moving occupations in Miner are Transportation (56 | 14.7%), Material Moving (38 | 10.0%), and Production (20 | 5.3%).
Production, Transportation and Moving Occupations by Sex
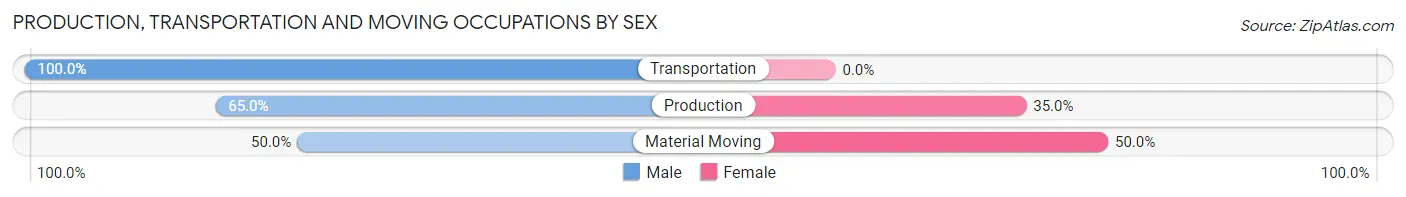
| Occupation | Male | Female |
| Production | 13 (65.0%) | 7 (35.0%) |
| Transportation | 56 (100.0%) | 0 (0.0%) |
| Material Moving | 19 (50.0%) | 19 (50.0%) |
| Total (Category) | 88 (77.2%) | 26 (22.8%) |
| Total (Overall) | 161 (42.4%) | 219 (57.6%) |
Employment Industries by Sex in Miner
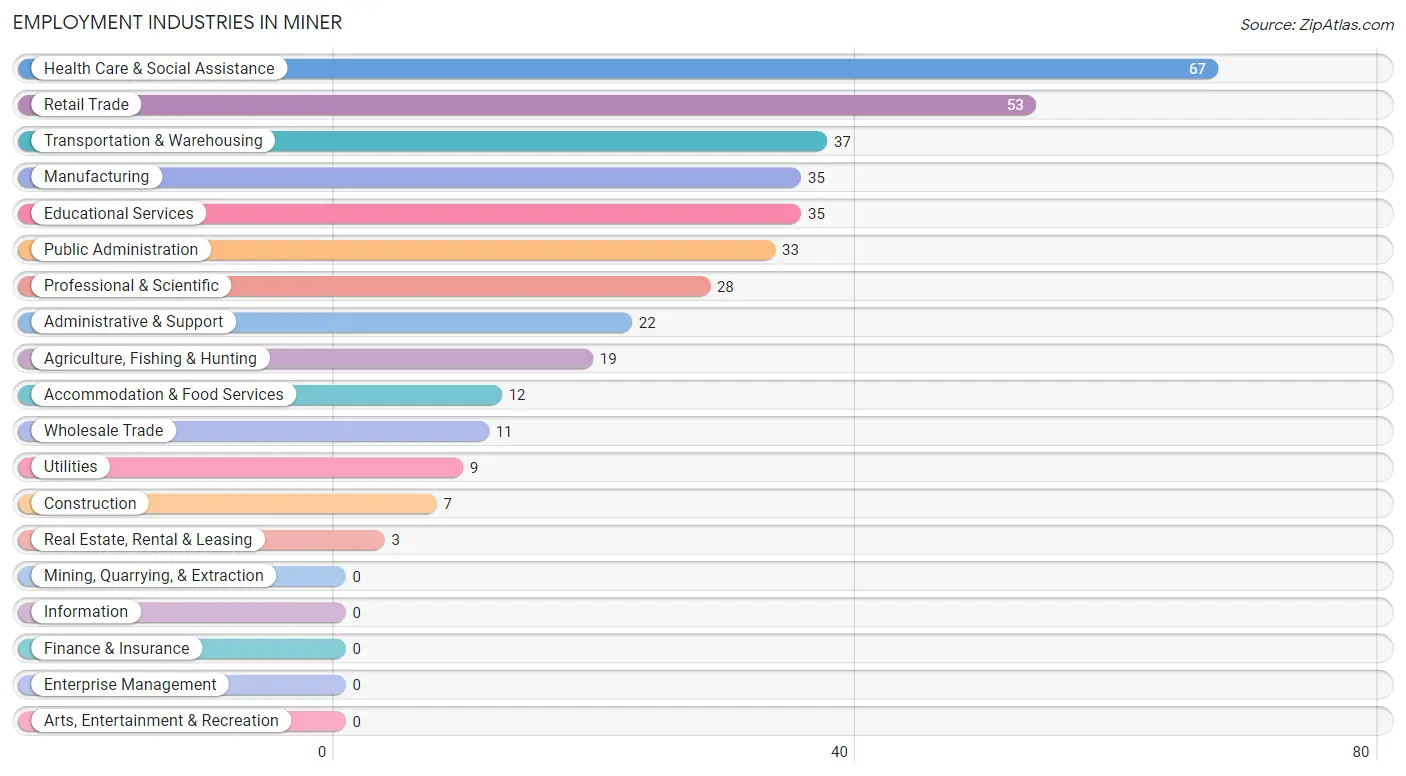
Employment Industries in Miner
The major employment industries in Miner include Health Care & Social Assistance (67 | 17.6%), Retail Trade (53 | 14.0%), Transportation & Warehousing (37 | 9.7%), Manufacturing (35 | 9.2%), and Educational Services (35 | 9.2%).
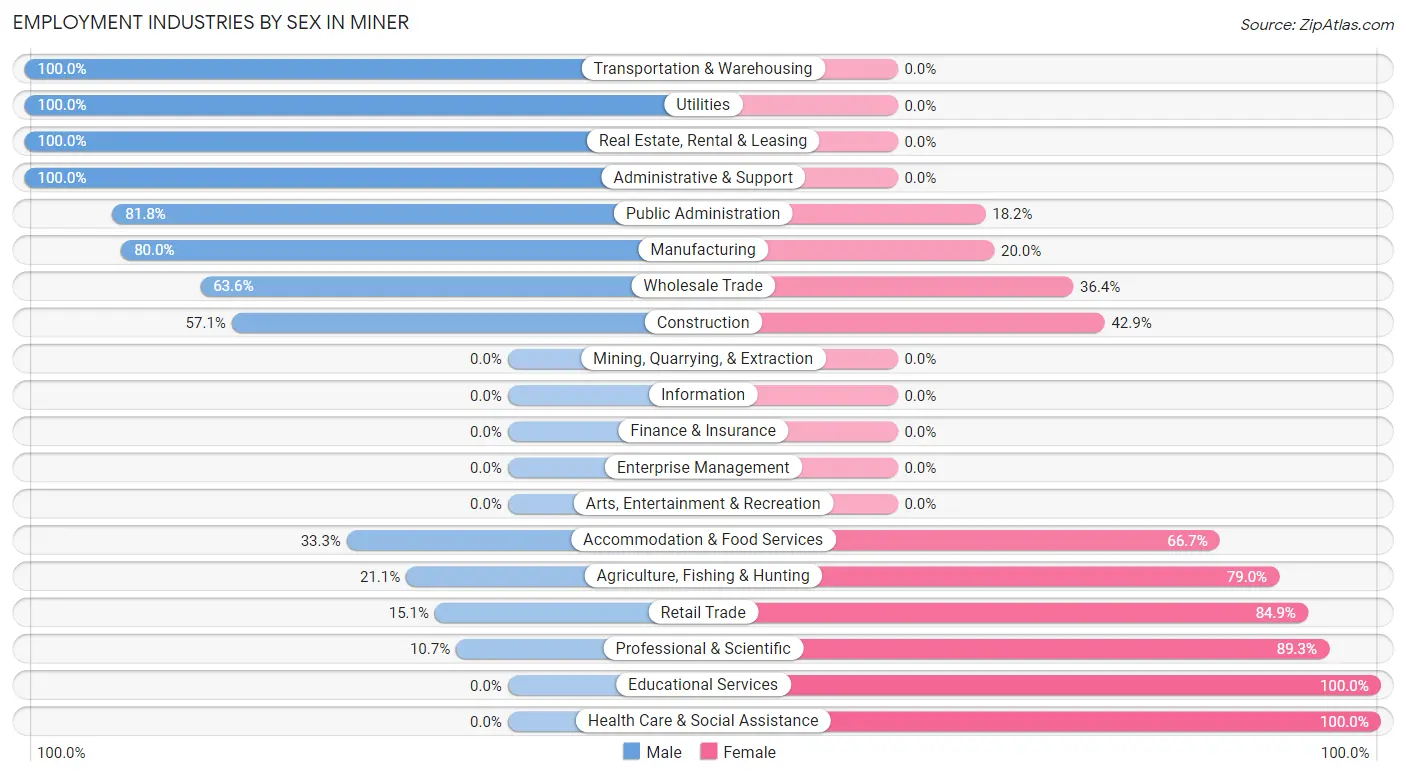
Employment Industries by Sex in Miner
The Miner industries that see more men than women are Transportation & Warehousing (100.0%), Utilities (100.0%), and Real Estate, Rental & Leasing (100.0%), whereas the industries that tend to have a higher number of women are Educational Services (100.0%), Health Care & Social Assistance (100.0%), and Professional & Scientific (89.3%).
| Industry | Male | Female |
| Agriculture, Fishing & Hunting | 4 (21.0%) | 15 (78.9%) |
| Mining, Quarrying, & Extraction | 0 (0.0%) | 0 (0.0%) |
| Construction | 4 (57.1%) | 3 (42.9%) |
| Manufacturing | 28 (80.0%) | 7 (20.0%) |
| Wholesale Trade | 7 (63.6%) | 4 (36.4%) |
| Retail Trade | 8 (15.1%) | 45 (84.9%) |
| Transportation & Warehousing | 37 (100.0%) | 0 (0.0%) |
| Utilities | 9 (100.0%) | 0 (0.0%) |
| Information | 0 (0.0%) | 0 (0.0%) |
| Finance & Insurance | 0 (0.0%) | 0 (0.0%) |
| Real Estate, Rental & Leasing | 3 (100.0%) | 0 (0.0%) |
| Professional & Scientific | 3 (10.7%) | 25 (89.3%) |
| Enterprise Management | 0 (0.0%) | 0 (0.0%) |
| Administrative & Support | 22 (100.0%) | 0 (0.0%) |
| Educational Services | 0 (0.0%) | 35 (100.0%) |
| Health Care & Social Assistance | 0 (0.0%) | 67 (100.0%) |
| Arts, Entertainment & Recreation | 0 (0.0%) | 0 (0.0%) |
| Accommodation & Food Services | 4 (33.3%) | 8 (66.7%) |
| Public Administration | 27 (81.8%) | 6 (18.2%) |
| Total | 161 (42.4%) | 219 (57.6%) |
Education in Miner
School Enrollment in Miner
The most common levels of schooling among the 201 students in Miner are elementary school (57 | 28.4%), kindergarten (38 | 18.9%), and college / undergraduate (33 | 16.4%).
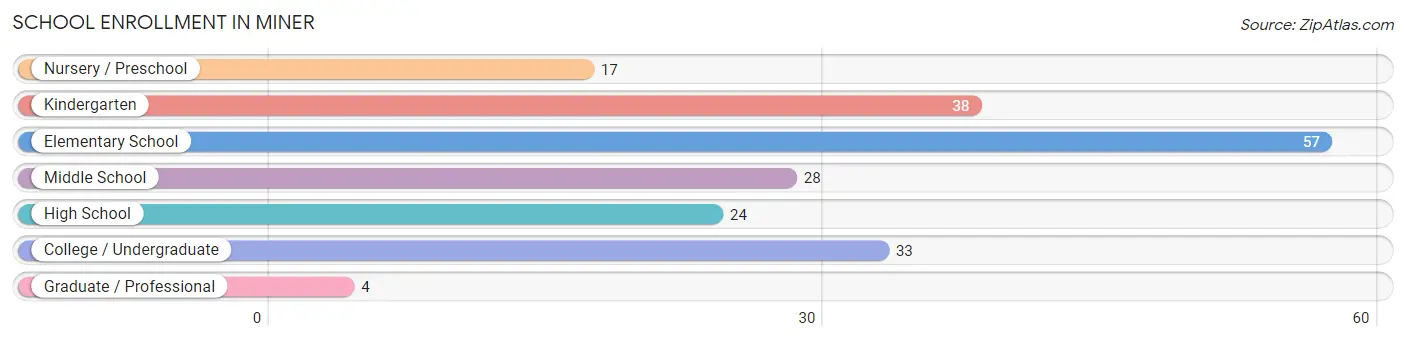
| School Level | # Students | % Students |
| Nursery / Preschool | 17 | 8.5% |
| Kindergarten | 38 | 18.9% |
| Elementary School | 57 | 28.4% |
| Middle School | 28 | 13.9% |
| High School | 24 | 11.9% |
| College / Undergraduate | 33 | 16.4% |
| Graduate / Professional | 4 | 2.0% |
| Total | 201 | 100.0% |
School Enrollment by Age by Funding Source in Miner
Out of a total of 201 students who are enrolled in schools in Miner, 18 (9.0%) attend a private institution, while the remaining 183 (91.0%) are enrolled in public schools. The age group of 10 to 14 year olds has the highest likelihood of being enrolled in private schools, with 15 (46.9% in the age bracket) enrolled. Conversely, the age group of 3 to 4 year olds has the lowest likelihood of being enrolled in a private school, with 13 (100.0% in the age bracket) attending a public institution.
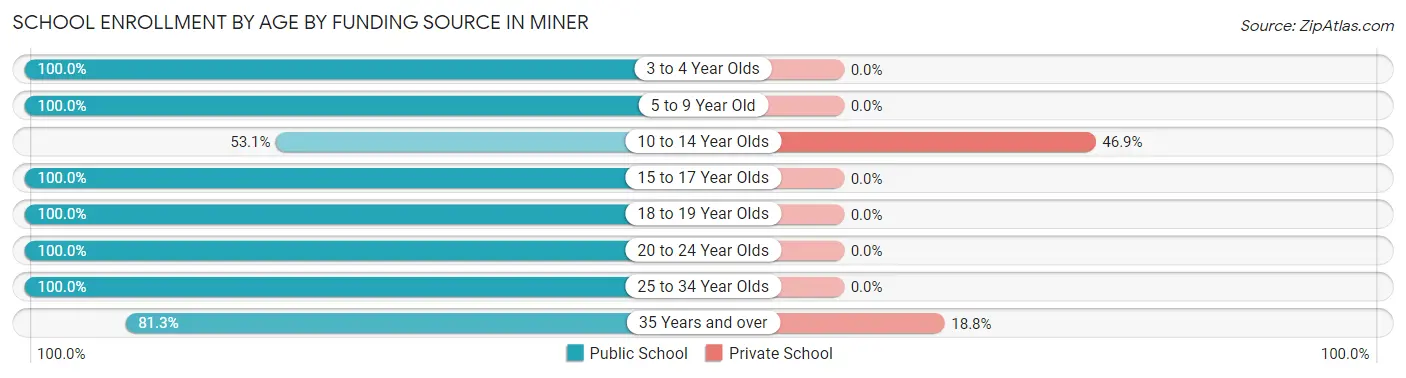
| Age Bracket | Public School | Private School |
| 3 to 4 Year Olds | 13 (100.0%) | 0 (0.0%) |
| 5 to 9 Year Old | 99 (100.0%) | 0 (0.0%) |
| 10 to 14 Year Olds | 17 (53.1%) | 15 (46.9%) |
| 15 to 17 Year Olds | 9 (100.0%) | 0 (0.0%) |
| 18 to 19 Year Olds | 5 (100.0%) | 0 (0.0%) |
| 20 to 24 Year Olds | 19 (100.0%) | 0 (0.0%) |
| 25 to 34 Year Olds | 8 (100.0%) | 0 (0.0%) |
| 35 Years and over | 13 (81.2%) | 3 (18.8%) |
| Total | 183 (91.0%) | 18 (9.0%) |
Educational Attainment by Field of Study in Miner
Education (43 | 54.4%), bio, nature & agricultural (11 | 13.9%), science & technology (9 | 11.4%), liberal arts & history (8 | 10.1%), and engineering (3 | 3.8%) are the most common fields of study among 79 individuals in Miner who have obtained a bachelor's degree or higher.
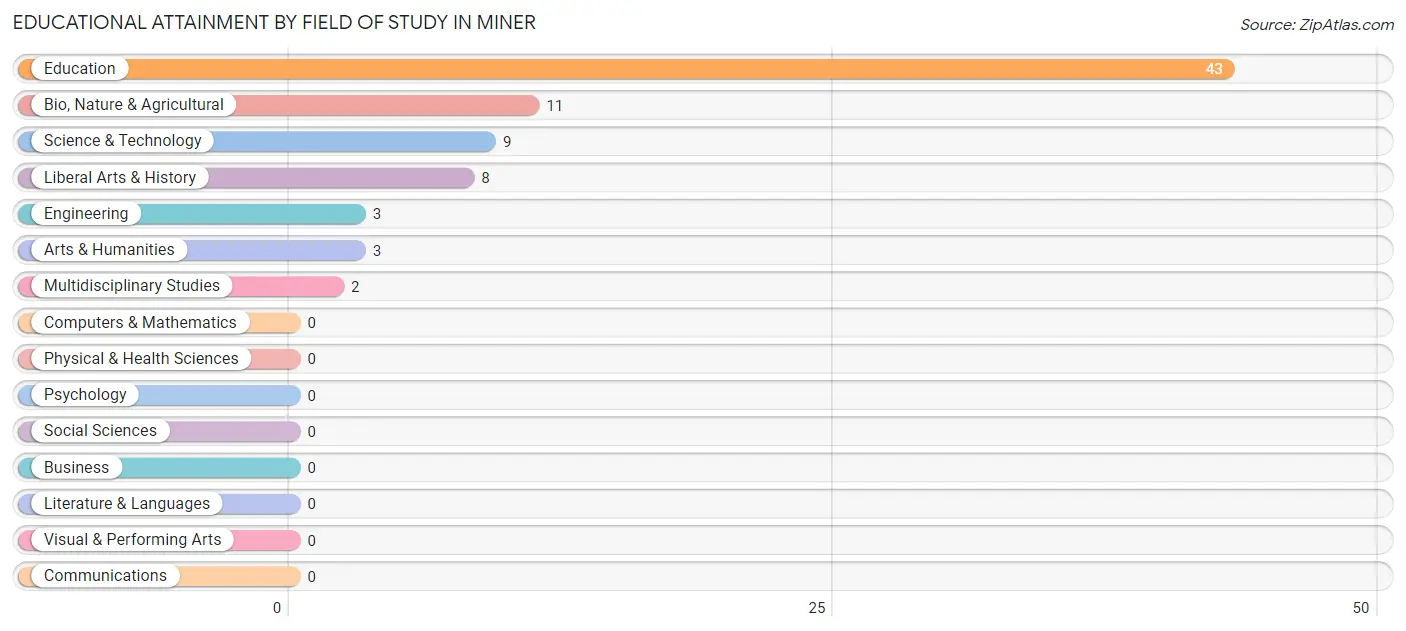
| Field of Study | # Graduates | % Graduates |
| Computers & Mathematics | 0 | 0.0% |
| Bio, Nature & Agricultural | 11 | 13.9% |
| Physical & Health Sciences | 0 | 0.0% |
| Psychology | 0 | 0.0% |
| Social Sciences | 0 | 0.0% |
| Engineering | 3 | 3.8% |
| Multidisciplinary Studies | 2 | 2.5% |
| Science & Technology | 9 | 11.4% |
| Business | 0 | 0.0% |
| Education | 43 | 54.4% |
| Literature & Languages | 0 | 0.0% |
| Liberal Arts & History | 8 | 10.1% |
| Visual & Performing Arts | 0 | 0.0% |
| Communications | 0 | 0.0% |
| Arts & Humanities | 3 | 3.8% |
| Total | 79 | 100.0% |
Transportation & Commute in Miner
Vehicle Availability by Sex in Miner
The most prevalent vehicle ownership categories in Miner are males with 3 vehicles (83, accounting for 51.5%) and females with 3 vehicles (79, making up 42.3%).
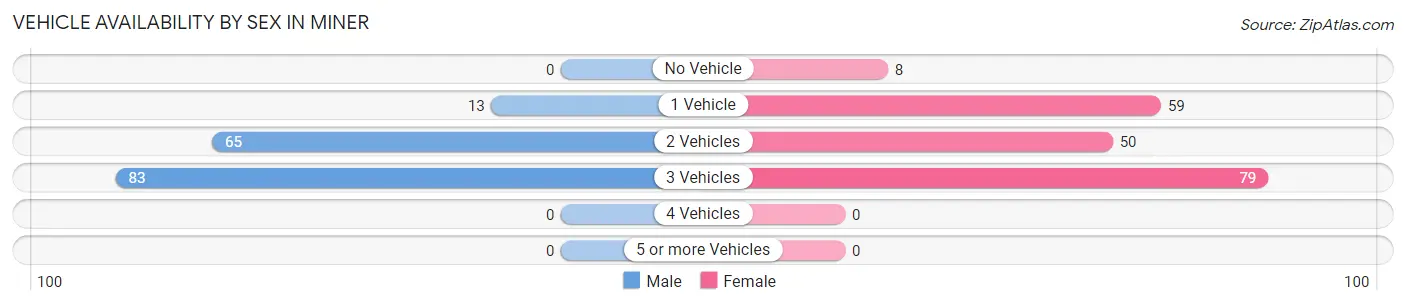
| Vehicles Available | Male | Female |
| No Vehicle | 0 (0.0%) | 8 (4.1%) |
| 1 Vehicle | 13 (8.1%) | 59 (30.1%) |
| 2 Vehicles | 65 (40.4%) | 50 (25.5%) |
| 3 Vehicles | 83 (51.5%) | 79 (40.3%) |
| 4 Vehicles | 0 (0.0%) | 0 (0.0%) |
| 5 or more Vehicles | 0 (0.0%) | 0 (0.0%) |
| Total | 161 (100.0%) | 196 (100.0%) |
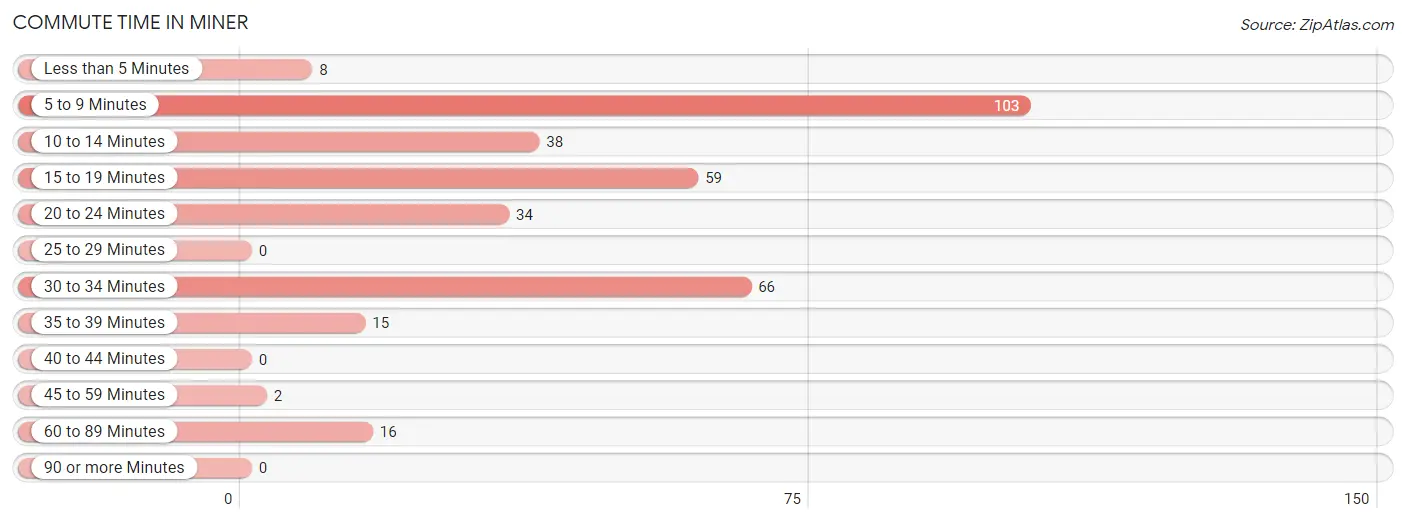
Commute Time in Miner
The most frequently occuring commute durations in Miner are 5 to 9 minutes (103 commuters, 30.2%), 30 to 34 minutes (66 commuters, 19.4%), and 15 to 19 minutes (59 commuters, 17.3%).
| Commute Time | # Commuters | % Commuters |
| Less than 5 Minutes | 8 | 2.4% |
| 5 to 9 Minutes | 103 | 30.2% |
| 10 to 14 Minutes | 38 | 11.1% |
| 15 to 19 Minutes | 59 | 17.3% |
| 20 to 24 Minutes | 34 | 10.0% |
| 25 to 29 Minutes | 0 | 0.0% |
| 30 to 34 Minutes | 66 | 19.4% |
| 35 to 39 Minutes | 15 | 4.4% |
| 40 to 44 Minutes | 0 | 0.0% |
| 45 to 59 Minutes | 2 | 0.6% |
| 60 to 89 Minutes | 16 | 4.7% |
| 90 or more Minutes | 0 | 0.0% |
Commute Time by Sex in Miner
The most common commute times in Miner are 30 to 34 minutes (62 commuters, 38.5%) for males and 5 to 9 minutes (66 commuters, 36.7%) for females.
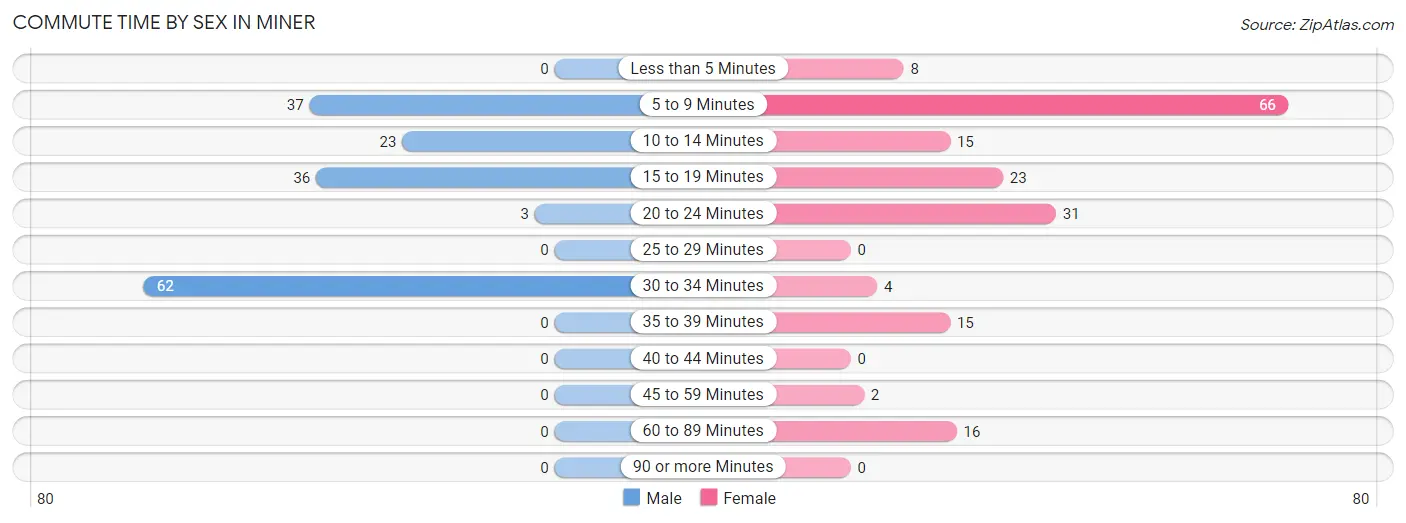
| Commute Time | Male | Female |
| Less than 5 Minutes | 0 (0.0%) | 8 (4.4%) |
| 5 to 9 Minutes | 37 (23.0%) | 66 (36.7%) |
| 10 to 14 Minutes | 23 (14.3%) | 15 (8.3%) |
| 15 to 19 Minutes | 36 (22.4%) | 23 (12.8%) |
| 20 to 24 Minutes | 3 (1.9%) | 31 (17.2%) |
| 25 to 29 Minutes | 0 (0.0%) | 0 (0.0%) |
| 30 to 34 Minutes | 62 (38.5%) | 4 (2.2%) |
| 35 to 39 Minutes | 0 (0.0%) | 15 (8.3%) |
| 40 to 44 Minutes | 0 (0.0%) | 0 (0.0%) |
| 45 to 59 Minutes | 0 (0.0%) | 2 (1.1%) |
| 60 to 89 Minutes | 0 (0.0%) | 16 (8.9%) |
| 90 or more Minutes | 0 (0.0%) | 0 (0.0%) |
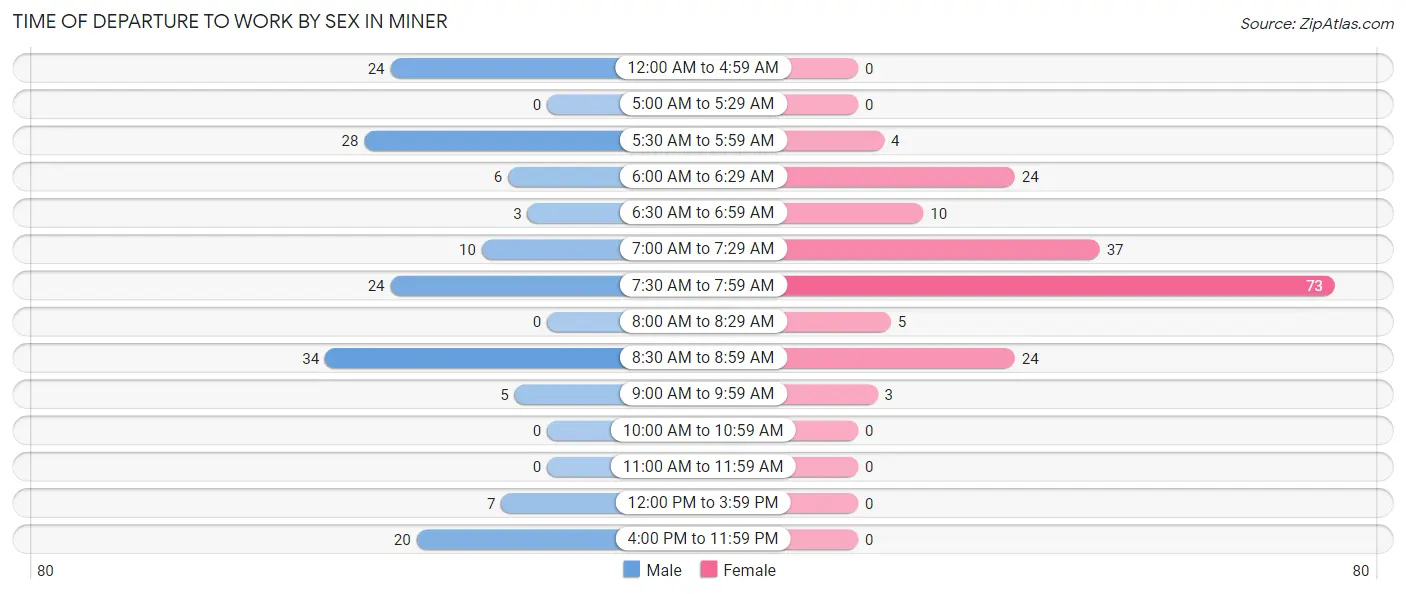
Time of Departure to Work by Sex in Miner
The most frequent times of departure to work in Miner are 8:30 AM to 8:59 AM (34, 21.1%) for males and 7:30 AM to 7:59 AM (73, 40.6%) for females.
| Time of Departure | Male | Female |
| 12:00 AM to 4:59 AM | 24 (14.9%) | 0 (0.0%) |
| 5:00 AM to 5:29 AM | 0 (0.0%) | 0 (0.0%) |
| 5:30 AM to 5:59 AM | 28 (17.4%) | 4 (2.2%) |
| 6:00 AM to 6:29 AM | 6 (3.7%) | 24 (13.3%) |
| 6:30 AM to 6:59 AM | 3 (1.9%) | 10 (5.6%) |
| 7:00 AM to 7:29 AM | 10 (6.2%) | 37 (20.6%) |
| 7:30 AM to 7:59 AM | 24 (14.9%) | 73 (40.6%) |
| 8:00 AM to 8:29 AM | 0 (0.0%) | 5 (2.8%) |
| 8:30 AM to 8:59 AM | 34 (21.1%) | 24 (13.3%) |
| 9:00 AM to 9:59 AM | 5 (3.1%) | 3 (1.7%) |
| 10:00 AM to 10:59 AM | 0 (0.0%) | 0 (0.0%) |
| 11:00 AM to 11:59 AM | 0 (0.0%) | 0 (0.0%) |
| 12:00 PM to 3:59 PM | 7 (4.3%) | 0 (0.0%) |
| 4:00 PM to 11:59 PM | 20 (12.4%) | 0 (0.0%) |
| Total | 161 (100.0%) | 180 (100.0%) |
Housing Occupancy in Miner
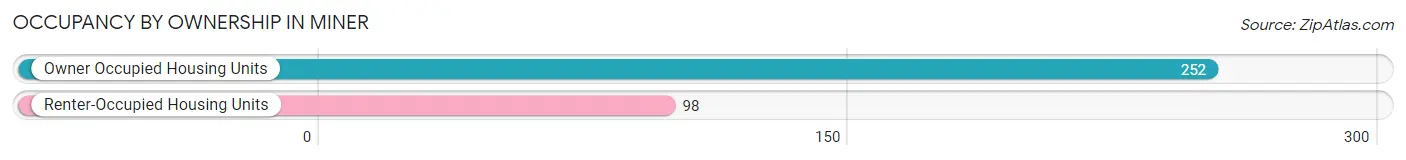
Occupancy by Ownership in Miner
Of the total 350 dwellings in Miner, owner-occupied units account for 252 (72.0%), while renter-occupied units make up 98 (28.0%).
| Occupancy | # Housing Units | % Housing Units |
| Owner Occupied Housing Units | 252 | 72.0% |
| Renter-Occupied Housing Units | 98 | 28.0% |
| Total Occupied Housing Units | 350 | 100.0% |
Occupancy by Household Size in Miner
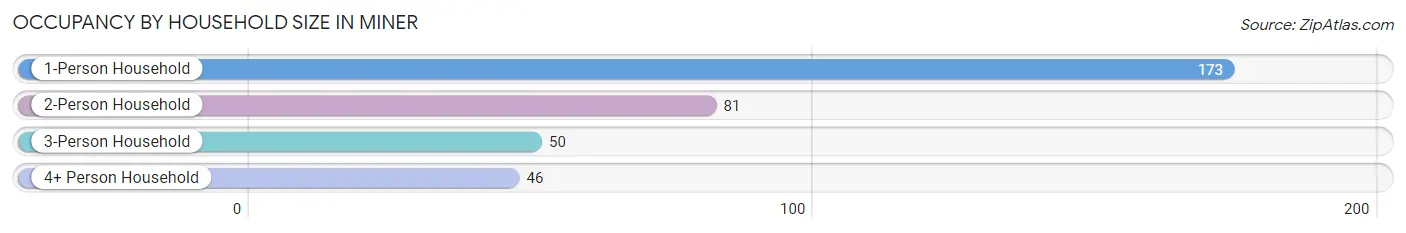
| Household Size | # Housing Units | % Housing Units |
| 1-Person Household | 173 | 49.4% |
| 2-Person Household | 81 | 23.1% |
| 3-Person Household | 50 | 14.3% |
| 4+ Person Household | 46 | 13.1% |
| Total Housing Units | 350 | 100.0% |
Occupancy by Ownership by Household Size in Miner
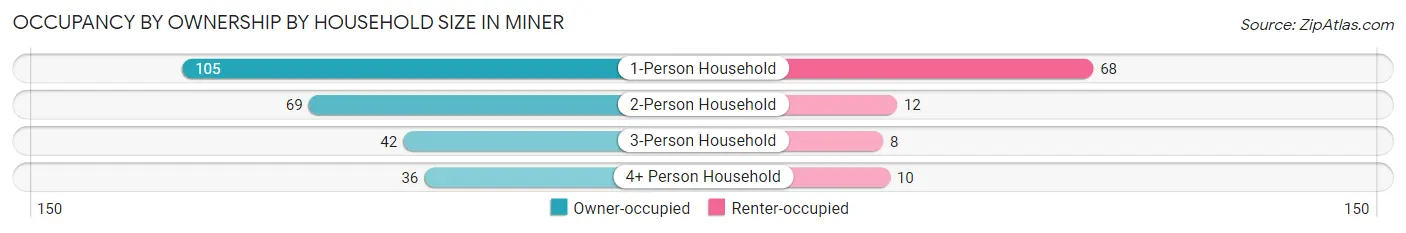
| Household Size | Owner-occupied | Renter-occupied |
| 1-Person Household | 105 (60.7%) | 68 (39.3%) |
| 2-Person Household | 69 (85.2%) | 12 (14.8%) |
| 3-Person Household | 42 (84.0%) | 8 (16.0%) |
| 4+ Person Household | 36 (78.3%) | 10 (21.7%) |
| Total Housing Units | 252 (72.0%) | 98 (28.0%) |
Occupancy by Educational Attainment in Miner
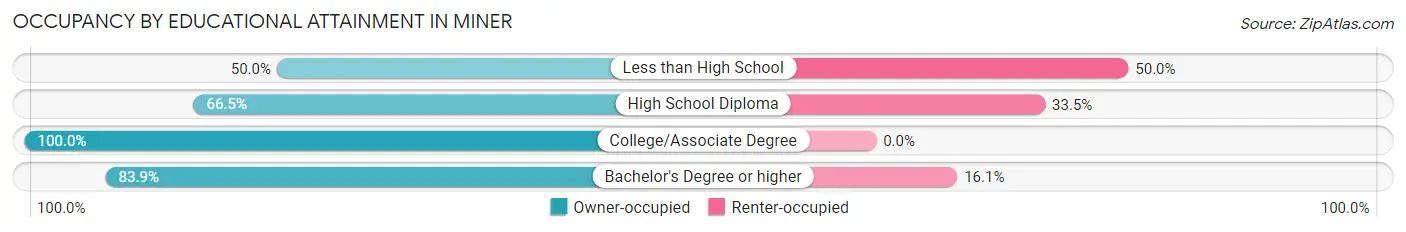
| Household Size | Owner-occupied | Renter-occupied |
| Less than High School | 23 (50.0%) | 23 (50.0%) |
| High School Diploma | 131 (66.5%) | 66 (33.5%) |
| College/Associate Degree | 51 (100.0%) | 0 (0.0%) |
| Bachelor's Degree or higher | 47 (83.9%) | 9 (16.1%) |
Occupancy by Age of Householder in Miner
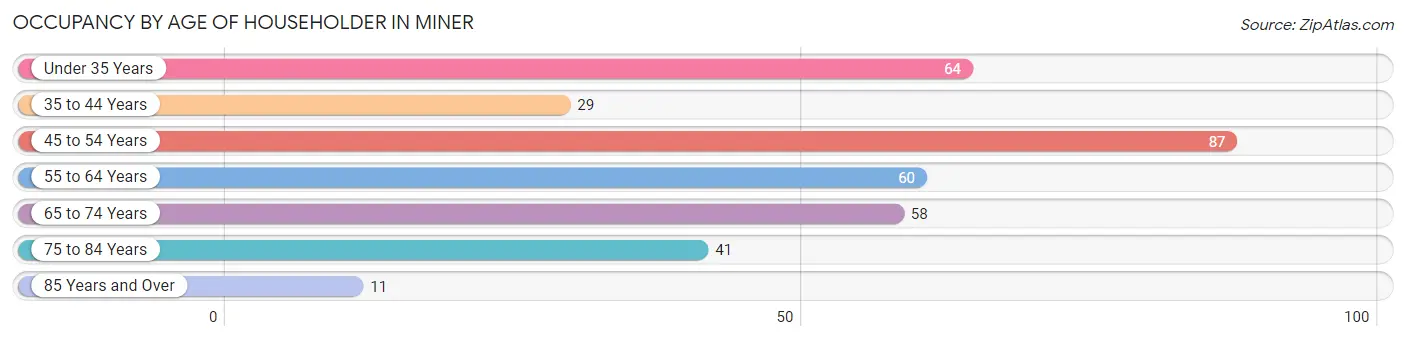
| Age Bracket | # Households | % Households |
| Under 35 Years | 64 | 18.3% |
| 35 to 44 Years | 29 | 8.3% |
| 45 to 54 Years | 87 | 24.9% |
| 55 to 64 Years | 60 | 17.1% |
| 65 to 74 Years | 58 | 16.6% |
| 75 to 84 Years | 41 | 11.7% |
| 85 Years and Over | 11 | 3.1% |
| Total | 350 | 100.0% |
Housing Finances in Miner
Median Income by Occupancy in Miner
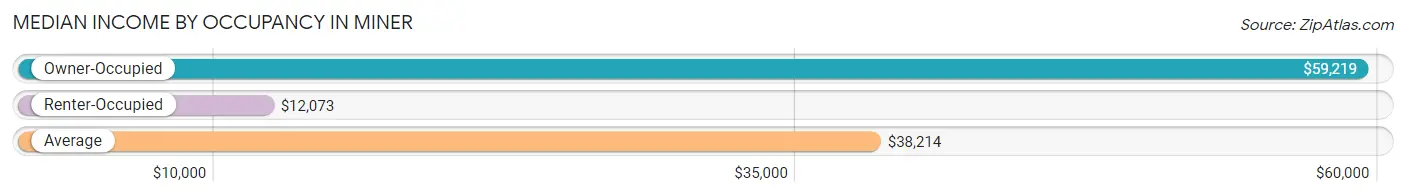
| Occupancy Type | # Households | Median Income |
| Owner-Occupied | 252 (72.0%) | $59,219 |
| Renter-Occupied | 98 (28.0%) | $12,073 |
| Average | 350 (100.0%) | $38,214 |
Occupancy by Householder Income Bracket in Miner
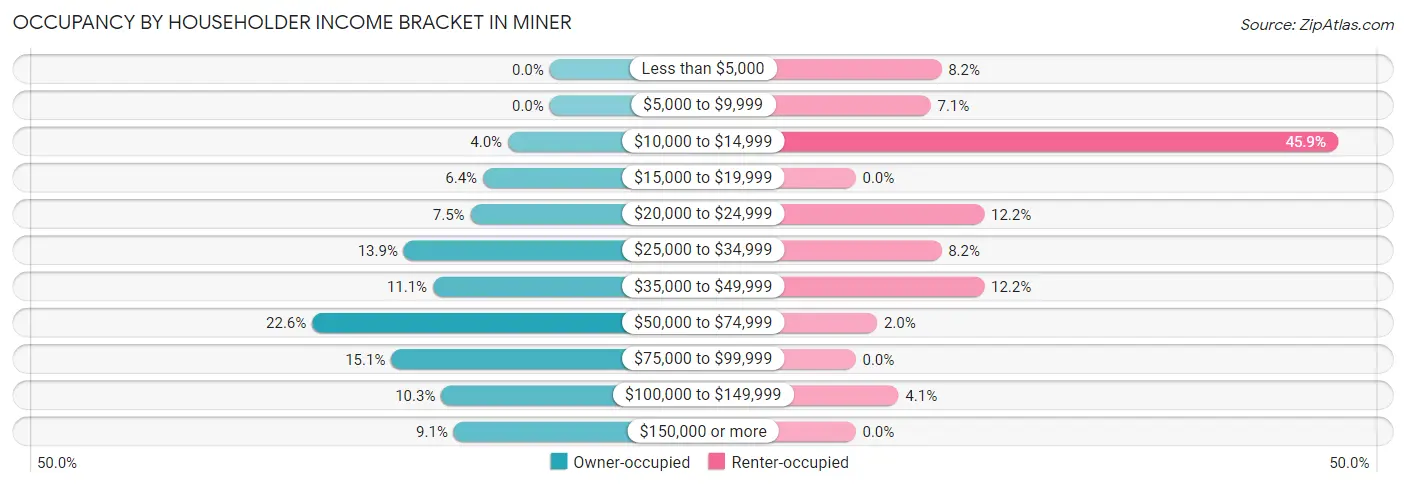
| Income Bracket | Owner-occupied | Renter-occupied |
| Less than $5,000 | 0 (0.0%) | 8 (8.2%) |
| $5,000 to $9,999 | 0 (0.0%) | 7 (7.1%) |
| $10,000 to $14,999 | 10 (4.0%) | 45 (45.9%) |
| $15,000 to $19,999 | 16 (6.4%) | 0 (0.0%) |
| $20,000 to $24,999 | 19 (7.5%) | 12 (12.2%) |
| $25,000 to $34,999 | 35 (13.9%) | 8 (8.2%) |
| $35,000 to $49,999 | 28 (11.1%) | 12 (12.2%) |
| $50,000 to $74,999 | 57 (22.6%) | 2 (2.0%) |
| $75,000 to $99,999 | 38 (15.1%) | 0 (0.0%) |
| $100,000 to $149,999 | 26 (10.3%) | 4 (4.1%) |
| $150,000 or more | 23 (9.1%) | 0 (0.0%) |
| Total | 252 (100.0%) | 98 (100.0%) |
Monthly Housing Cost Tiers in Miner
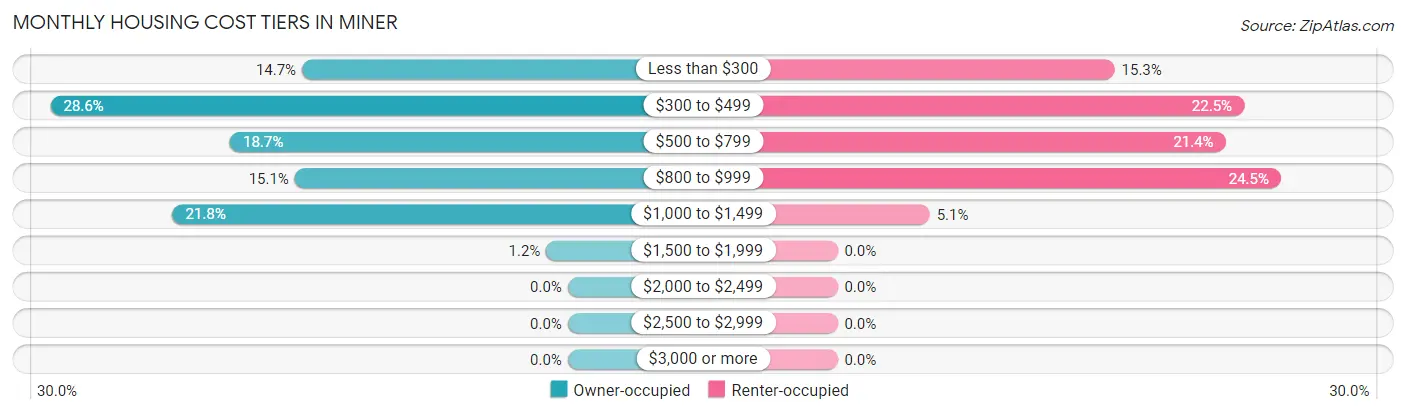
| Monthly Cost | Owner-occupied | Renter-occupied |
| Less than $300 | 37 (14.7%) | 15 (15.3%) |
| $300 to $499 | 72 (28.6%) | 22 (22.5%) |
| $500 to $799 | 47 (18.6%) | 21 (21.4%) |
| $800 to $999 | 38 (15.1%) | 24 (24.5%) |
| $1,000 to $1,499 | 55 (21.8%) | 5 (5.1%) |
| $1,500 to $1,999 | 3 (1.2%) | 0 (0.0%) |
| $2,000 to $2,499 | 0 (0.0%) | 0 (0.0%) |
| $2,500 to $2,999 | 0 (0.0%) | 0 (0.0%) |
| $3,000 or more | 0 (0.0%) | 0 (0.0%) |
| Total | 252 (100.0%) | 98 (100.0%) |
Physical Housing Characteristics in Miner
Housing Structures in Miner
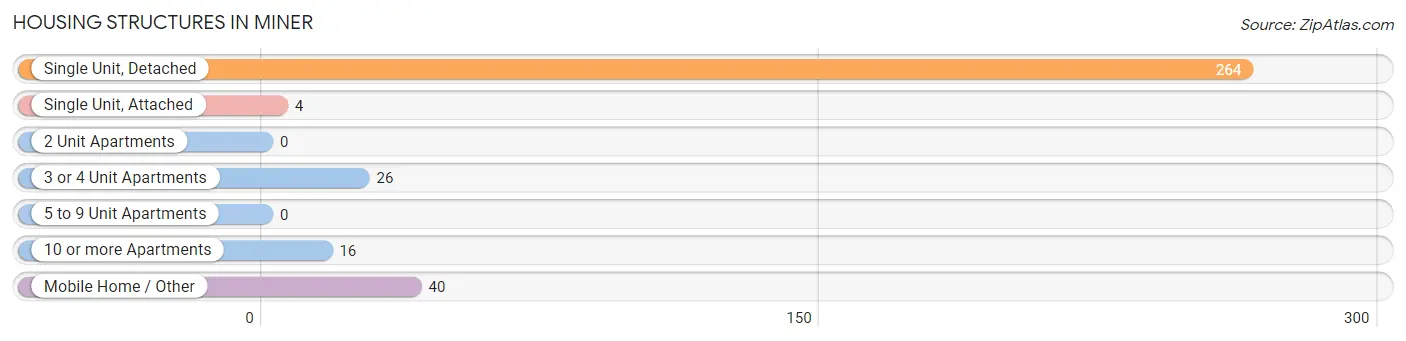
| Structure Type | # Housing Units | % Housing Units |
| Single Unit, Detached | 264 | 75.4% |
| Single Unit, Attached | 4 | 1.1% |
| 2 Unit Apartments | 0 | 0.0% |
| 3 or 4 Unit Apartments | 26 | 7.4% |
| 5 to 9 Unit Apartments | 0 | 0.0% |
| 10 or more Apartments | 16 | 4.6% |
| Mobile Home / Other | 40 | 11.4% |
| Total | 350 | 100.0% |
Housing Structures by Occupancy in Miner
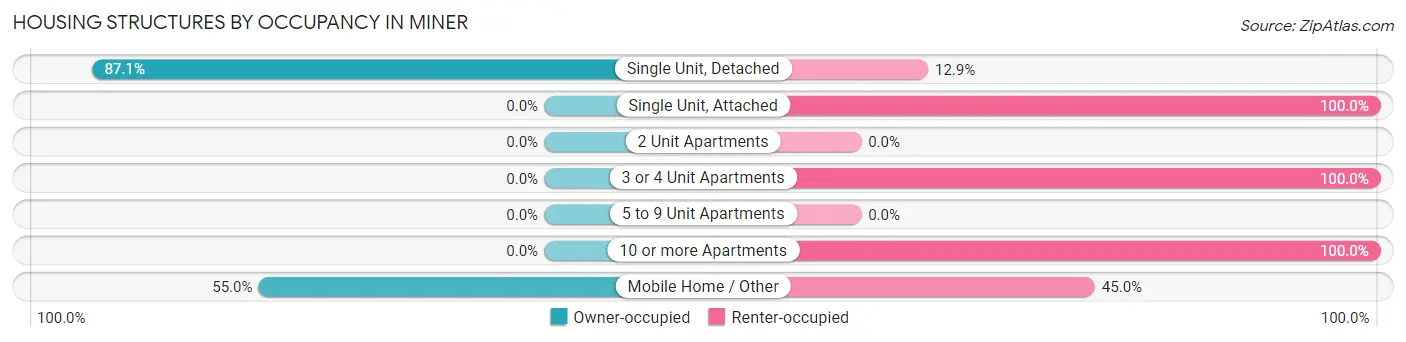
| Structure Type | Owner-occupied | Renter-occupied |
| Single Unit, Detached | 230 (87.1%) | 34 (12.9%) |
| Single Unit, Attached | 0 (0.0%) | 4 (100.0%) |
| 2 Unit Apartments | 0 (0.0%) | 0 (0.0%) |
| 3 or 4 Unit Apartments | 0 (0.0%) | 26 (100.0%) |
| 5 to 9 Unit Apartments | 0 (0.0%) | 0 (0.0%) |
| 10 or more Apartments | 0 (0.0%) | 16 (100.0%) |
| Mobile Home / Other | 22 (55.0%) | 18 (45.0%) |
| Total | 252 (72.0%) | 98 (28.0%) |
Housing Structures by Number of Rooms in Miner
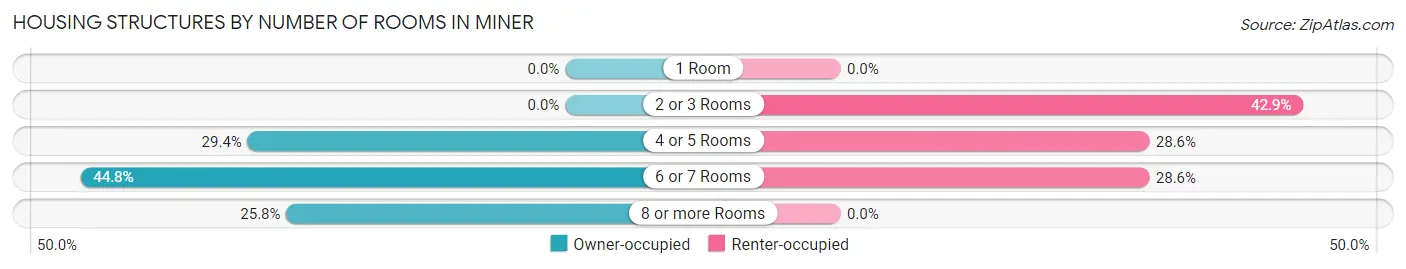
| Number of Rooms | Owner-occupied | Renter-occupied |
| 1 Room | 0 (0.0%) | 0 (0.0%) |
| 2 or 3 Rooms | 0 (0.0%) | 42 (42.9%) |
| 4 or 5 Rooms | 74 (29.4%) | 28 (28.6%) |
| 6 or 7 Rooms | 113 (44.8%) | 28 (28.6%) |
| 8 or more Rooms | 65 (25.8%) | 0 (0.0%) |
| Total | 252 (100.0%) | 98 (100.0%) |
Housing Structure by Heating Type in Miner
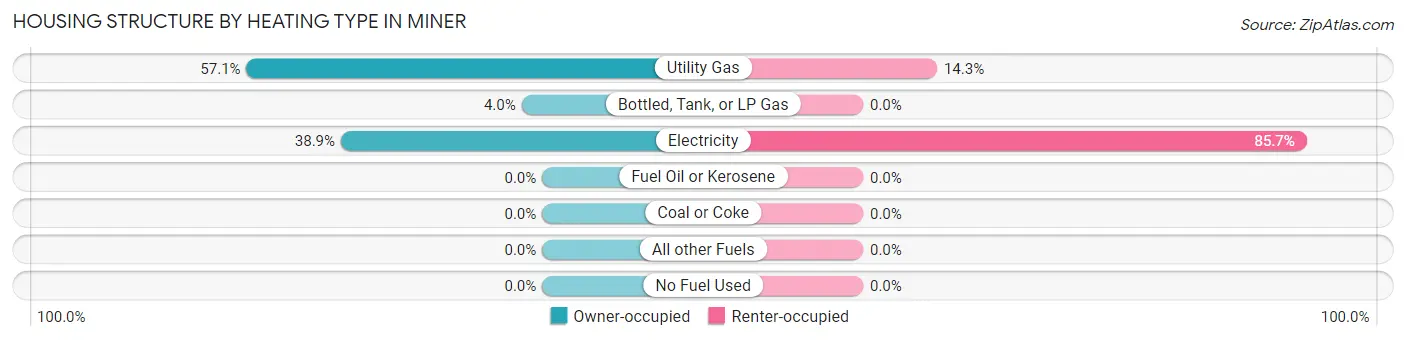
| Heating Type | Owner-occupied | Renter-occupied |
| Utility Gas | 144 (57.1%) | 14 (14.3%) |
| Bottled, Tank, or LP Gas | 10 (4.0%) | 0 (0.0%) |
| Electricity | 98 (38.9%) | 84 (85.7%) |
| Fuel Oil or Kerosene | 0 (0.0%) | 0 (0.0%) |
| Coal or Coke | 0 (0.0%) | 0 (0.0%) |
| All other Fuels | 0 (0.0%) | 0 (0.0%) |
| No Fuel Used | 0 (0.0%) | 0 (0.0%) |
| Total | 252 (100.0%) | 98 (100.0%) |
Household Vehicle Usage in Miner
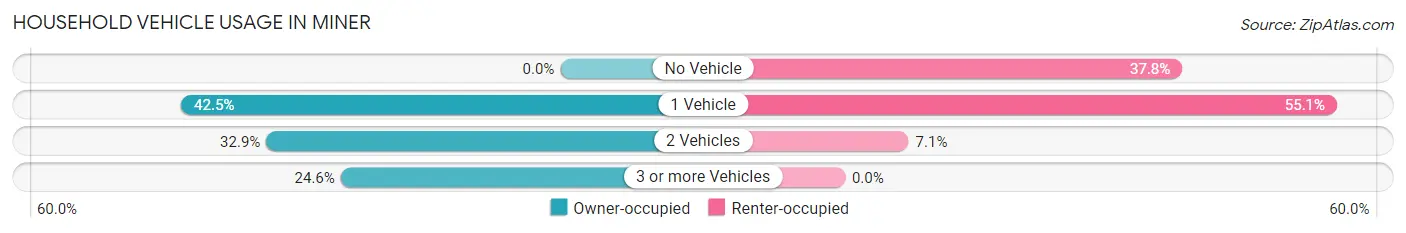
| Vehicles per Household | Owner-occupied | Renter-occupied |
| No Vehicle | 0 (0.0%) | 37 (37.8%) |
| 1 Vehicle | 107 (42.5%) | 54 (55.1%) |
| 2 Vehicles | 83 (32.9%) | 7 (7.1%) |
| 3 or more Vehicles | 62 (24.6%) | 0 (0.0%) |
| Total | 252 (100.0%) | 98 (100.0%) |
Real Estate & Mortgages in Miner
Real Estate and Mortgage Overview in Miner
| Characteristic | Without Mortgage | With Mortgage |
| Housing Units | 113 | 139 |
| Median Property Value | $90,800 | $126,100 |
| Median Household Income | $35,781 | $23 |
| Monthly Housing Costs | $356 | $0 |
| Real Estate Taxes | $735 | $9 |
Property Value by Mortgage Status in Miner
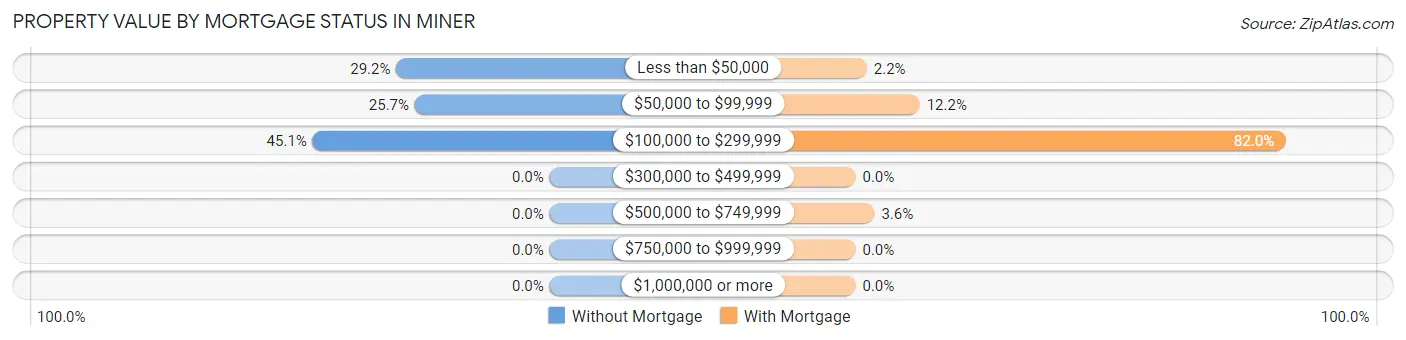
| Property Value | Without Mortgage | With Mortgage |
| Less than $50,000 | 33 (29.2%) | 3 (2.2%) |
| $50,000 to $99,999 | 29 (25.7%) | 17 (12.2%) |
| $100,000 to $299,999 | 51 (45.1%) | 114 (82.0%) |
| $300,000 to $499,999 | 0 (0.0%) | 0 (0.0%) |
| $500,000 to $749,999 | 0 (0.0%) | 5 (3.6%) |
| $750,000 to $999,999 | 0 (0.0%) | 0 (0.0%) |
| $1,000,000 or more | 0 (0.0%) | 0 (0.0%) |
| Total | 113 (100.0%) | 139 (100.0%) |
Household Income by Mortgage Status in Miner
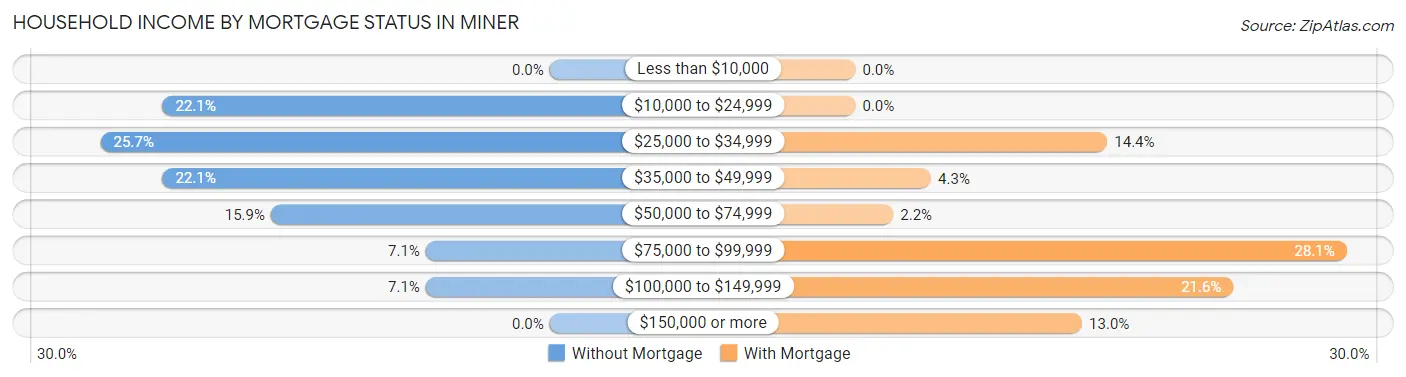
| Household Income | Without Mortgage | With Mortgage |
| Less than $10,000 | 0 (0.0%) | 0 (0.0%) |
| $10,000 to $24,999 | 25 (22.1%) | 0 (0.0%) |
| $25,000 to $34,999 | 29 (25.7%) | 20 (14.4%) |
| $35,000 to $49,999 | 25 (22.1%) | 6 (4.3%) |
| $50,000 to $74,999 | 18 (15.9%) | 3 (2.2%) |
| $75,000 to $99,999 | 8 (7.1%) | 39 (28.1%) |
| $100,000 to $149,999 | 8 (7.1%) | 30 (21.6%) |
| $150,000 or more | 0 (0.0%) | 18 (13.0%) |
| Total | 113 (100.0%) | 139 (100.0%) |
Property Value to Household Income Ratio in Miner
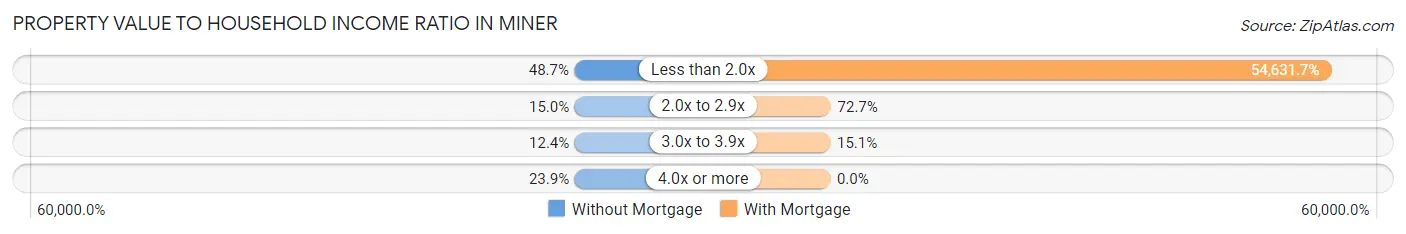
| Value-to-Income Ratio | Without Mortgage | With Mortgage |
| Less than 2.0x | 55 (48.7%) | 75,938 (54,631.7%) |
| 2.0x to 2.9x | 17 (15.0%) | 101 (72.7%) |
| 3.0x to 3.9x | 14 (12.4%) | 21 (15.1%) |
| 4.0x or more | 27 (23.9%) | 0 (0.0%) |
| Total | 113 (100.0%) | 139 (100.0%) |
Real Estate Taxes by Mortgage Status in Miner
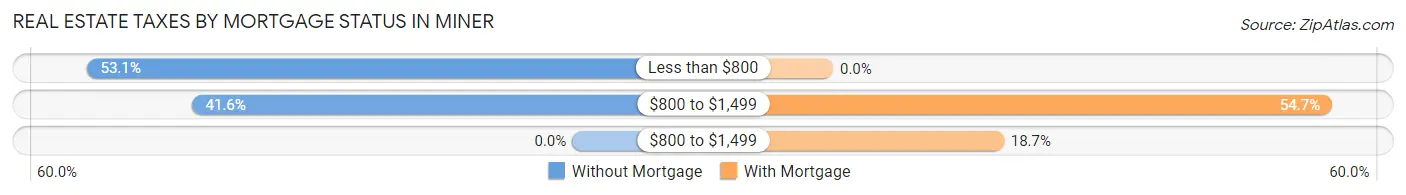
| Property Taxes | Without Mortgage | With Mortgage |
| Less than $800 | 60 (53.1%) | 0 (0.0%) |
| $800 to $1,499 | 47 (41.6%) | 76 (54.7%) |
| $800 to $1,499 | 0 (0.0%) | 26 (18.7%) |
| Total | 113 (100.0%) | 139 (100.0%) |
Health & Disability in Miner
Health Insurance Coverage by Age in Miner
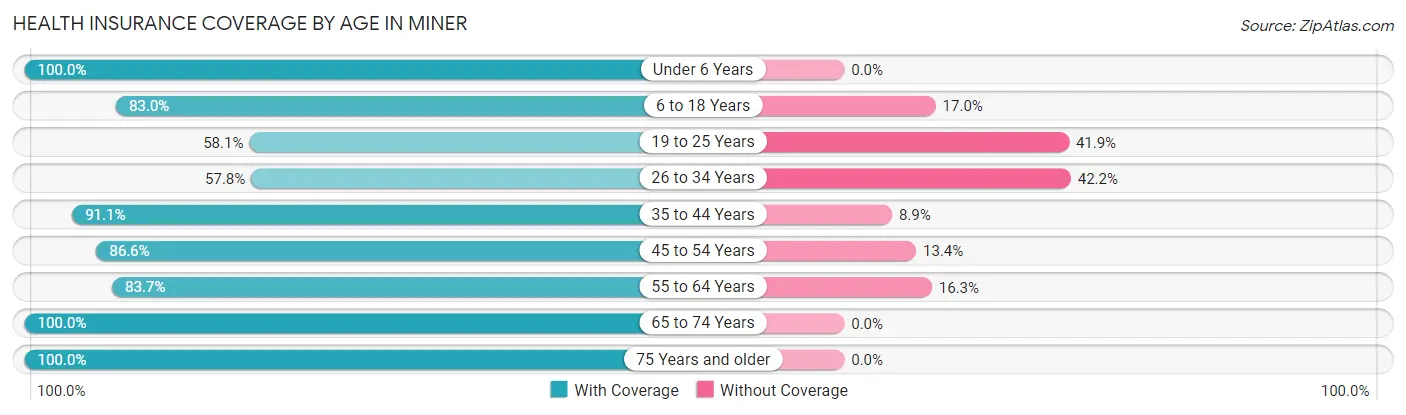
| Age Bracket | With Coverage | Without Coverage |
| Under 6 Years | 77 (100.0%) | 0 (0.0%) |
| 6 to 18 Years | 112 (83.0%) | 23 (17.0%) |
| 19 to 25 Years | 43 (58.1%) | 31 (41.9%) |
| 26 to 34 Years | 67 (57.8%) | 49 (42.2%) |
| 35 to 44 Years | 41 (91.1%) | 4 (8.9%) |
| 45 to 54 Years | 110 (86.6%) | 17 (13.4%) |
| 55 to 64 Years | 82 (83.7%) | 16 (16.3%) |
| 65 to 74 Years | 76 (100.0%) | 0 (0.0%) |
| 75 Years and older | 61 (100.0%) | 0 (0.0%) |
| Total | 669 (82.7%) | 140 (17.3%) |
Health Insurance Coverage by Citizenship Status in Miner
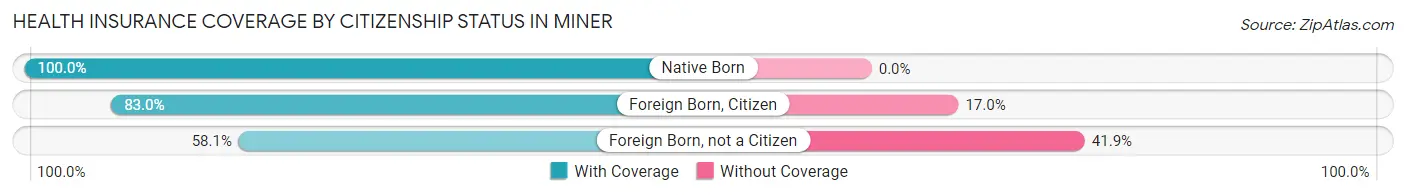
| Citizenship Status | With Coverage | Without Coverage |
| Native Born | 77 (100.0%) | 0 (0.0%) |
| Foreign Born, Citizen | 112 (83.0%) | 23 (17.0%) |
| Foreign Born, not a Citizen | 43 (58.1%) | 31 (41.9%) |
Health Insurance Coverage by Household Income in Miner
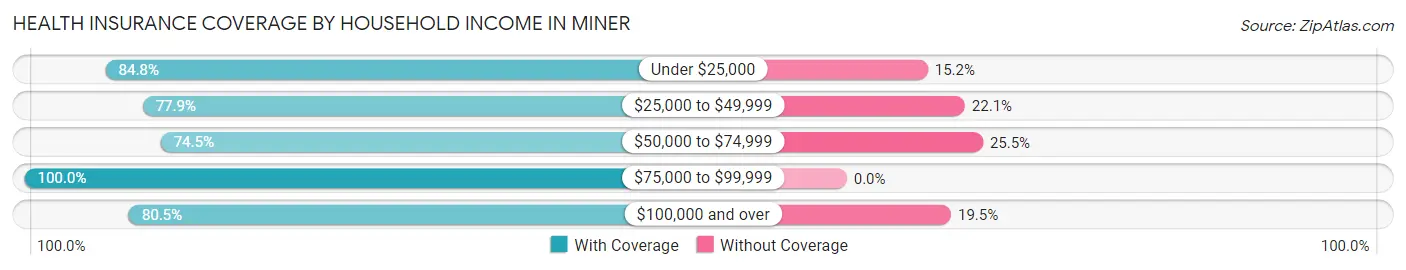
| Household Income | With Coverage | Without Coverage |
| Under $25,000 | 162 (84.8%) | 29 (15.2%) |
| $25,000 to $49,999 | 95 (77.9%) | 27 (22.1%) |
| $50,000 to $74,999 | 146 (74.5%) | 50 (25.5%) |
| $75,000 to $99,999 | 123 (100.0%) | 0 (0.0%) |
| $100,000 and over | 140 (80.5%) | 34 (19.5%) |
Public vs Private Health Insurance Coverage by Age in Miner
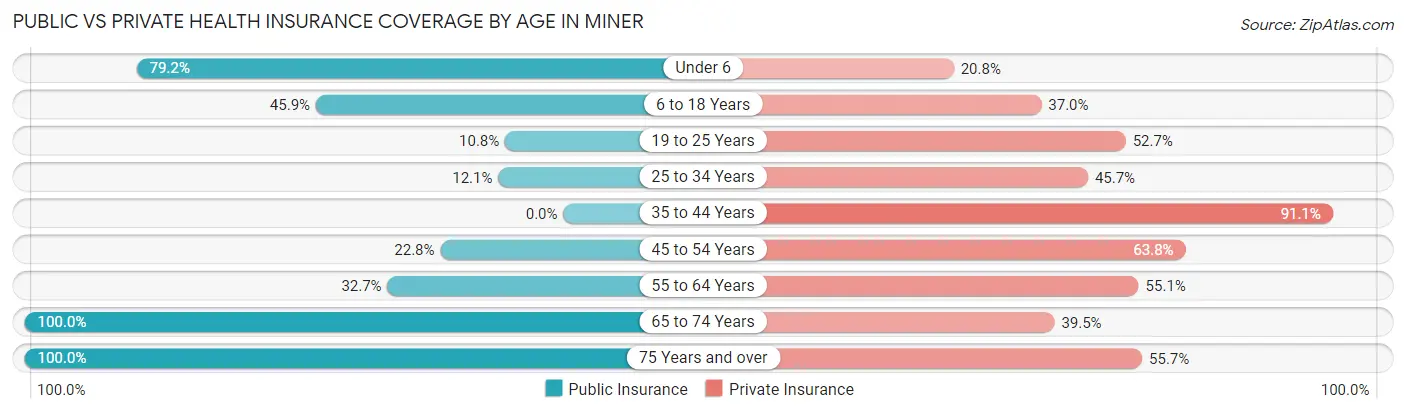
| Age Bracket | Public Insurance | Private Insurance |
| Under 6 | 61 (79.2%) | 16 (20.8%) |
| 6 to 18 Years | 62 (45.9%) | 50 (37.0%) |
| 19 to 25 Years | 8 (10.8%) | 39 (52.7%) |
| 25 to 34 Years | 14 (12.1%) | 53 (45.7%) |
| 35 to 44 Years | 0 (0.0%) | 41 (91.1%) |
| 45 to 54 Years | 29 (22.8%) | 81 (63.8%) |
| 55 to 64 Years | 32 (32.7%) | 54 (55.1%) |
| 65 to 74 Years | 76 (100.0%) | 30 (39.5%) |
| 75 Years and over | 61 (100.0%) | 34 (55.7%) |
| Total | 343 (42.4%) | 398 (49.2%) |
Disability Status by Sex by Age in Miner
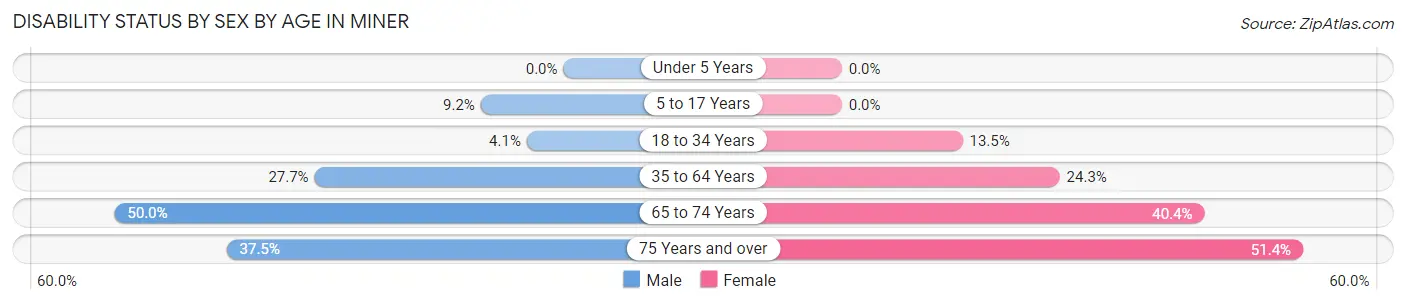
| Age Bracket | Male | Female |
| Under 5 Years | 0 (0.0%) | 0 (0.0%) |
| 5 to 17 Years | 7 (9.2%) | 0 (0.0%) |
| 18 to 34 Years | 4 (4.1%) | 16 (13.5%) |
| 35 to 64 Years | 28 (27.7%) | 41 (24.3%) |
| 65 to 74 Years | 12 (50.0%) | 21 (40.4%) |
| 75 Years and over | 9 (37.5%) | 19 (51.3%) |
Disability Class by Sex by Age in Miner
Disability Class: Hearing Difficulty
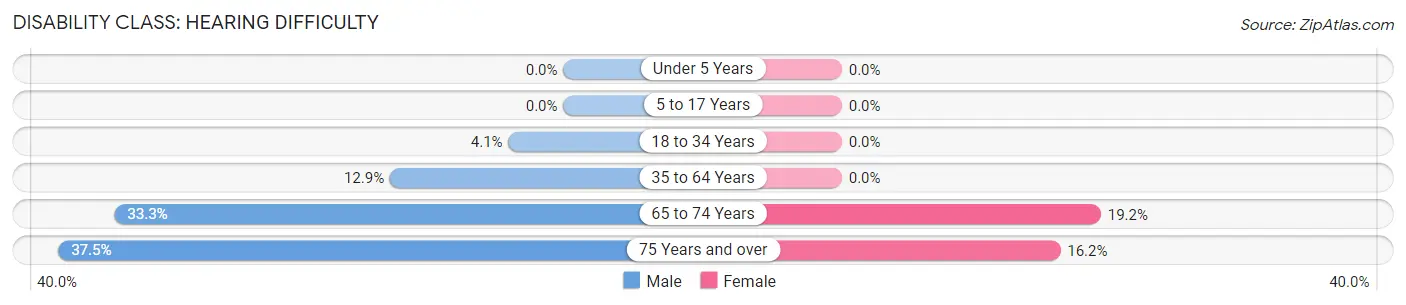
| Age Bracket | Male | Female |
| Under 5 Years | 0 (0.0%) | 0 (0.0%) |
| 5 to 17 Years | 0 (0.0%) | 0 (0.0%) |
| 18 to 34 Years | 4 (4.1%) | 0 (0.0%) |
| 35 to 64 Years | 13 (12.9%) | 0 (0.0%) |
| 65 to 74 Years | 8 (33.3%) | 10 (19.2%) |
| 75 Years and over | 9 (37.5%) | 6 (16.2%) |
Disability Class: Vision Difficulty
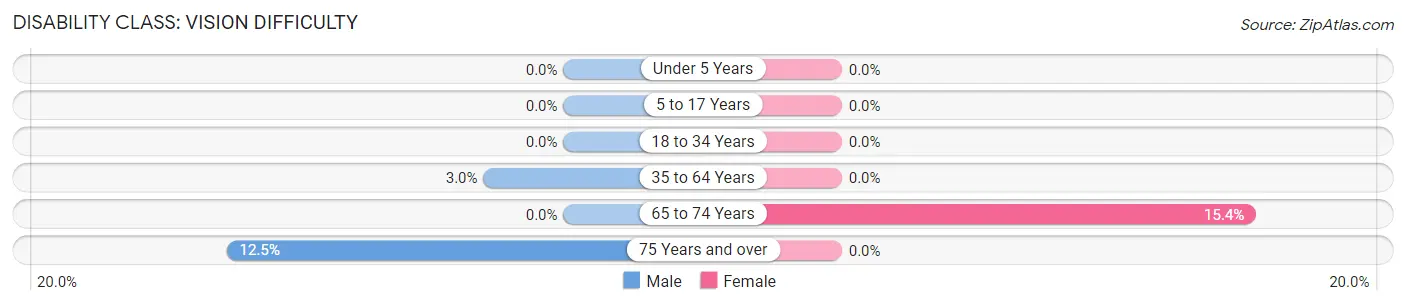
| Age Bracket | Male | Female |
| Under 5 Years | 0 (0.0%) | 0 (0.0%) |
| 5 to 17 Years | 0 (0.0%) | 0 (0.0%) |
| 18 to 34 Years | 0 (0.0%) | 0 (0.0%) |
| 35 to 64 Years | 3 (3.0%) | 0 (0.0%) |
| 65 to 74 Years | 0 (0.0%) | 8 (15.4%) |
| 75 Years and over | 3 (12.5%) | 0 (0.0%) |
Disability Class: Cognitive Difficulty
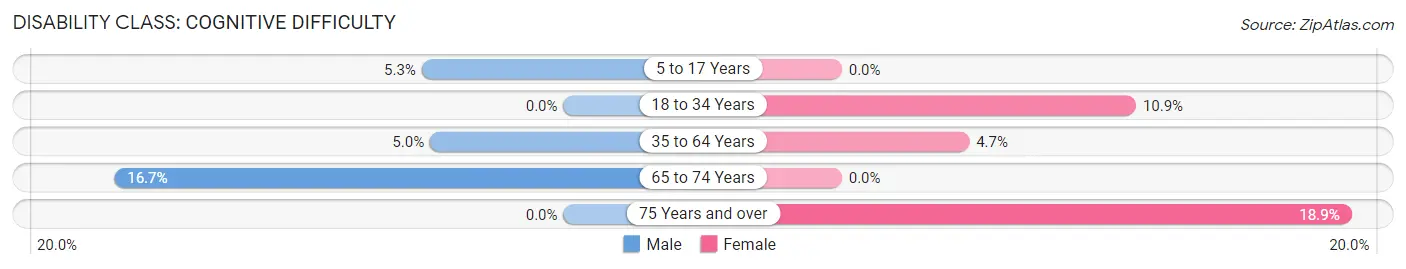
| Age Bracket | Male | Female |
| 5 to 17 Years | 4 (5.3%) | 0 (0.0%) |
| 18 to 34 Years | 0 (0.0%) | 13 (10.9%) |
| 35 to 64 Years | 5 (5.0%) | 8 (4.7%) |
| 65 to 74 Years | 4 (16.7%) | 0 (0.0%) |
| 75 Years and over | 0 (0.0%) | 7 (18.9%) |
Disability Class: Ambulatory Difficulty
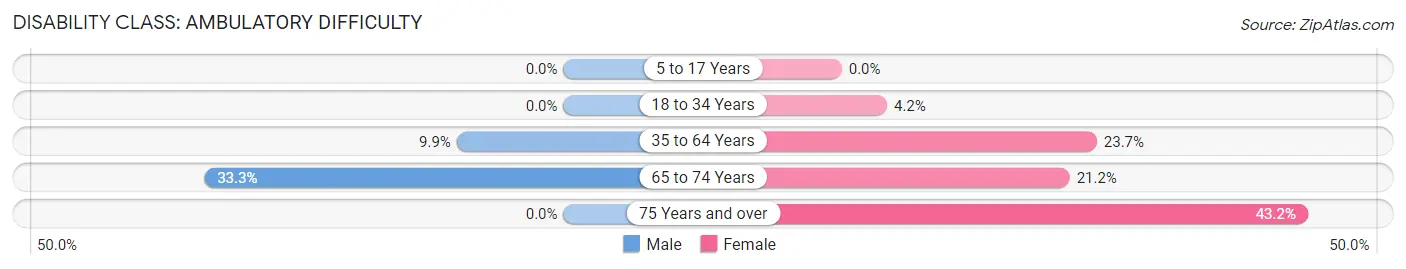
| Age Bracket | Male | Female |
| 5 to 17 Years | 0 (0.0%) | 0 (0.0%) |
| 18 to 34 Years | 0 (0.0%) | 5 (4.2%) |
| 35 to 64 Years | 10 (9.9%) | 40 (23.7%) |
| 65 to 74 Years | 8 (33.3%) | 11 (21.1%) |
| 75 Years and over | 0 (0.0%) | 16 (43.2%) |
Disability Class: Self-Care Difficulty
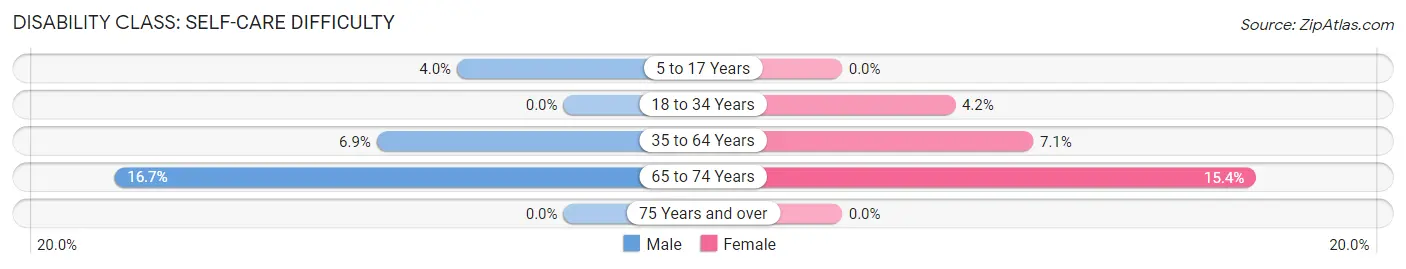
| Age Bracket | Male | Female |
| 5 to 17 Years | 3 (4.0%) | 0 (0.0%) |
| 18 to 34 Years | 0 (0.0%) | 5 (4.2%) |
| 35 to 64 Years | 7 (6.9%) | 12 (7.1%) |
| 65 to 74 Years | 4 (16.7%) | 8 (15.4%) |
| 75 Years and over | 0 (0.0%) | 0 (0.0%) |
Technology Access in Miner
Computing Device Access in Miner
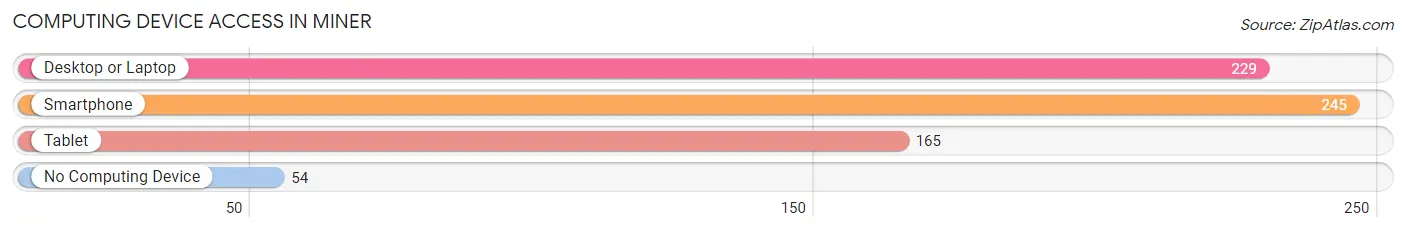
| Device Type | # Households | % Households |
| Desktop or Laptop | 229 | 65.4% |
| Smartphone | 245 | 70.0% |
| Tablet | 165 | 47.1% |
| No Computing Device | 54 | 15.4% |
| Total | 350 | 100.0% |
Internet Access in Miner
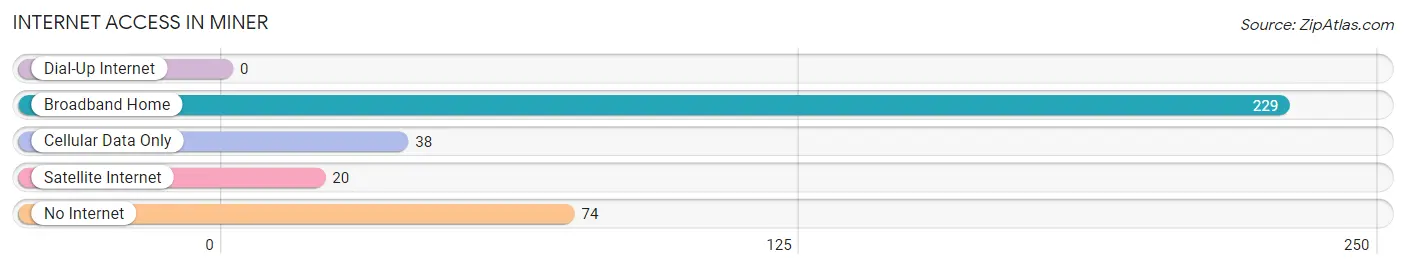
| Internet Type | # Households | % Households |
| Dial-Up Internet | 0 | 0.0% |
| Broadband Home | 229 | 65.4% |
| Cellular Data Only | 38 | 10.9% |
| Satellite Internet | 20 | 5.7% |
| No Internet | 74 | 21.1% |
| Total | 350 | 100.0% |
Miner Summary
Miner is a small city located in Scott County, Missouri. It is situated on the banks of the Mississippi River, approximately 20 miles south of Sikeston. The city has a population of 1,845 as of the 2010 census.
Geography
Miner is located at 37°3'25" North, 89°37'25" West (37.056944, -89.62361). According to the United States Census Bureau, the city has a total area of 1.2 square miles (3.1 km2), all of it land.
Economy
Miner is a small city with a limited economy. The city is home to a few small businesses, including a grocery store, a hardware store, and a few restaurants. The city also has a few manufacturing plants, including a paper mill and a plastics plant.
Demographics
As of the 2010 census, Miner had a population of 1,845. The racial makeup of the city was 95.2% White, 1.2% African American, 0.3% Native American, 0.2% Asian, 0.1% Pacific Islander, 0.7% from other races, and 2.3% from two or more races. Hispanic or Latino of any race were 1.7% of the population.
The median income for a household in the city was $30,938, and the median income for a family was $37,500. Males had a median income of $30,000 versus $20,000 for females. The per capita income for the city was $15,845. About 11.2% of families and 14.2% of the population were below the poverty line, including 18.2% of those under age 18 and 11.3% of those age 65 or over.
History
Miner was founded in 1883 by the Missouri Pacific Railroad. The city was named after a railroad official, William Miner. The city was incorporated in 1887.
Miner was a thriving river port in the early 1900s. The city was home to a number of businesses, including a flour mill, a sawmill, a brickyard, and a cotton gin. The city also had a number of hotels and saloons.
In the 1920s, the city began to decline as the river trade shifted to larger cities. The Great Depression further weakened the city's economy. The city was able to survive, however, and in the 1950s, the city began to experience a resurgence. The city was able to attract new businesses, including a plastics plant and a paper mill.
Today, Miner is a small city with a limited economy. The city is home to a few small businesses, including a grocery store, a hardware store, and a few restaurants. The city also has a few manufacturing plants, including a paper mill and a plastics plant.
Common Questions
What is Per Capita Income in Miner?
Per Capita income in Miner is $25,721.
What is the Median Family Income in Miner?
Median Family Income in Miner is $50,250.
What is the Median Household income in Miner?
Median Household Income in Miner is $38,214.
What is Income or Wage Gap in Miner?
Income or Wage Gap in Miner is 48.0%.
Women in Miner earn 52.0 cents for every dollar earned by a man.
What is Family Income Deficit in Miner?
Family Income Deficit in Miner is $19,612.
Families that are below poverty line in Miner earn $19,612 less on average than the poverty threshold level.
What is Inequality or Gini Index in Miner?
Inequality or Gini Index in Miner is 0.46.
What is the Total Population of Miner?
Total Population of Miner is 844.
What is the Total Male Population of Miner?
Total Male Population of Miner is 359.
What is the Total Female Population of Miner?
Total Female Population of Miner is 485.
What is the Ratio of Males per 100 Females in Miner?
There are 74.02 Males per 100 Females in Miner.
What is the Ratio of Females per 100 Males in Miner?
There are 135.10 Females per 100 Males in Miner.
What is the Median Population Age in Miner?
Median Population Age in Miner is 39.8 Years.
What is the Average Family Size in Miner
Average Family Size in Miner is 3.4 People.
What is the Average Household Size in Miner
Average Household Size in Miner is 2.3 People.
How Large is the Labor Force in Miner?
There are 386 People in the Labor Forcein in Miner.
What is the Percentage of People in the Labor Force in Miner?
58.1% of People are in the Labor Force in Miner.
What is the Unemployment Rate in Miner?
Unemployment Rate in Miner is 1.6%.