Milan, MO Map & Demographics
Milan Map
Milan Overview
$24,605
PER CAPITA INCOME
$59,375
AVG FAMILY INCOME
$51,842
AVG HOUSEHOLD INCOME
32.5%
WAGE / INCOME GAP [ % ]
67.5¢/ $1
WAGE / INCOME GAP [ $ ]
0.42
INEQUALITY / GINI INDEX
1,989
TOTAL POPULATION
940
MALE POPULATION
1,049
FEMALE POPULATION
89.61
MALES / 100 FEMALES
111.60
FEMALES / 100 MALES
41.3
MEDIAN AGE
4.0
AVG FAMILY SIZE
2.9
AVG HOUSEHOLD SIZE
918
LABOR FORCE [ PEOPLE ]
58.8%
PERCENT IN LABOR FORCE
4.4%
UNEMPLOYMENT RATE
Milan Zip Codes
Milan Area Codes
Income in Milan
Income Overview in Milan
Per Capita Income in Milan is $24,605, while median incomes of families and households are $59,375 and $51,842 respectively.
| Characteristic | Number | Measure |
| Per Capita Income | 1,989 | $24,605 |
| Median Family Income | 370 | $59,375 |
| Mean Family Income | 370 | $78,839 |
| Median Household Income | 652 | $51,842 |
| Mean Household Income | 652 | $62,858 |
| Income Deficit | 370 | $0 |
| Wage / Income Gap (%) | 1,989 | 32.54% |
| Wage / Income Gap ($) | 1,989 | 67.46¢ per $1 |
| Gini / Inequality Index | 1,989 | 0.42 |
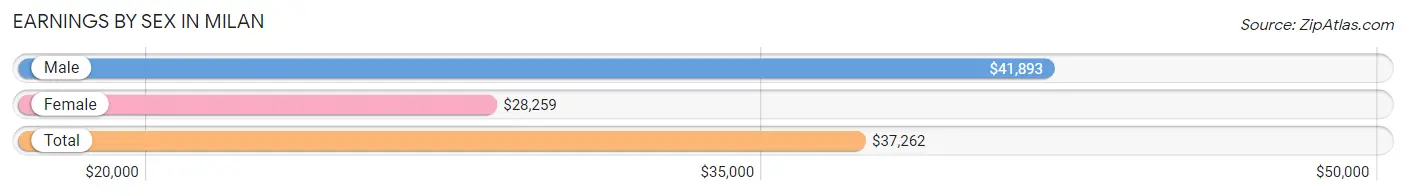
Earnings by Sex in Milan
Average Earnings in Milan are $37,262, $41,893 for men and $28,259 for women, a difference of 32.5%.
| Sex | Number | Average Earnings |
| Male | 453 (49.1%) | $41,893 |
| Female | 469 (50.9%) | $28,259 |
| Total | 922 (100.0%) | $37,262 |
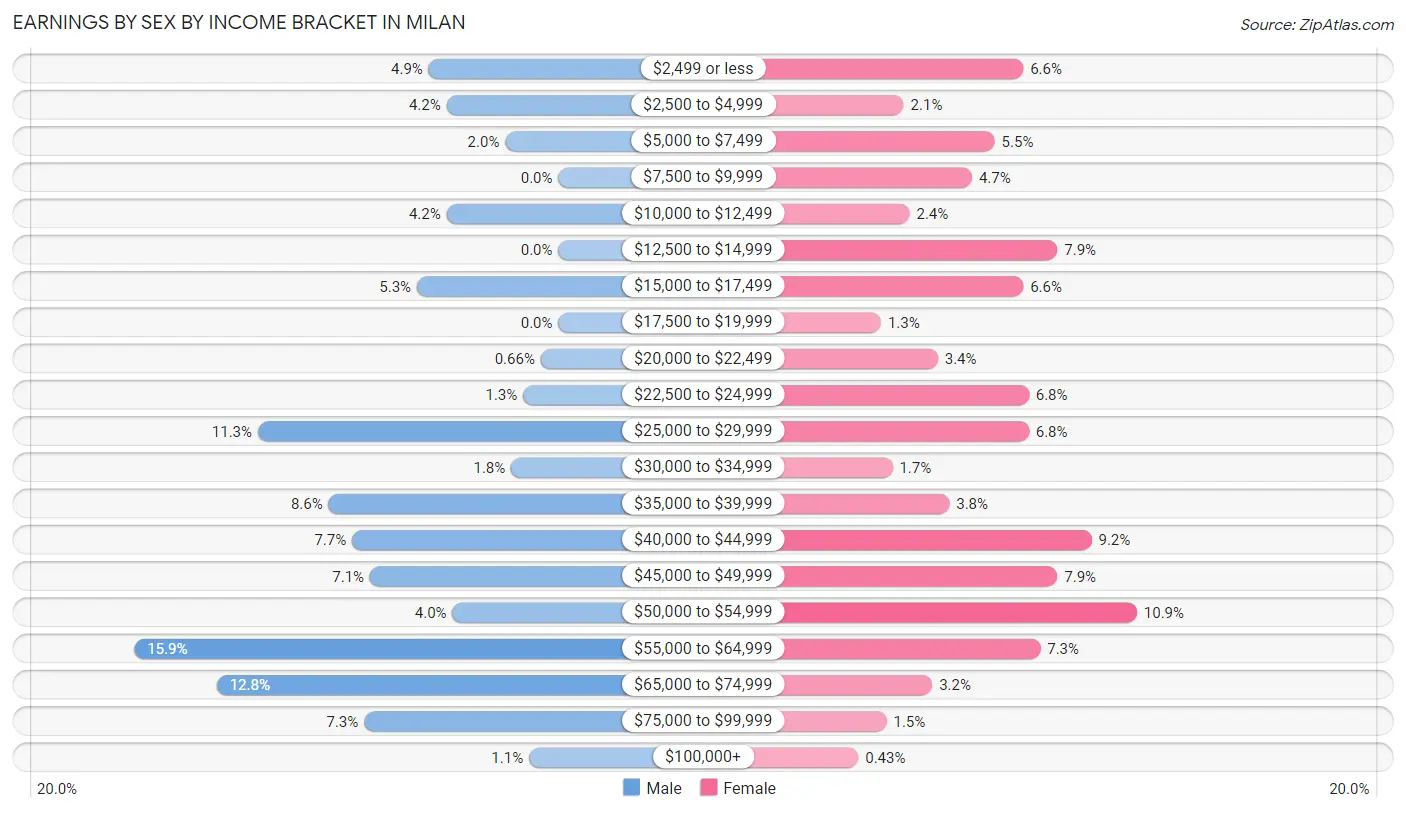
Earnings by Sex by Income Bracket in Milan
The most common earnings brackets in Milan are $55,000 to $64,999 for men (72 | 15.9%) and $50,000 to $54,999 for women (51 | 10.9%).
| Income | Male | Female |
| $2,499 or less | 22 (4.9%) | 31 (6.6%) |
| $2,500 to $4,999 | 19 (4.2%) | 10 (2.1%) |
| $5,000 to $7,499 | 9 (2.0%) | 26 (5.5%) |
| $7,500 to $9,999 | 0 (0.0%) | 22 (4.7%) |
| $10,000 to $12,499 | 19 (4.2%) | 11 (2.4%) |
| $12,500 to $14,999 | 0 (0.0%) | 37 (7.9%) |
| $15,000 to $17,499 | 24 (5.3%) | 31 (6.6%) |
| $17,500 to $19,999 | 0 (0.0%) | 6 (1.3%) |
| $20,000 to $22,499 | 3 (0.7%) | 16 (3.4%) |
| $22,500 to $24,999 | 6 (1.3%) | 32 (6.8%) |
| $25,000 to $29,999 | 51 (11.3%) | 32 (6.8%) |
| $30,000 to $34,999 | 8 (1.8%) | 8 (1.7%) |
| $35,000 to $39,999 | 39 (8.6%) | 18 (3.8%) |
| $40,000 to $44,999 | 35 (7.7%) | 43 (9.2%) |
| $45,000 to $49,999 | 32 (7.1%) | 37 (7.9%) |
| $50,000 to $54,999 | 18 (4.0%) | 51 (10.9%) |
| $55,000 to $64,999 | 72 (15.9%) | 34 (7.2%) |
| $65,000 to $74,999 | 58 (12.8%) | 15 (3.2%) |
| $75,000 to $99,999 | 33 (7.3%) | 7 (1.5%) |
| $100,000+ | 5 (1.1%) | 2 (0.4%) |
| Total | 453 (100.0%) | 469 (100.0%) |
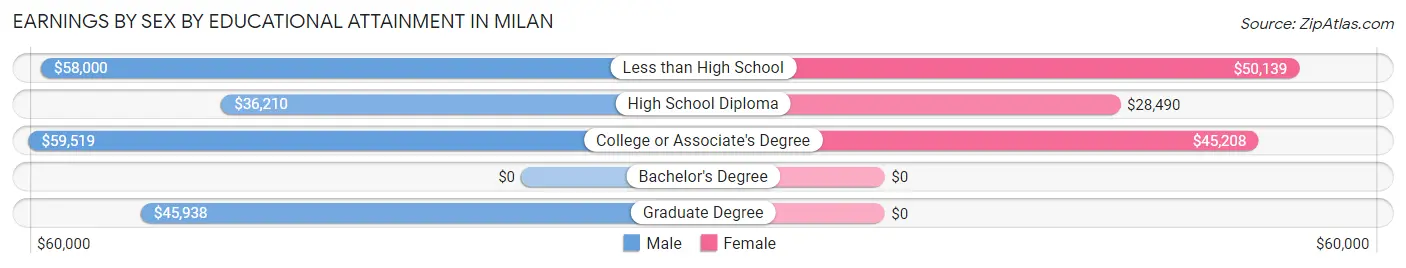
Earnings by Sex by Educational Attainment in Milan
Average earnings in Milan are $41,629 for men and $36,429 for women, a difference of 12.5%. Men with an educational attainment of college or associate's degree enjoy the highest average annual earnings of $59,519, while those with high school diploma education earn the least with $36,210. Women with an educational attainment of less than high school earn the most with the average annual earnings of $50,139, while those with high school diploma education have the smallest earnings of $28,490.
| Educational Attainment | Male Income | Female Income |
| Less than High School | $58,000 | $50,139 |
| High School Diploma | $36,210 | $28,490 |
| College or Associate's Degree | $59,519 | $45,208 |
| Bachelor's Degree | - | - |
| Graduate Degree | $45,938 | $0 |
| Total | $41,629 | $36,429 |
Family Income in Milan
Family Income Brackets in Milan
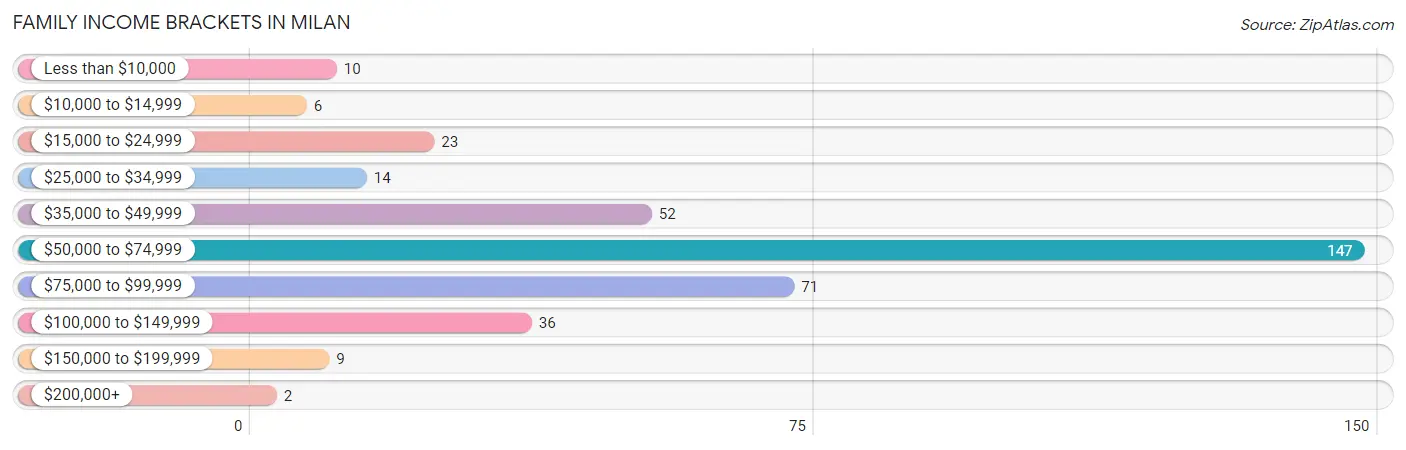
According to the Milan family income data, there are 147 families falling into the $50,000 to $74,999 income range, which is the most common income bracket and makes up 39.7% of all families. Conversely, the $200,000+ income bracket is the least frequent group with only 2 families (0.5%) belonging to this category.
| Income Bracket | # Families | % Families |
| Less than $10,000 | 10 | 2.7% |
| $10,000 to $14,999 | 6 | 1.6% |
| $15,000 to $24,999 | 23 | 6.2% |
| $25,000 to $34,999 | 14 | 3.8% |
| $35,000 to $49,999 | 52 | 14.1% |
| $50,000 to $74,999 | 147 | 39.7% |
| $75,000 to $99,999 | 71 | 19.2% |
| $100,000 to $149,999 | 36 | 9.7% |
| $150,000 to $199,999 | 9 | 2.4% |
| $200,000+ | 2 | 0.5% |
Family Income by Famaliy Size in Milan
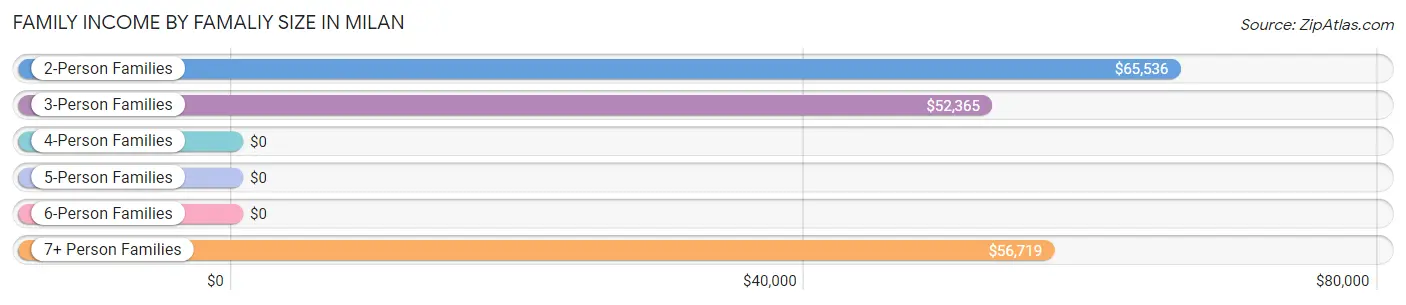
2-person families (149 | 40.3%) account for the highest median family income in Milan with $65,536 per family, while 2-person families (149 | 40.3%) have the highest median income of $32,768 per family member.
| Income Bracket | # Families | Median Income |
| 2-Person Families | 149 (40.3%) | $65,536 |
| 3-Person Families | 134 (36.2%) | $52,365 |
| 4-Person Families | 48 (13.0%) | $0 |
| 5-Person Families | 21 (5.7%) | $0 |
| 6-Person Families | 5 (1.3%) | $0 |
| 7+ Person Families | 13 (3.5%) | $56,719 |
| Total | 370 (100.0%) | $59,375 |
Family Income by Number of Earners in Milan
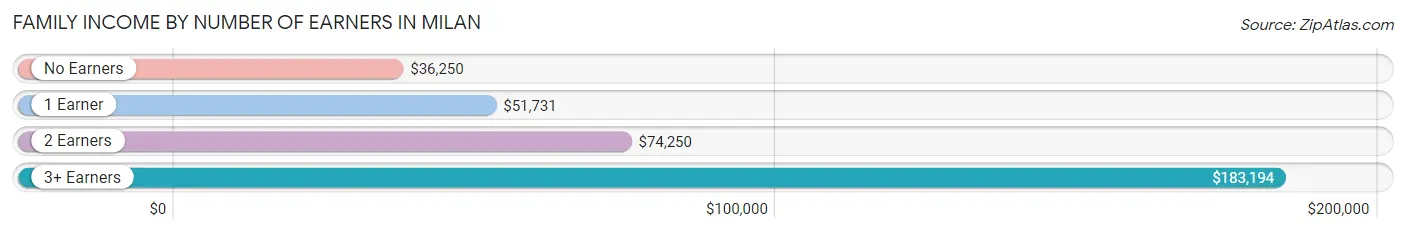
The median family income in Milan is $59,375, with families comprising 3+ earners (17) having the highest median family income of $183,194, while families with no earners (40) have the lowest median family income of $36,250, accounting for 4.6% and 10.8% of families, respectively.
| Number of Earners | # Families | Median Income |
| No Earners | 40 (10.8%) | $36,250 |
| 1 Earner | 194 (52.4%) | $51,731 |
| 2 Earners | 119 (32.2%) | $74,250 |
| 3+ Earners | 17 (4.6%) | $183,194 |
| Total | 370 (100.0%) | $59,375 |
Household Income in Milan
Household Income Brackets in Milan
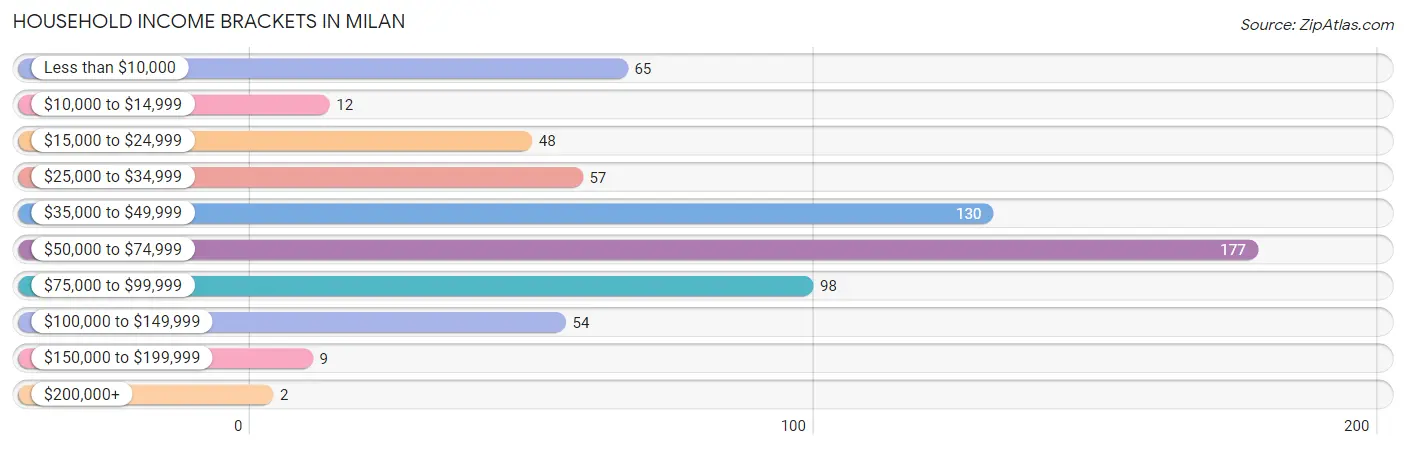
With 177 households falling in the category, the $50,000 to $74,999 income range is the most frequent in Milan, accounting for 27.2% of all households. In contrast, only 2 households (0.3%) fall into the $200,000+ income bracket, making it the least populous group.
| Income Bracket | # Households | % Households |
| Less than $10,000 | 65 | 10.0% |
| $10,000 to $14,999 | 12 | 1.8% |
| $15,000 to $24,999 | 48 | 7.4% |
| $25,000 to $34,999 | 57 | 8.7% |
| $35,000 to $49,999 | 130 | 19.9% |
| $50,000 to $74,999 | 177 | 27.1% |
| $75,000 to $99,999 | 98 | 15.0% |
| $100,000 to $149,999 | 54 | 8.3% |
| $150,000 to $199,999 | 9 | 1.4% |
| $200,000+ | 2 | 0.3% |
Household Income by Householder Age in Milan
The median household income in Milan is $51,842, with the highest median household income of $62,000 found in the 25 to 44 years age bracket for the primary householder. A total of 188 households (28.8%) fall into this category. Meanwhile, the 15 to 24 years age bracket for the primary householder has the lowest median household income of $0, with 29 households (4.4%) in this group.
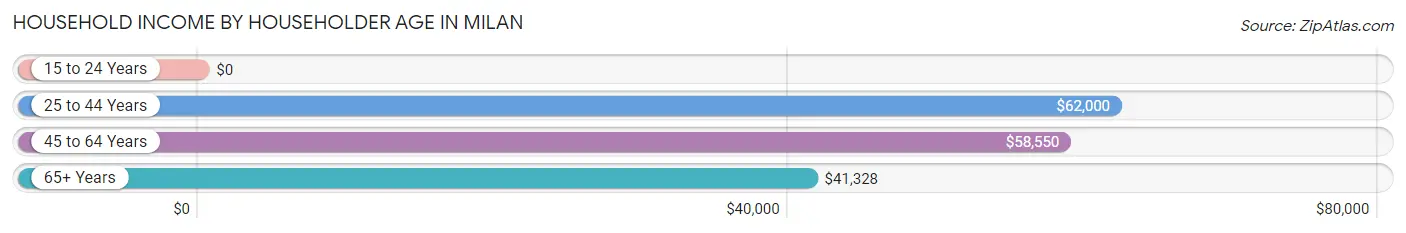
| Income Bracket | # Households | Median Income |
| 15 to 24 Years | 29 (4.4%) | $0 |
| 25 to 44 Years | 188 (28.8%) | $62,000 |
| 45 to 64 Years | 257 (39.4%) | $58,550 |
| 65+ Years | 178 (27.3%) | $41,328 |
| Total | 652 (100.0%) | $51,842 |
Poverty in Milan
Income Below Poverty by Sex and Age in Milan
With 11.5% poverty level for males and 18.5% for females among the residents of Milan, 5 year old males and 55 to 64 year old females are the most vulnerable to poverty, with 5 males (50.0%) and 39 females (30.5%) in their respective age groups living below the poverty level.
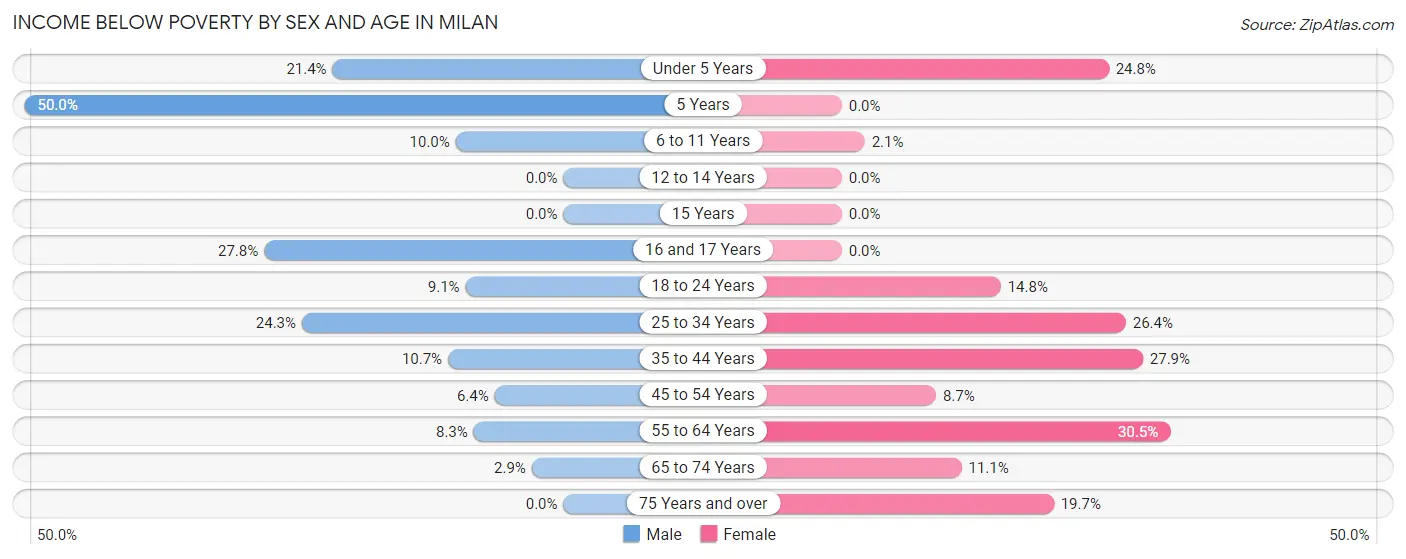
| Age Bracket | Male | Female |
| Under 5 Years | 12 (21.4%) | 27 (24.8%) |
| 5 Years | 5 (50.0%) | 0 (0.0%) |
| 6 to 11 Years | 10 (10.0%) | 2 (2.1%) |
| 12 to 14 Years | 0 (0.0%) | 0 (0.0%) |
| 15 Years | 0 (0.0%) | 0 (0.0%) |
| 16 and 17 Years | 10 (27.8%) | 0 (0.0%) |
| 18 to 24 Years | 10 (9.1%) | 18 (14.7%) |
| 25 to 34 Years | 25 (24.3%) | 29 (26.4%) |
| 35 to 44 Years | 12 (10.7%) | 38 (27.9%) |
| 45 to 54 Years | 6 (6.4%) | 9 (8.7%) |
| 55 to 64 Years | 13 (8.3%) | 39 (30.5%) |
| 65 to 74 Years | 2 (2.9%) | 11 (11.1%) |
| 75 Years and over | 0 (0.0%) | 12 (19.7%) |
| Total | 105 (11.5%) | 185 (18.5%) |
Income Above Poverty by Sex and Age in Milan
According to the poverty statistics in Milan, males aged 12 to 14 years and females aged 5 years are the age groups that are most secure financially, with 100.0% of males and 100.0% of females in these age groups living above the poverty line.
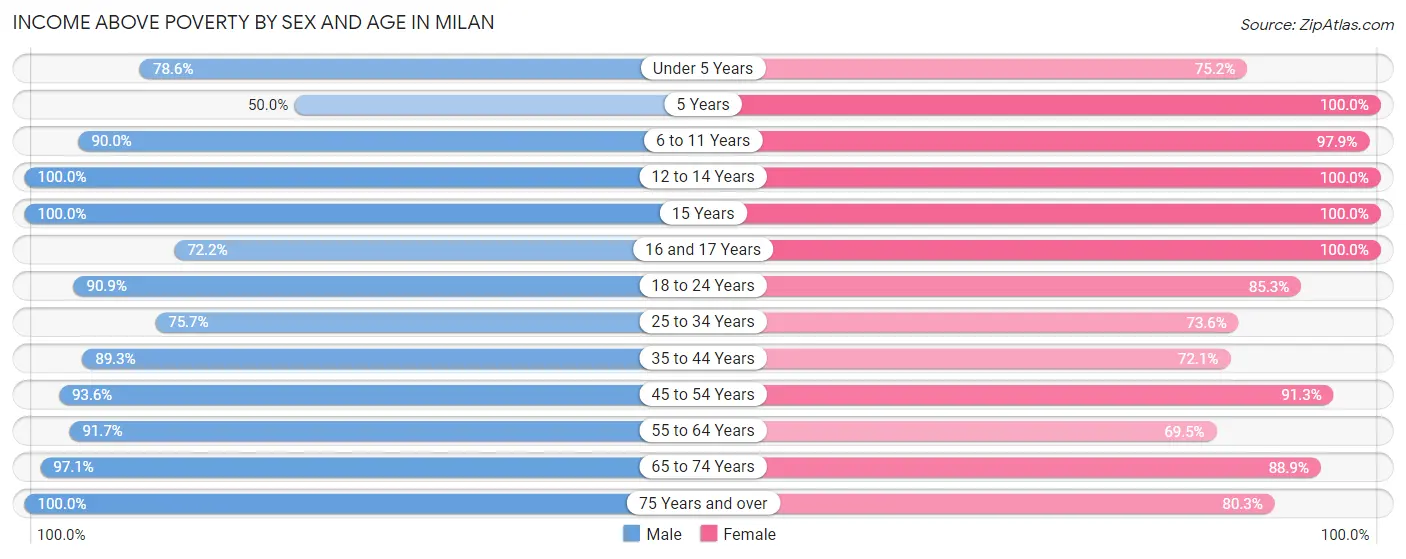
| Age Bracket | Male | Female |
| Under 5 Years | 44 (78.6%) | 82 (75.2%) |
| 5 Years | 5 (50.0%) | 3 (100.0%) |
| 6 to 11 Years | 90 (90.0%) | 92 (97.9%) |
| 12 to 14 Years | 32 (100.0%) | 21 (100.0%) |
| 15 Years | 2 (100.0%) | 1 (100.0%) |
| 16 and 17 Years | 26 (72.2%) | 13 (100.0%) |
| 18 to 24 Years | 100 (90.9%) | 104 (85.3%) |
| 25 to 34 Years | 78 (75.7%) | 81 (73.6%) |
| 35 to 44 Years | 100 (89.3%) | 98 (72.1%) |
| 45 to 54 Years | 88 (93.6%) | 94 (91.3%) |
| 55 to 64 Years | 143 (91.7%) | 89 (69.5%) |
| 65 to 74 Years | 66 (97.1%) | 88 (88.9%) |
| 75 Years and over | 33 (100.0%) | 49 (80.3%) |
| Total | 807 (88.5%) | 815 (81.5%) |
Income Below Poverty Among Married-Couple Families in Milan
The poverty statistics for married-couple families in Milan show that 6.8% or 18 of the total 265 families live below the poverty line. Families with 1 or 2 children have the highest poverty rate of 14.9%, comprising of 14 families. On the other hand, families with 3 or 4 children have the lowest poverty rate of 0.0%, which includes 0 families.
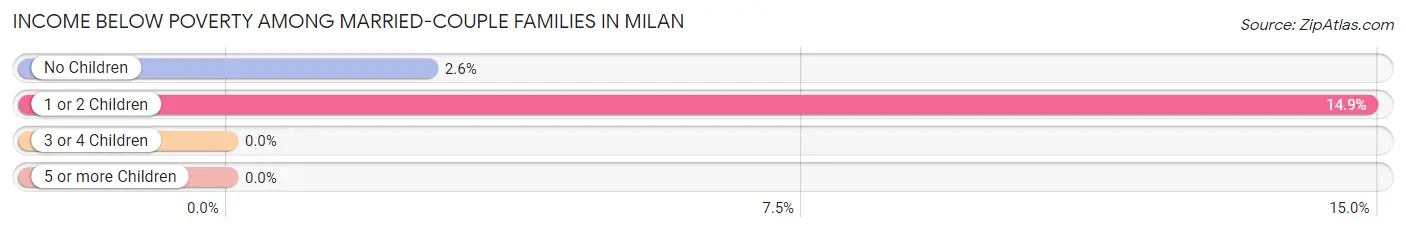
| Children | Above Poverty | Below Poverty |
| No Children | 149 (97.4%) | 4 (2.6%) |
| 1 or 2 Children | 80 (85.1%) | 14 (14.9%) |
| 3 or 4 Children | 16 (100.0%) | 0 (0.0%) |
| 5 or more Children | 2 (100.0%) | 0 (0.0%) |
| Total | 247 (93.2%) | 18 (6.8%) |
Income Below Poverty Among Single-Parent Households in Milan
According to the poverty data in Milan, 26.1% or 6 single-father households and 17.1% or 14 single-mother households are living below the poverty line. Among single-father households, those with 1 or 2 children have the highest poverty rate, with 6 households (42.9%) experiencing poverty. Likewise, among single-mother households, those with 1 or 2 children have the highest poverty rate, with 13 households (21.3%) falling below the poverty line.
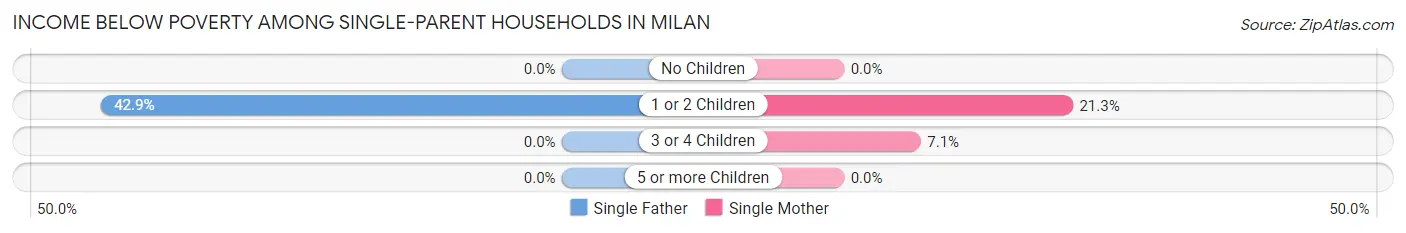
| Children | Single Father | Single Mother |
| No Children | 0 (0.0%) | 0 (0.0%) |
| 1 or 2 Children | 6 (42.9%) | 13 (21.3%) |
| 3 or 4 Children | 0 (0.0%) | 1 (7.1%) |
| 5 or more Children | 0 (0.0%) | 0 (0.0%) |
| Total | 6 (26.1%) | 14 (17.1%) |
Income Below Poverty Among Married-Couple vs Single-Parent Households in Milan
The poverty data for Milan shows that 18 of the married-couple family households (6.8%) and 20 of the single-parent households (19.1%) are living below the poverty level. Within the married-couple family households, those with 1 or 2 children have the highest poverty rate, with 14 households (14.9%) falling below the poverty line. Among the single-parent households, those with 1 or 2 children have the highest poverty rate, with 19 household (25.3%) living below poverty.
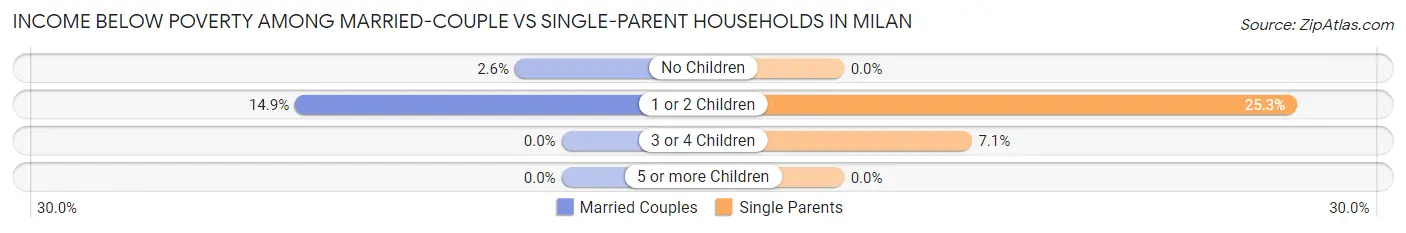
| Children | Married-Couple Families | Single-Parent Households |
| No Children | 4 (2.6%) | 0 (0.0%) |
| 1 or 2 Children | 14 (14.9%) | 19 (25.3%) |
| 3 or 4 Children | 0 (0.0%) | 1 (7.1%) |
| 5 or more Children | 0 (0.0%) | 0 (0.0%) |
| Total | 18 (6.8%) | 20 (19.1%) |
Race in Milan
The most populous races in Milan are White / Caucasian (1,253 | 63.0%), Hispanic or Latino (910 | 45.8%), and Some other Race (303 | 15.2%).
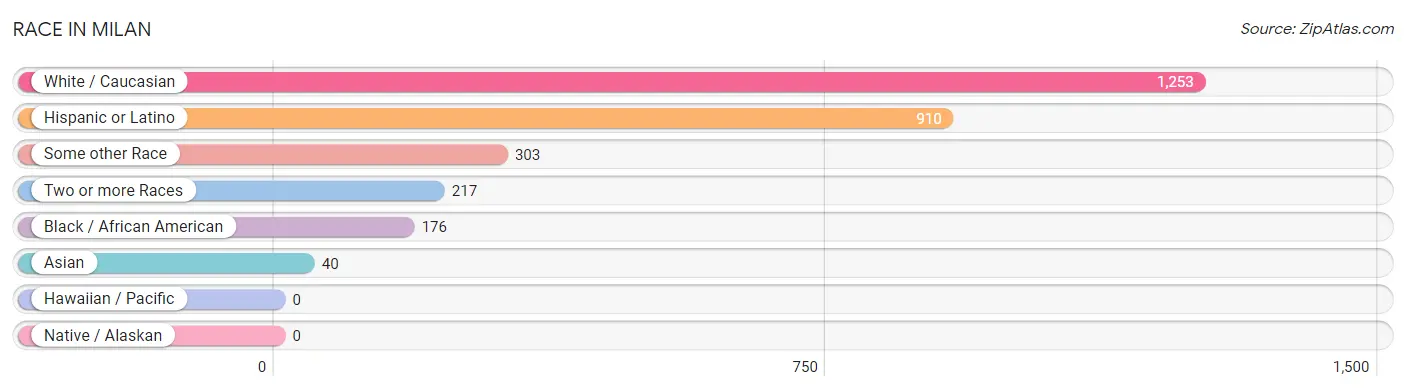
| Race | # Population | % Population |
| Asian | 40 | 2.0% |
| Black / African American | 176 | 8.8% |
| Hawaiian / Pacific | 0 | 0.0% |
| Hispanic or Latino | 910 | 45.8% |
| Native / Alaskan | 0 | 0.0% |
| White / Caucasian | 1,253 | 63.0% |
| Two or more Races | 217 | 10.9% |
| Some other Race | 303 | 15.2% |
| Total | 1,989 | 100.0% |
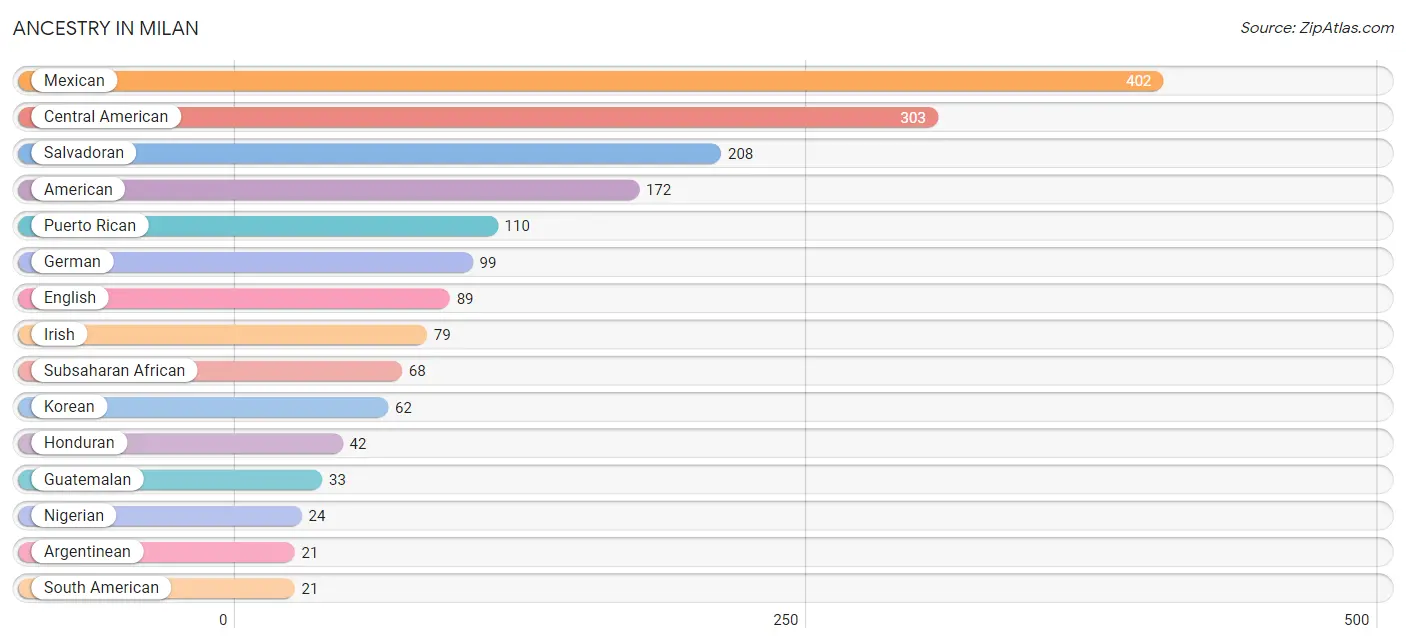
Ancestry in Milan
The most populous ancestries reported in Milan are Mexican (402 | 20.2%), Central American (303 | 15.2%), Salvadoran (208 | 10.5%), American (172 | 8.6%), and Puerto Rican (110 | 5.5%), together accounting for 60.1% of all Milan residents.
| Ancestry | # Population | % Population |
| American | 172 | 8.6% |
| Argentinean | 21 | 1.1% |
| Central American | 303 | 15.2% |
| Cherokee | 5 | 0.3% |
| Costa Rican | 6 | 0.3% |
| Dutch | 14 | 0.7% |
| English | 89 | 4.5% |
| French | 3 | 0.2% |
| German | 99 | 5.0% |
| Guatemalan | 33 | 1.7% |
| Honduran | 42 | 2.1% |
| Irish | 79 | 4.0% |
| Italian | 19 | 1.0% |
| Korean | 62 | 3.1% |
| Mexican | 402 | 20.2% |
| Navajo | 5 | 0.3% |
| Nigerian | 24 | 1.2% |
| Panamanian | 14 | 0.7% |
| Pennsylvania German | 15 | 0.7% |
| Polish | 6 | 0.3% |
| Puerto Rican | 110 | 5.5% |
| Salvadoran | 208 | 10.5% |
| Scotch-Irish | 5 | 0.3% |
| Scottish | 11 | 0.5% |
| South American | 21 | 1.1% |
| Spaniard | 5 | 0.3% |
| Subsaharan African | 68 | 3.4% |
| Swedish | 4 | 0.2% |
| Welsh | 4 | 0.2% | View All 29 Rows |
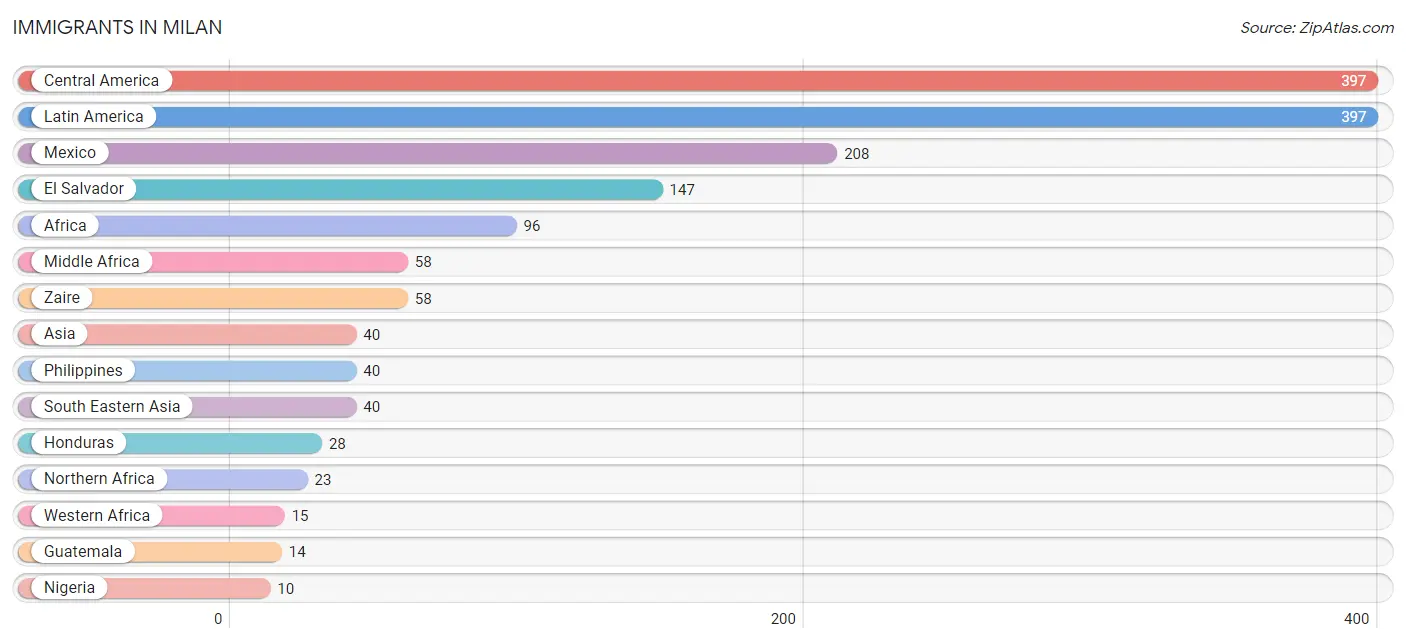
Immigrants in Milan
The most numerous immigrant groups reported in Milan came from Central America (397 | 20.0%), Latin America (397 | 20.0%), Mexico (208 | 10.5%), El Salvador (147 | 7.4%), and Africa (96 | 4.8%), together accounting for 62.6% of all Milan residents.
| Immigration Origin | # Population | % Population |
| Africa | 96 | 4.8% |
| Asia | 40 | 2.0% |
| Central America | 397 | 20.0% |
| El Salvador | 147 | 7.4% |
| Europe | 7 | 0.4% |
| Germany | 7 | 0.4% |
| Guatemala | 14 | 0.7% |
| Honduras | 28 | 1.4% |
| Latin America | 397 | 20.0% |
| Liberia | 5 | 0.3% |
| Mexico | 208 | 10.5% |
| Middle Africa | 58 | 2.9% |
| Nigeria | 10 | 0.5% |
| Northern Africa | 23 | 1.2% |
| Philippines | 40 | 2.0% |
| South Eastern Asia | 40 | 2.0% |
| Western Africa | 15 | 0.7% |
| Western Europe | 7 | 0.4% |
| Zaire | 58 | 2.9% | View All 19 Rows |
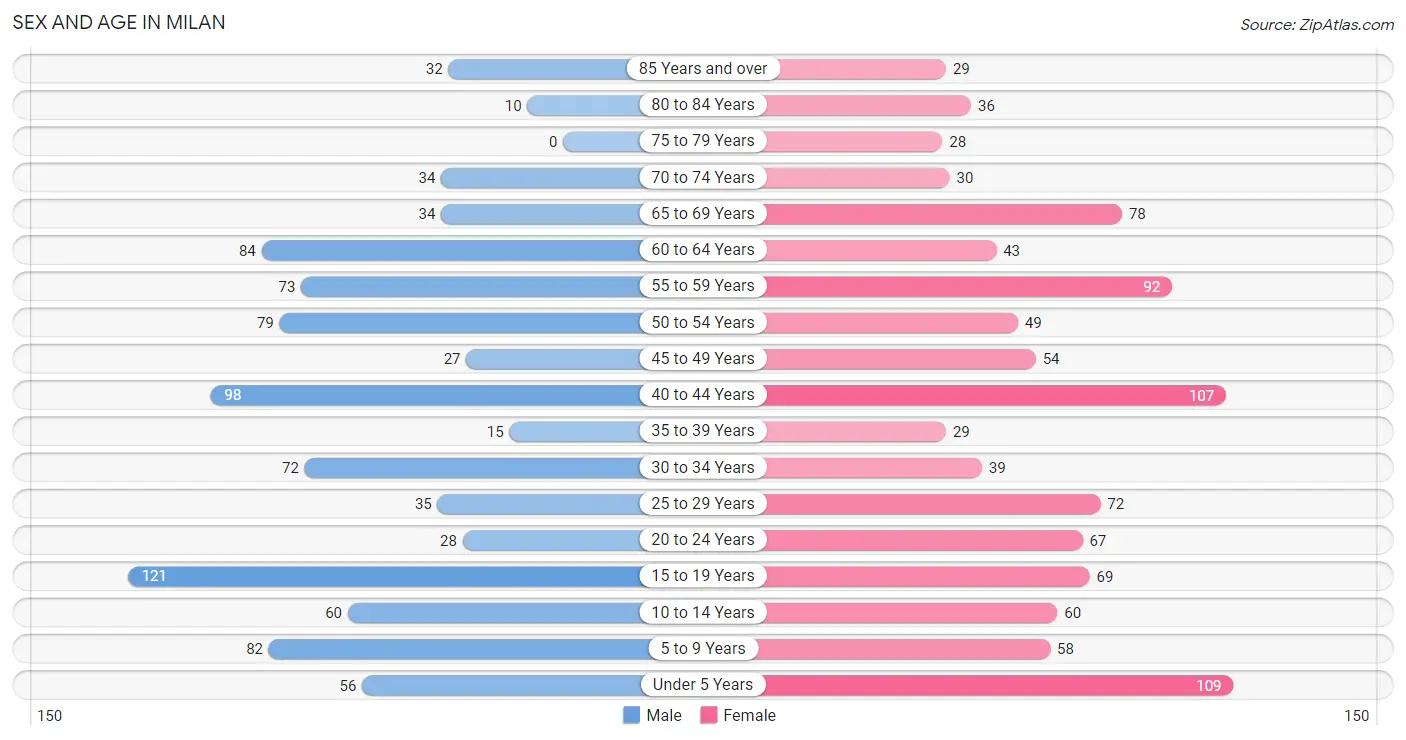
Sex and Age in Milan
Sex and Age in Milan
The most populous age groups in Milan are 15 to 19 Years (121 | 12.9%) for men and Under 5 Years (109 | 10.4%) for women.
| Age Bracket | Male | Female |
| Under 5 Years | 56 (6.0%) | 109 (10.4%) |
| 5 to 9 Years | 82 (8.7%) | 58 (5.5%) |
| 10 to 14 Years | 60 (6.4%) | 60 (5.7%) |
| 15 to 19 Years | 121 (12.9%) | 69 (6.6%) |
| 20 to 24 Years | 28 (3.0%) | 67 (6.4%) |
| 25 to 29 Years | 35 (3.7%) | 72 (6.9%) |
| 30 to 34 Years | 72 (7.7%) | 39 (3.7%) |
| 35 to 39 Years | 15 (1.6%) | 29 (2.8%) |
| 40 to 44 Years | 98 (10.4%) | 107 (10.2%) |
| 45 to 49 Years | 27 (2.9%) | 54 (5.1%) |
| 50 to 54 Years | 79 (8.4%) | 49 (4.7%) |
| 55 to 59 Years | 73 (7.8%) | 92 (8.8%) |
| 60 to 64 Years | 84 (8.9%) | 43 (4.1%) |
| 65 to 69 Years | 34 (3.6%) | 78 (7.4%) |
| 70 to 74 Years | 34 (3.6%) | 30 (2.9%) |
| 75 to 79 Years | 0 (0.0%) | 28 (2.7%) |
| 80 to 84 Years | 10 (1.1%) | 36 (3.4%) |
| 85 Years and over | 32 (3.4%) | 29 (2.8%) |
| Total | 940 (100.0%) | 1,049 (100.0%) |
Families and Households in Milan
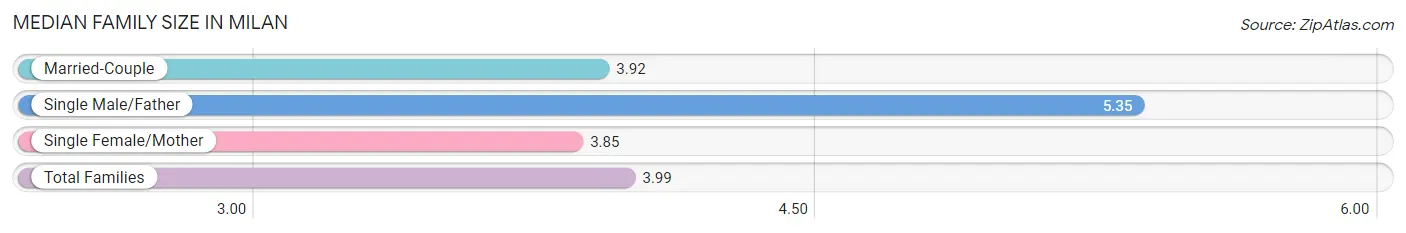
Median Family Size in Milan
The median family size in Milan is 3.99 persons per family, with single male/father families (23 | 6.2%) accounting for the largest median family size of 5.35 persons per family. On the other hand, single female/mother families (82 | 22.2%) represent the smallest median family size with 3.85 persons per family.
| Family Type | # Families | Family Size |
| Married-Couple | 265 (71.6%) | 3.92 |
| Single Male/Father | 23 (6.2%) | 5.35 |
| Single Female/Mother | 82 (22.2%) | 3.85 |
| Total Families | 370 (100.0%) | 3.99 |
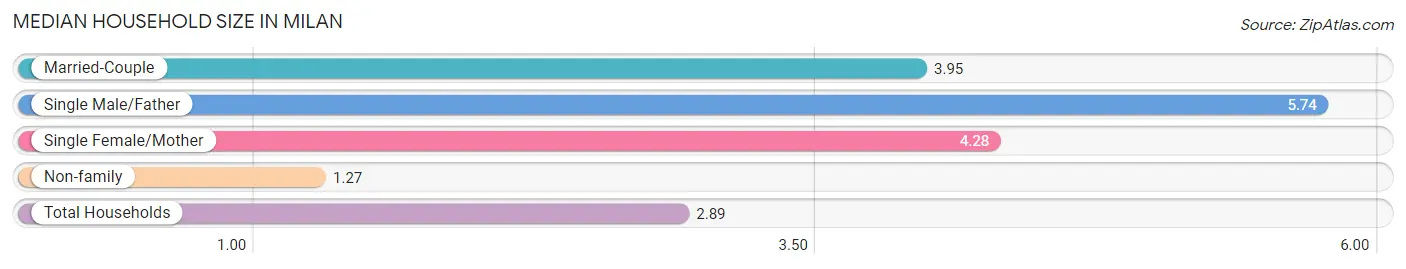
Median Household Size in Milan
The median household size in Milan is 2.89 persons per household, with single male/father households (23 | 3.5%) accounting for the largest median household size of 5.74 persons per household. non-family households (282 | 43.2%) represent the smallest median household size with 1.27 persons per household.
| Household Type | # Households | Household Size |
| Married-Couple | 265 (40.6%) | 3.95 |
| Single Male/Father | 23 (3.5%) | 5.74 |
| Single Female/Mother | 82 (12.6%) | 4.28 |
| Non-family | 282 (43.2%) | 1.27 |
| Total Households | 652 (100.0%) | 2.89 |
Household Size by Marriage Status in Milan
Out of a total of 652 households in Milan, 370 (56.8%) are family households, while 282 (43.2%) are nonfamily households. The most numerous type of family households are 2-person households, comprising 143, and the most common type of nonfamily households are 1-person households, comprising 266.
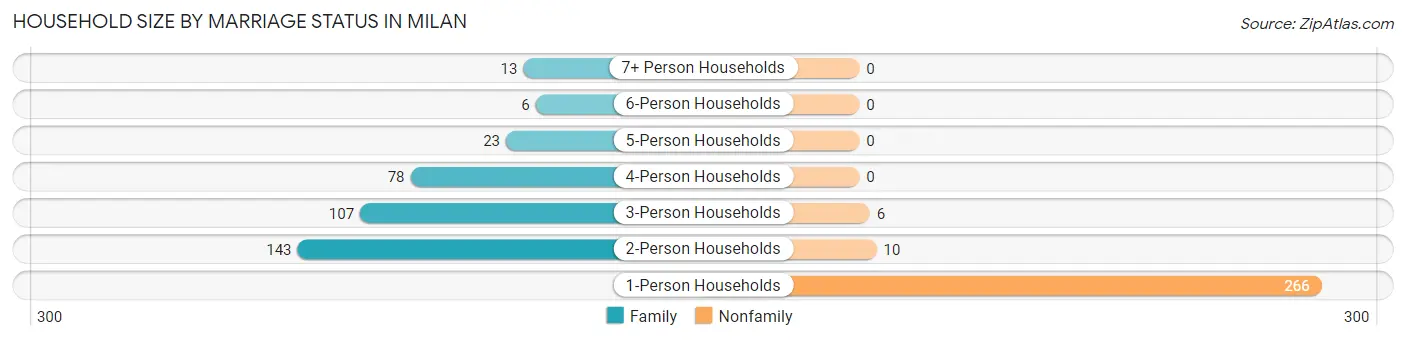
| Household Size | Family Households | Nonfamily Households |
| 1-Person Households | - | 266 (40.8%) |
| 2-Person Households | 143 (21.9%) | 10 (1.5%) |
| 3-Person Households | 107 (16.4%) | 6 (0.9%) |
| 4-Person Households | 78 (12.0%) | 0 (0.0%) |
| 5-Person Households | 23 (3.5%) | 0 (0.0%) |
| 6-Person Households | 6 (0.9%) | 0 (0.0%) |
| 7+ Person Households | 13 (2.0%) | 0 (0.0%) |
| Total | 370 (56.8%) | 282 (43.2%) |
Female Fertility in Milan
Fertility by Age in Milan
Average fertility rate in Milan is 55.0 births per 1,000 women. Women in the age bracket of 20 to 34 years have the highest fertility rate with 112.0 births per 1,000 women. Women in the age bracket of 20 to 34 years acount for 80.0% of all women with births.
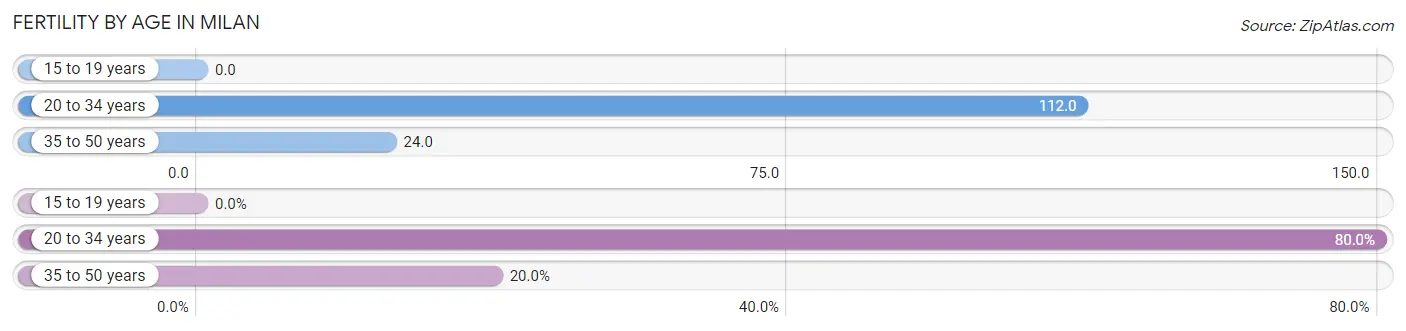
| Age Bracket | Women with Births | Births / 1,000 Women |
| 15 to 19 years | 0 (0.0%) | 0.0 |
| 20 to 34 years | 20 (80.0%) | 112.0 |
| 35 to 50 years | 5 (20.0%) | 24.0 |
| Total | 25 (100.0%) | 55.0 |
Fertility by Age by Marriage Status in Milan
96.0% of women with births (25) in Milan are married. The highest percentage of unmarried women with births falls into 20 to 34 years age bracket with 5.0% of them unmarried at the time of birth, while the lowest percentage of unmarried women with births belong to 35 to 50 years age bracket with 0.0% of them unmarried.
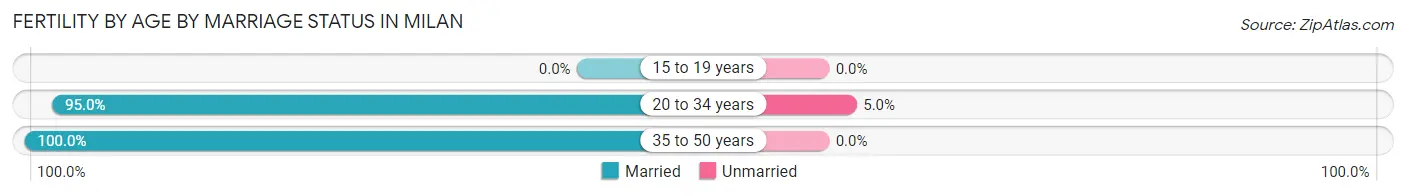
| Age Bracket | Married | Unmarried |
| 15 to 19 years | 0 (0.0%) | 0 (0.0%) |
| 20 to 34 years | 19 (95.0%) | 1 (5.0%) |
| 35 to 50 years | 5 (100.0%) | 0 (0.0%) |
| Total | 24 (96.0%) | 1 (4.0%) |
Fertility by Education in Milan
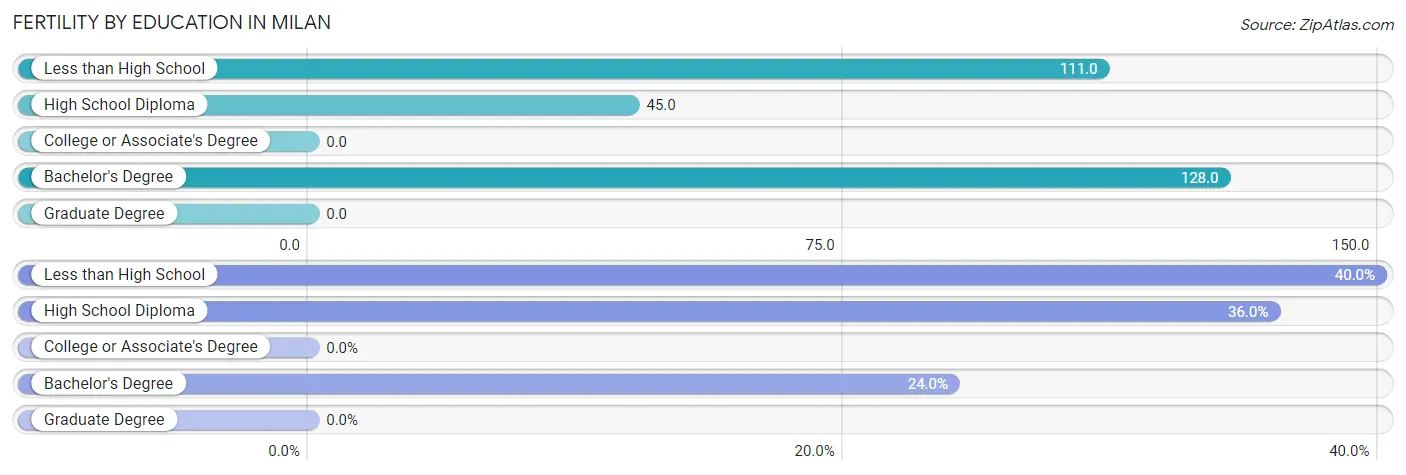
| Educational Attainment | Women with Births | Births / 1,000 Women |
| Less than High School | 10 (40.0%) | 111.0 |
| High School Diploma | 9 (36.0%) | 45.0 |
| College or Associate's Degree | 0 (0.0%) | 0.0 |
| Bachelor's Degree | 6 (24.0%) | 128.0 |
| Graduate Degree | 0 (0.0%) | 0.0 |
| Total | 25 (100.0%) | 55.0 |
Fertility by Education by Marriage Status in Milan
4.0% of women with births in Milan are unmarried. Women with the educational attainment of less than high school are most likely to be married with 100.0% of them married at childbirth, while women with the educational attainment of high school diploma are least likely to be married with 11.1% of them unmarried at childbirth.
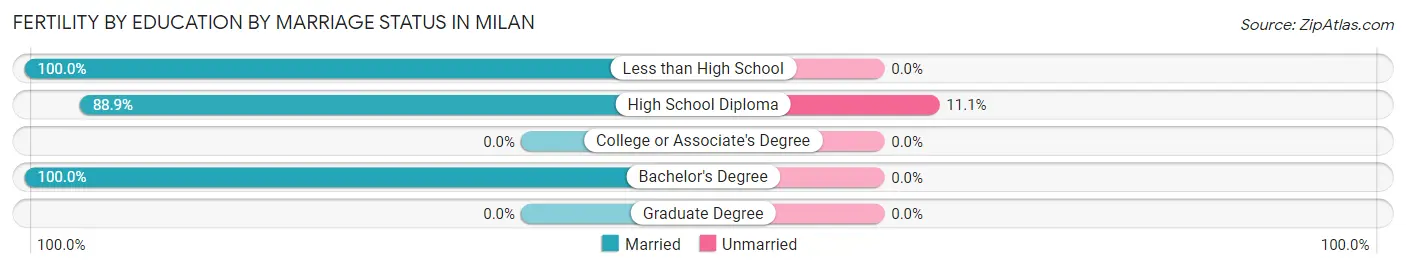
| Educational Attainment | Married | Unmarried |
| Less than High School | 10 (100.0%) | 0 (0.0%) |
| High School Diploma | 8 (88.9%) | 1 (11.1%) |
| College or Associate's Degree | 0 (0.0%) | 0 (0.0%) |
| Bachelor's Degree | 6 (100.0%) | 0 (0.0%) |
| Graduate Degree | 0 (0.0%) | 0 (0.0%) |
| Total | 24 (96.0%) | 1 (4.0%) |
Employment Characteristics in Milan
Employment by Class of Employer in Milan
Among the 874 employed individuals in Milan, private company employees (649 | 74.3%), not-for-profit organizations (106 | 12.1%), and local government employees (50 | 5.7%) make up the most common classes of employment.
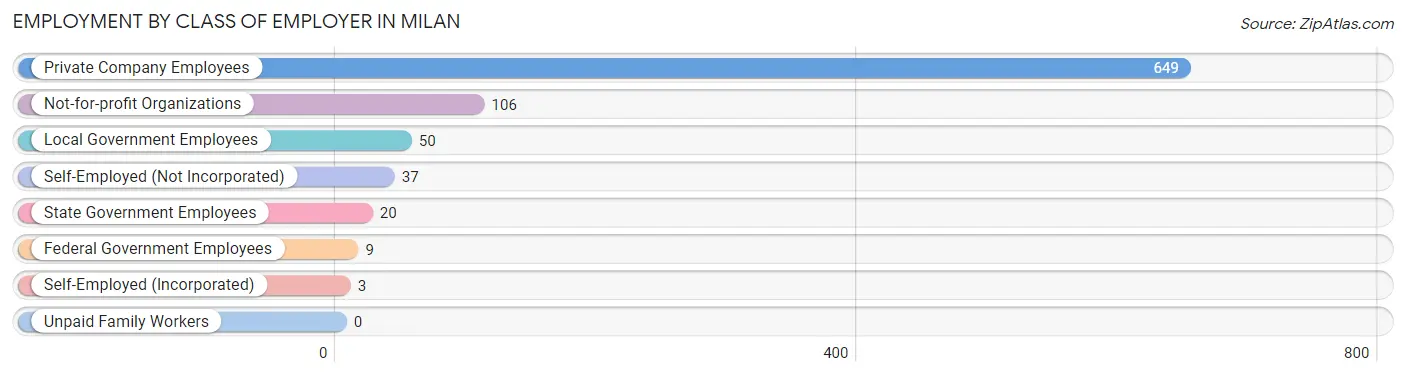
| Employer Class | # Employees | % Employees |
| Private Company Employees | 649 | 74.3% |
| Self-Employed (Incorporated) | 3 | 0.3% |
| Self-Employed (Not Incorporated) | 37 | 4.2% |
| Not-for-profit Organizations | 106 | 12.1% |
| Local Government Employees | 50 | 5.7% |
| State Government Employees | 20 | 2.3% |
| Federal Government Employees | 9 | 1.0% |
| Unpaid Family Workers | 0 | 0.0% |
| Total | 874 | 100.0% |
Employment Status by Age in Milan
According to the labor force statistics for Milan, out of the total population over 16 years of age (1,561), 58.8% or 918 individuals are in the labor force, with 4.4% or 40 of them unemployed. The age group with the highest labor force participation rate is 20 to 24 years, with 90.5% or 86 individuals in the labor force. Within the labor force, the 25 to 29 years age range has the highest percentage of unemployed individuals, with 21.7% or 13 of them being unemployed.
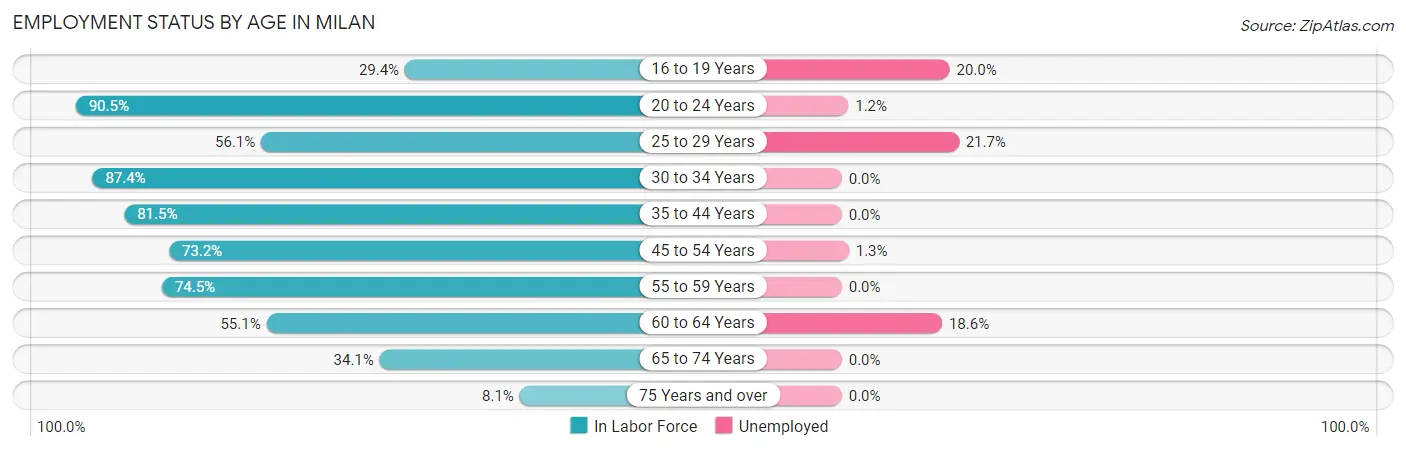
| Age Bracket | In Labor Force | Unemployed |
| 16 to 19 Years | 55 (29.4%) | 11 (20.0%) |
| 20 to 24 Years | 86 (90.5%) | 1 (1.2%) |
| 25 to 29 Years | 60 (56.1%) | 13 (21.7%) |
| 30 to 34 Years | 97 (87.4%) | 0 (0.0%) |
| 35 to 44 Years | 203 (81.5%) | 0 (0.0%) |
| 45 to 54 Years | 153 (73.2%) | 2 (1.3%) |
| 55 to 59 Years | 123 (74.5%) | 0 (0.0%) |
| 60 to 64 Years | 70 (55.1%) | 13 (18.6%) |
| 65 to 74 Years | 60 (34.1%) | 0 (0.0%) |
| 75 Years and over | 11 (8.1%) | 0 (0.0%) |
| Total | 918 (58.8%) | 40 (4.4%) |
Employment Status by Educational Attainment in Milan
According to labor force statistics for Milan, 72.9% of individuals (706) out of the total population between 25 and 64 years of age (968) are in the labor force, with 4.0% or 28 of them being unemployed. The group with the highest labor force participation rate are those with the educational attainment of less than high school, with 82.9% or 203 individuals in the labor force. Within the labor force, individuals with less than high school education have the highest percentage of unemployment, with 6.4% or 13 of them being unemployed.
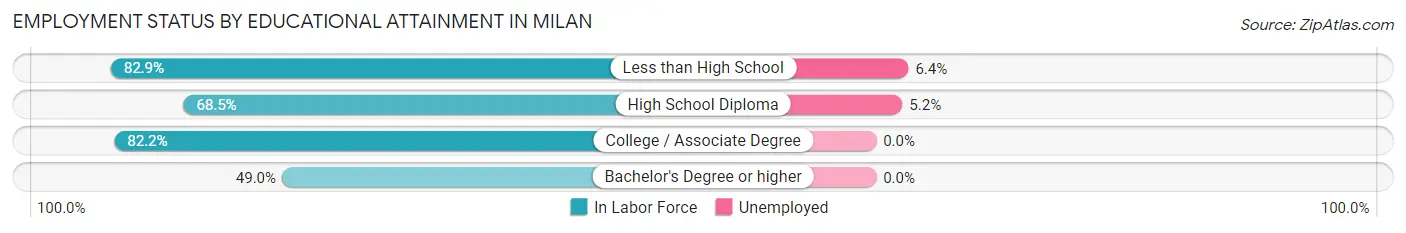
| Educational Attainment | In Labor Force | Unemployed |
| Less than High School | 203 (82.9%) | 16 (6.4%) |
| High School Diploma | 287 (68.5%) | 22 (5.2%) |
| College / Associate Degree | 166 (82.2%) | 0 (0.0%) |
| Bachelor's Degree or higher | 50 (49.0%) | 0 (0.0%) |
| Total | 706 (72.9%) | 39 (4.0%) |
Employment Occupations by Sex in Milan
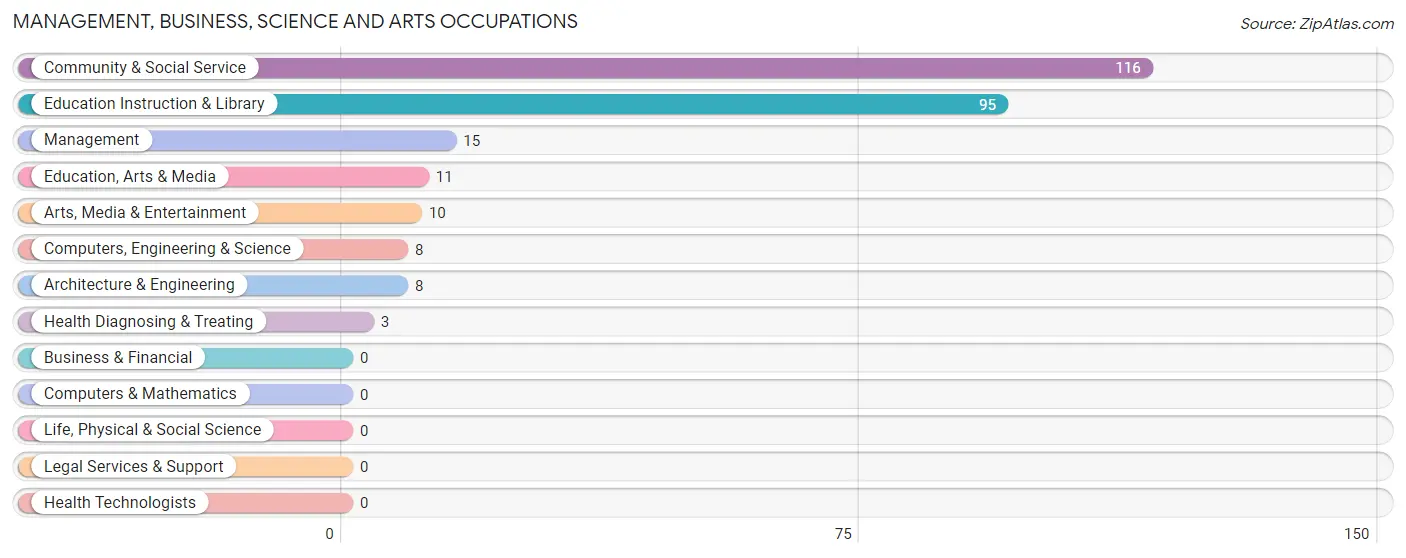
Management, Business, Science and Arts Occupations
The most common Management, Business, Science and Arts occupations in Milan are Community & Social Service (116 | 13.2%), Education Instruction & Library (95 | 10.8%), Management (15 | 1.7%), Education, Arts & Media (11 | 1.3%), and Arts, Media & Entertainment (10 | 1.1%).
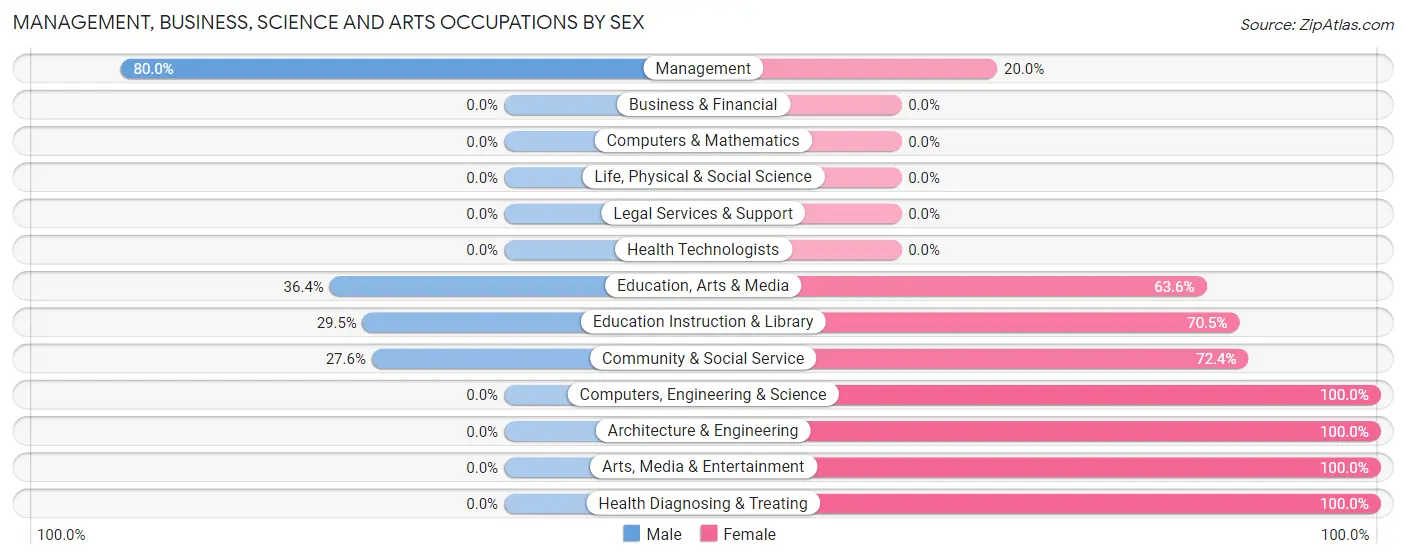
Management, Business, Science and Arts Occupations by Sex
Within the Management, Business, Science and Arts occupations in Milan, the most male-oriented occupations are Management (80.0%), Education, Arts & Media (36.4%), and Education Instruction & Library (29.5%), while the most female-oriented occupations are Computers, Engineering & Science (100.0%), Architecture & Engineering (100.0%), and Arts, Media & Entertainment (100.0%).
| Occupation | Male | Female |
| Management | 12 (80.0%) | 3 (20.0%) |
| Business & Financial | 0 (0.0%) | 0 (0.0%) |
| Computers, Engineering & Science | 0 (0.0%) | 8 (100.0%) |
| Computers & Mathematics | 0 (0.0%) | 0 (0.0%) |
| Architecture & Engineering | 0 (0.0%) | 8 (100.0%) |
| Life, Physical & Social Science | 0 (0.0%) | 0 (0.0%) |
| Community & Social Service | 32 (27.6%) | 84 (72.4%) |
| Education, Arts & Media | 4 (36.4%) | 7 (63.6%) |
| Legal Services & Support | 0 (0.0%) | 0 (0.0%) |
| Education Instruction & Library | 28 (29.5%) | 67 (70.5%) |
| Arts, Media & Entertainment | 0 (0.0%) | 10 (100.0%) |
| Health Diagnosing & Treating | 0 (0.0%) | 3 (100.0%) |
| Health Technologists | 0 (0.0%) | 0 (0.0%) |
| Total (Category) | 44 (31.0%) | 98 (69.0%) |
| Total (Overall) | 419 (47.8%) | 457 (52.2%) |
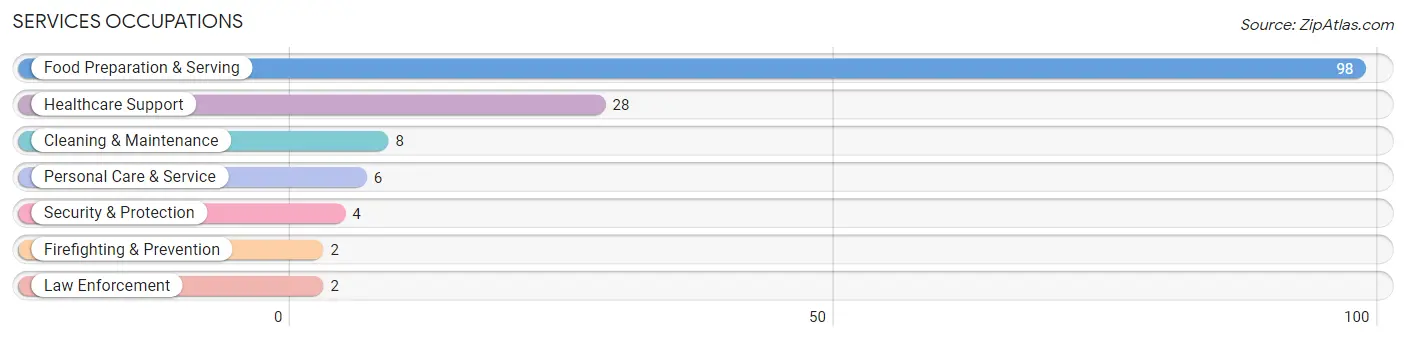
Services Occupations
The most common Services occupations in Milan are Food Preparation & Serving (98 | 11.2%), Healthcare Support (28 | 3.2%), Cleaning & Maintenance (8 | 0.9%), Personal Care & Service (6 | 0.7%), and Security & Protection (4 | 0.5%).
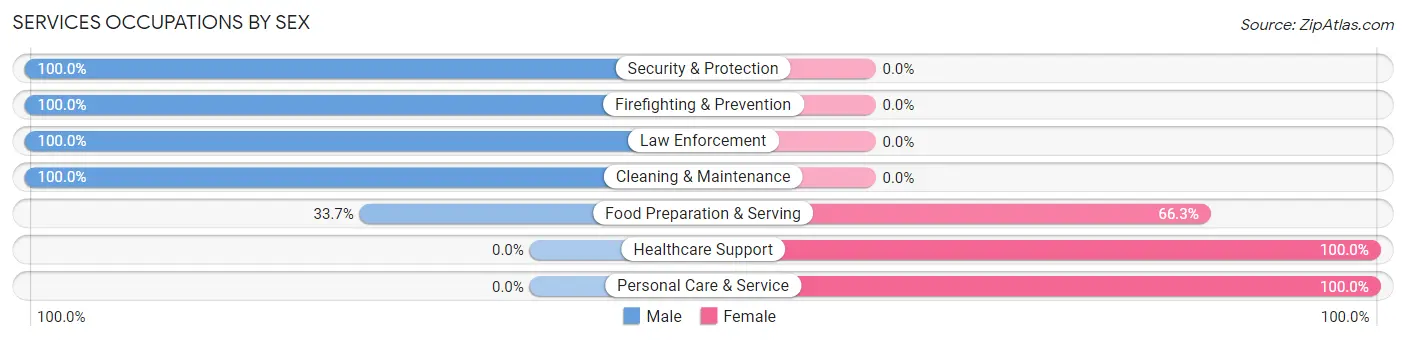
Services Occupations by Sex
Within the Services occupations in Milan, the most male-oriented occupations are Security & Protection (100.0%), Firefighting & Prevention (100.0%), and Law Enforcement (100.0%), while the most female-oriented occupations are Healthcare Support (100.0%), Personal Care & Service (100.0%), and Food Preparation & Serving (66.3%).
| Occupation | Male | Female |
| Healthcare Support | 0 (0.0%) | 28 (100.0%) |
| Security & Protection | 4 (100.0%) | 0 (0.0%) |
| Firefighting & Prevention | 2 (100.0%) | 0 (0.0%) |
| Law Enforcement | 2 (100.0%) | 0 (0.0%) |
| Food Preparation & Serving | 33 (33.7%) | 65 (66.3%) |
| Cleaning & Maintenance | 8 (100.0%) | 0 (0.0%) |
| Personal Care & Service | 0 (0.0%) | 6 (100.0%) |
| Total (Category) | 45 (31.2%) | 99 (68.8%) |
| Total (Overall) | 419 (47.8%) | 457 (52.2%) |
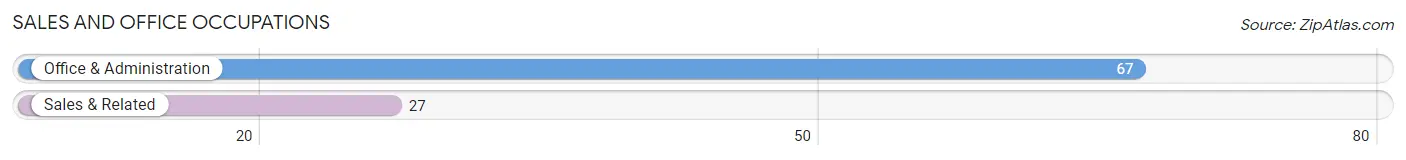
Sales and Office Occupations
The most common Sales and Office occupations in Milan are Office & Administration (67 | 7.6%), and Sales & Related (27 | 3.1%).
Sales and Office Occupations by Sex
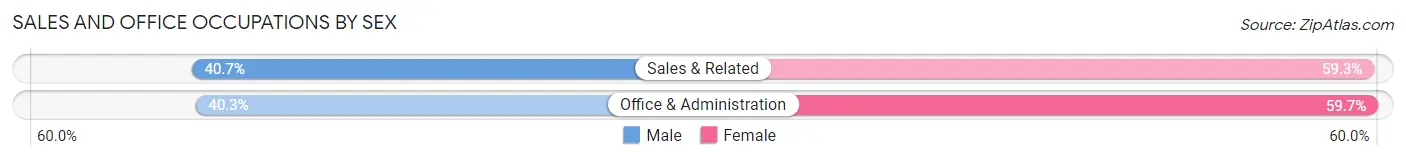
| Occupation | Male | Female |
| Sales & Related | 11 (40.7%) | 16 (59.3%) |
| Office & Administration | 27 (40.3%) | 40 (59.7%) |
| Total (Category) | 38 (40.4%) | 56 (59.6%) |
| Total (Overall) | 419 (47.8%) | 457 (52.2%) |
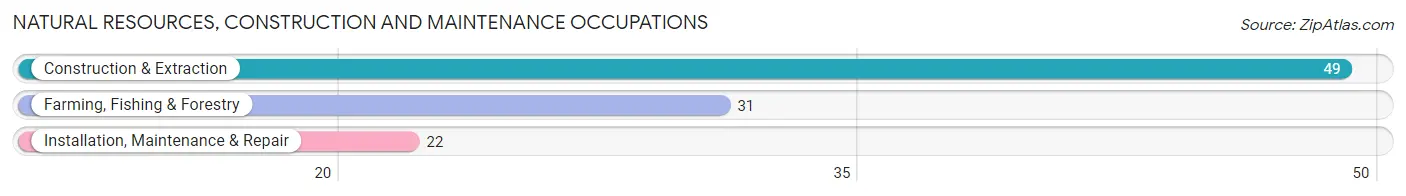
Natural Resources, Construction and Maintenance Occupations
The most common Natural Resources, Construction and Maintenance occupations in Milan are Construction & Extraction (49 | 5.6%), Farming, Fishing & Forestry (31 | 3.5%), and Installation, Maintenance & Repair (22 | 2.5%).
Natural Resources, Construction and Maintenance Occupations by Sex
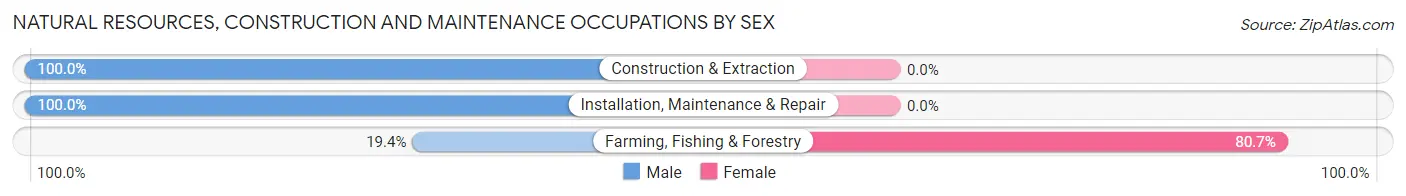
| Occupation | Male | Female |
| Farming, Fishing & Forestry | 6 (19.4%) | 25 (80.6%) |
| Construction & Extraction | 49 (100.0%) | 0 (0.0%) |
| Installation, Maintenance & Repair | 22 (100.0%) | 0 (0.0%) |
| Total (Category) | 77 (75.5%) | 25 (24.5%) |
| Total (Overall) | 419 (47.8%) | 457 (52.2%) |
Production, Transportation and Moving Occupations
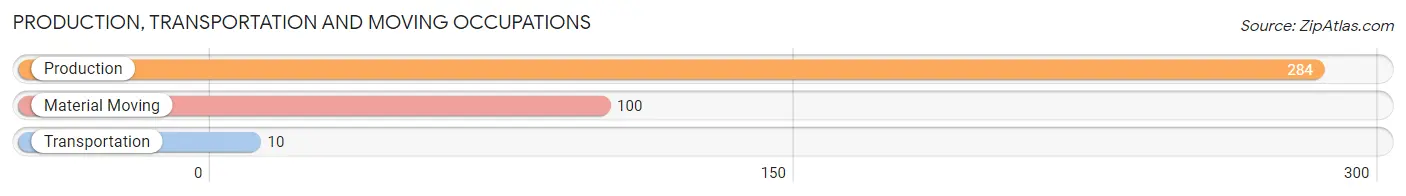
The most common Production, Transportation and Moving occupations in Milan are Production (284 | 32.4%), Material Moving (100 | 11.4%), and Transportation (10 | 1.1%).
Production, Transportation and Moving Occupations by Sex
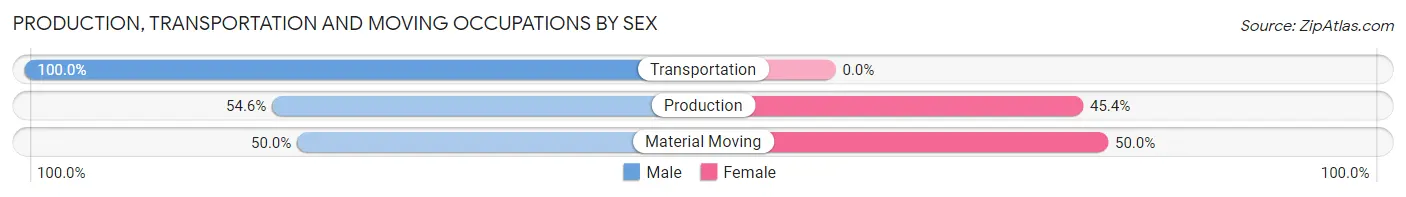
| Occupation | Male | Female |
| Production | 155 (54.6%) | 129 (45.4%) |
| Transportation | 10 (100.0%) | 0 (0.0%) |
| Material Moving | 50 (50.0%) | 50 (50.0%) |
| Total (Category) | 215 (54.6%) | 179 (45.4%) |
| Total (Overall) | 419 (47.8%) | 457 (52.2%) |
Employment Industries by Sex in Milan
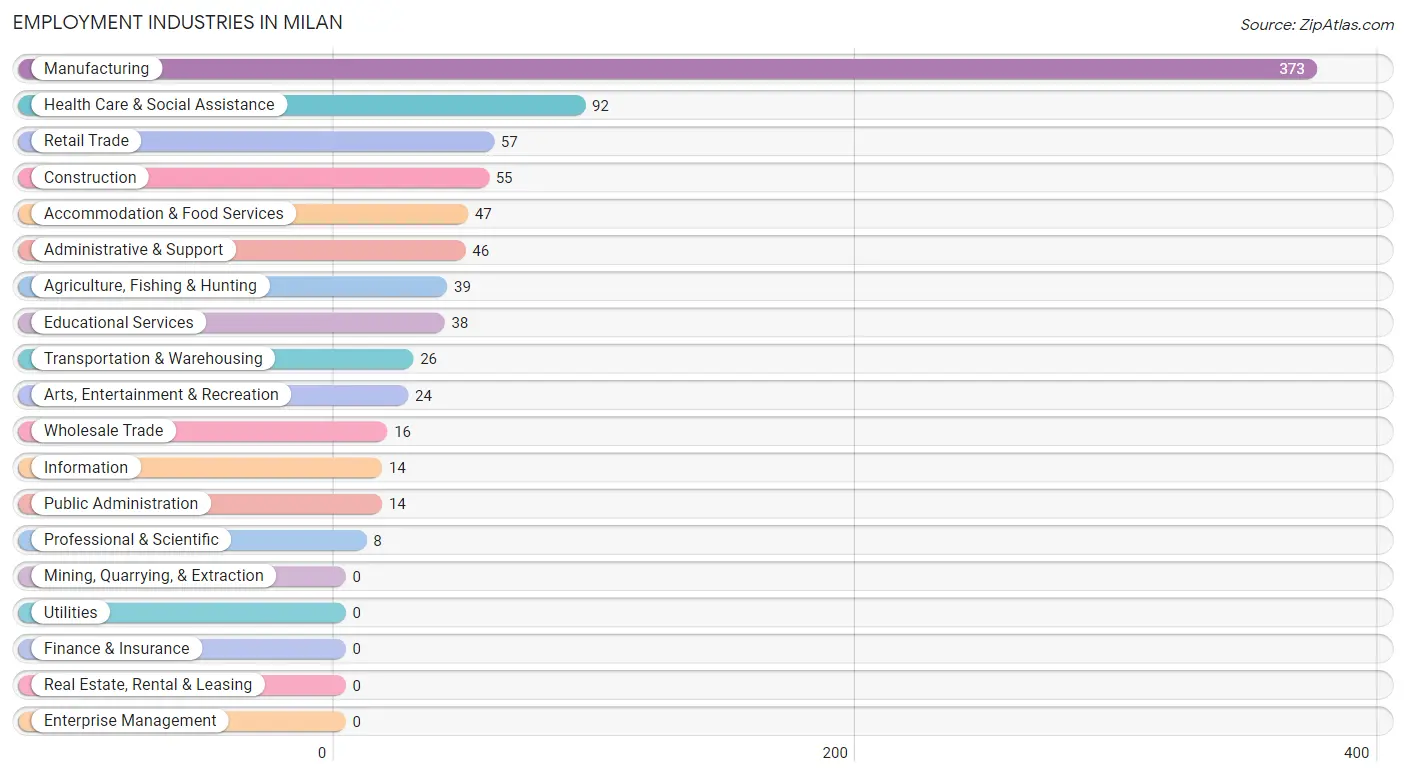
Employment Industries in Milan
The major employment industries in Milan include Manufacturing (373 | 42.6%), Health Care & Social Assistance (92 | 10.5%), Retail Trade (57 | 6.5%), Construction (55 | 6.3%), and Accommodation & Food Services (47 | 5.4%).
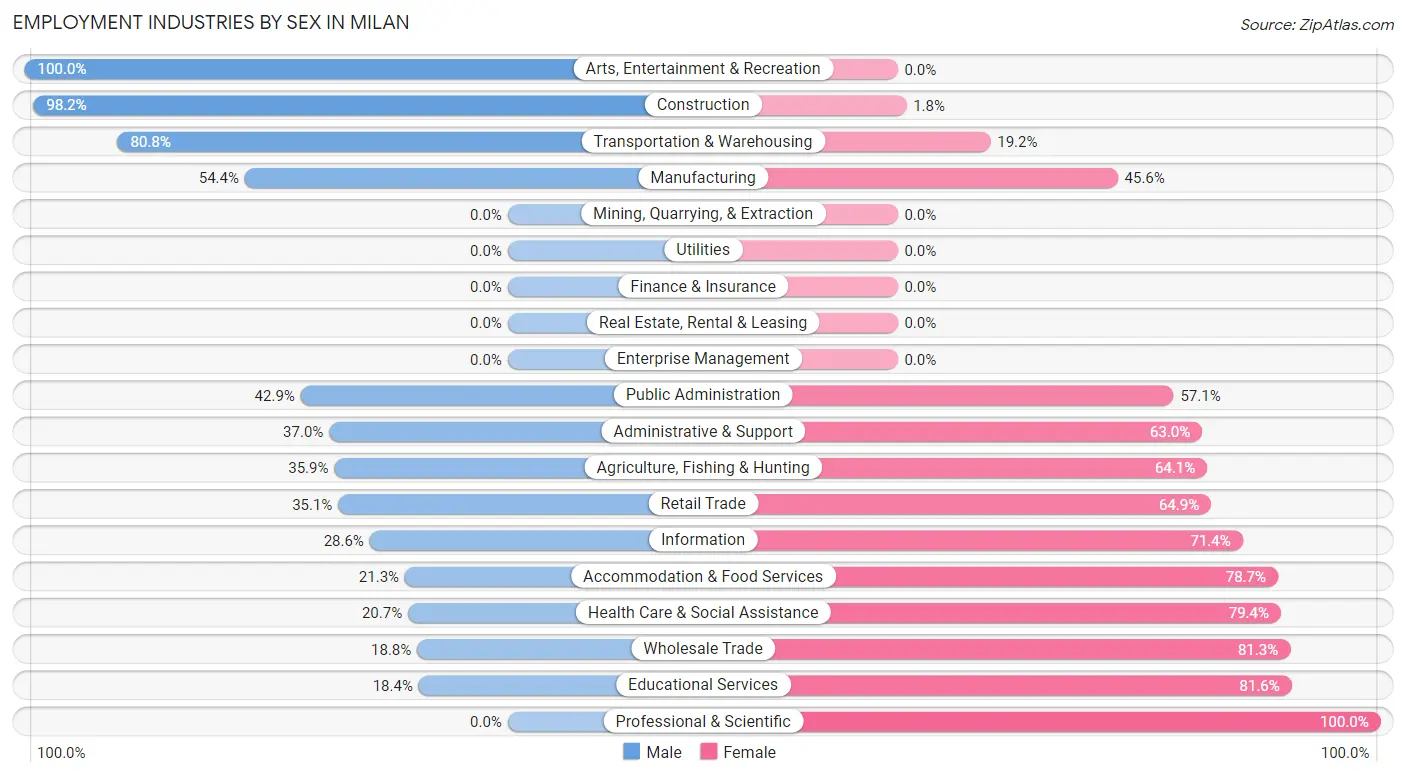
Employment Industries by Sex in Milan
The Milan industries that see more men than women are Arts, Entertainment & Recreation (100.0%), Construction (98.2%), and Transportation & Warehousing (80.8%), whereas the industries that tend to have a higher number of women are Professional & Scientific (100.0%), Educational Services (81.6%), and Wholesale Trade (81.2%).
| Industry | Male | Female |
| Agriculture, Fishing & Hunting | 14 (35.9%) | 25 (64.1%) |
| Mining, Quarrying, & Extraction | 0 (0.0%) | 0 (0.0%) |
| Construction | 54 (98.2%) | 1 (1.8%) |
| Manufacturing | 203 (54.4%) | 170 (45.6%) |
| Wholesale Trade | 3 (18.8%) | 13 (81.2%) |
| Retail Trade | 20 (35.1%) | 37 (64.9%) |
| Transportation & Warehousing | 21 (80.8%) | 5 (19.2%) |
| Utilities | 0 (0.0%) | 0 (0.0%) |
| Information | 4 (28.6%) | 10 (71.4%) |
| Finance & Insurance | 0 (0.0%) | 0 (0.0%) |
| Real Estate, Rental & Leasing | 0 (0.0%) | 0 (0.0%) |
| Professional & Scientific | 0 (0.0%) | 8 (100.0%) |
| Enterprise Management | 0 (0.0%) | 0 (0.0%) |
| Administrative & Support | 17 (37.0%) | 29 (63.0%) |
| Educational Services | 7 (18.4%) | 31 (81.6%) |
| Health Care & Social Assistance | 19 (20.6%) | 73 (79.3%) |
| Arts, Entertainment & Recreation | 24 (100.0%) | 0 (0.0%) |
| Accommodation & Food Services | 10 (21.3%) | 37 (78.7%) |
| Public Administration | 6 (42.9%) | 8 (57.1%) |
| Total | 419 (47.8%) | 457 (52.2%) |
Education in Milan
School Enrollment in Milan
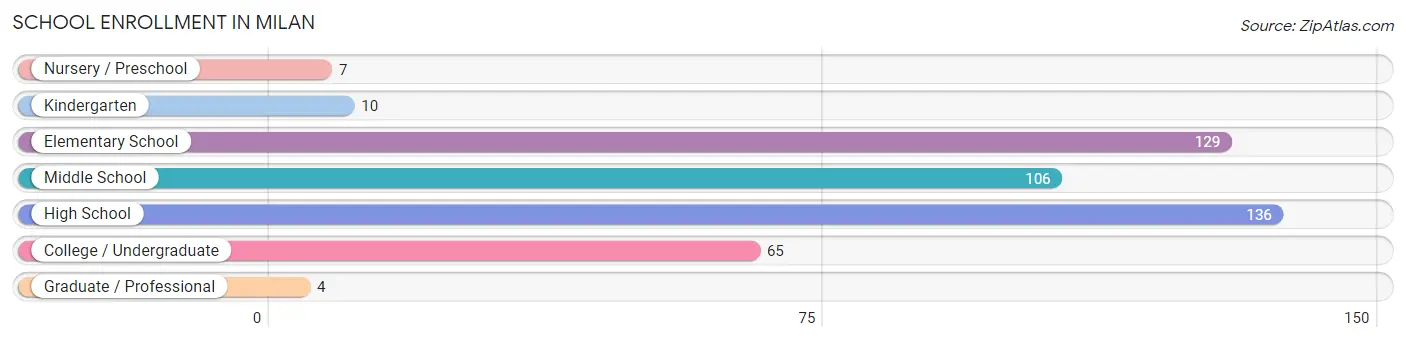
The most common levels of schooling among the 457 students in Milan are high school (136 | 29.8%), elementary school (129 | 28.2%), and middle school (106 | 23.2%).
| School Level | # Students | % Students |
| Nursery / Preschool | 7 | 1.5% |
| Kindergarten | 10 | 2.2% |
| Elementary School | 129 | 28.2% |
| Middle School | 106 | 23.2% |
| High School | 136 | 29.8% |
| College / Undergraduate | 65 | 14.2% |
| Graduate / Professional | 4 | 0.9% |
| Total | 457 | 100.0% |
School Enrollment by Age by Funding Source in Milan
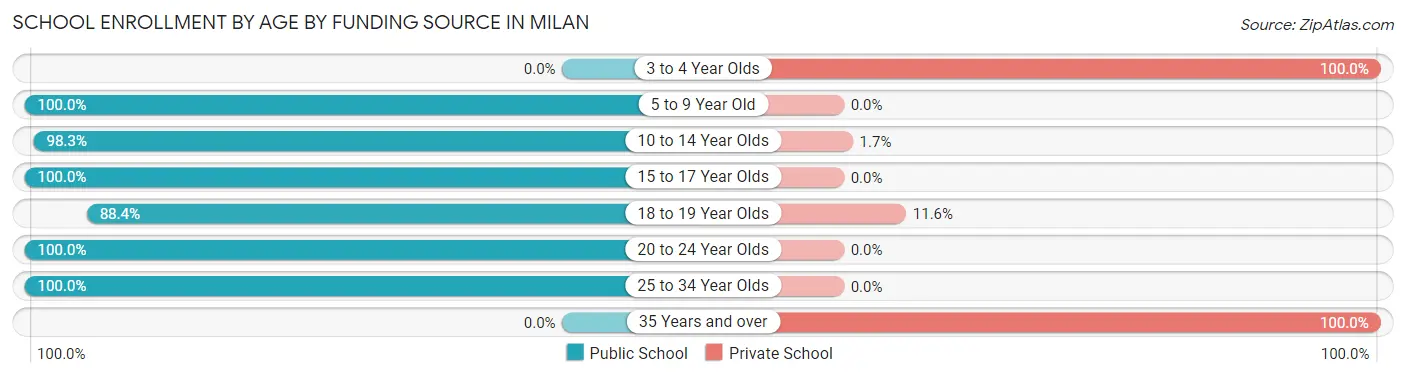
Out of a total of 457 students who are enrolled in schools in Milan, 28 (6.1%) attend a private institution, while the remaining 429 (93.9%) are enrolled in public schools. The age group of 3 to 4 year olds has the highest likelihood of being enrolled in private schools, with 4 (100.0% in the age bracket) enrolled. Conversely, the age group of 5 to 9 year old has the lowest likelihood of being enrolled in a private school, with 140 (100.0% in the age bracket) attending a public institution.
| Age Bracket | Public School | Private School |
| 3 to 4 Year Olds | 0 (0.0%) | 4 (100.0%) |
| 5 to 9 Year Old | 140 (100.0%) | 0 (0.0%) |
| 10 to 14 Year Olds | 118 (98.3%) | 2 (1.7%) |
| 15 to 17 Year Olds | 50 (100.0%) | 0 (0.0%) |
| 18 to 19 Year Olds | 84 (88.4%) | 11 (11.6%) |
| 20 to 24 Year Olds | 7 (100.0%) | 0 (0.0%) |
| 25 to 34 Year Olds | 30 (100.0%) | 0 (0.0%) |
| 35 Years and over | 0 (0.0%) | 11 (100.0%) |
| Total | 429 (93.9%) | 28 (6.1%) |
Educational Attainment by Field of Study in Milan
Education (65 | 46.4%), visual & performing arts (27 | 19.3%), business (22 | 15.7%), physical & health sciences (6 | 4.3%), and communications (6 | 4.3%) are the most common fields of study among 140 individuals in Milan who have obtained a bachelor's degree or higher.
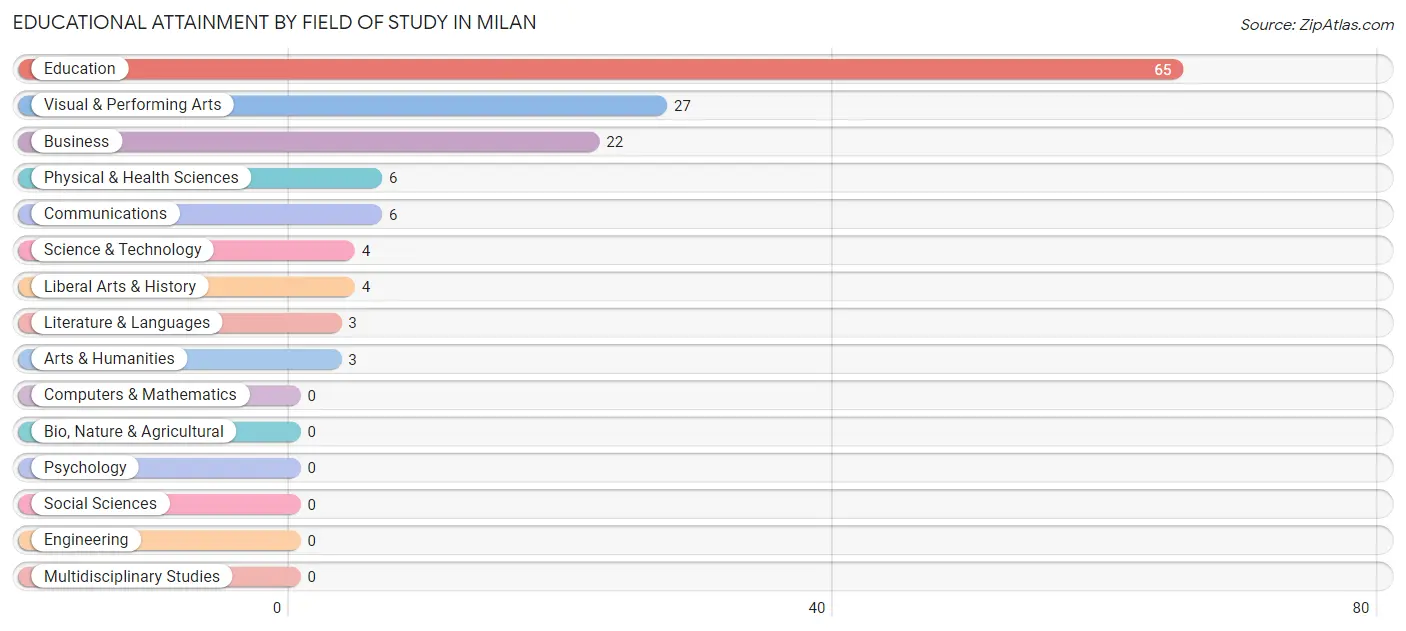
| Field of Study | # Graduates | % Graduates |
| Computers & Mathematics | 0 | 0.0% |
| Bio, Nature & Agricultural | 0 | 0.0% |
| Physical & Health Sciences | 6 | 4.3% |
| Psychology | 0 | 0.0% |
| Social Sciences | 0 | 0.0% |
| Engineering | 0 | 0.0% |
| Multidisciplinary Studies | 0 | 0.0% |
| Science & Technology | 4 | 2.9% |
| Business | 22 | 15.7% |
| Education | 65 | 46.4% |
| Literature & Languages | 3 | 2.1% |
| Liberal Arts & History | 4 | 2.9% |
| Visual & Performing Arts | 27 | 19.3% |
| Communications | 6 | 4.3% |
| Arts & Humanities | 3 | 2.1% |
| Total | 140 | 100.0% |
Transportation & Commute in Milan
Vehicle Availability by Sex in Milan
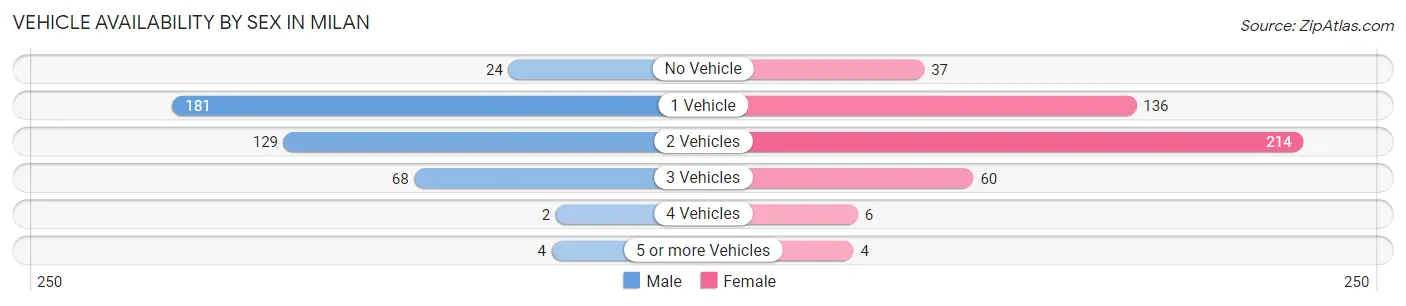
The most prevalent vehicle ownership categories in Milan are males with 1 vehicle (181, accounting for 44.4%) and females with 1 vehicle (136, making up 39.6%).
| Vehicles Available | Male | Female |
| No Vehicle | 24 (5.9%) | 37 (8.1%) |
| 1 Vehicle | 181 (44.4%) | 136 (29.8%) |
| 2 Vehicles | 129 (31.6%) | 214 (46.8%) |
| 3 Vehicles | 68 (16.7%) | 60 (13.1%) |
| 4 Vehicles | 2 (0.5%) | 6 (1.3%) |
| 5 or more Vehicles | 4 (1.0%) | 4 (0.9%) |
| Total | 408 (100.0%) | 457 (100.0%) |
Commute Time in Milan
The most frequently occuring commute durations in Milan are 10 to 14 minutes (279 commuters, 33.3%), 5 to 9 minutes (233 commuters, 27.8%), and less than 5 minutes (103 commuters, 12.3%).
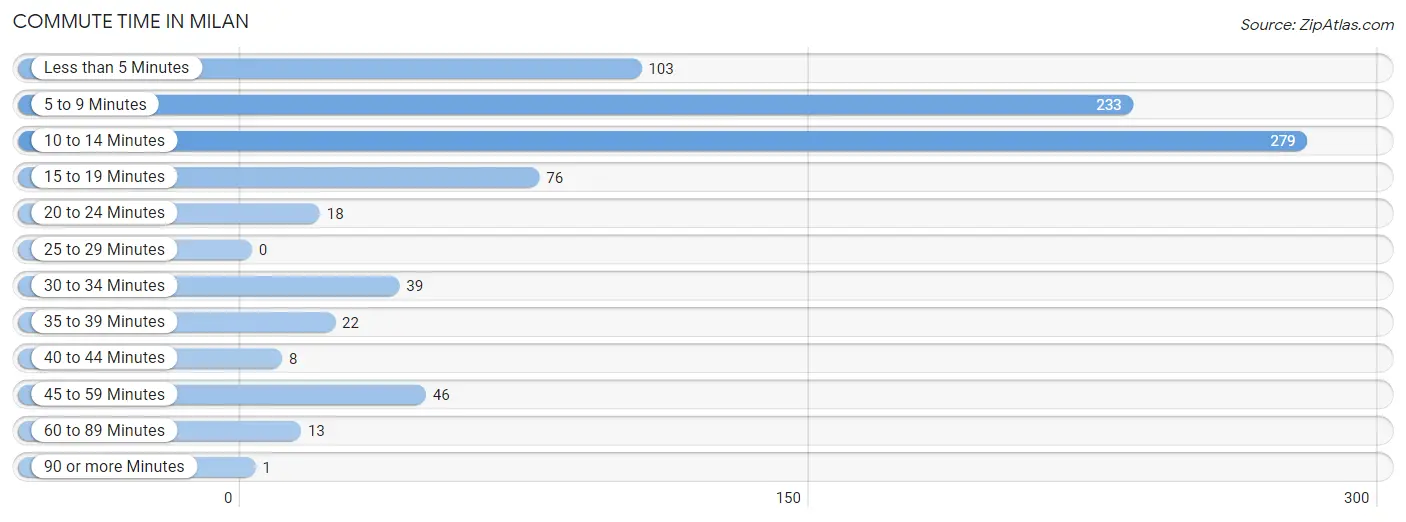
| Commute Time | # Commuters | % Commuters |
| Less than 5 Minutes | 103 | 12.3% |
| 5 to 9 Minutes | 233 | 27.8% |
| 10 to 14 Minutes | 279 | 33.3% |
| 15 to 19 Minutes | 76 | 9.1% |
| 20 to 24 Minutes | 18 | 2.1% |
| 25 to 29 Minutes | 0 | 0.0% |
| 30 to 34 Minutes | 39 | 4.6% |
| 35 to 39 Minutes | 22 | 2.6% |
| 40 to 44 Minutes | 8 | 0.9% |
| 45 to 59 Minutes | 46 | 5.5% |
| 60 to 89 Minutes | 13 | 1.5% |
| 90 or more Minutes | 1 | 0.1% |
Commute Time by Sex in Milan
The most common commute times in Milan are 10 to 14 minutes (167 commuters, 43.0%) for males and 5 to 9 minutes (150 commuters, 33.3%) for females.
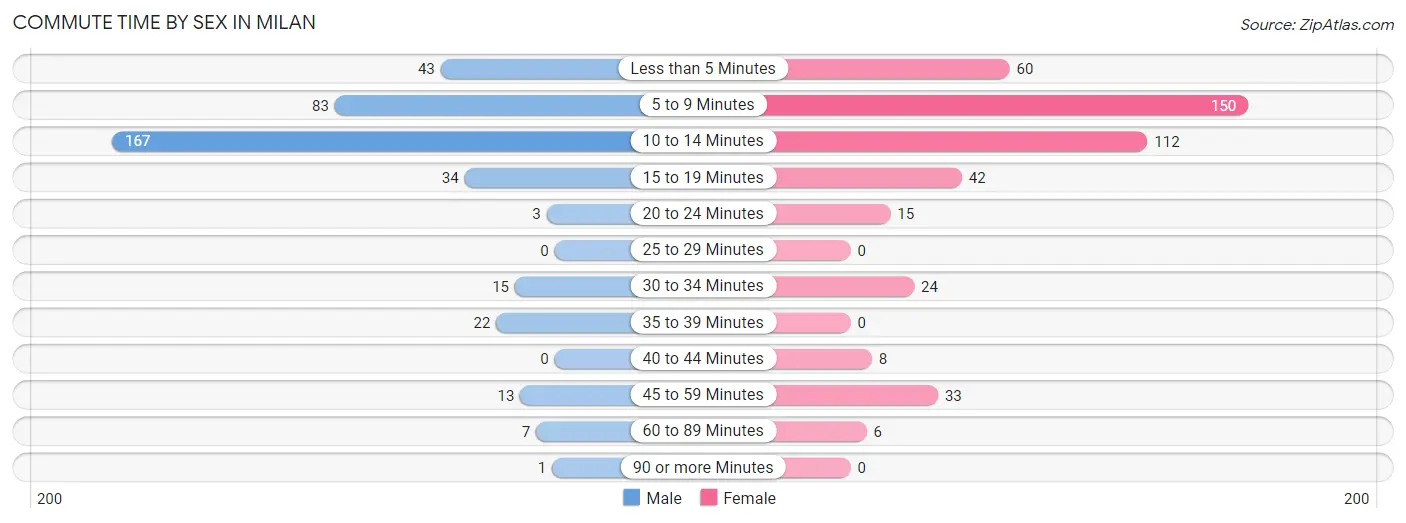
| Commute Time | Male | Female |
| Less than 5 Minutes | 43 (11.1%) | 60 (13.3%) |
| 5 to 9 Minutes | 83 (21.4%) | 150 (33.3%) |
| 10 to 14 Minutes | 167 (43.0%) | 112 (24.9%) |
| 15 to 19 Minutes | 34 (8.8%) | 42 (9.3%) |
| 20 to 24 Minutes | 3 (0.8%) | 15 (3.3%) |
| 25 to 29 Minutes | 0 (0.0%) | 0 (0.0%) |
| 30 to 34 Minutes | 15 (3.9%) | 24 (5.3%) |
| 35 to 39 Minutes | 22 (5.7%) | 0 (0.0%) |
| 40 to 44 Minutes | 0 (0.0%) | 8 (1.8%) |
| 45 to 59 Minutes | 13 (3.4%) | 33 (7.3%) |
| 60 to 89 Minutes | 7 (1.8%) | 6 (1.3%) |
| 90 or more Minutes | 1 (0.3%) | 0 (0.0%) |
Time of Departure to Work by Sex in Milan
The most frequent times of departure to work in Milan are 5:30 AM to 5:59 AM (109, 28.1%) for males and 5:30 AM to 5:59 AM (155, 34.4%) for females.
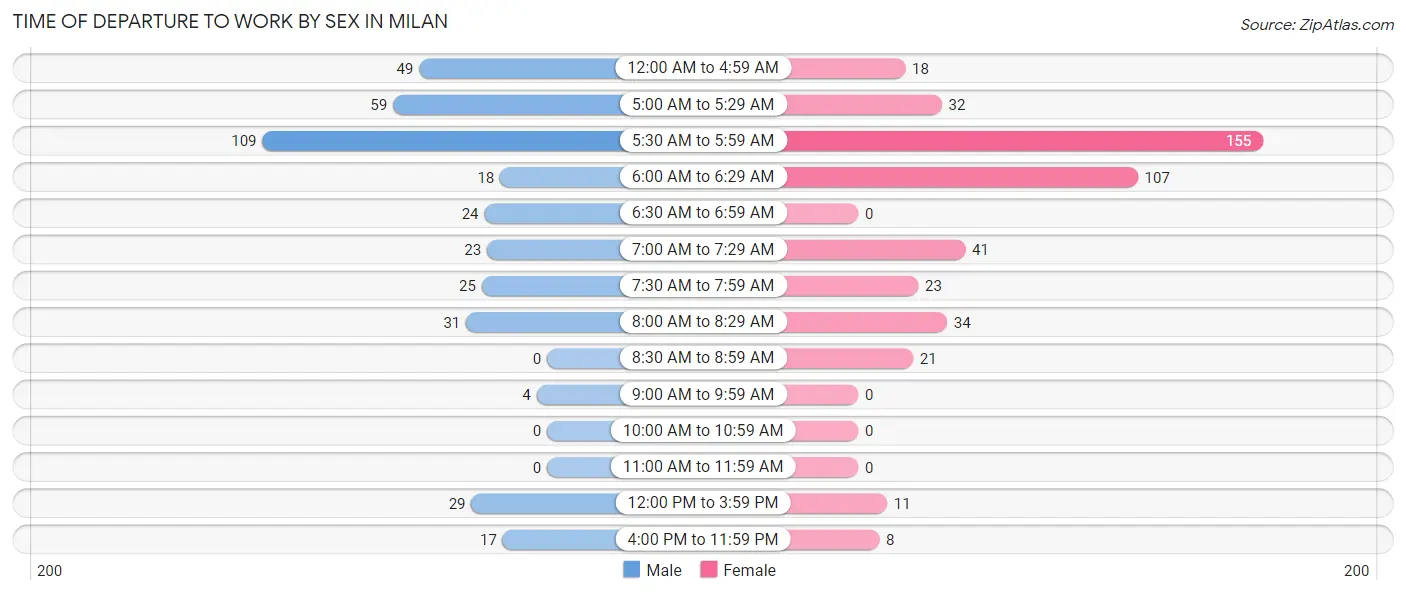
| Time of Departure | Male | Female |
| 12:00 AM to 4:59 AM | 49 (12.6%) | 18 (4.0%) |
| 5:00 AM to 5:29 AM | 59 (15.2%) | 32 (7.1%) |
| 5:30 AM to 5:59 AM | 109 (28.1%) | 155 (34.4%) |
| 6:00 AM to 6:29 AM | 18 (4.6%) | 107 (23.8%) |
| 6:30 AM to 6:59 AM | 24 (6.2%) | 0 (0.0%) |
| 7:00 AM to 7:29 AM | 23 (5.9%) | 41 (9.1%) |
| 7:30 AM to 7:59 AM | 25 (6.4%) | 23 (5.1%) |
| 8:00 AM to 8:29 AM | 31 (8.0%) | 34 (7.6%) |
| 8:30 AM to 8:59 AM | 0 (0.0%) | 21 (4.7%) |
| 9:00 AM to 9:59 AM | 4 (1.0%) | 0 (0.0%) |
| 10:00 AM to 10:59 AM | 0 (0.0%) | 0 (0.0%) |
| 11:00 AM to 11:59 AM | 0 (0.0%) | 0 (0.0%) |
| 12:00 PM to 3:59 PM | 29 (7.5%) | 11 (2.4%) |
| 4:00 PM to 11:59 PM | 17 (4.4%) | 8 (1.8%) |
| Total | 388 (100.0%) | 450 (100.0%) |
Housing Occupancy in Milan
Occupancy by Ownership in Milan
Of the total 652 dwellings in Milan, owner-occupied units account for 377 (57.8%), while renter-occupied units make up 275 (42.2%).
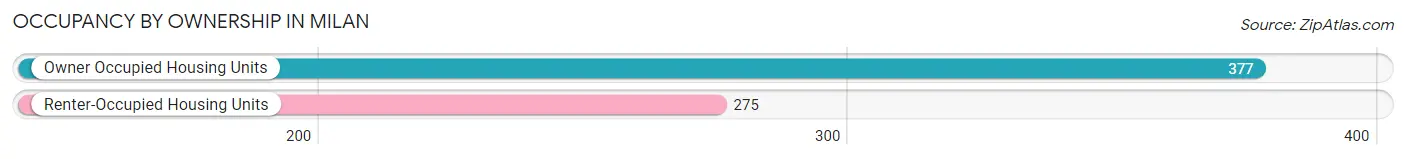
| Occupancy | # Housing Units | % Housing Units |
| Owner Occupied Housing Units | 377 | 57.8% |
| Renter-Occupied Housing Units | 275 | 42.2% |
| Total Occupied Housing Units | 652 | 100.0% |
Occupancy by Household Size in Milan
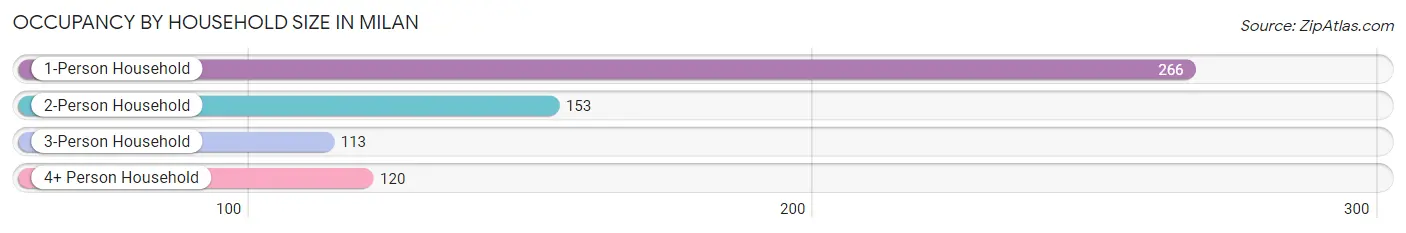
| Household Size | # Housing Units | % Housing Units |
| 1-Person Household | 266 | 40.8% |
| 2-Person Household | 153 | 23.5% |
| 3-Person Household | 113 | 17.3% |
| 4+ Person Household | 120 | 18.4% |
| Total Housing Units | 652 | 100.0% |
Occupancy by Ownership by Household Size in Milan
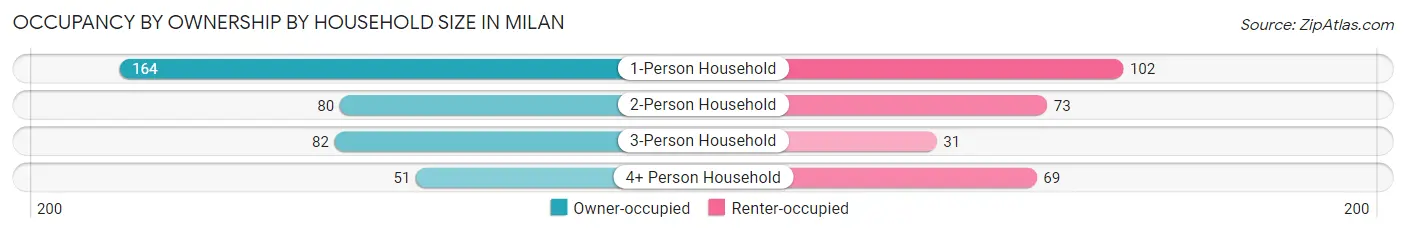
| Household Size | Owner-occupied | Renter-occupied |
| 1-Person Household | 164 (61.7%) | 102 (38.4%) |
| 2-Person Household | 80 (52.3%) | 73 (47.7%) |
| 3-Person Household | 82 (72.6%) | 31 (27.4%) |
| 4+ Person Household | 51 (42.5%) | 69 (57.5%) |
| Total Housing Units | 377 (57.8%) | 275 (42.2%) |
Occupancy by Educational Attainment in Milan
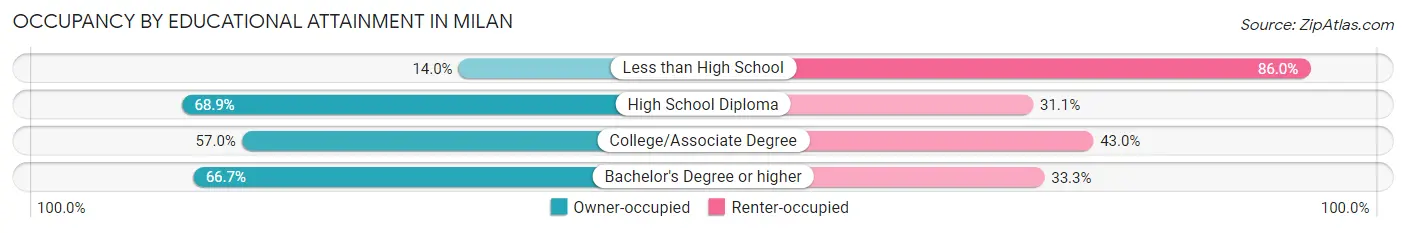
| Household Size | Owner-occupied | Renter-occupied |
| Less than High School | 13 (14.0%) | 80 (86.0%) |
| High School Diploma | 226 (68.9%) | 102 (31.1%) |
| College/Associate Degree | 94 (57.0%) | 71 (43.0%) |
| Bachelor's Degree or higher | 44 (66.7%) | 22 (33.3%) |
Occupancy by Age of Householder in Milan
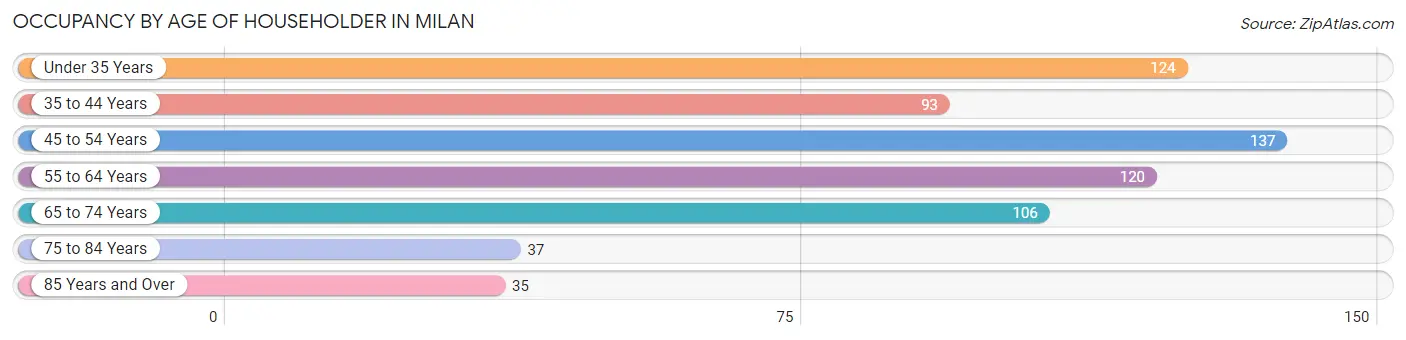
| Age Bracket | # Households | % Households |
| Under 35 Years | 124 | 19.0% |
| 35 to 44 Years | 93 | 14.3% |
| 45 to 54 Years | 137 | 21.0% |
| 55 to 64 Years | 120 | 18.4% |
| 65 to 74 Years | 106 | 16.3% |
| 75 to 84 Years | 37 | 5.7% |
| 85 Years and Over | 35 | 5.4% |
| Total | 652 | 100.0% |
Housing Finances in Milan
Median Income by Occupancy in Milan
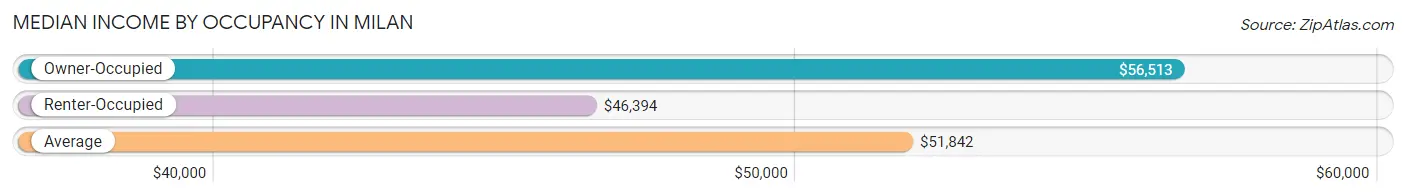
| Occupancy Type | # Households | Median Income |
| Owner-Occupied | 377 (57.8%) | $56,513 |
| Renter-Occupied | 275 (42.2%) | $46,394 |
| Average | 652 (100.0%) | $51,842 |
Occupancy by Householder Income Bracket in Milan
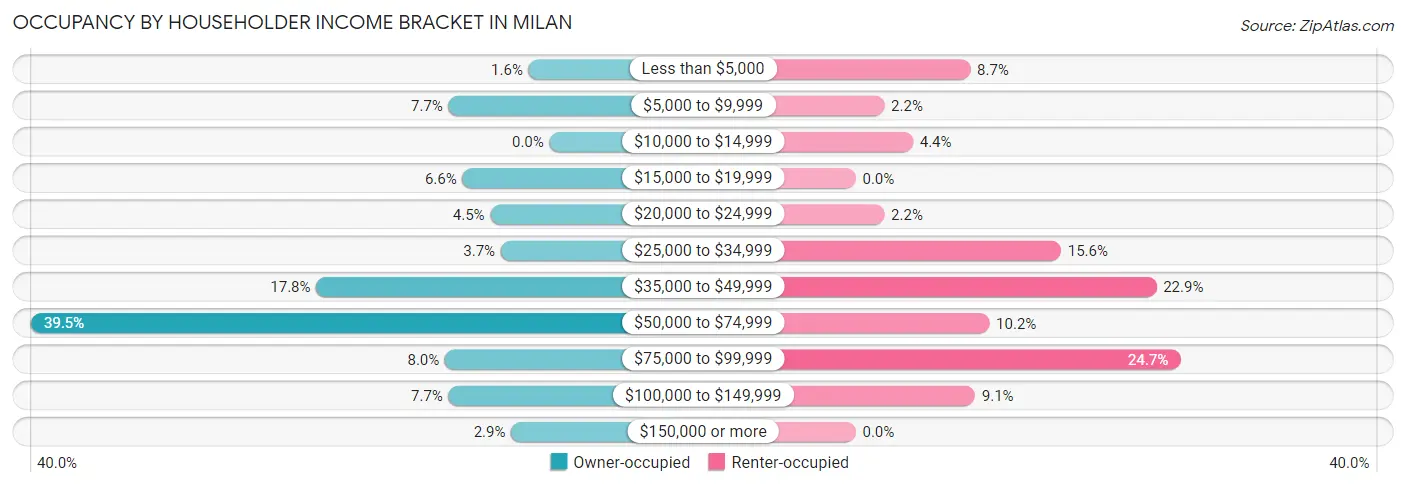
| Income Bracket | Owner-occupied | Renter-occupied |
| Less than $5,000 | 6 (1.6%) | 24 (8.7%) |
| $5,000 to $9,999 | 29 (7.7%) | 6 (2.2%) |
| $10,000 to $14,999 | 0 (0.0%) | 12 (4.4%) |
| $15,000 to $19,999 | 25 (6.6%) | 0 (0.0%) |
| $20,000 to $24,999 | 17 (4.5%) | 6 (2.2%) |
| $25,000 to $34,999 | 14 (3.7%) | 43 (15.6%) |
| $35,000 to $49,999 | 67 (17.8%) | 63 (22.9%) |
| $50,000 to $74,999 | 149 (39.5%) | 28 (10.2%) |
| $75,000 to $99,999 | 30 (8.0%) | 68 (24.7%) |
| $100,000 to $149,999 | 29 (7.7%) | 25 (9.1%) |
| $150,000 or more | 11 (2.9%) | 0 (0.0%) |
| Total | 377 (100.0%) | 275 (100.0%) |
Monthly Housing Cost Tiers in Milan
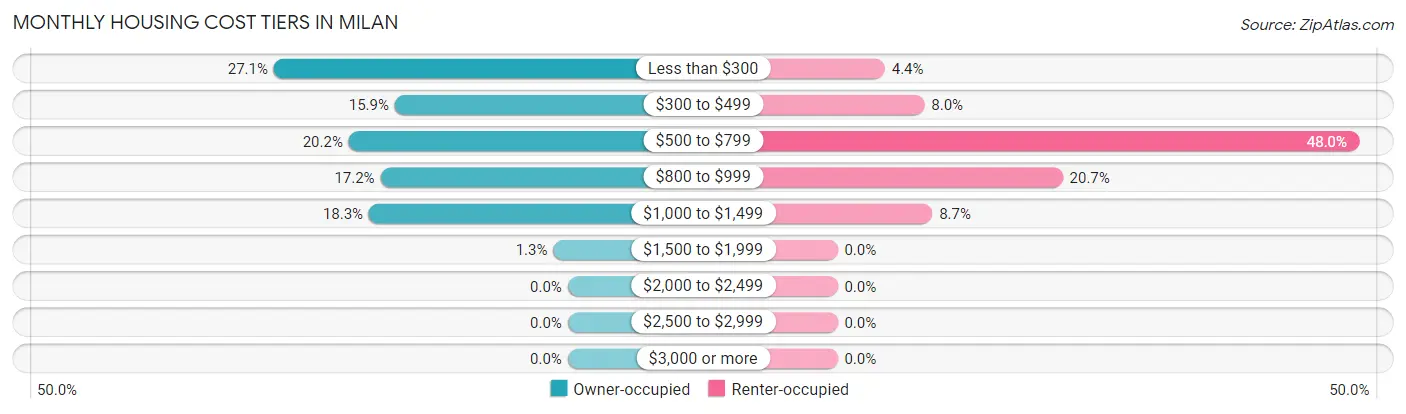
| Monthly Cost | Owner-occupied | Renter-occupied |
| Less than $300 | 102 (27.1%) | 12 (4.4%) |
| $300 to $499 | 60 (15.9%) | 22 (8.0%) |
| $500 to $799 | 76 (20.2%) | 132 (48.0%) |
| $800 to $999 | 65 (17.2%) | 57 (20.7%) |
| $1,000 to $1,499 | 69 (18.3%) | 24 (8.7%) |
| $1,500 to $1,999 | 5 (1.3%) | 0 (0.0%) |
| $2,000 to $2,499 | 0 (0.0%) | 0 (0.0%) |
| $2,500 to $2,999 | 0 (0.0%) | 0 (0.0%) |
| $3,000 or more | 0 (0.0%) | 0 (0.0%) |
| Total | 377 (100.0%) | 275 (100.0%) |
Physical Housing Characteristics in Milan
Housing Structures in Milan
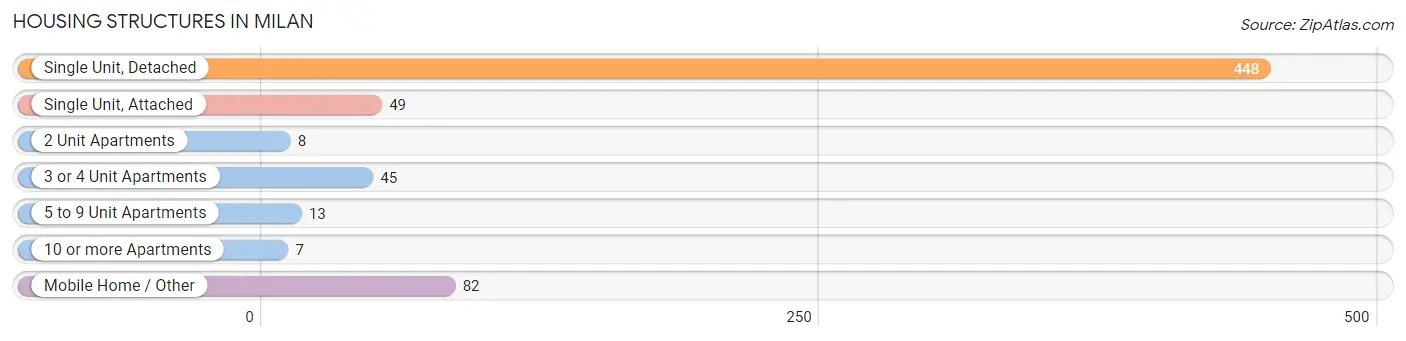
| Structure Type | # Housing Units | % Housing Units |
| Single Unit, Detached | 448 | 68.7% |
| Single Unit, Attached | 49 | 7.5% |
| 2 Unit Apartments | 8 | 1.2% |
| 3 or 4 Unit Apartments | 45 | 6.9% |
| 5 to 9 Unit Apartments | 13 | 2.0% |
| 10 or more Apartments | 7 | 1.1% |
| Mobile Home / Other | 82 | 12.6% |
| Total | 652 | 100.0% |
Housing Structures by Occupancy in Milan
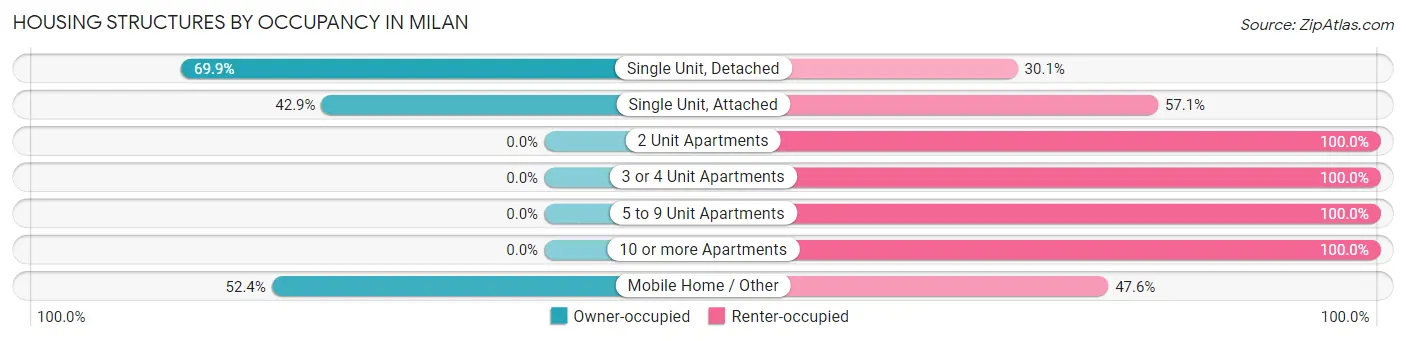
| Structure Type | Owner-occupied | Renter-occupied |
| Single Unit, Detached | 313 (69.9%) | 135 (30.1%) |
| Single Unit, Attached | 21 (42.9%) | 28 (57.1%) |
| 2 Unit Apartments | 0 (0.0%) | 8 (100.0%) |
| 3 or 4 Unit Apartments | 0 (0.0%) | 45 (100.0%) |
| 5 to 9 Unit Apartments | 0 (0.0%) | 13 (100.0%) |
| 10 or more Apartments | 0 (0.0%) | 7 (100.0%) |
| Mobile Home / Other | 43 (52.4%) | 39 (47.6%) |
| Total | 377 (57.8%) | 275 (42.2%) |
Housing Structures by Number of Rooms in Milan
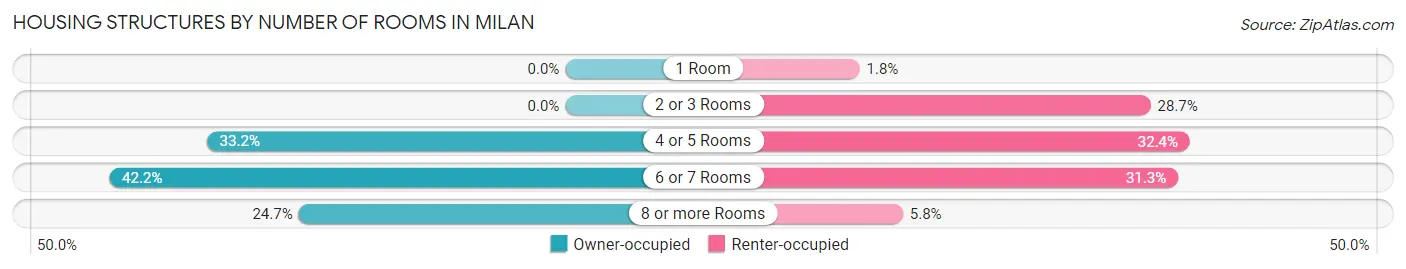
| Number of Rooms | Owner-occupied | Renter-occupied |
| 1 Room | 0 (0.0%) | 5 (1.8%) |
| 2 or 3 Rooms | 0 (0.0%) | 79 (28.7%) |
| 4 or 5 Rooms | 125 (33.2%) | 89 (32.4%) |
| 6 or 7 Rooms | 159 (42.2%) | 86 (31.3%) |
| 8 or more Rooms | 93 (24.7%) | 16 (5.8%) |
| Total | 377 (100.0%) | 275 (100.0%) |
Housing Structure by Heating Type in Milan
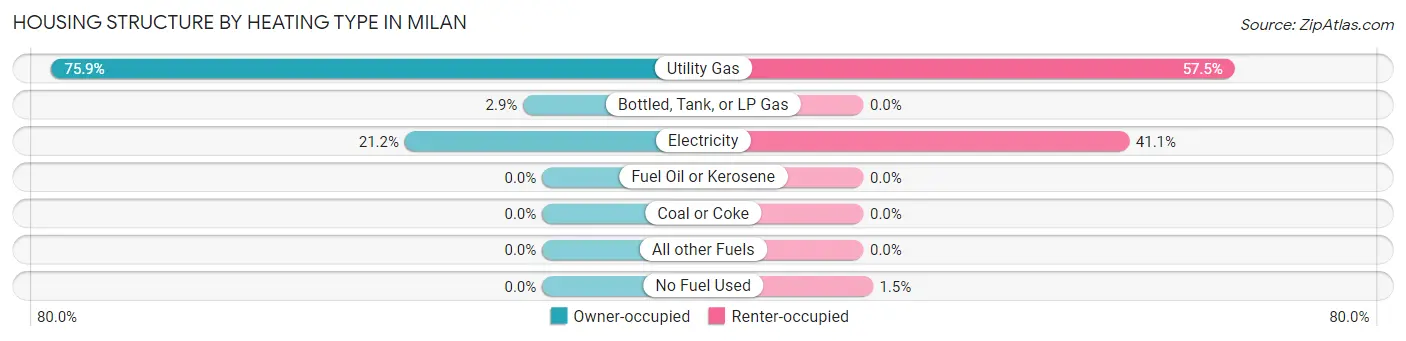
| Heating Type | Owner-occupied | Renter-occupied |
| Utility Gas | 286 (75.9%) | 158 (57.5%) |
| Bottled, Tank, or LP Gas | 11 (2.9%) | 0 (0.0%) |
| Electricity | 80 (21.2%) | 113 (41.1%) |
| Fuel Oil or Kerosene | 0 (0.0%) | 0 (0.0%) |
| Coal or Coke | 0 (0.0%) | 0 (0.0%) |
| All other Fuels | 0 (0.0%) | 0 (0.0%) |
| No Fuel Used | 0 (0.0%) | 4 (1.5%) |
| Total | 377 (100.0%) | 275 (100.0%) |
Household Vehicle Usage in Milan
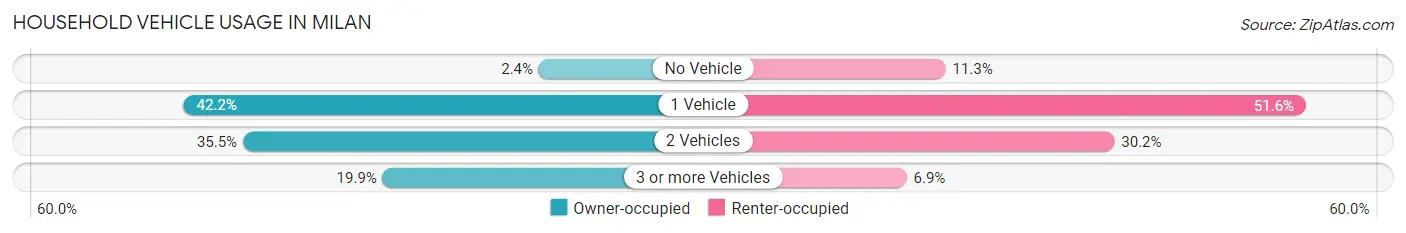
| Vehicles per Household | Owner-occupied | Renter-occupied |
| No Vehicle | 9 (2.4%) | 31 (11.3%) |
| 1 Vehicle | 159 (42.2%) | 142 (51.6%) |
| 2 Vehicles | 134 (35.5%) | 83 (30.2%) |
| 3 or more Vehicles | 75 (19.9%) | 19 (6.9%) |
| Total | 377 (100.0%) | 275 (100.0%) |
Real Estate & Mortgages in Milan
Real Estate and Mortgage Overview in Milan
| Characteristic | Without Mortgage | With Mortgage |
| Housing Units | 209 | 168 |
| Median Property Value | $83,800 | $80,000 |
| Median Household Income | $58,533 | $2 |
| Monthly Housing Costs | $309 | $0 |
| Real Estate Taxes | $567 | $10 |
Property Value by Mortgage Status in Milan
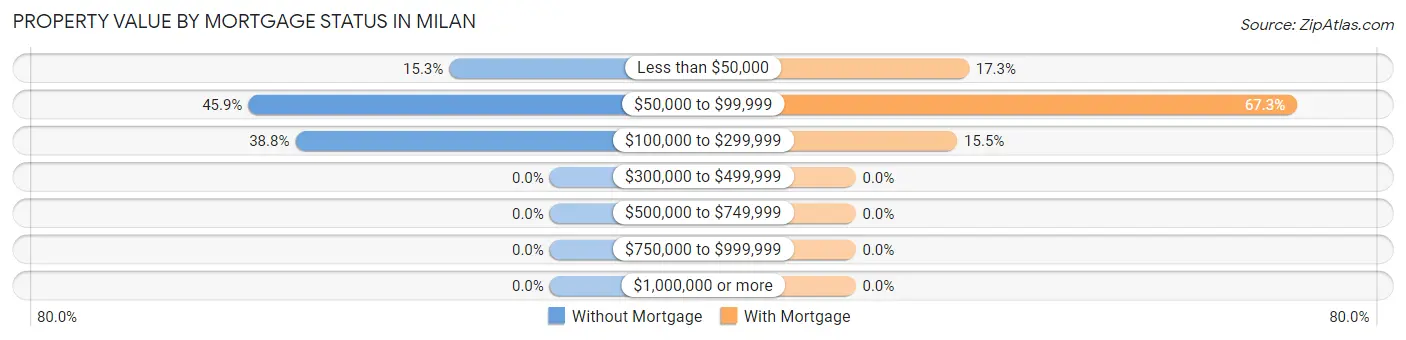
| Property Value | Without Mortgage | With Mortgage |
| Less than $50,000 | 32 (15.3%) | 29 (17.3%) |
| $50,000 to $99,999 | 96 (45.9%) | 113 (67.3%) |
| $100,000 to $299,999 | 81 (38.8%) | 26 (15.5%) |
| $300,000 to $499,999 | 0 (0.0%) | 0 (0.0%) |
| $500,000 to $749,999 | 0 (0.0%) | 0 (0.0%) |
| $750,000 to $999,999 | 0 (0.0%) | 0 (0.0%) |
| $1,000,000 or more | 0 (0.0%) | 0 (0.0%) |
| Total | 209 (100.0%) | 168 (100.0%) |
Household Income by Mortgage Status in Milan
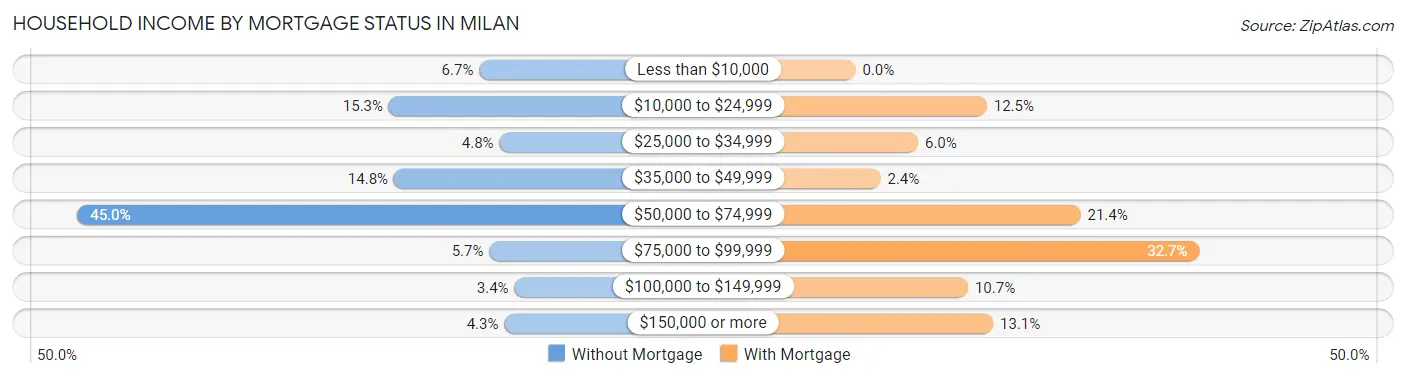
| Household Income | Without Mortgage | With Mortgage |
| Less than $10,000 | 14 (6.7%) | 0 (0.0%) |
| $10,000 to $24,999 | 32 (15.3%) | 21 (12.5%) |
| $25,000 to $34,999 | 10 (4.8%) | 10 (5.9%) |
| $35,000 to $49,999 | 31 (14.8%) | 4 (2.4%) |
| $50,000 to $74,999 | 94 (45.0%) | 36 (21.4%) |
| $75,000 to $99,999 | 12 (5.7%) | 55 (32.7%) |
| $100,000 to $149,999 | 7 (3.4%) | 18 (10.7%) |
| $150,000 or more | 9 (4.3%) | 22 (13.1%) |
| Total | 209 (100.0%) | 168 (100.0%) |
Property Value to Household Income Ratio in Milan
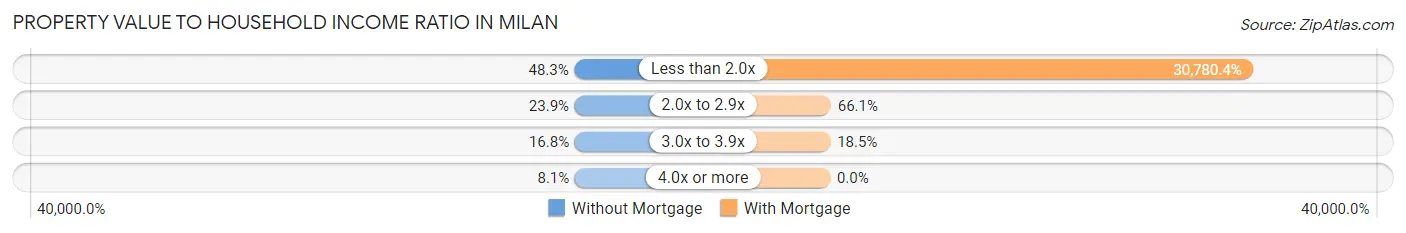
| Value-to-Income Ratio | Without Mortgage | With Mortgage |
| Less than 2.0x | 101 (48.3%) | 51,711 (30,780.4%) |
| 2.0x to 2.9x | 50 (23.9%) | 111 (66.1%) |
| 3.0x to 3.9x | 35 (16.8%) | 31 (18.4%) |
| 4.0x or more | 17 (8.1%) | 0 (0.0%) |
| Total | 209 (100.0%) | 168 (100.0%) |
Real Estate Taxes by Mortgage Status in Milan
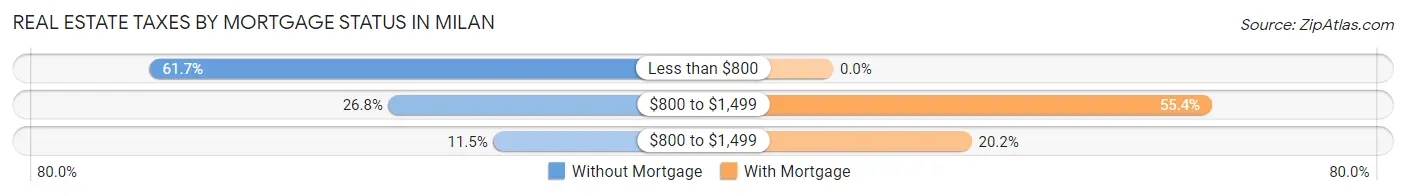
| Property Taxes | Without Mortgage | With Mortgage |
| Less than $800 | 129 (61.7%) | 0 (0.0%) |
| $800 to $1,499 | 56 (26.8%) | 93 (55.4%) |
| $800 to $1,499 | 24 (11.5%) | 34 (20.2%) |
| Total | 209 (100.0%) | 168 (100.0%) |
Health & Disability in Milan
Health Insurance Coverage by Age in Milan
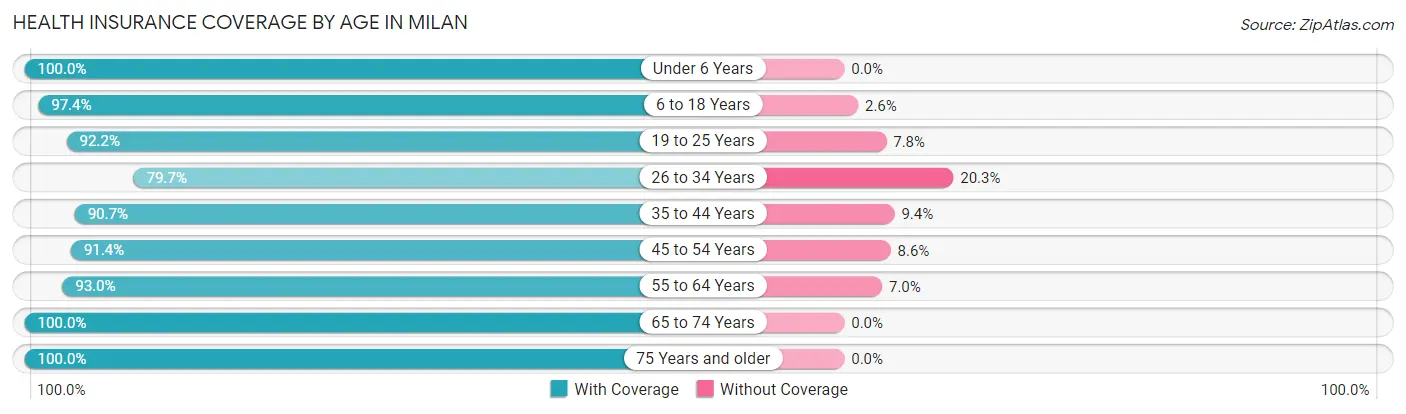
| Age Bracket | With Coverage | Without Coverage |
| Under 6 Years | 178 (100.0%) | 0 (0.0%) |
| 6 to 18 Years | 381 (97.4%) | 10 (2.6%) |
| 19 to 25 Years | 153 (92.2%) | 13 (7.8%) |
| 26 to 34 Years | 149 (79.7%) | 38 (20.3%) |
| 35 to 44 Years | 223 (90.6%) | 23 (9.3%) |
| 45 to 54 Years | 180 (91.4%) | 17 (8.6%) |
| 55 to 64 Years | 264 (93.0%) | 20 (7.0%) |
| 65 to 74 Years | 167 (100.0%) | 0 (0.0%) |
| 75 Years and older | 94 (100.0%) | 0 (0.0%) |
| Total | 1,789 (93.7%) | 121 (6.3%) |
Health Insurance Coverage by Citizenship Status in Milan
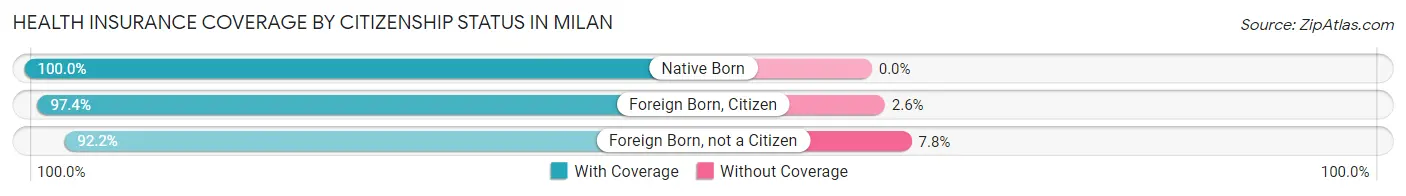
| Citizenship Status | With Coverage | Without Coverage |
| Native Born | 178 (100.0%) | 0 (0.0%) |
| Foreign Born, Citizen | 381 (97.4%) | 10 (2.6%) |
| Foreign Born, not a Citizen | 153 (92.2%) | 13 (7.8%) |
Health Insurance Coverage by Household Income in Milan
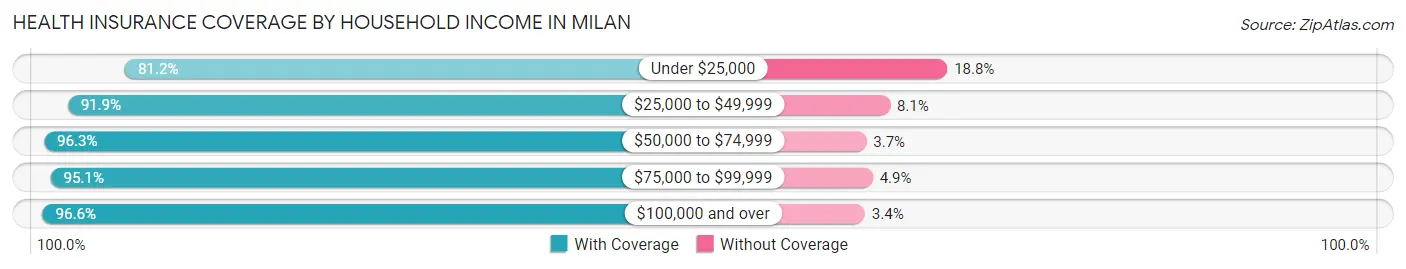
| Household Income | With Coverage | Without Coverage |
| Under $25,000 | 164 (81.2%) | 38 (18.8%) |
| $25,000 to $49,999 | 352 (91.9%) | 31 (8.1%) |
| $50,000 to $74,999 | 526 (96.3%) | 20 (3.7%) |
| $75,000 to $99,999 | 352 (95.1%) | 18 (4.9%) |
| $100,000 and over | 370 (96.6%) | 13 (3.4%) |
Public vs Private Health Insurance Coverage by Age in Milan
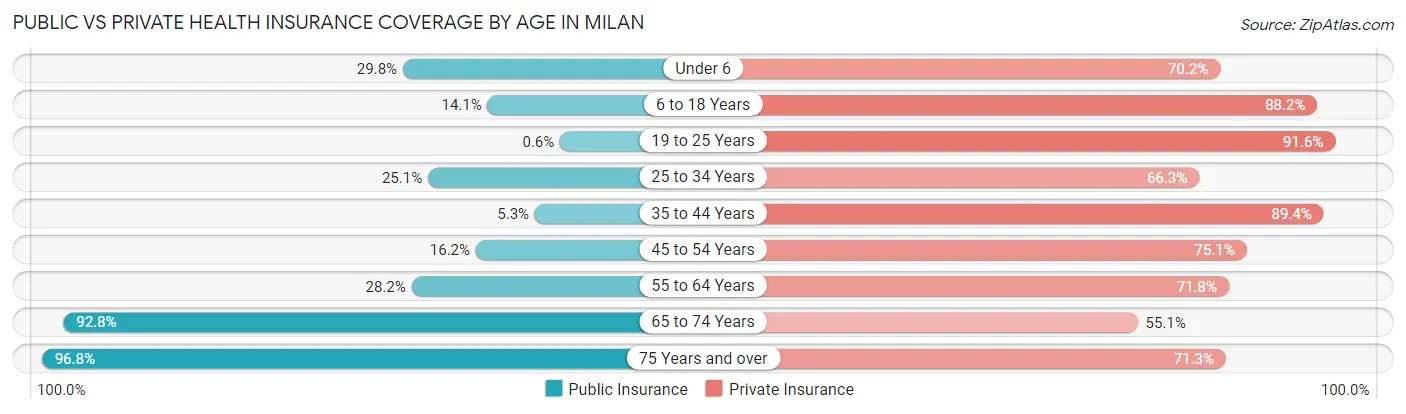
| Age Bracket | Public Insurance | Private Insurance |
| Under 6 | 53 (29.8%) | 125 (70.2%) |
| 6 to 18 Years | 55 (14.1%) | 345 (88.2%) |
| 19 to 25 Years | 1 (0.6%) | 152 (91.6%) |
| 25 to 34 Years | 47 (25.1%) | 124 (66.3%) |
| 35 to 44 Years | 13 (5.3%) | 220 (89.4%) |
| 45 to 54 Years | 32 (16.2%) | 148 (75.1%) |
| 55 to 64 Years | 80 (28.2%) | 204 (71.8%) |
| 65 to 74 Years | 155 (92.8%) | 92 (55.1%) |
| 75 Years and over | 91 (96.8%) | 67 (71.3%) |
| Total | 527 (27.6%) | 1,477 (77.3%) |
Disability Status by Sex by Age in Milan
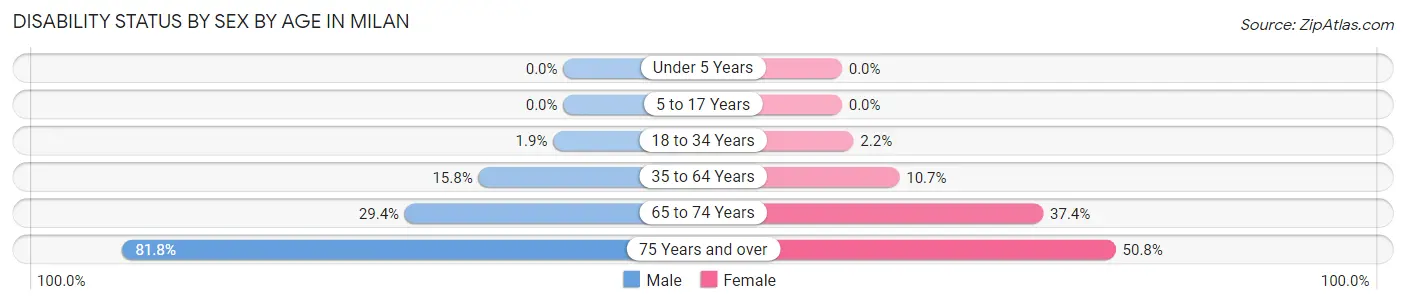
| Age Bracket | Male | Female |
| Under 5 Years | 0 (0.0%) | 0 (0.0%) |
| 5 to 17 Years | 0 (0.0%) | 0 (0.0%) |
| 18 to 34 Years | 4 (1.9%) | 5 (2.2%) |
| 35 to 64 Years | 57 (15.8%) | 39 (10.7%) |
| 65 to 74 Years | 20 (29.4%) | 37 (37.4%) |
| 75 Years and over | 27 (81.8%) | 31 (50.8%) |
Disability Class by Sex by Age in Milan
Disability Class: Hearing Difficulty
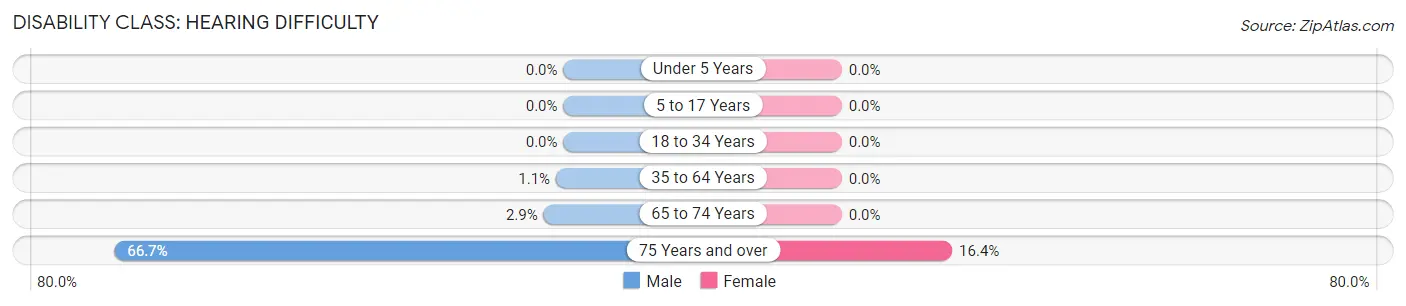
| Age Bracket | Male | Female |
| Under 5 Years | 0 (0.0%) | 0 (0.0%) |
| 5 to 17 Years | 0 (0.0%) | 0 (0.0%) |
| 18 to 34 Years | 0 (0.0%) | 0 (0.0%) |
| 35 to 64 Years | 4 (1.1%) | 0 (0.0%) |
| 65 to 74 Years | 2 (2.9%) | 0 (0.0%) |
| 75 Years and over | 22 (66.7%) | 10 (16.4%) |
Disability Class: Vision Difficulty
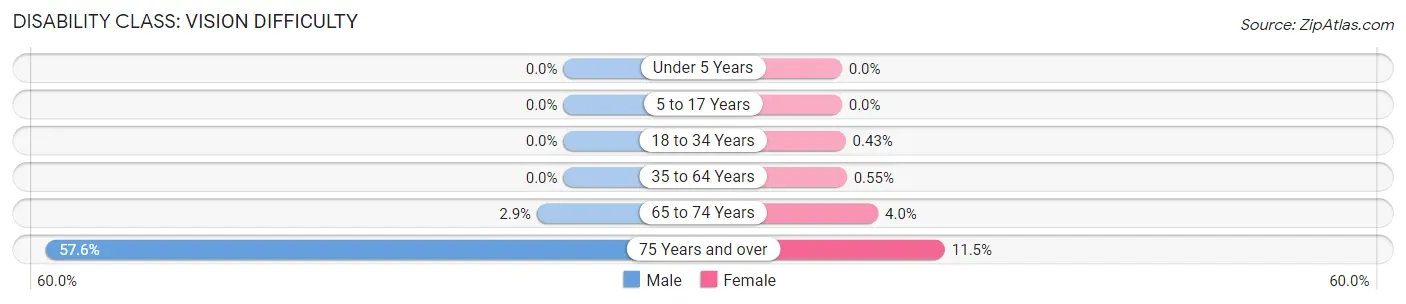
| Age Bracket | Male | Female |
| Under 5 Years | 0 (0.0%) | 0 (0.0%) |
| 5 to 17 Years | 0 (0.0%) | 0 (0.0%) |
| 18 to 34 Years | 0 (0.0%) | 1 (0.4%) |
| 35 to 64 Years | 0 (0.0%) | 2 (0.5%) |
| 65 to 74 Years | 2 (2.9%) | 4 (4.0%) |
| 75 Years and over | 19 (57.6%) | 7 (11.5%) |
Disability Class: Cognitive Difficulty
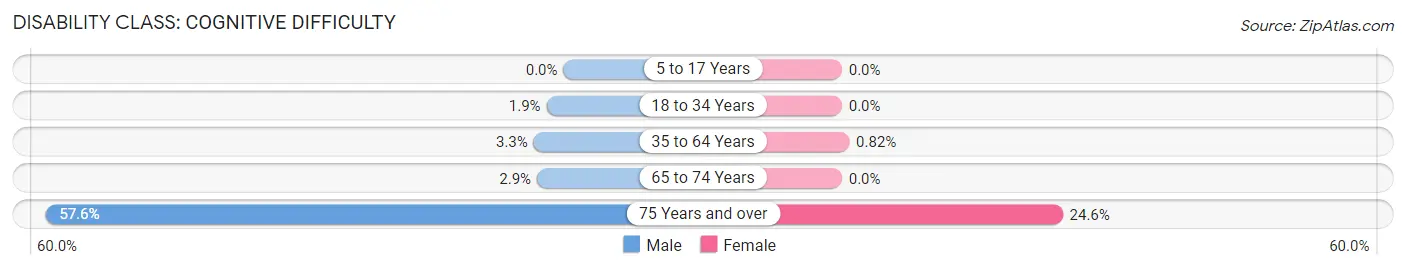
| Age Bracket | Male | Female |
| 5 to 17 Years | 0 (0.0%) | 0 (0.0%) |
| 18 to 34 Years | 4 (1.9%) | 0 (0.0%) |
| 35 to 64 Years | 12 (3.3%) | 3 (0.8%) |
| 65 to 74 Years | 2 (2.9%) | 0 (0.0%) |
| 75 Years and over | 19 (57.6%) | 15 (24.6%) |
Disability Class: Ambulatory Difficulty
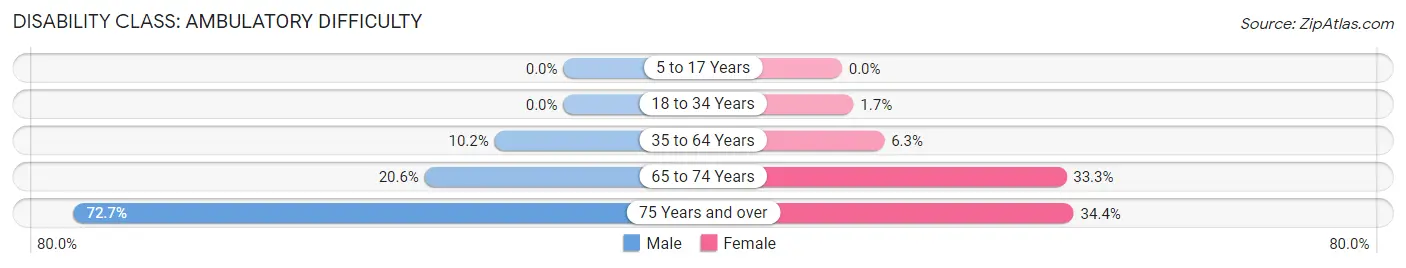
| Age Bracket | Male | Female |
| 5 to 17 Years | 0 (0.0%) | 0 (0.0%) |
| 18 to 34 Years | 0 (0.0%) | 4 (1.7%) |
| 35 to 64 Years | 37 (10.2%) | 23 (6.3%) |
| 65 to 74 Years | 14 (20.6%) | 33 (33.3%) |
| 75 Years and over | 24 (72.7%) | 21 (34.4%) |
Disability Class: Self-Care Difficulty
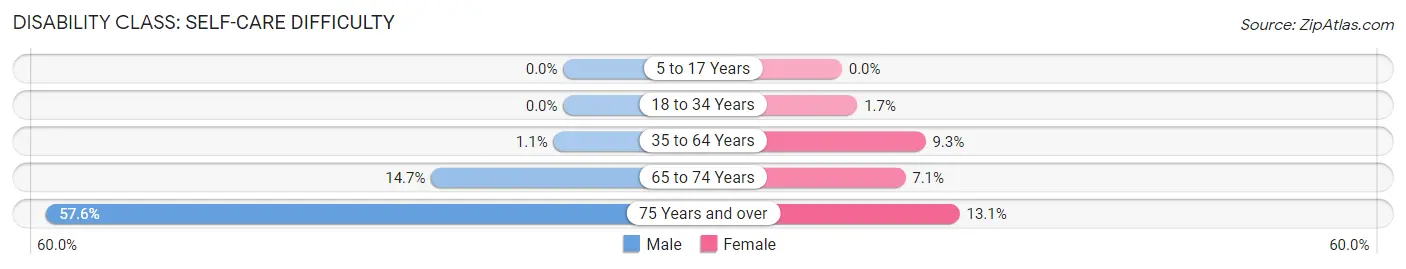
| Age Bracket | Male | Female |
| 5 to 17 Years | 0 (0.0%) | 0 (0.0%) |
| 18 to 34 Years | 0 (0.0%) | 4 (1.7%) |
| 35 to 64 Years | 4 (1.1%) | 34 (9.3%) |
| 65 to 74 Years | 10 (14.7%) | 7 (7.1%) |
| 75 Years and over | 19 (57.6%) | 8 (13.1%) |
Technology Access in Milan
Computing Device Access in Milan
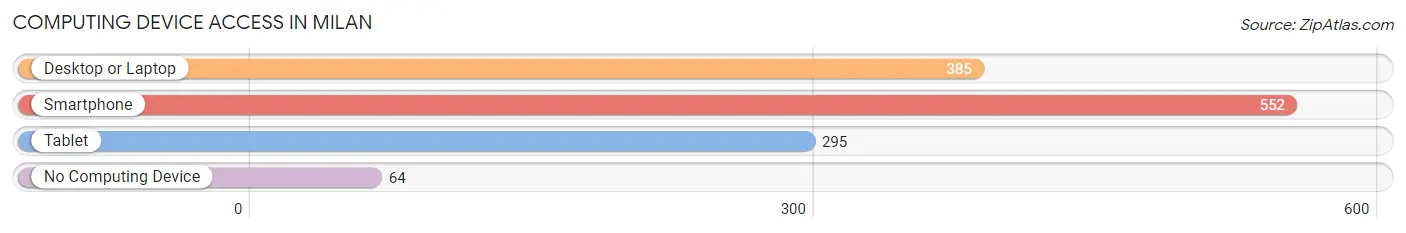
| Device Type | # Households | % Households |
| Desktop or Laptop | 385 | 59.1% |
| Smartphone | 552 | 84.7% |
| Tablet | 295 | 45.3% |
| No Computing Device | 64 | 9.8% |
| Total | 652 | 100.0% |
Internet Access in Milan
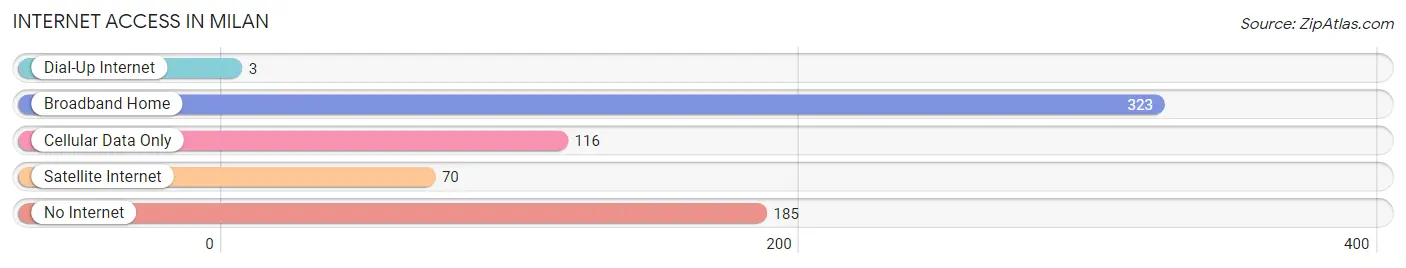
| Internet Type | # Households | % Households |
| Dial-Up Internet | 3 | 0.5% |
| Broadband Home | 323 | 49.5% |
| Cellular Data Only | 116 | 17.8% |
| Satellite Internet | 70 | 10.7% |
| No Internet | 185 | 28.4% |
| Total | 652 | 100.0% |
Milan Summary
Milan, Missouri is a small city located in the northeastern corner of the state, in Sullivan County. It is situated on the banks of the South Fabius River, and is the county seat of Sullivan County. The city has a population of approximately 2,500 people, and is part of the Kirksville Micropolitan Statistical Area.
History
The area that is now Milan was first settled in 1837 by a group of settlers from Kentucky. The town was originally known as “New Hope”, but was later renamed to Milan in 1845, after the Italian city of the same name. The town was officially incorporated in 1868.
In the late 19th century, Milan was a thriving agricultural center, with a variety of crops being grown in the area. The town was also home to several mills, including a flour mill, a saw mill, and a grist mill.
In the early 20th century, Milan experienced a period of growth and prosperity. The town was home to several businesses, including a bank, a hotel, a newspaper, and a variety of stores. The town also had a movie theater, a library, and a hospital.
Geography
Milan is located in the northeastern corner of Missouri, in Sullivan County. The city is situated on the banks of the South Fabius River, and is surrounded by rolling hills and farmland. The city has a total area of 1.7 square miles, all of which is land.
The climate in Milan is classified as humid continental, with hot, humid summers and cold, snowy winters. The average annual temperature is around 54°F, and the average annual precipitation is around 39 inches.
Economy
The economy of Milan is largely based on agriculture and manufacturing. The city is home to several manufacturing companies, including a plastics manufacturer, a metal fabricator, and a food processing plant. The city is also home to several agricultural businesses, including a dairy farm, a feed mill, and a grain elevator.
The city also has a variety of retail stores, restaurants, and other businesses. The city is home to a hospital, a library, and a movie theater.
Demographics
As of the 2010 census, the population of Milan was 2,500. The racial makeup of the city was 97.2% White, 0.8% African American, 0.4% Native American, 0.2% Asian, and 1.4% from other races. The median household income was $35,000, and the median family income was $41,000.
The city is served by the Milan R-II School District, which includes an elementary school, a middle school, and a high school. The city is also home to a branch of the North Central Missouri College.
Common Questions
What is Per Capita Income in Milan?
Per Capita income in Milan is $24,605.
What is the Median Family Income in Milan?
Median Family Income in Milan is $59,375.
What is the Median Household income in Milan?
Median Household Income in Milan is $51,842.
What is Income or Wage Gap in Milan?
Income or Wage Gap in Milan is 32.5%.
Women in Milan earn 67.5 cents for every dollar earned by a man.
What is Inequality or Gini Index in Milan?
Inequality or Gini Index in Milan is 0.42.
What is the Total Population of Milan?
Total Population of Milan is 1,989.
What is the Total Male Population of Milan?
Total Male Population of Milan is 940.
What is the Total Female Population of Milan?
Total Female Population of Milan is 1,049.
What is the Ratio of Males per 100 Females in Milan?
There are 89.61 Males per 100 Females in Milan.
What is the Ratio of Females per 100 Males in Milan?
There are 111.60 Females per 100 Males in Milan.
What is the Median Population Age in Milan?
Median Population Age in Milan is 41.3 Years.
What is the Average Family Size in Milan
Average Family Size in Milan is 4.0 People.
What is the Average Household Size in Milan
Average Household Size in Milan is 2.9 People.
How Large is the Labor Force in Milan?
There are 918 People in the Labor Forcein in Milan.
What is the Percentage of People in the Labor Force in Milan?
58.8% of People are in the Labor Force in Milan.
What is the Unemployment Rate in Milan?
Unemployment Rate in Milan is 4.4%.