Thayer, IA Map & Demographics
Thayer Map
Thayer Overview
$29,402
PER CAPITA INCOME
$68,750
AVG HOUSEHOLD INCOME
0.36
INEQUALITY / GINI INDEX
43
TOTAL POPULATION
21
MALE POPULATION
22
FEMALE POPULATION
95.45
MALES / 100 FEMALES
104.76
FEMALES / 100 MALES
31.4
MEDIAN AGE
4.8
AVG FAMILY SIZE
3.3
AVG HOUSEHOLD SIZE
17
LABOR FORCE [ PEOPLE ]
63.0%
PERCENT IN LABOR FORCE
5.9%
UNEMPLOYMENT RATE
Thayer Zip Codes
Thayer Area Codes
Income in Thayer
Income Overview in Thayer
| Characteristic | Number | Measure |
| Per Capita Income | 43 | $29,402 |
| Median Family Income | 8 | $0 |
| Mean Family Income | 8 | $112,963 |
| Median Household Income | 13 | $68,750 |
| Mean Household Income | 13 | $83,362 |
| Income Deficit | 8 | $0 |
| Wage / Income Gap (%) | 43 | 0.00% |
| Wage / Income Gap ($) | 43 | 100.00¢ per $1 |
| Gini / Inequality Index | 43 | 0.36 |
Earnings by Sex in Thayer
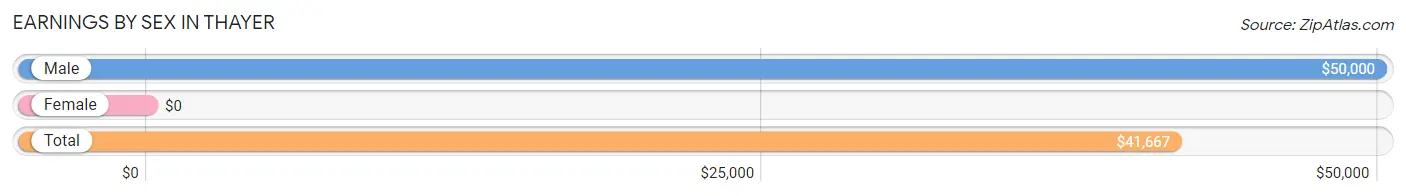
| Sex | Number | Average Earnings |
| Male | 6 (37.5%) | $50,000 |
| Female | 10 (62.5%) | $0 |
| Total | 16 (100.0%) | $41,667 |
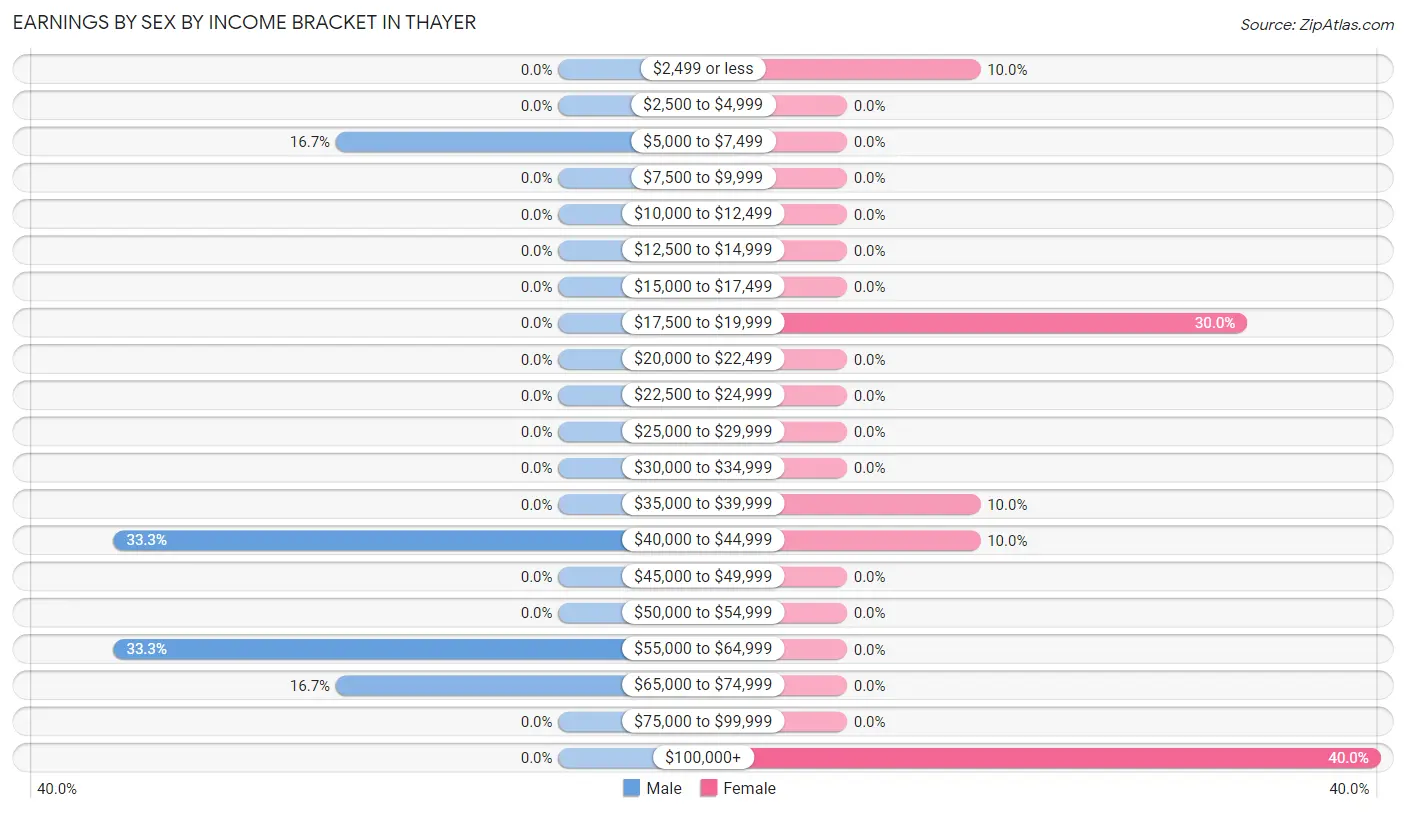
Earnings by Sex by Income Bracket in Thayer
The most common earnings brackets in Thayer are $40,000 to $44,999 for men (2 | 33.3%) and $100,000+ for women (4 | 40.0%).
| Income | Male | Female |
| $2,499 or less | 0 (0.0%) | 1 (10.0%) |
| $2,500 to $4,999 | 0 (0.0%) | 0 (0.0%) |
| $5,000 to $7,499 | 1 (16.7%) | 0 (0.0%) |
| $7,500 to $9,999 | 0 (0.0%) | 0 (0.0%) |
| $10,000 to $12,499 | 0 (0.0%) | 0 (0.0%) |
| $12,500 to $14,999 | 0 (0.0%) | 0 (0.0%) |
| $15,000 to $17,499 | 0 (0.0%) | 0 (0.0%) |
| $17,500 to $19,999 | 0 (0.0%) | 3 (30.0%) |
| $20,000 to $22,499 | 0 (0.0%) | 0 (0.0%) |
| $22,500 to $24,999 | 0 (0.0%) | 0 (0.0%) |
| $25,000 to $29,999 | 0 (0.0%) | 0 (0.0%) |
| $30,000 to $34,999 | 0 (0.0%) | 0 (0.0%) |
| $35,000 to $39,999 | 0 (0.0%) | 1 (10.0%) |
| $40,000 to $44,999 | 2 (33.3%) | 1 (10.0%) |
| $45,000 to $49,999 | 0 (0.0%) | 0 (0.0%) |
| $50,000 to $54,999 | 0 (0.0%) | 0 (0.0%) |
| $55,000 to $64,999 | 2 (33.3%) | 0 (0.0%) |
| $65,000 to $74,999 | 1 (16.7%) | 0 (0.0%) |
| $75,000 to $99,999 | 0 (0.0%) | 0 (0.0%) |
| $100,000+ | 0 (0.0%) | 4 (40.0%) |
| Total | 6 (100.0%) | 10 (100.0%) |
Earnings by Sex by Educational Attainment in Thayer
| Educational Attainment | Male Income | Female Income |
| Less than High School | - | - |
| High School Diploma | - | - |
| College or Associate's Degree | - | - |
| Bachelor's Degree | - | - |
| Graduate Degree | - | - |
| Total | $50,000 | $0 |
Family Income in Thayer
Family Income Brackets in Thayer
According to the Thayer family income data, there are 3 families falling into the $150,000 to $199,999 income range, which is the most common income bracket and makes up 37.5% of all families.
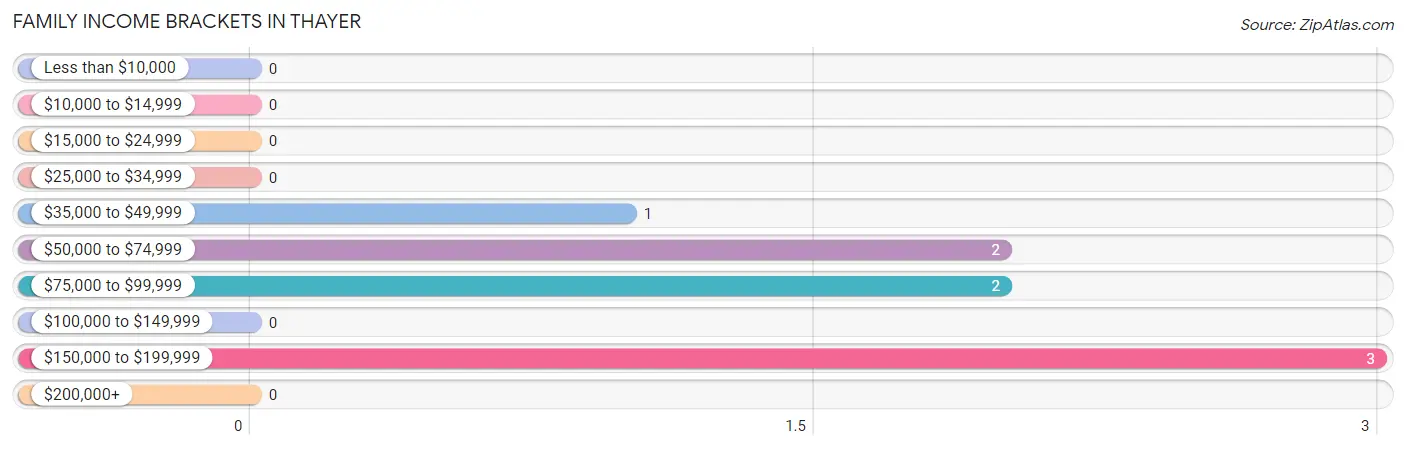
| Income Bracket | # Families | % Families |
| Less than $10,000 | 0 | 0.0% |
| $10,000 to $14,999 | 0 | 0.0% |
| $15,000 to $24,999 | 0 | 0.0% |
| $25,000 to $34,999 | 0 | 0.0% |
| $35,000 to $49,999 | 1 | 12.5% |
| $50,000 to $74,999 | 2 | 25.0% |
| $75,000 to $99,999 | 2 | 25.0% |
| $100,000 to $149,999 | 0 | 0.0% |
| $150,000 to $199,999 | 3 | 37.5% |
| $200,000+ | 0 | 0.0% |
Family Income by Famaliy Size in Thayer
| Income Bracket | # Families | Median Income |
| 2-Person Families | 3 (37.5%) | $0 |
| 3-Person Families | 3 (37.5%) | $0 |
| 4-Person Families | 0 (0.0%) | $0 |
| 5-Person Families | 0 (0.0%) | $0 |
| 6-Person Families | 1 (12.5%) | $0 |
| 7+ Person Families | 1 (12.5%) | $0 |
| Total | 8 (100.0%) | $0 |
Family Income by Number of Earners in Thayer
| Number of Earners | # Families | Median Income |
| No Earners | 0 (0.0%) | $0 |
| 1 Earner | 1 (12.5%) | $0 |
| 2 Earners | 7 (87.5%) | $0 |
| 3+ Earners | 0 (0.0%) | $0 |
| Total | 8 (100.0%) | $0 |
Household Income in Thayer
Household Income Brackets in Thayer
With 5 households falling in the category, the $35,000 to $49,999 income range is the most frequent in Thayer, accounting for 38.5% of all households.
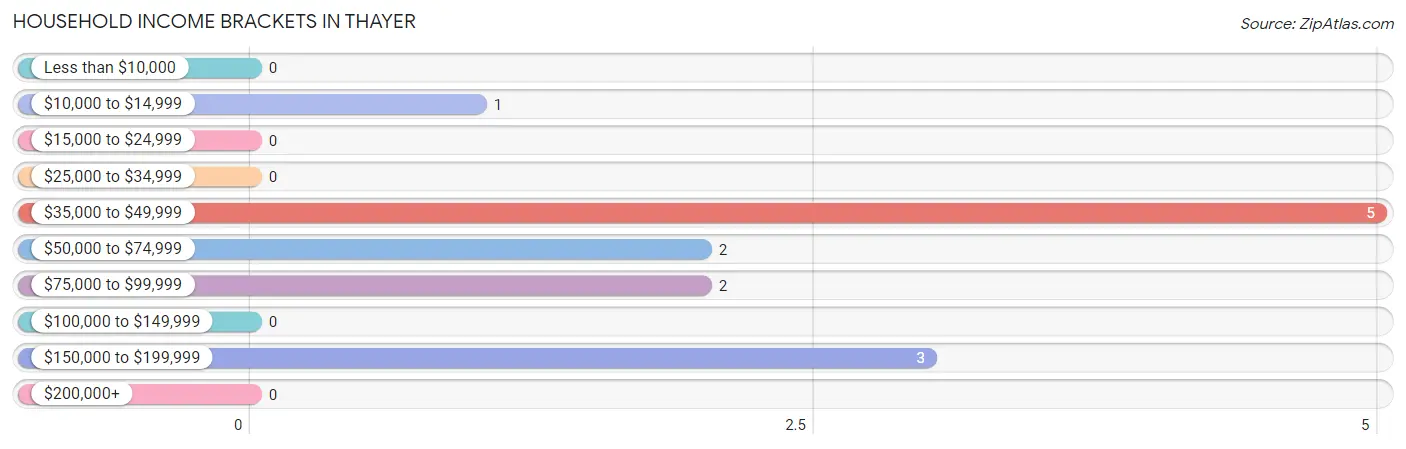
| Income Bracket | # Households | % Households |
| Less than $10,000 | 0 | 0.0% |
| $10,000 to $14,999 | 1 | 7.7% |
| $15,000 to $24,999 | 0 | 0.0% |
| $25,000 to $34,999 | 0 | 0.0% |
| $35,000 to $49,999 | 5 | 38.5% |
| $50,000 to $74,999 | 2 | 15.4% |
| $75,000 to $99,999 | 2 | 15.4% |
| $100,000 to $149,999 | 0 | 0.0% |
| $150,000 to $199,999 | 3 | 23.1% |
| $200,000+ | 0 | 0.0% |
Household Income by Householder Age in Thayer
| Income Bracket | # Households | Median Income |
| 15 to 24 Years | 0 (0.0%) | $0 |
| 25 to 44 Years | 1 (7.7%) | $0 |
| 45 to 64 Years | 7 (53.8%) | $0 |
| 65+ Years | 5 (38.5%) | $0 |
| Total | 13 (100.0%) | $68,750 |
Poverty in Thayer
Income Below Poverty by Sex and Age in Thayer
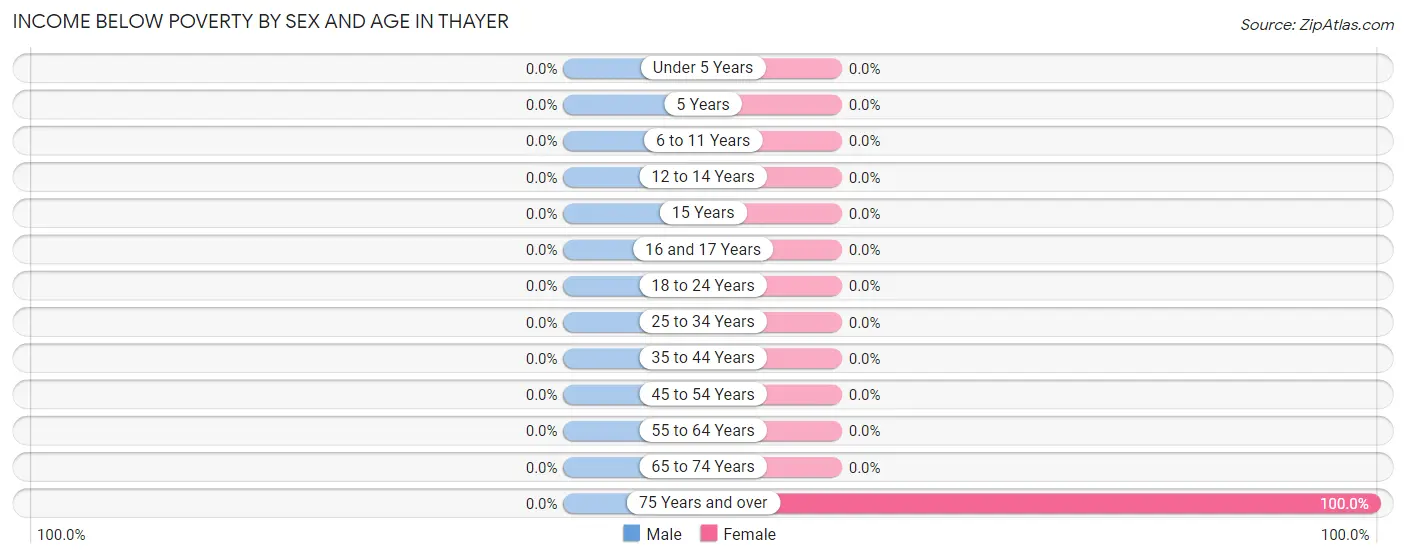
| Age Bracket | Male | Female |
| Under 5 Years | 0 (0.0%) | 0 (0.0%) |
| 5 Years | 0 (0.0%) | 0 (0.0%) |
| 6 to 11 Years | 0 (0.0%) | 0 (0.0%) |
| 12 to 14 Years | 0 (0.0%) | 0 (0.0%) |
| 15 Years | 0 (0.0%) | 0 (0.0%) |
| 16 and 17 Years | 0 (0.0%) | 0 (0.0%) |
| 18 to 24 Years | 0 (0.0%) | 0 (0.0%) |
| 25 to 34 Years | 0 (0.0%) | 0 (0.0%) |
| 35 to 44 Years | 0 (0.0%) | 0 (0.0%) |
| 45 to 54 Years | 0 (0.0%) | 0 (0.0%) |
| 55 to 64 Years | 0 (0.0%) | 0 (0.0%) |
| 65 to 74 Years | 0 (0.0%) | 0 (0.0%) |
| 75 Years and over | 0 (0.0%) | 1 (100.0%) |
| Total | 0 (0.0%) | 1 (4.5%) |
Income Above Poverty by Sex and Age in Thayer
According to the poverty statistics in Thayer, males aged under 5 years and females aged under 5 years are the age groups that are most secure financially, with 100.0% of males and 100.0% of females in these age groups living above the poverty line.
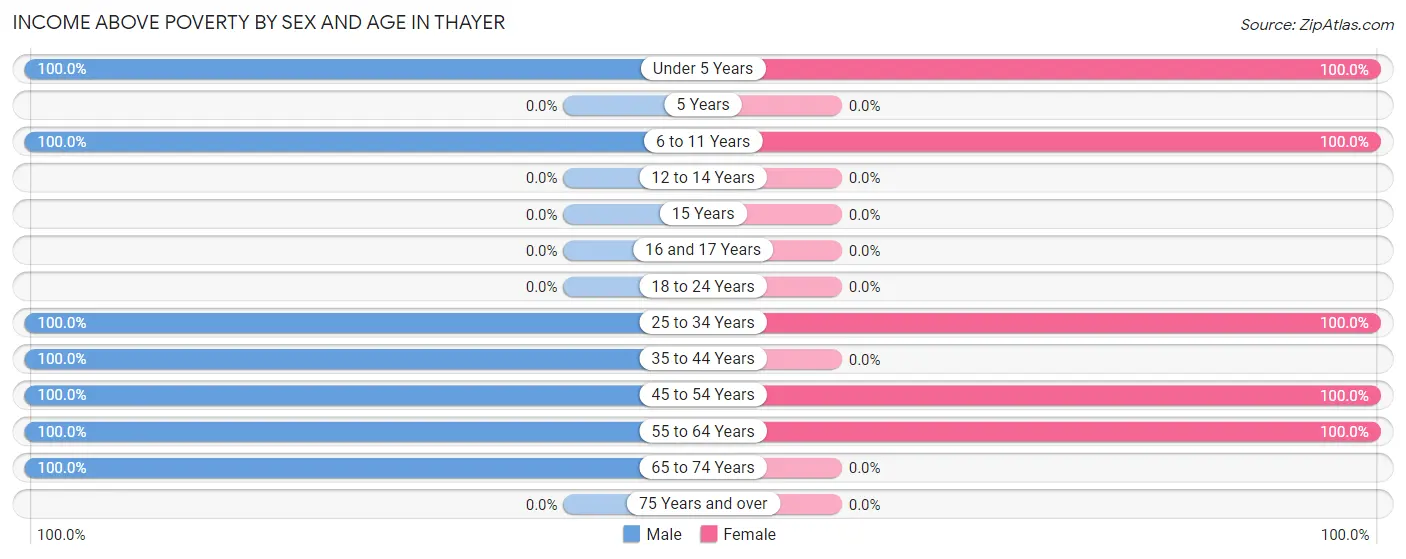
| Age Bracket | Male | Female |
| Under 5 Years | 4 (100.0%) | 4 (100.0%) |
| 5 Years | 0 (0.0%) | 0 (0.0%) |
| 6 to 11 Years | 2 (100.0%) | 6 (100.0%) |
| 12 to 14 Years | 0 (0.0%) | 0 (0.0%) |
| 15 Years | 0 (0.0%) | 0 (0.0%) |
| 16 and 17 Years | 0 (0.0%) | 0 (0.0%) |
| 18 to 24 Years | 0 (0.0%) | 0 (0.0%) |
| 25 to 34 Years | 2 (100.0%) | 6 (100.0%) |
| 35 to 44 Years | 2 (100.0%) | 0 (0.0%) |
| 45 to 54 Years | 4 (100.0%) | 2 (100.0%) |
| 55 to 64 Years | 3 (100.0%) | 3 (100.0%) |
| 65 to 74 Years | 4 (100.0%) | 0 (0.0%) |
| 75 Years and over | 0 (0.0%) | 0 (0.0%) |
| Total | 21 (100.0%) | 21 (95.5%) |
Income Below Poverty Among Married-Couple Families in Thayer
| Children | Above Poverty | Below Poverty |
| No Children | 3 (100.0%) | 0 (0.0%) |
| 1 or 2 Children | 0 (0.0%) | 0 (0.0%) |
| 3 or 4 Children | 1 (100.0%) | 0 (0.0%) |
| 5 or more Children | 0 (0.0%) | 0 (0.0%) |
| Total | 4 (100.0%) | 0 (0.0%) |
Income Below Poverty Among Single-Parent Households in Thayer
| Children | Single Father | Single Mother |
| No Children | 0 (0.0%) | 0 (0.0%) |
| 1 or 2 Children | 0 (0.0%) | 0 (0.0%) |
| 3 or 4 Children | 0 (0.0%) | 0 (0.0%) |
| 5 or more Children | 0 (0.0%) | 0 (0.0%) |
| Total | 0 (0.0%) | 0 (0.0%) |
Income Below Poverty Among Married-Couple vs Single-Parent Households in Thayer
| Children | Married-Couple Families | Single-Parent Households |
| No Children | 0 (0.0%) | 0 (0.0%) |
| 1 or 2 Children | 0 (0.0%) | 0 (0.0%) |
| 3 or 4 Children | 0 (0.0%) | 0 (0.0%) |
| 5 or more Children | 0 (0.0%) | 0 (0.0%) |
| Total | 0 (0.0%) | 0 (0.0%) |
Race in Thayer
The most populous races in Thayer are White / Caucasian (32 | 74.4%), and Two or more Races (11 | 25.6%).
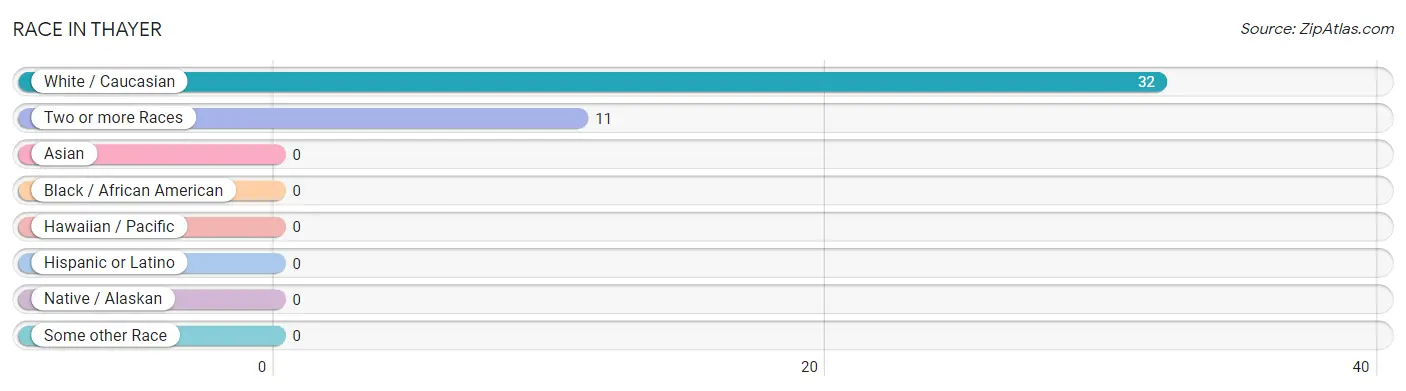
| Race | # Population | % Population |
| Asian | 0 | 0.0% |
| Black / African American | 0 | 0.0% |
| Hawaiian / Pacific | 0 | 0.0% |
| Hispanic or Latino | 0 | 0.0% |
| Native / Alaskan | 0 | 0.0% |
| White / Caucasian | 32 | 74.4% |
| Two or more Races | 11 | 25.6% |
| Some other Race | 0 | 0.0% |
| Total | 43 | 100.0% |
Ancestry in Thayer
The most populous ancestries reported in Thayer are Dutch (4 | 9.3%), German (4 | 9.3%), and American (2 | 4.6%), together accounting for 23.2% of all Thayer residents.
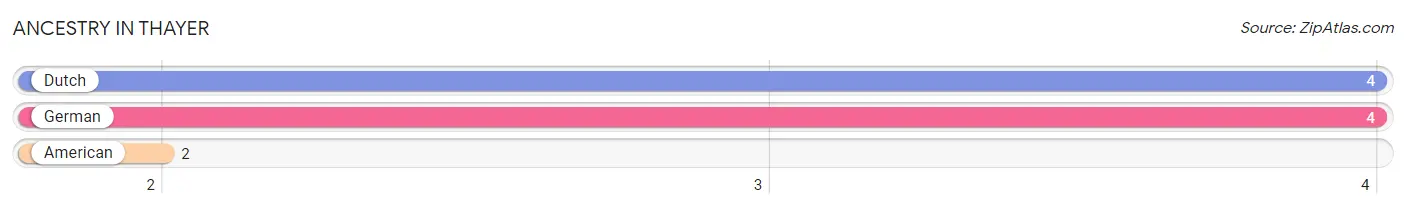
| Ancestry | # Population | % Population |
| American | 2 | 4.6% |
| Dutch | 4 | 9.3% |
| German | 4 | 9.3% | View All 3 Rows |
Immigrants in Thayer

| Immigration Origin | # Population | % Population | View All 0 Rows |
Sex and Age in Thayer
Sex and Age in Thayer
The most populous age groups in Thayer are Under 5 Years (4 | 19.1%) for men and Under 5 Years (4 | 18.2%) for women.
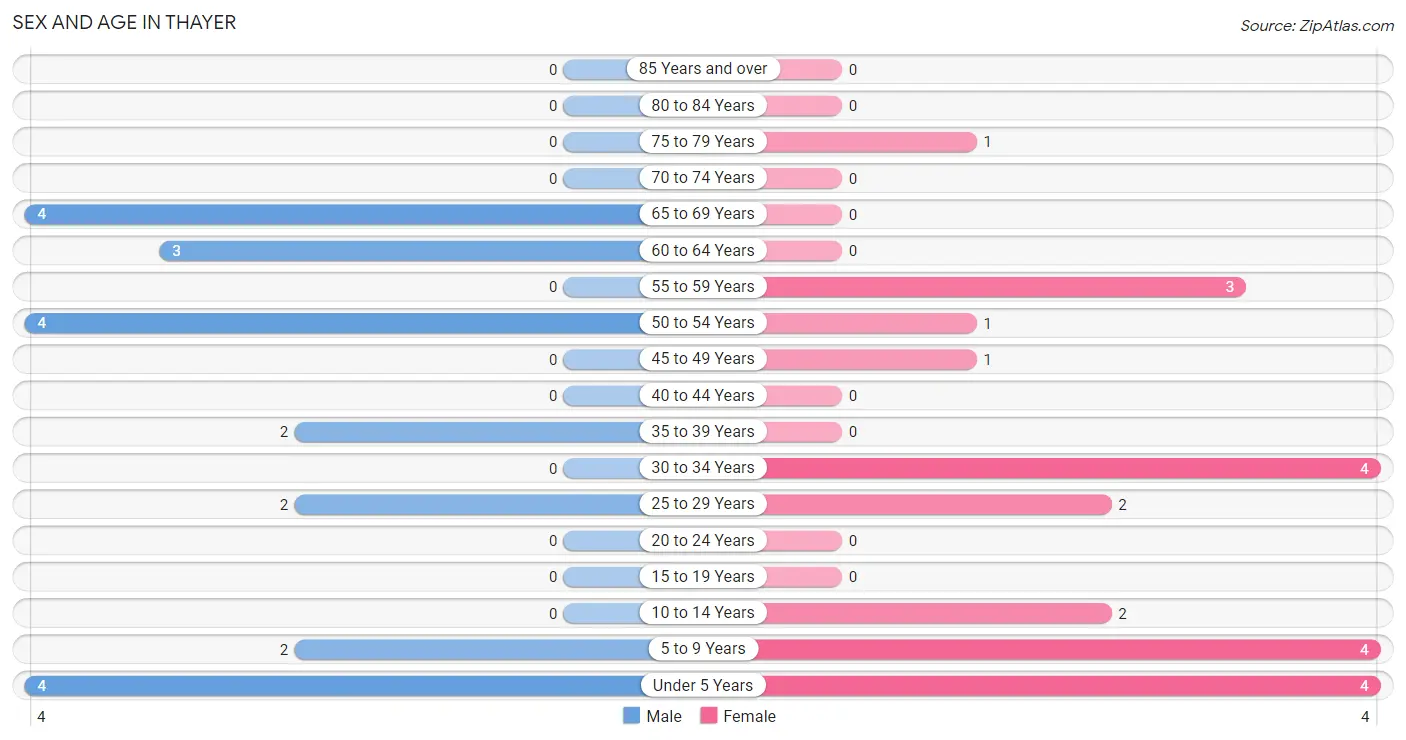
| Age Bracket | Male | Female |
| Under 5 Years | 4 (19.1%) | 4 (18.2%) |
| 5 to 9 Years | 2 (9.5%) | 4 (18.2%) |
| 10 to 14 Years | 0 (0.0%) | 2 (9.1%) |
| 15 to 19 Years | 0 (0.0%) | 0 (0.0%) |
| 20 to 24 Years | 0 (0.0%) | 0 (0.0%) |
| 25 to 29 Years | 2 (9.5%) | 2 (9.1%) |
| 30 to 34 Years | 0 (0.0%) | 4 (18.2%) |
| 35 to 39 Years | 2 (9.5%) | 0 (0.0%) |
| 40 to 44 Years | 0 (0.0%) | 0 (0.0%) |
| 45 to 49 Years | 0 (0.0%) | 1 (4.5%) |
| 50 to 54 Years | 4 (19.1%) | 1 (4.5%) |
| 55 to 59 Years | 0 (0.0%) | 3 (13.6%) |
| 60 to 64 Years | 3 (14.3%) | 0 (0.0%) |
| 65 to 69 Years | 4 (19.1%) | 0 (0.0%) |
| 70 to 74 Years | 0 (0.0%) | 0 (0.0%) |
| 75 to 79 Years | 0 (0.0%) | 1 (4.5%) |
| 80 to 84 Years | 0 (0.0%) | 0 (0.0%) |
| 85 Years and over | 0 (0.0%) | 0 (0.0%) |
| Total | 21 (100.0%) | 22 (100.0%) |
Families and Households in Thayer
Median Family Size in Thayer
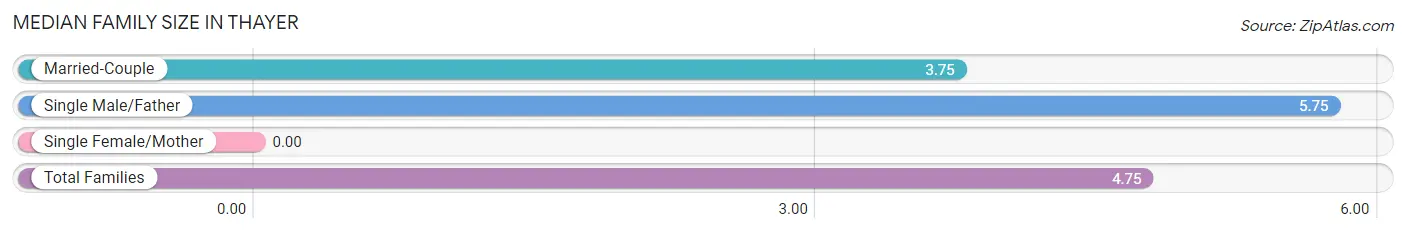
| Family Type | # Families | Family Size |
| Married-Couple | 4 (50.0%) | 3.75 |
| Single Male/Father | 4 (50.0%) | 5.75 |
| Single Female/Mother | 0 (0.0%) | - |
| Total Families | 8 (100.0%) | 4.75 |
Median Household Size in Thayer
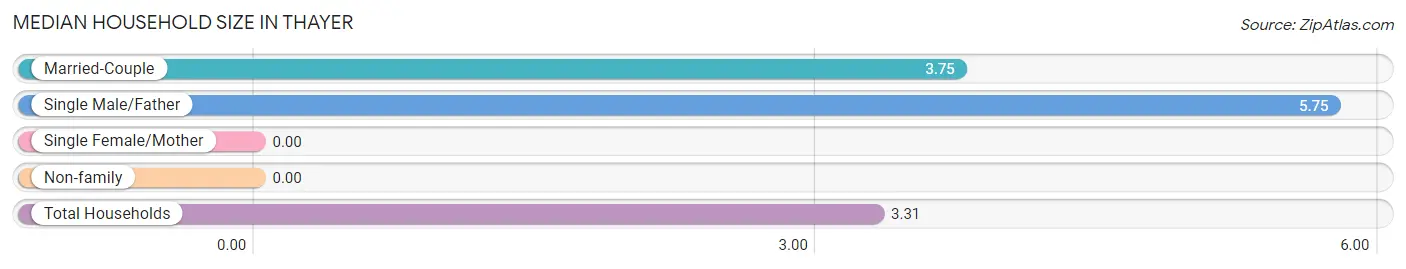
| Household Type | # Households | Household Size |
| Married-Couple | 4 (30.8%) | 3.75 |
| Single Male/Father | 4 (30.8%) | 5.75 |
| Single Female/Mother | 0 (0.0%) | - |
| Non-family | 5 (38.5%) | - |
| Total Households | 13 (100.0%) | 3.31 |
Household Size by Marriage Status in Thayer
Out of a total of 13 households in Thayer, 8 (61.5%) are family households, while 5 (38.5%) are nonfamily households. The most numerous type of family households are 2-person households, comprising 3, and the most common type of nonfamily households are 1-person households, comprising 5.
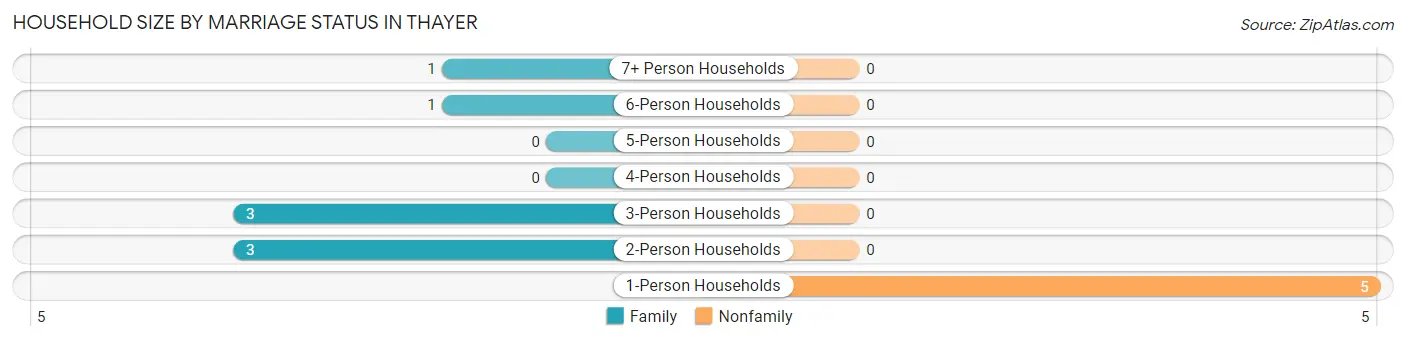
| Household Size | Family Households | Nonfamily Households |
| 1-Person Households | - | 5 (38.5%) |
| 2-Person Households | 3 (23.1%) | 0 (0.0%) |
| 3-Person Households | 3 (23.1%) | 0 (0.0%) |
| 4-Person Households | 0 (0.0%) | 0 (0.0%) |
| 5-Person Households | 0 (0.0%) | 0 (0.0%) |
| 6-Person Households | 1 (7.7%) | 0 (0.0%) |
| 7+ Person Households | 1 (7.7%) | 0 (0.0%) |
| Total | 8 (61.5%) | 5 (38.5%) |
Female Fertility in Thayer
Fertility by Age in Thayer
| Age Bracket | Women with Births | Births / 1,000 Women |
| 15 to 19 years | 0 (0.0%) | 0.0 |
| 20 to 34 years | 0 (0.0%) | 0.0 |
| 35 to 50 years | 0 (0.0%) | 0.0 |
| Total | 0 (0.0%) | 0.0 |
Fertility by Age by Marriage Status in Thayer
| Age Bracket | Married | Unmarried |
| 15 to 19 years | 0 (0.0%) | 0 (0.0%) |
| 20 to 34 years | 0 (0.0%) | 0 (0.0%) |
| 35 to 50 years | 0 (0.0%) | 0 (0.0%) |
| Total | 0 (0.0%) | 0 (0.0%) |
Fertility by Education in Thayer
| Educational Attainment | Women with Births | Births / 1,000 Women |
| Less than High School | 0 (0.0%) | 0.0 |
| High School Diploma | 0 (0.0%) | 0.0 |
| College or Associate's Degree | 0 (0.0%) | 0.0 |
| Bachelor's Degree | 0 (0.0%) | 0.0 |
| Graduate Degree | 0 (0.0%) | 0.0 |
| Total | 0 (0.0%) | 0.0 |
Fertility by Education by Marriage Status in Thayer
| Educational Attainment | Married | Unmarried |
| Less than High School | 0 (0.0%) | 0 (0.0%) |
| High School Diploma | 0 (0.0%) | 0 (0.0%) |
| College or Associate's Degree | 0 (0.0%) | 0 (0.0%) |
| Bachelor's Degree | 0 (0.0%) | 0 (0.0%) |
| Graduate Degree | 0 (0.0%) | 0 (0.0%) |
| Total | 0 (0.0%) | 0 (0.0%) |
Employment Characteristics in Thayer
Employment by Class of Employer in Thayer
Among the 16 employed individuals in Thayer, , and private company employees (16 | 100.0%) make up the most common classes of employment.
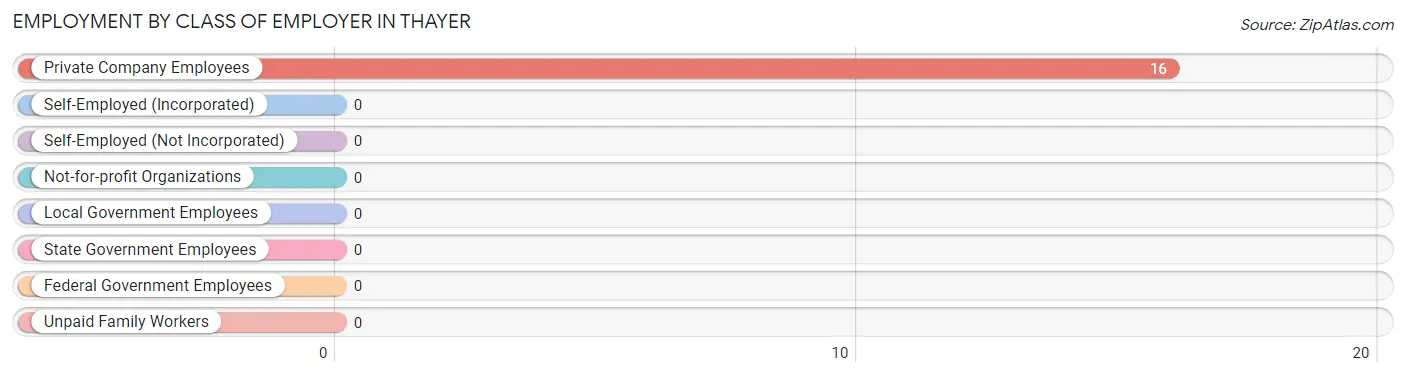
| Employer Class | # Employees | % Employees |
| Private Company Employees | 16 | 100.0% |
| Self-Employed (Incorporated) | 0 | 0.0% |
| Self-Employed (Not Incorporated) | 0 | 0.0% |
| Not-for-profit Organizations | 0 | 0.0% |
| Local Government Employees | 0 | 0.0% |
| State Government Employees | 0 | 0.0% |
| Federal Government Employees | 0 | 0.0% |
| Unpaid Family Workers | 0 | 0.0% |
| Total | 16 | 100.0% |
Employment Status by Age in Thayer
According to the labor force statistics for Thayer, out of the total population over 16 years of age (27), 63.0% or 17 individuals are in the labor force, with 5.9% or 1 of them unemployed. The age group with the highest labor force participation rate is 30 to 34 years, with 100.0% or 4 individuals in the labor force. Within the labor force, the 25 to 29 years age range has the highest percentage of unemployed individuals, with 50.0% or 1 of them being unemployed.
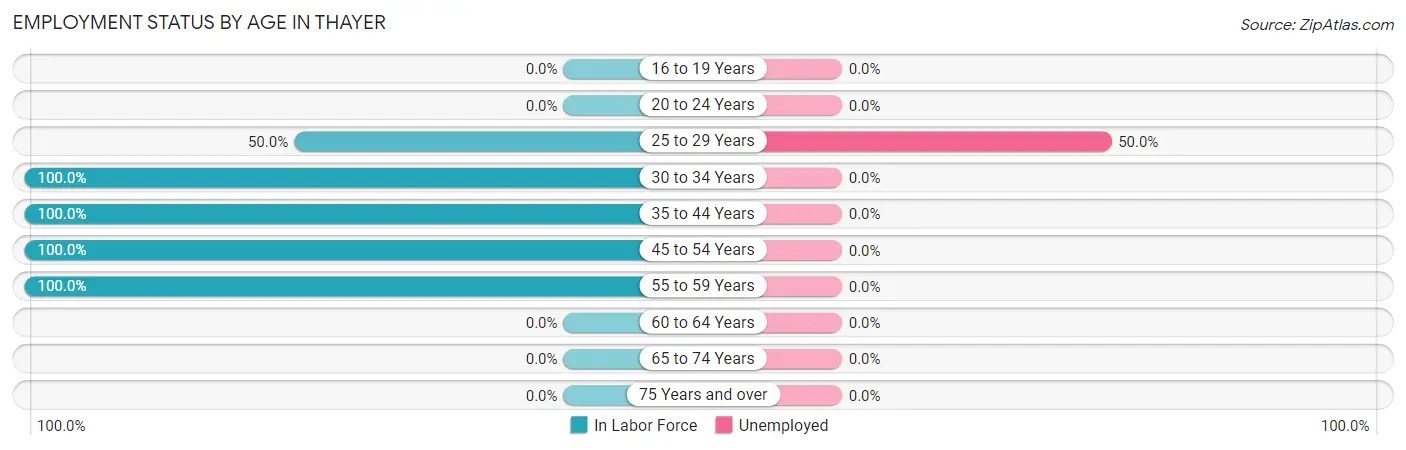
| Age Bracket | In Labor Force | Unemployed |
| 16 to 19 Years | 0 (0.0%) | 0 (0.0%) |
| 20 to 24 Years | 0 (0.0%) | 0 (0.0%) |
| 25 to 29 Years | 2 (50.0%) | 1 (50.0%) |
| 30 to 34 Years | 4 (100.0%) | 0 (0.0%) |
| 35 to 44 Years | 2 (100.0%) | 0 (0.0%) |
| 45 to 54 Years | 6 (100.0%) | 0 (0.0%) |
| 55 to 59 Years | 3 (100.0%) | 0 (0.0%) |
| 60 to 64 Years | 0 (0.0%) | 0 (0.0%) |
| 65 to 74 Years | 0 (0.0%) | 0 (0.0%) |
| 75 Years and over | 0 (0.0%) | 0 (0.0%) |
| Total | 17 (63.0%) | 1 (5.9%) |
Employment Status by Educational Attainment in Thayer
According to labor force statistics for Thayer, 77.3% of individuals (17) out of the total population between 25 and 64 years of age (22) are in the labor force, with 5.9% or 1 of them being unemployed. The group with the highest labor force participation rate are those with the educational attainment of college / associate degree, with 100.0% or 7 individuals in the labor force. Within the labor force, individuals with college / associate degree education have the highest percentage of unemployment, with 14.3% or 1 of them being unemployed.
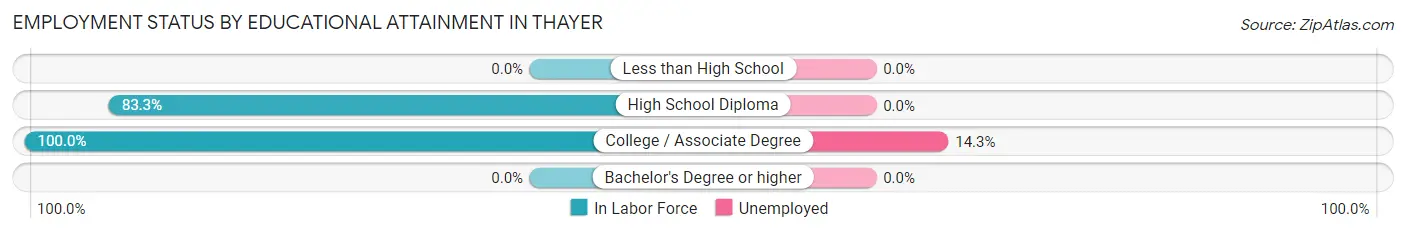
| Educational Attainment | In Labor Force | Unemployed |
| Less than High School | 0 (0.0%) | 0 (0.0%) |
| High School Diploma | 10 (83.3%) | 0 (0.0%) |
| College / Associate Degree | 7 (100.0%) | 1 (14.3%) |
| Bachelor's Degree or higher | 0 (0.0%) | 0 (0.0%) |
| Total | 17 (77.3%) | 1 (5.9%) |
Employment Occupations by Sex in Thayer
Management, Business, Science and Arts Occupations
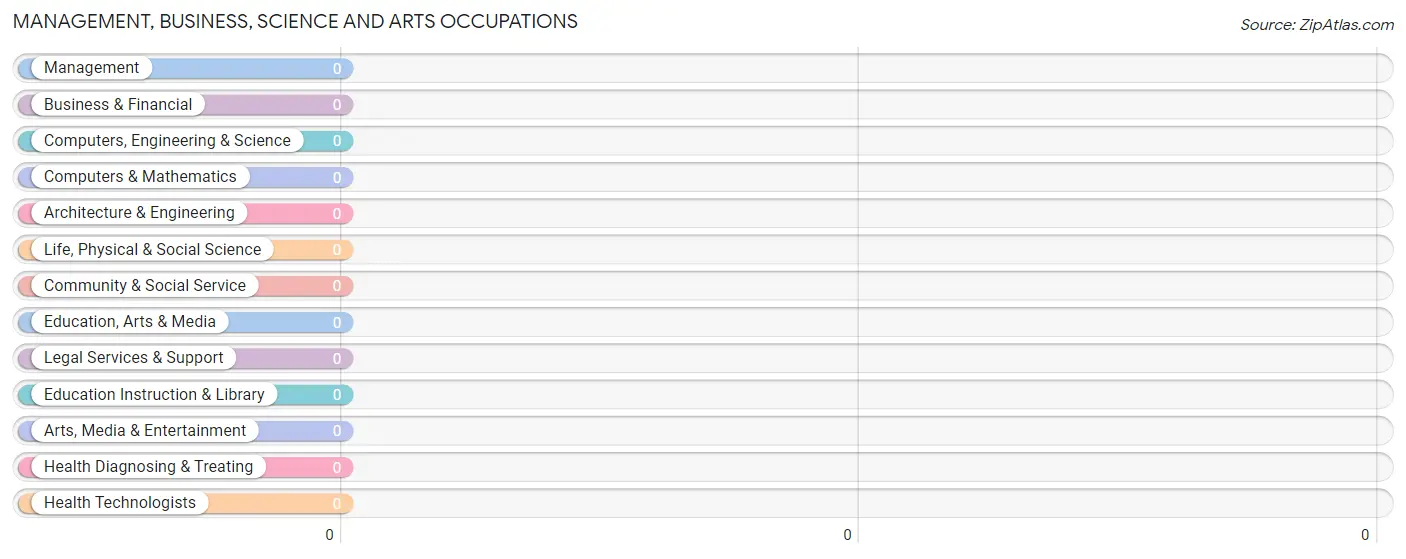
Management, Business, Science and Arts Occupations by Sex
| Occupation | Male | Female |
| Management | 0 (0.0%) | 0 (0.0%) |
| Business & Financial | 0 (0.0%) | 0 (0.0%) |
| Computers, Engineering & Science | 0 (0.0%) | 0 (0.0%) |
| Computers & Mathematics | 0 (0.0%) | 0 (0.0%) |
| Architecture & Engineering | 0 (0.0%) | 0 (0.0%) |
| Life, Physical & Social Science | 0 (0.0%) | 0 (0.0%) |
| Community & Social Service | 0 (0.0%) | 0 (0.0%) |
| Education, Arts & Media | 0 (0.0%) | 0 (0.0%) |
| Legal Services & Support | 0 (0.0%) | 0 (0.0%) |
| Education Instruction & Library | 0 (0.0%) | 0 (0.0%) |
| Arts, Media & Entertainment | 0 (0.0%) | 0 (0.0%) |
| Health Diagnosing & Treating | 0 (0.0%) | 0 (0.0%) |
| Health Technologists | 0 (0.0%) | 0 (0.0%) |
| Total (Category) | 0 (0.0%) | 0 (0.0%) |
| Total (Overall) | 6 (37.5%) | 10 (62.5%) |
Services Occupations
The most common Services occupations in Thayer are , and Cleaning & Maintenance (1 | 6.2%).
Services Occupations by Sex
| Occupation | Male | Female |
| Healthcare Support | 0 (0.0%) | 0 (0.0%) |
| Security & Protection | 0 (0.0%) | 0 (0.0%) |
| Firefighting & Prevention | 0 (0.0%) | 0 (0.0%) |
| Law Enforcement | 0 (0.0%) | 0 (0.0%) |
| Food Preparation & Serving | 0 (0.0%) | 0 (0.0%) |
| Cleaning & Maintenance | 0 (0.0%) | 1 (100.0%) |
| Personal Care & Service | 0 (0.0%) | 0 (0.0%) |
| Total (Category) | 0 (0.0%) | 1 (100.0%) |
| Total (Overall) | 6 (37.5%) | 10 (62.5%) |
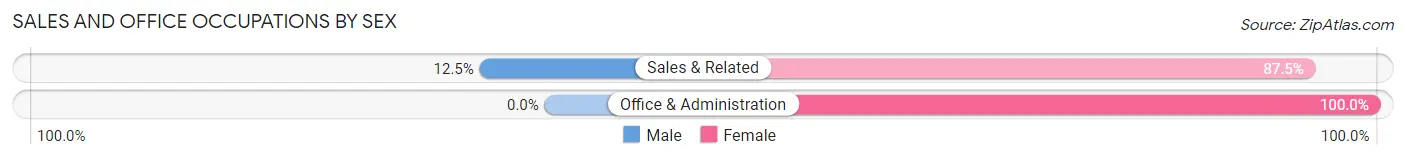
Sales and Office Occupations
The most common Sales and Office occupations in Thayer are Sales & Related (8 | 50.0%), and Office & Administration (2 | 12.5%).
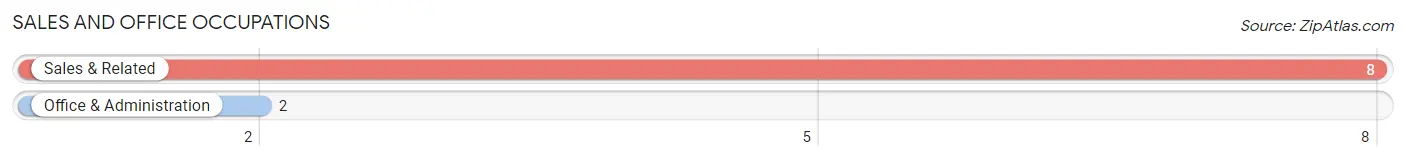
Sales and Office Occupations by Sex
| Occupation | Male | Female |
| Sales & Related | 1 (12.5%) | 7 (87.5%) |
| Office & Administration | 0 (0.0%) | 2 (100.0%) |
| Total (Category) | 1 (10.0%) | 9 (90.0%) |
| Total (Overall) | 6 (37.5%) | 10 (62.5%) |
Natural Resources, Construction and Maintenance Occupations
The most common Natural Resources, Construction and Maintenance occupations in Thayer are , and Construction & Extraction (1 | 6.2%).
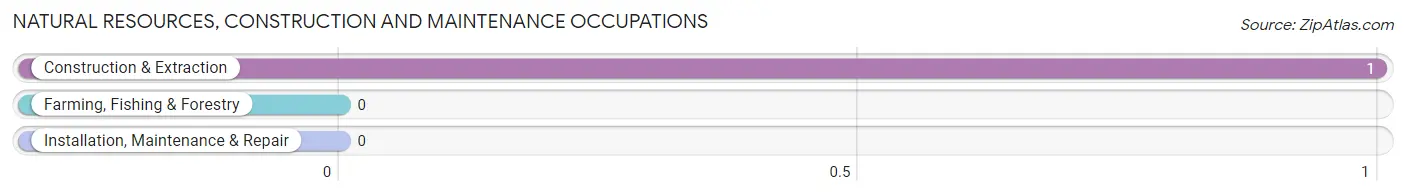
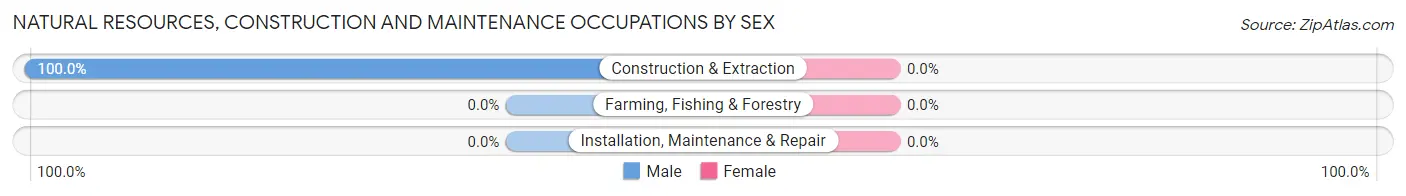
Natural Resources, Construction and Maintenance Occupations by Sex
| Occupation | Male | Female |
| Farming, Fishing & Forestry | 0 (0.0%) | 0 (0.0%) |
| Construction & Extraction | 1 (100.0%) | 0 (0.0%) |
| Installation, Maintenance & Repair | 0 (0.0%) | 0 (0.0%) |
| Total (Category) | 1 (100.0%) | 0 (0.0%) |
| Total (Overall) | 6 (37.5%) | 10 (62.5%) |
Production, Transportation and Moving Occupations
The most common Production, Transportation and Moving occupations in Thayer are Transportation (2 | 12.5%), and Material Moving (2 | 12.5%).
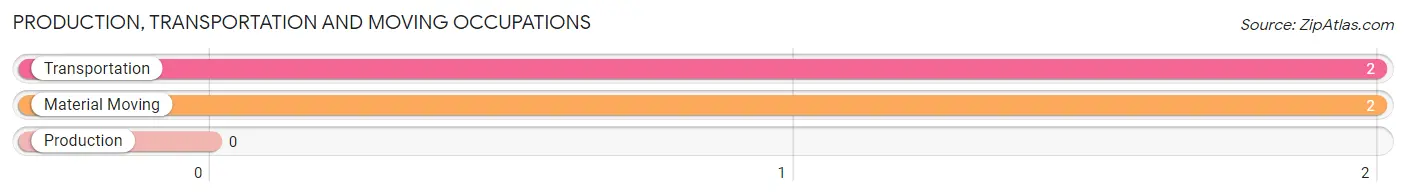
Production, Transportation and Moving Occupations by Sex
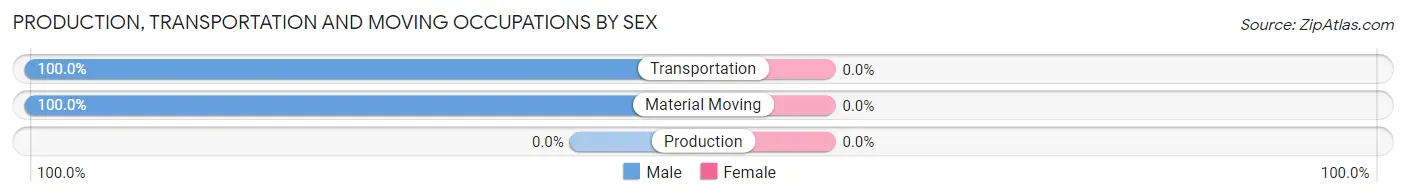
| Occupation | Male | Female |
| Production | 0 (0.0%) | 0 (0.0%) |
| Transportation | 2 (100.0%) | 0 (0.0%) |
| Material Moving | 2 (100.0%) | 0 (0.0%) |
| Total (Category) | 4 (100.0%) | 0 (0.0%) |
| Total (Overall) | 6 (37.5%) | 10 (62.5%) |
Employment Industries by Sex in Thayer
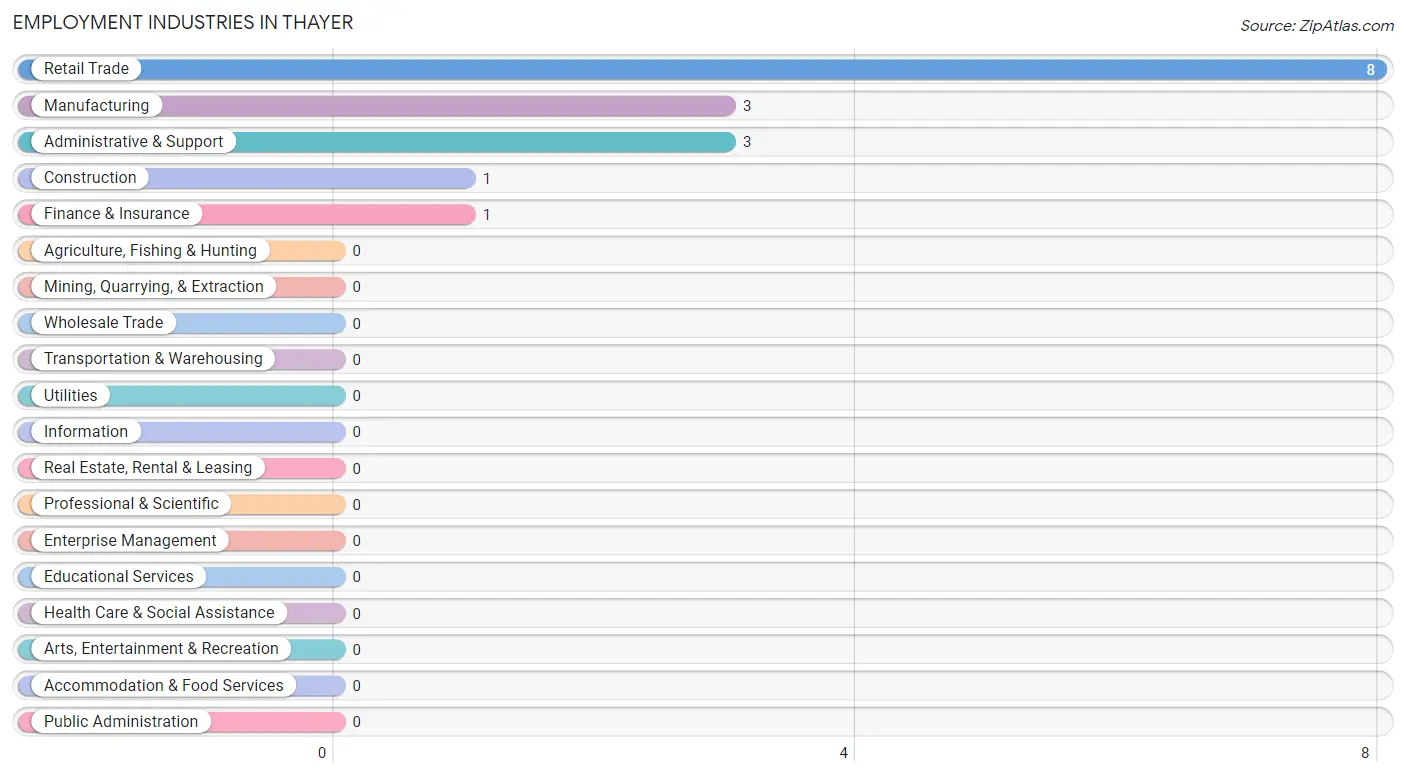
Employment Industries in Thayer
The major employment industries in Thayer include Retail Trade (8 | 50.0%), Manufacturing (3 | 18.8%), Administrative & Support (3 | 18.8%), Construction (1 | 6.2%), and Finance & Insurance (1 | 6.2%).
Employment Industries by Sex in Thayer
The Thayer industries that see more men than women are Construction (100.0%), Manufacturing (66.7%), and Administrative & Support (66.7%), whereas the industries that tend to have a higher number of women are Finance & Insurance (100.0%), Retail Trade (87.5%), and Manufacturing (33.3%).
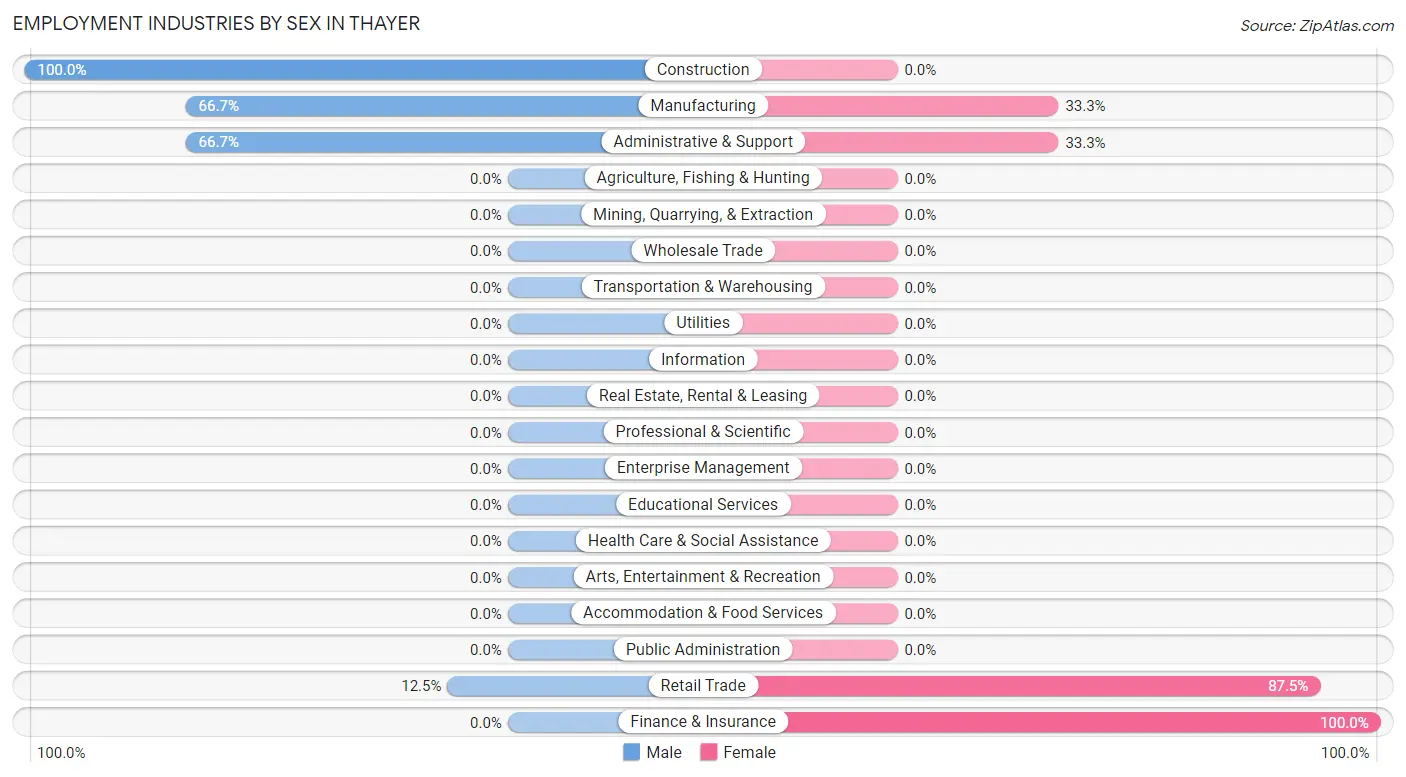
| Industry | Male | Female |
| Agriculture, Fishing & Hunting | 0 (0.0%) | 0 (0.0%) |
| Mining, Quarrying, & Extraction | 0 (0.0%) | 0 (0.0%) |
| Construction | 1 (100.0%) | 0 (0.0%) |
| Manufacturing | 2 (66.7%) | 1 (33.3%) |
| Wholesale Trade | 0 (0.0%) | 0 (0.0%) |
| Retail Trade | 1 (12.5%) | 7 (87.5%) |
| Transportation & Warehousing | 0 (0.0%) | 0 (0.0%) |
| Utilities | 0 (0.0%) | 0 (0.0%) |
| Information | 0 (0.0%) | 0 (0.0%) |
| Finance & Insurance | 0 (0.0%) | 1 (100.0%) |
| Real Estate, Rental & Leasing | 0 (0.0%) | 0 (0.0%) |
| Professional & Scientific | 0 (0.0%) | 0 (0.0%) |
| Enterprise Management | 0 (0.0%) | 0 (0.0%) |
| Administrative & Support | 2 (66.7%) | 1 (33.3%) |
| Educational Services | 0 (0.0%) | 0 (0.0%) |
| Health Care & Social Assistance | 0 (0.0%) | 0 (0.0%) |
| Arts, Entertainment & Recreation | 0 (0.0%) | 0 (0.0%) |
| Accommodation & Food Services | 0 (0.0%) | 0 (0.0%) |
| Public Administration | 0 (0.0%) | 0 (0.0%) |
| Total | 6 (37.5%) | 10 (62.5%) |
Education in Thayer
School Enrollment in Thayer
The most common levels of schooling among the 12 students in Thayer are elementary school (6 | 50.0%), nursery / preschool (4 | 33.3%), and middle school (2 | 16.7%).
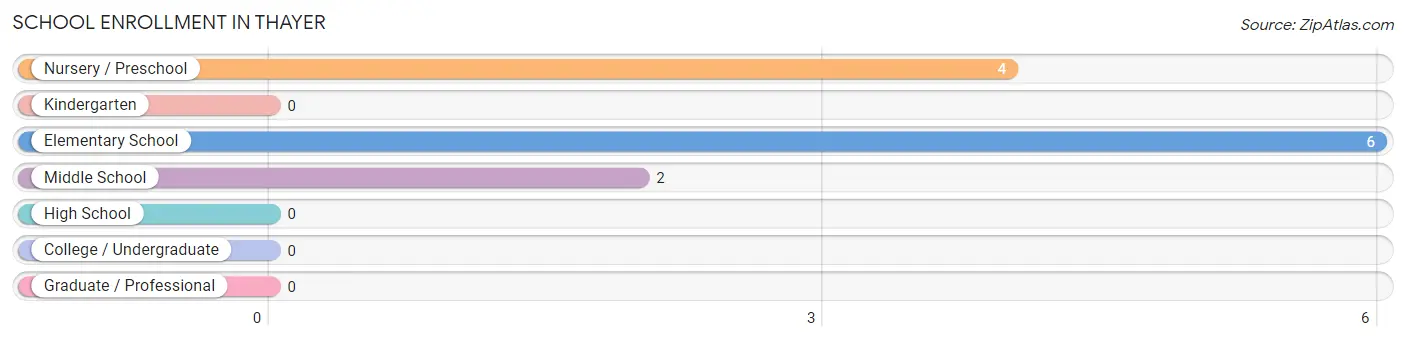
| School Level | # Students | % Students |
| Nursery / Preschool | 4 | 33.3% |
| Kindergarten | 0 | 0.0% |
| Elementary School | 6 | 50.0% |
| Middle School | 2 | 16.7% |
| High School | 0 | 0.0% |
| College / Undergraduate | 0 | 0.0% |
| Graduate / Professional | 0 | 0.0% |
| Total | 12 | 100.0% |
School Enrollment by Age by Funding Source in Thayer
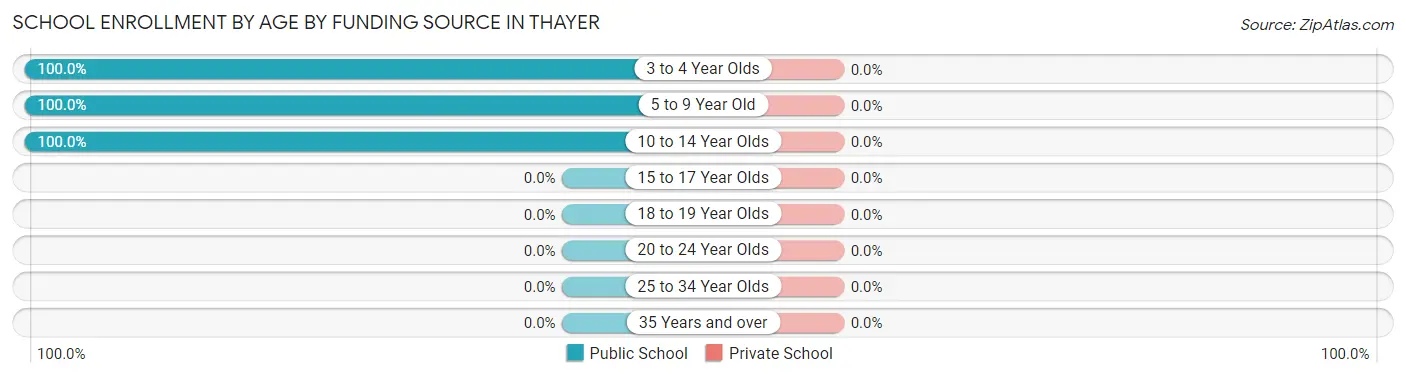
| Age Bracket | Public School | Private School |
| 3 to 4 Year Olds | 4 (100.0%) | 0 (0.0%) |
| 5 to 9 Year Old | 6 (100.0%) | 0 (0.0%) |
| 10 to 14 Year Olds | 2 (100.0%) | 0 (0.0%) |
| 15 to 17 Year Olds | 0 (0.0%) | 0 (0.0%) |
| 18 to 19 Year Olds | 0 (0.0%) | 0 (0.0%) |
| 20 to 24 Year Olds | 0 (0.0%) | 0 (0.0%) |
| 25 to 34 Year Olds | 0 (0.0%) | 0 (0.0%) |
| 35 Years and over | 0 (0.0%) | 0 (0.0%) |
| Total | 12 (100.0%) | 0 (0.0%) |
Educational Attainment by Field of Study in Thayer
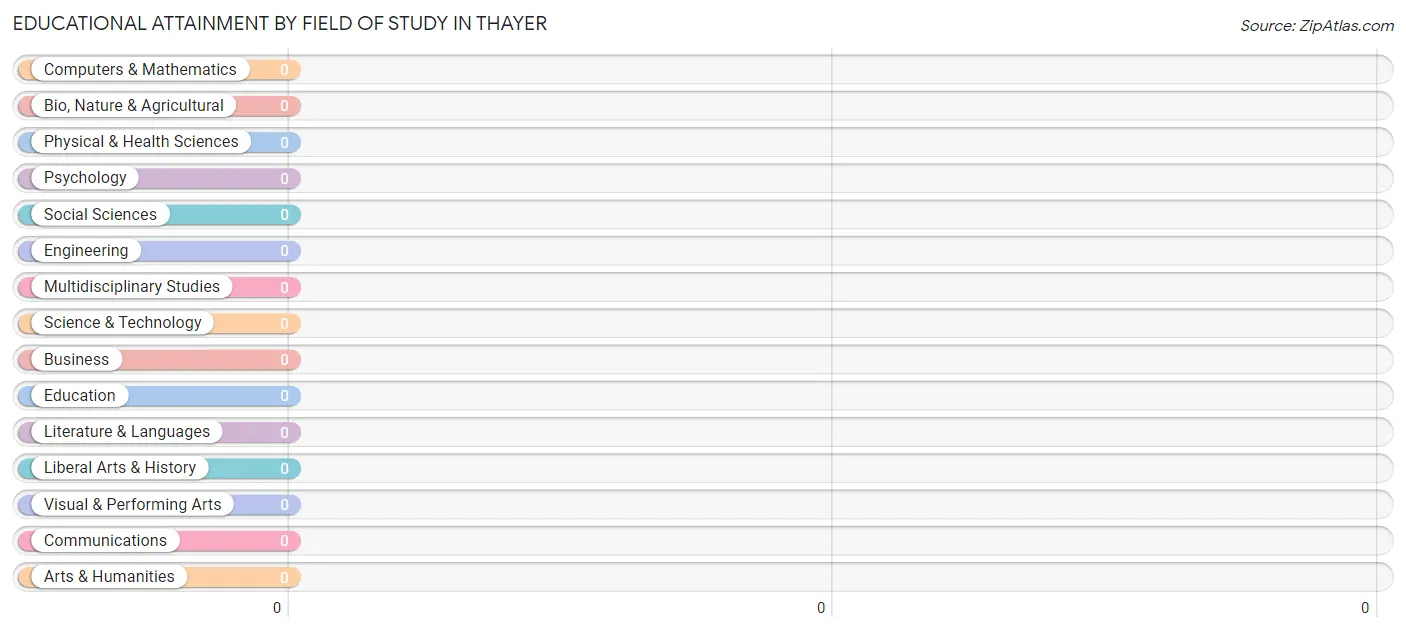
| Field of Study | # Graduates | % Graduates |
| Computers & Mathematics | 0 | 0.0% |
| Bio, Nature & Agricultural | 0 | 0.0% |
| Physical & Health Sciences | 0 | 0.0% |
| Psychology | 0 | 0.0% |
| Social Sciences | 0 | 0.0% |
| Engineering | 0 | 0.0% |
| Multidisciplinary Studies | 0 | 0.0% |
| Science & Technology | 0 | 0.0% |
| Business | 0 | 0.0% |
| Education | 0 | 0.0% |
| Literature & Languages | 0 | 0.0% |
| Liberal Arts & History | 0 | 0.0% |
| Visual & Performing Arts | 0 | 0.0% |
| Communications | 0 | 0.0% |
| Arts & Humanities | 0 | 0.0% |
| Total | 0 | 0.0% |
Transportation & Commute in Thayer
Vehicle Availability by Sex in Thayer
The most prevalent vehicle ownership categories in Thayer are males with 3 vehicles (4, accounting for 66.7%) and females with 3 vehicles (1, making up 40.0%).
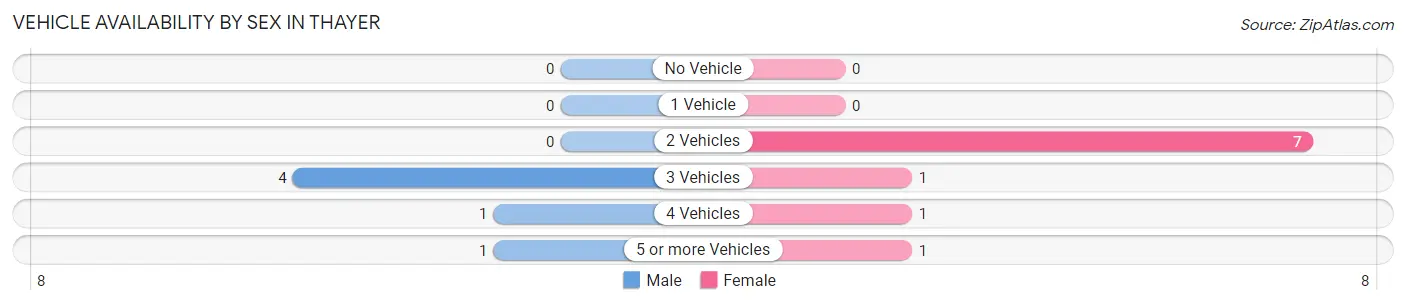
| Vehicles Available | Male | Female |
| No Vehicle | 0 (0.0%) | 0 (0.0%) |
| 1 Vehicle | 0 (0.0%) | 0 (0.0%) |
| 2 Vehicles | 0 (0.0%) | 7 (70.0%) |
| 3 Vehicles | 4 (66.7%) | 1 (10.0%) |
| 4 Vehicles | 1 (16.7%) | 1 (10.0%) |
| 5 or more Vehicles | 1 (16.7%) | 1 (10.0%) |
| Total | 6 (100.0%) | 10 (100.0%) |
Commute Time in Thayer
The most frequently occuring commute durations in Thayer are 30 to 34 minutes (7 commuters, 43.8%), 15 to 19 minutes (3 commuters, 18.8%), and less than 5 minutes (2 commuters, 12.5%).
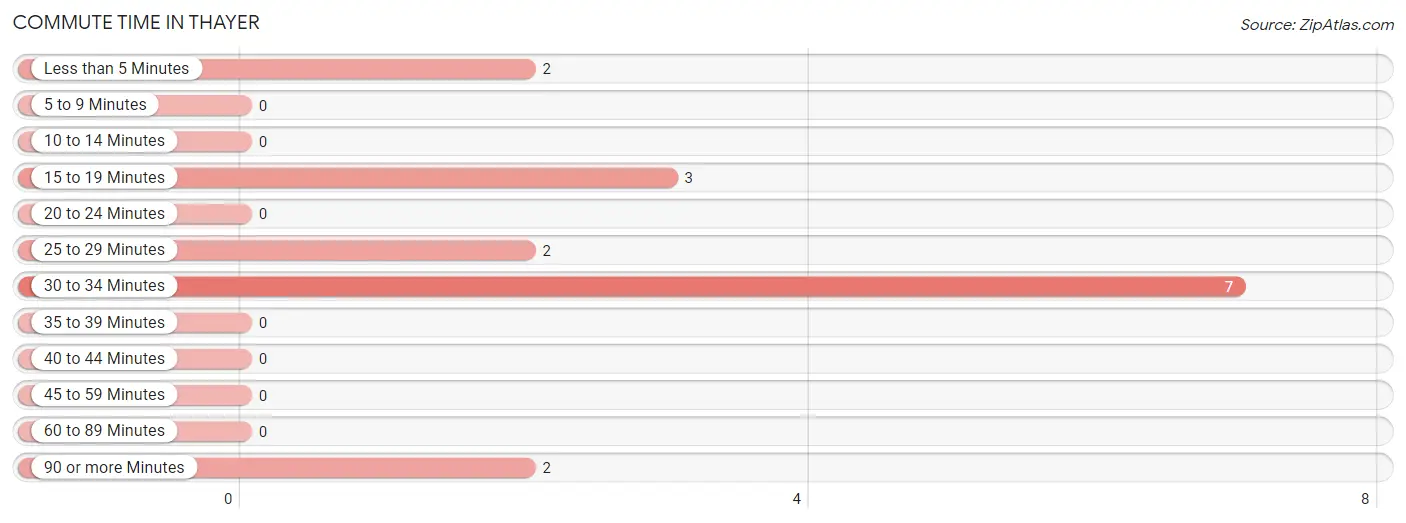
| Commute Time | # Commuters | % Commuters |
| Less than 5 Minutes | 2 | 12.5% |
| 5 to 9 Minutes | 0 | 0.0% |
| 10 to 14 Minutes | 0 | 0.0% |
| 15 to 19 Minutes | 3 | 18.8% |
| 20 to 24 Minutes | 0 | 0.0% |
| 25 to 29 Minutes | 2 | 12.5% |
| 30 to 34 Minutes | 7 | 43.8% |
| 35 to 39 Minutes | 0 | 0.0% |
| 40 to 44 Minutes | 0 | 0.0% |
| 45 to 59 Minutes | 0 | 0.0% |
| 60 to 89 Minutes | 0 | 0.0% |
| 90 or more Minutes | 2 | 12.5% |
Commute Time by Sex in Thayer
The most common commute times in Thayer are less than 5 minutes (2 commuters, 33.3%) for males and 30 to 34 minutes (7 commuters, 70.0%) for females.
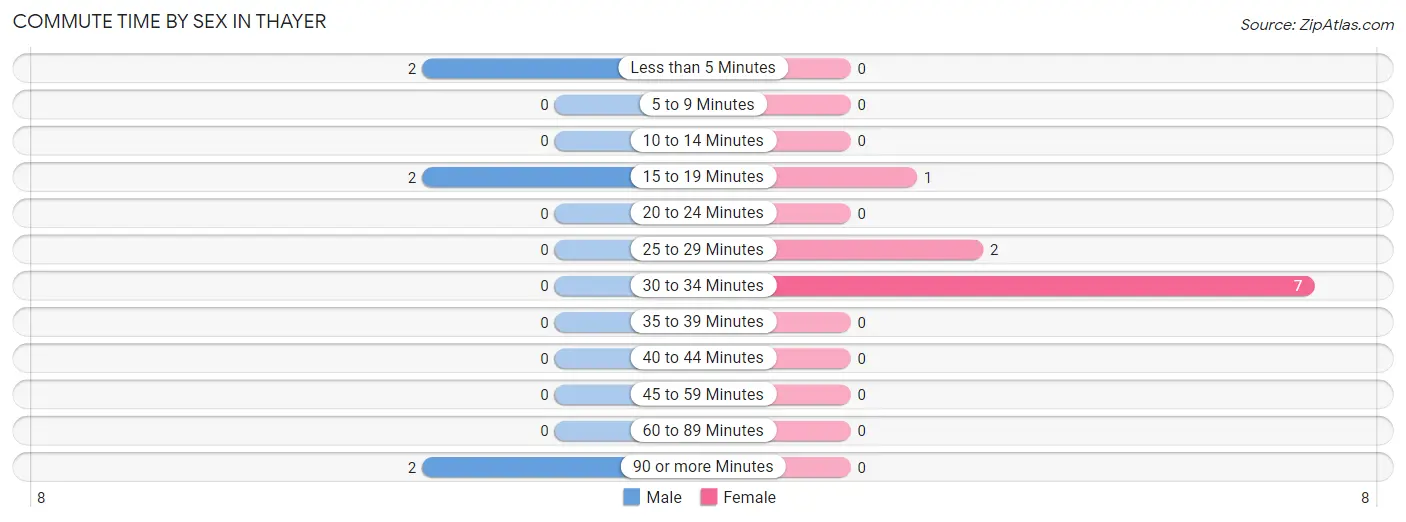
| Commute Time | Male | Female |
| Less than 5 Minutes | 2 (33.3%) | 0 (0.0%) |
| 5 to 9 Minutes | 0 (0.0%) | 0 (0.0%) |
| 10 to 14 Minutes | 0 (0.0%) | 0 (0.0%) |
| 15 to 19 Minutes | 2 (33.3%) | 1 (10.0%) |
| 20 to 24 Minutes | 0 (0.0%) | 0 (0.0%) |
| 25 to 29 Minutes | 0 (0.0%) | 2 (20.0%) |
| 30 to 34 Minutes | 0 (0.0%) | 7 (70.0%) |
| 35 to 39 Minutes | 0 (0.0%) | 0 (0.0%) |
| 40 to 44 Minutes | 0 (0.0%) | 0 (0.0%) |
| 45 to 59 Minutes | 0 (0.0%) | 0 (0.0%) |
| 60 to 89 Minutes | 0 (0.0%) | 0 (0.0%) |
| 90 or more Minutes | 2 (33.3%) | 0 (0.0%) |
Time of Departure to Work by Sex in Thayer
The most frequent times of departure to work in Thayer are 12:00 AM to 4:59 AM (2, 33.3%) for males and 7:00 AM to 7:29 AM (7, 70.0%) for females.
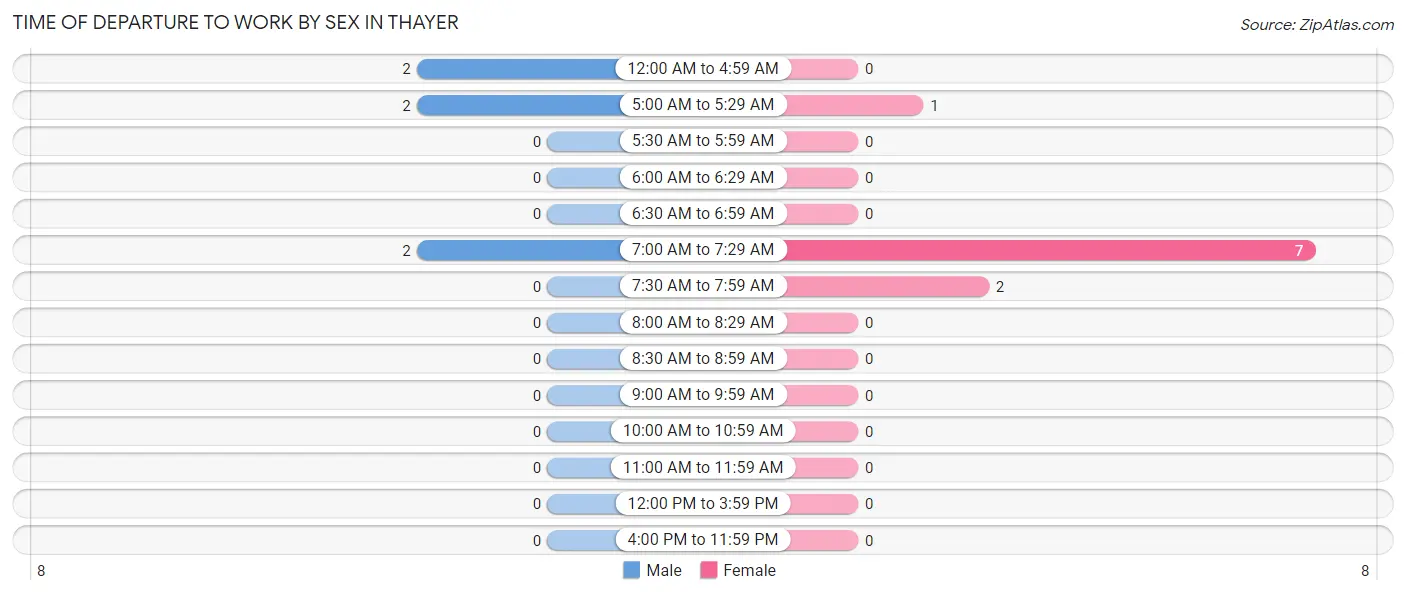
| Time of Departure | Male | Female |
| 12:00 AM to 4:59 AM | 2 (33.3%) | 0 (0.0%) |
| 5:00 AM to 5:29 AM | 2 (33.3%) | 1 (10.0%) |
| 5:30 AM to 5:59 AM | 0 (0.0%) | 0 (0.0%) |
| 6:00 AM to 6:29 AM | 0 (0.0%) | 0 (0.0%) |
| 6:30 AM to 6:59 AM | 0 (0.0%) | 0 (0.0%) |
| 7:00 AM to 7:29 AM | 2 (33.3%) | 7 (70.0%) |
| 7:30 AM to 7:59 AM | 0 (0.0%) | 2 (20.0%) |
| 8:00 AM to 8:29 AM | 0 (0.0%) | 0 (0.0%) |
| 8:30 AM to 8:59 AM | 0 (0.0%) | 0 (0.0%) |
| 9:00 AM to 9:59 AM | 0 (0.0%) | 0 (0.0%) |
| 10:00 AM to 10:59 AM | 0 (0.0%) | 0 (0.0%) |
| 11:00 AM to 11:59 AM | 0 (0.0%) | 0 (0.0%) |
| 12:00 PM to 3:59 PM | 0 (0.0%) | 0 (0.0%) |
| 4:00 PM to 11:59 PM | 0 (0.0%) | 0 (0.0%) |
| Total | 6 (100.0%) | 10 (100.0%) |
Housing Occupancy in Thayer
Occupancy by Ownership in Thayer
Of the total 13 dwellings in Thayer, owner-occupied units account for 13 (100.0%), while renter-occupied units make up 0 (0.0%).
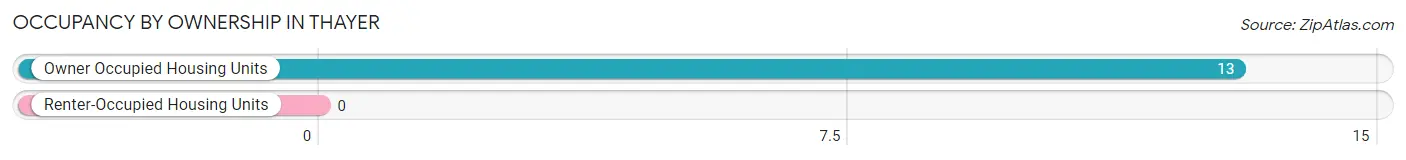
| Occupancy | # Housing Units | % Housing Units |
| Owner Occupied Housing Units | 13 | 100.0% |
| Renter-Occupied Housing Units | 0 | 0.0% |
| Total Occupied Housing Units | 13 | 100.0% |
Occupancy by Household Size in Thayer
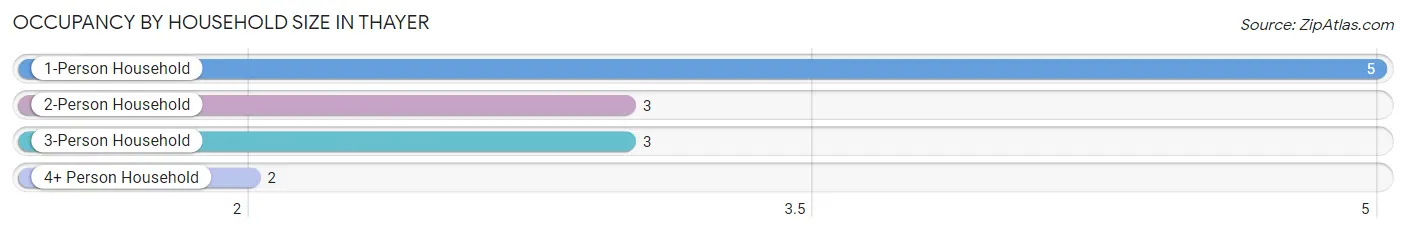
| Household Size | # Housing Units | % Housing Units |
| 1-Person Household | 5 | 38.5% |
| 2-Person Household | 3 | 23.1% |
| 3-Person Household | 3 | 23.1% |
| 4+ Person Household | 2 | 15.4% |
| Total Housing Units | 13 | 100.0% |
Occupancy by Ownership by Household Size in Thayer
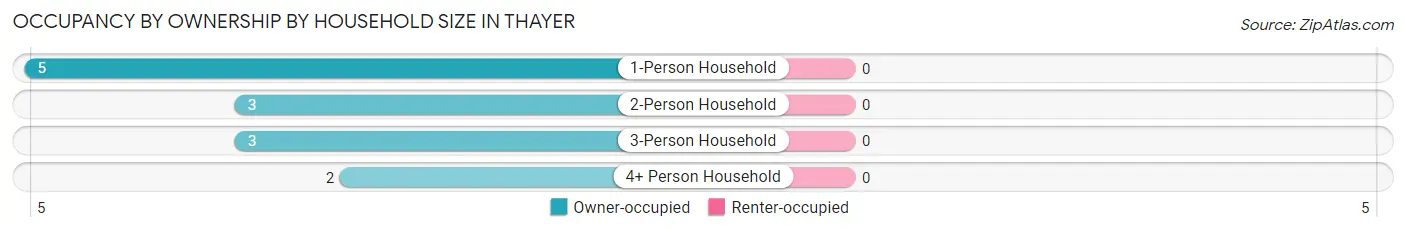
| Household Size | Owner-occupied | Renter-occupied |
| 1-Person Household | 5 (100.0%) | 0 (0.0%) |
| 2-Person Household | 3 (100.0%) | 0 (0.0%) |
| 3-Person Household | 3 (100.0%) | 0 (0.0%) |
| 4+ Person Household | 2 (100.0%) | 0 (0.0%) |
| Total Housing Units | 13 (100.0%) | 0 (0.0%) |
Occupancy by Educational Attainment in Thayer
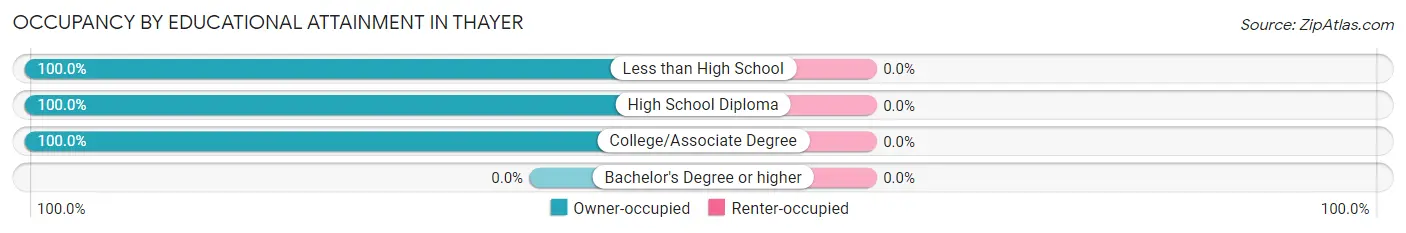
| Household Size | Owner-occupied | Renter-occupied |
| Less than High School | 4 (100.0%) | 0 (0.0%) |
| High School Diploma | 4 (100.0%) | 0 (0.0%) |
| College/Associate Degree | 5 (100.0%) | 0 (0.0%) |
| Bachelor's Degree or higher | 0 (0.0%) | 0 (0.0%) |
Occupancy by Age of Householder in Thayer
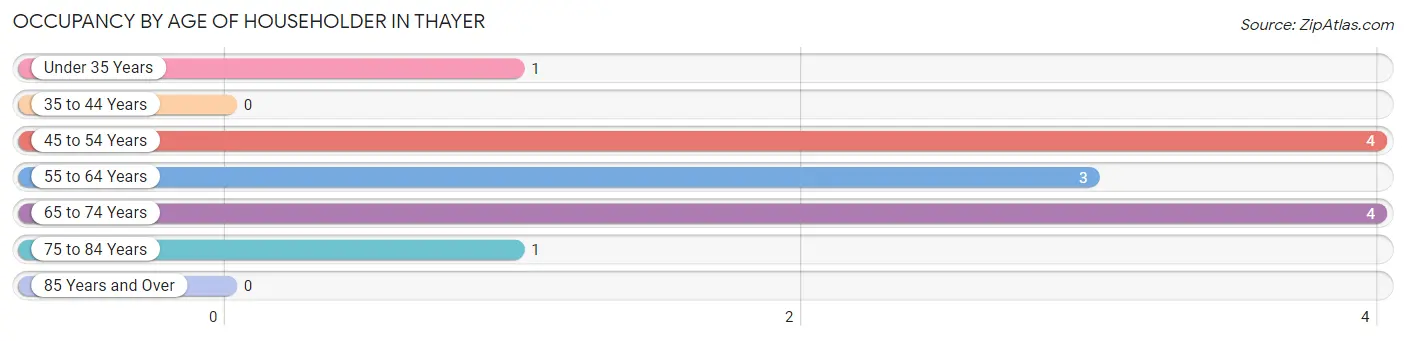
| Age Bracket | # Households | % Households |
| Under 35 Years | 1 | 7.7% |
| 35 to 44 Years | 0 | 0.0% |
| 45 to 54 Years | 4 | 30.8% |
| 55 to 64 Years | 3 | 23.1% |
| 65 to 74 Years | 4 | 30.8% |
| 75 to 84 Years | 1 | 7.7% |
| 85 Years and Over | 0 | 0.0% |
| Total | 13 | 100.0% |
Housing Finances in Thayer
Median Income by Occupancy in Thayer
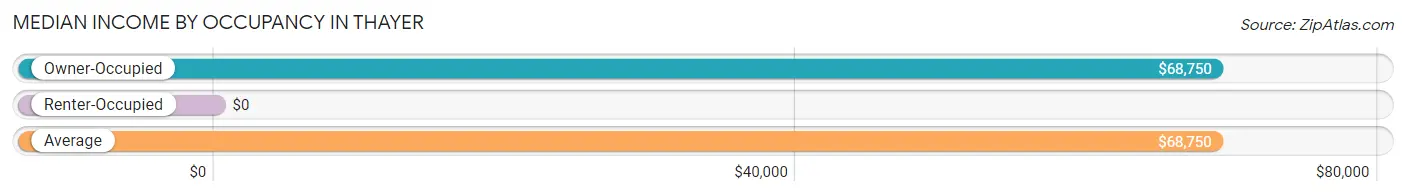
| Occupancy Type | # Households | Median Income |
| Owner-Occupied | 13 (100.0%) | $68,750 |
| Renter-Occupied | 0 (0.0%) | $0 |
| Average | 13 (100.0%) | $68,750 |
Occupancy by Householder Income Bracket in Thayer
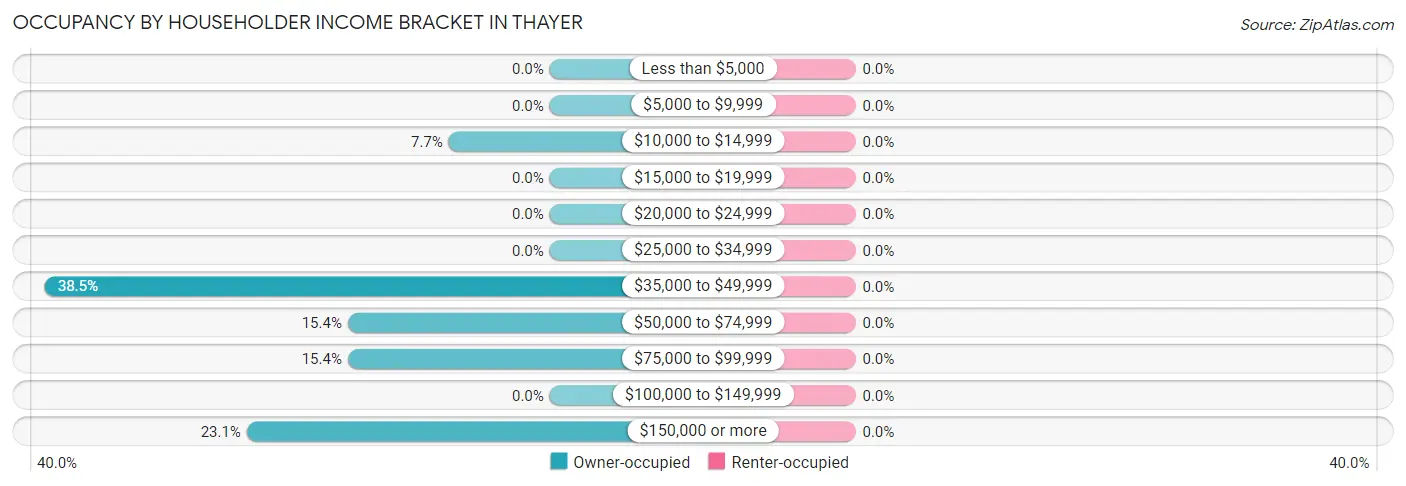
| Income Bracket | Owner-occupied | Renter-occupied |
| Less than $5,000 | 0 (0.0%) | 0 (0.0%) |
| $5,000 to $9,999 | 0 (0.0%) | 0 (0.0%) |
| $10,000 to $14,999 | 1 (7.7%) | 0 (0.0%) |
| $15,000 to $19,999 | 0 (0.0%) | 0 (0.0%) |
| $20,000 to $24,999 | 0 (0.0%) | 0 (0.0%) |
| $25,000 to $34,999 | 0 (0.0%) | 0 (0.0%) |
| $35,000 to $49,999 | 5 (38.5%) | 0 (0.0%) |
| $50,000 to $74,999 | 2 (15.4%) | 0 (0.0%) |
| $75,000 to $99,999 | 2 (15.4%) | 0 (0.0%) |
| $100,000 to $149,999 | 0 (0.0%) | 0 (0.0%) |
| $150,000 or more | 3 (23.1%) | 0 (0.0%) |
| Total | 13 (100.0%) | 0 (0.0%) |
Monthly Housing Cost Tiers in Thayer
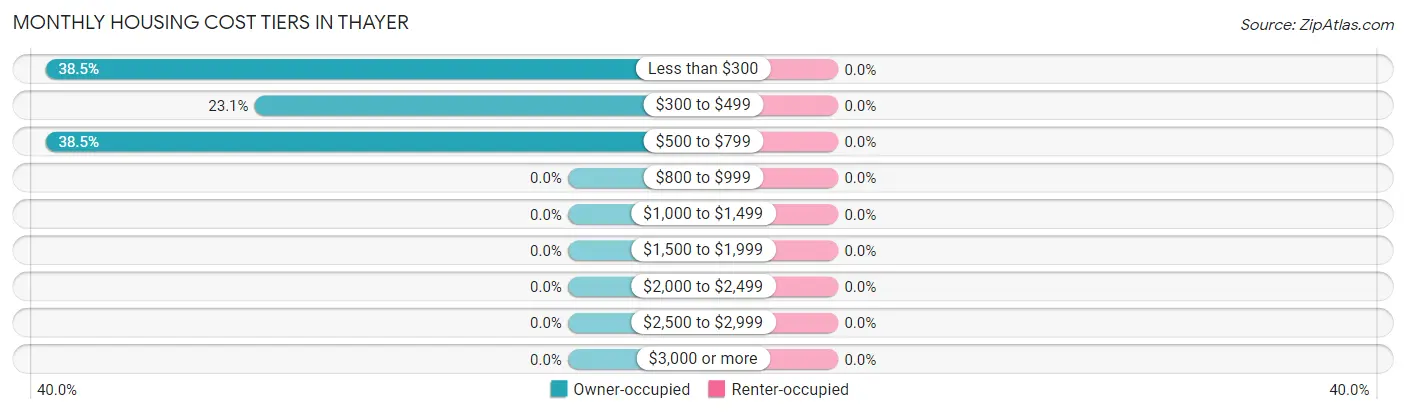
| Monthly Cost | Owner-occupied | Renter-occupied |
| Less than $300 | 5 (38.5%) | 0 (0.0%) |
| $300 to $499 | 3 (23.1%) | 0 (0.0%) |
| $500 to $799 | 5 (38.5%) | 0 (0.0%) |
| $800 to $999 | 0 (0.0%) | 0 (0.0%) |
| $1,000 to $1,499 | 0 (0.0%) | 0 (0.0%) |
| $1,500 to $1,999 | 0 (0.0%) | 0 (0.0%) |
| $2,000 to $2,499 | 0 (0.0%) | 0 (0.0%) |
| $2,500 to $2,999 | 0 (0.0%) | 0 (0.0%) |
| $3,000 or more | 0 (0.0%) | 0 (0.0%) |
| Total | 13 (100.0%) | 0 (0.0%) |
Physical Housing Characteristics in Thayer
Housing Structures in Thayer
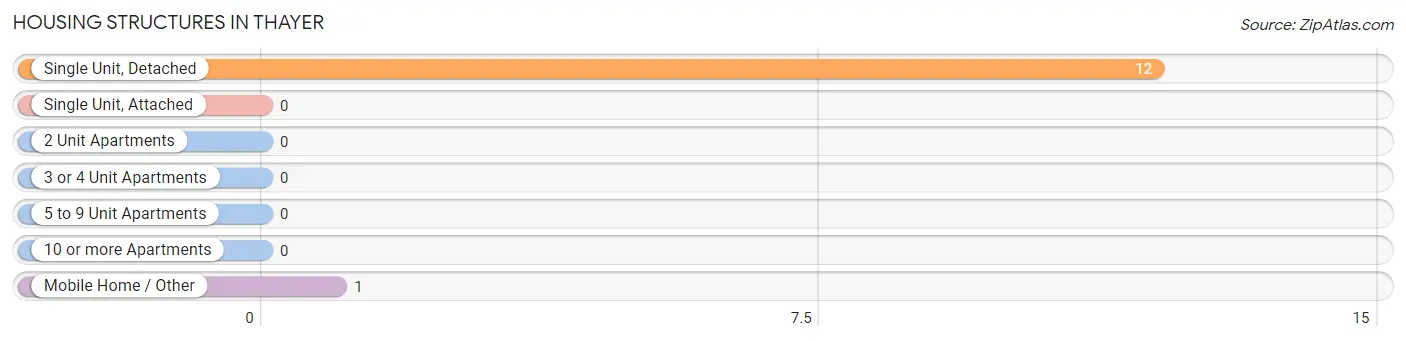
| Structure Type | # Housing Units | % Housing Units |
| Single Unit, Detached | 12 | 92.3% |
| Single Unit, Attached | 0 | 0.0% |
| 2 Unit Apartments | 0 | 0.0% |
| 3 or 4 Unit Apartments | 0 | 0.0% |
| 5 to 9 Unit Apartments | 0 | 0.0% |
| 10 or more Apartments | 0 | 0.0% |
| Mobile Home / Other | 1 | 7.7% |
| Total | 13 | 100.0% |
Housing Structures by Occupancy in Thayer
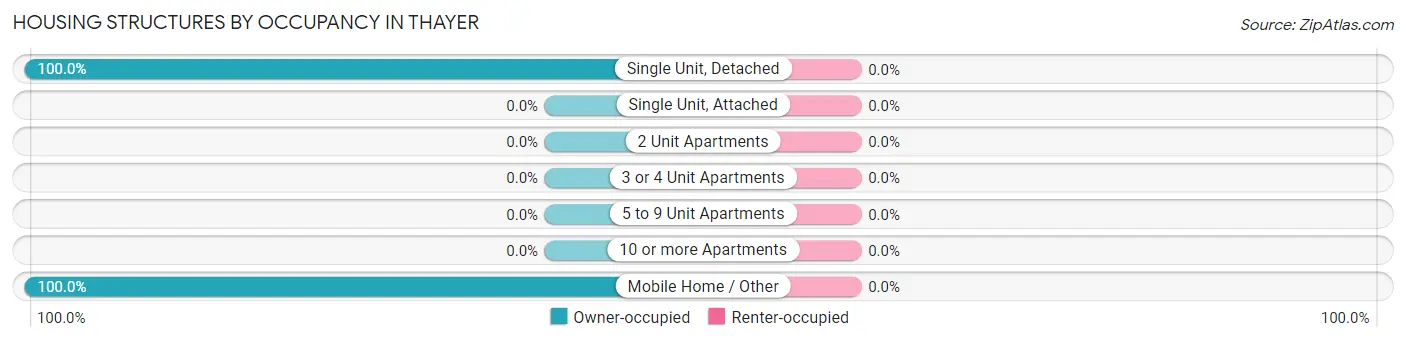
| Structure Type | Owner-occupied | Renter-occupied |
| Single Unit, Detached | 12 (100.0%) | 0 (0.0%) |
| Single Unit, Attached | 0 (0.0%) | 0 (0.0%) |
| 2 Unit Apartments | 0 (0.0%) | 0 (0.0%) |
| 3 or 4 Unit Apartments | 0 (0.0%) | 0 (0.0%) |
| 5 to 9 Unit Apartments | 0 (0.0%) | 0 (0.0%) |
| 10 or more Apartments | 0 (0.0%) | 0 (0.0%) |
| Mobile Home / Other | 1 (100.0%) | 0 (0.0%) |
| Total | 13 (100.0%) | 0 (0.0%) |
Housing Structures by Number of Rooms in Thayer

| Number of Rooms | Owner-occupied | Renter-occupied |
| 1 Room | 0 (0.0%) | 0 (0.0%) |
| 2 or 3 Rooms | 0 (0.0%) | 0 (0.0%) |
| 4 or 5 Rooms | 5 (38.5%) | 0 (0.0%) |
| 6 or 7 Rooms | 8 (61.5%) | 0 (0.0%) |
| 8 or more Rooms | 0 (0.0%) | 0 (0.0%) |
| Total | 13 (100.0%) | 0 (0.0%) |
Housing Structure by Heating Type in Thayer
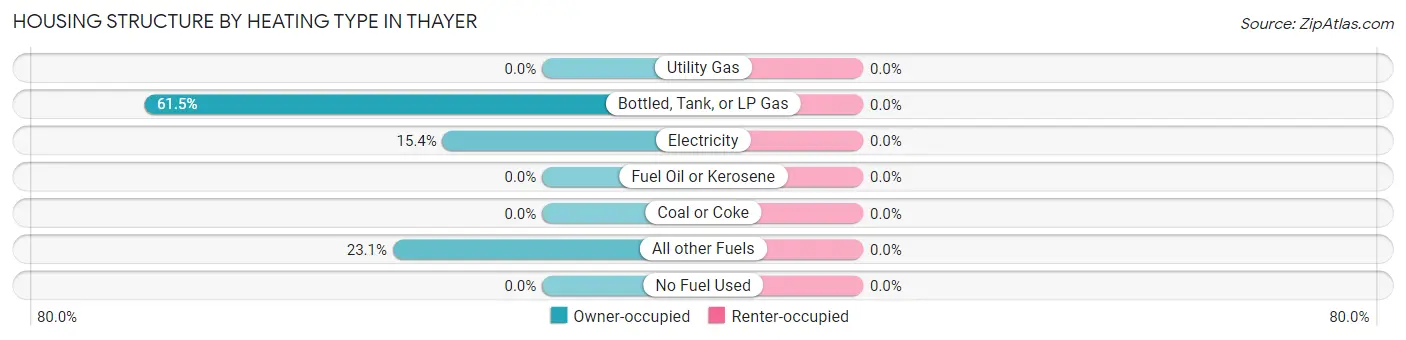
| Heating Type | Owner-occupied | Renter-occupied |
| Utility Gas | 0 (0.0%) | 0 (0.0%) |
| Bottled, Tank, or LP Gas | 8 (61.5%) | 0 (0.0%) |
| Electricity | 2 (15.4%) | 0 (0.0%) |
| Fuel Oil or Kerosene | 0 (0.0%) | 0 (0.0%) |
| Coal or Coke | 0 (0.0%) | 0 (0.0%) |
| All other Fuels | 3 (23.1%) | 0 (0.0%) |
| No Fuel Used | 0 (0.0%) | 0 (0.0%) |
| Total | 13 (100.0%) | 0 (0.0%) |
Household Vehicle Usage in Thayer
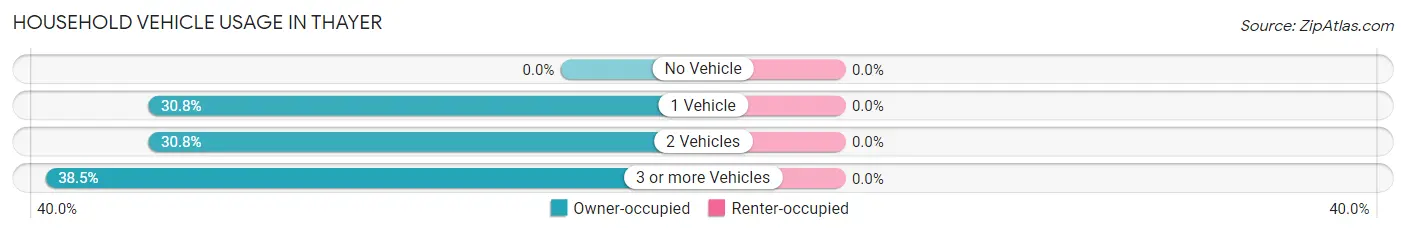
| Vehicles per Household | Owner-occupied | Renter-occupied |
| No Vehicle | 0 (0.0%) | 0 (0.0%) |
| 1 Vehicle | 4 (30.8%) | 0 (0.0%) |
| 2 Vehicles | 4 (30.8%) | 0 (0.0%) |
| 3 or more Vehicles | 5 (38.5%) | 0 (0.0%) |
| Total | 13 (100.0%) | 0 (0.0%) |
Real Estate & Mortgages in Thayer
Real Estate and Mortgage Overview in Thayer
| Characteristic | Without Mortgage | With Mortgage |
| Housing Units | 13 | 0 |
| Median Property Value | $32,500 | $0 |
| Median Household Income | $68,750 | $0 |
| Monthly Housing Costs | $450 | $0 |
| Real Estate Taxes | - | - |
Property Value by Mortgage Status in Thayer
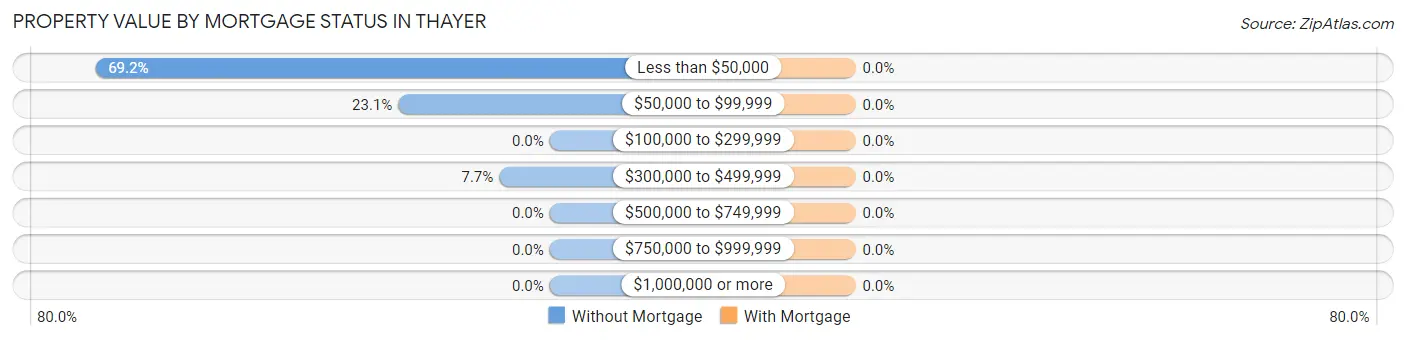
| Property Value | Without Mortgage | With Mortgage |
| Less than $50,000 | 9 (69.2%) | 0 (0.0%) |
| $50,000 to $99,999 | 3 (23.1%) | 0 (0.0%) |
| $100,000 to $299,999 | 0 (0.0%) | 0 (0.0%) |
| $300,000 to $499,999 | 1 (7.7%) | 0 (0.0%) |
| $500,000 to $749,999 | 0 (0.0%) | 0 (0.0%) |
| $750,000 to $999,999 | 0 (0.0%) | 0 (0.0%) |
| $1,000,000 or more | 0 (0.0%) | 0 (0.0%) |
| Total | 13 (100.0%) | 0 (0.0%) |
Household Income by Mortgage Status in Thayer
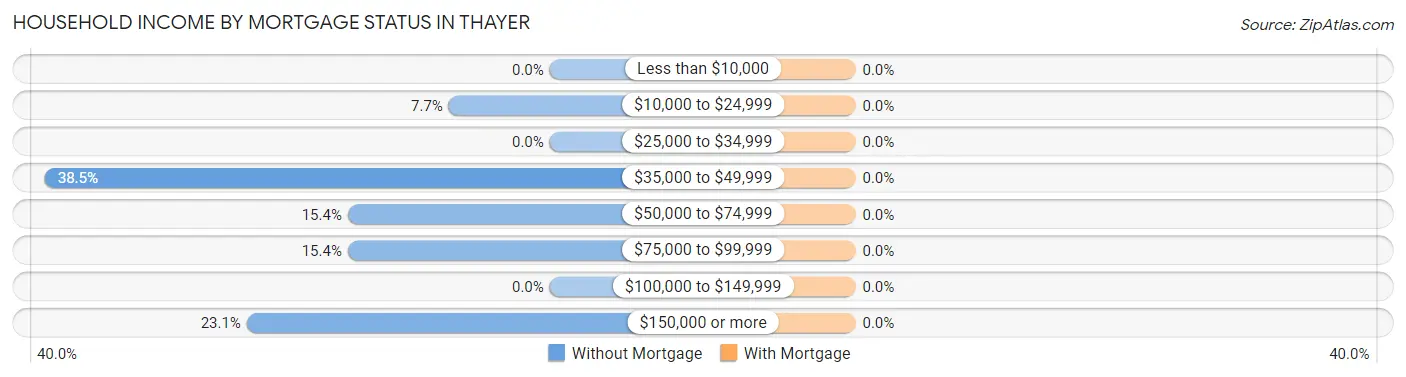
| Household Income | Without Mortgage | With Mortgage |
| Less than $10,000 | 0 (0.0%) | 0 (0.0%) |
| $10,000 to $24,999 | 1 (7.7%) | 0 (0.0%) |
| $25,000 to $34,999 | 0 (0.0%) | 0 (0.0%) |
| $35,000 to $49,999 | 5 (38.5%) | 0 (0.0%) |
| $50,000 to $74,999 | 2 (15.4%) | 0 (0.0%) |
| $75,000 to $99,999 | 2 (15.4%) | 0 (0.0%) |
| $100,000 to $149,999 | 0 (0.0%) | 0 (0.0%) |
| $150,000 or more | 3 (23.1%) | 0 (0.0%) |
| Total | 13 (100.0%) | 0 (0.0%) |
Property Value to Household Income Ratio in Thayer
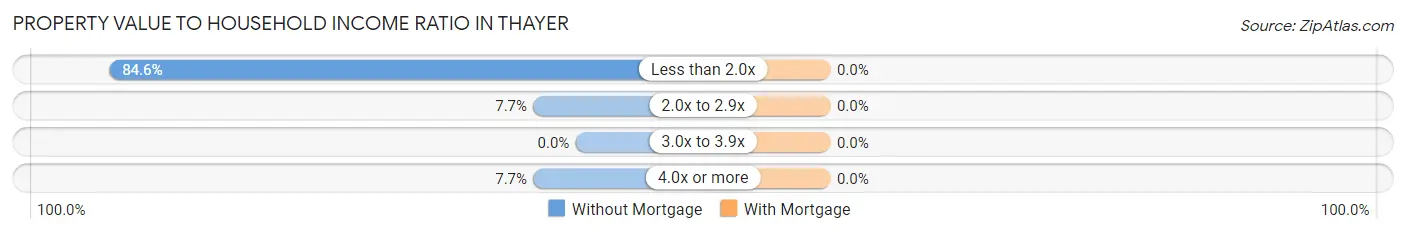
| Value-to-Income Ratio | Without Mortgage | With Mortgage |
| Less than 2.0x | 11 (84.6%) | 0 (0.0%) |
| 2.0x to 2.9x | 1 (7.7%) | 0 (0.0%) |
| 3.0x to 3.9x | 0 (0.0%) | 0 (0.0%) |
| 4.0x or more | 1 (7.7%) | 0 (0.0%) |
| Total | 13 (100.0%) | 0 (0.0%) |
Real Estate Taxes by Mortgage Status in Thayer
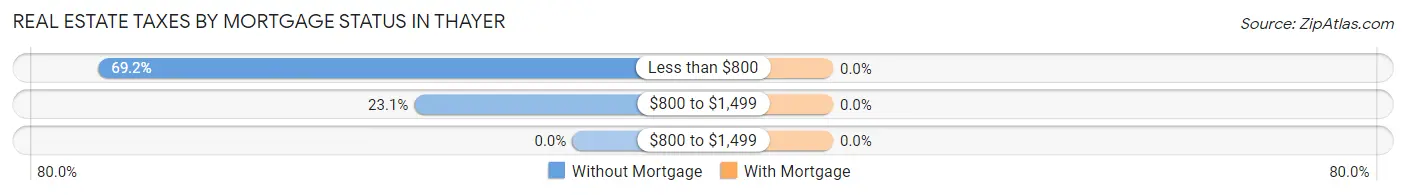
| Property Taxes | Without Mortgage | With Mortgage |
| Less than $800 | 9 (69.2%) | 0 (0.0%) |
| $800 to $1,499 | 3 (23.1%) | 0 (0.0%) |
| $800 to $1,499 | 0 (0.0%) | 0 (0.0%) |
| Total | 13 (100.0%) | 0 (0.0%) |
Health & Disability in Thayer
Health Insurance Coverage by Age in Thayer
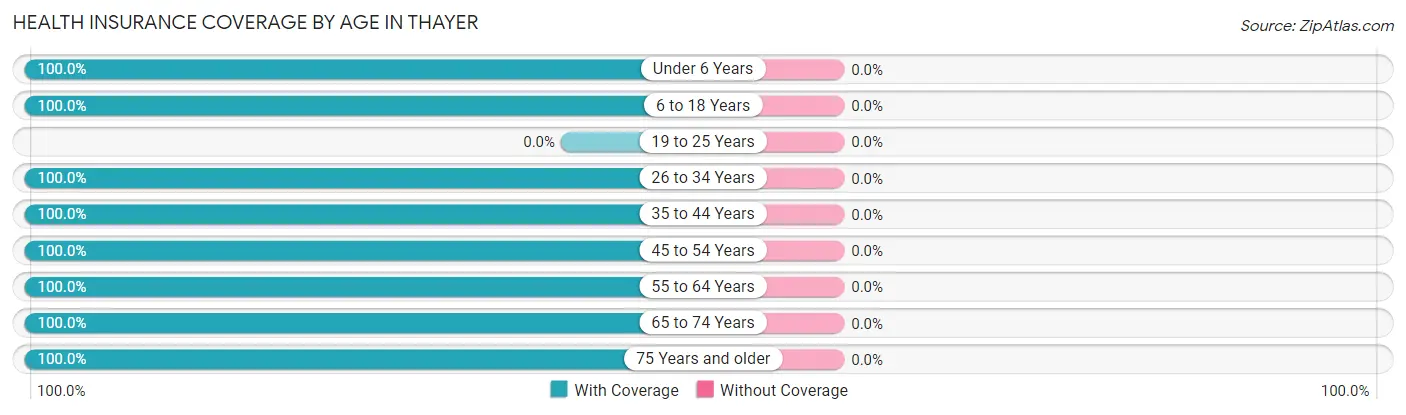
| Age Bracket | With Coverage | Without Coverage |
| Under 6 Years | 8 (100.0%) | 0 (0.0%) |
| 6 to 18 Years | 8 (100.0%) | 0 (0.0%) |
| 19 to 25 Years | 0 (0.0%) | 0 (0.0%) |
| 26 to 34 Years | 8 (100.0%) | 0 (0.0%) |
| 35 to 44 Years | 2 (100.0%) | 0 (0.0%) |
| 45 to 54 Years | 6 (100.0%) | 0 (0.0%) |
| 55 to 64 Years | 6 (100.0%) | 0 (0.0%) |
| 65 to 74 Years | 4 (100.0%) | 0 (0.0%) |
| 75 Years and older | 1 (100.0%) | 0 (0.0%) |
| Total | 43 (100.0%) | 0 (0.0%) |
Health Insurance Coverage by Citizenship Status in Thayer

| Citizenship Status | With Coverage | Without Coverage |
| Native Born | 8 (100.0%) | 0 (0.0%) |
| Foreign Born, Citizen | 8 (100.0%) | 0 (0.0%) |
| Foreign Born, not a Citizen | 0 (0.0%) | 0 (0.0%) |
Health Insurance Coverage by Household Income in Thayer
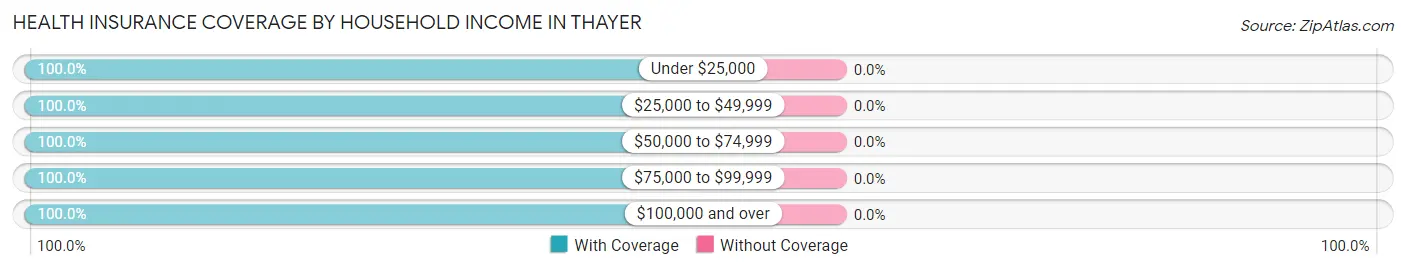
| Household Income | With Coverage | Without Coverage |
| Under $25,000 | 1 (100.0%) | 0 (0.0%) |
| $25,000 to $49,999 | 6 (100.0%) | 0 (0.0%) |
| $50,000 to $74,999 | 23 (100.0%) | 0 (0.0%) |
| $75,000 to $99,999 | 3 (100.0%) | 0 (0.0%) |
| $100,000 and over | 10 (100.0%) | 0 (0.0%) |
Public vs Private Health Insurance Coverage by Age in Thayer
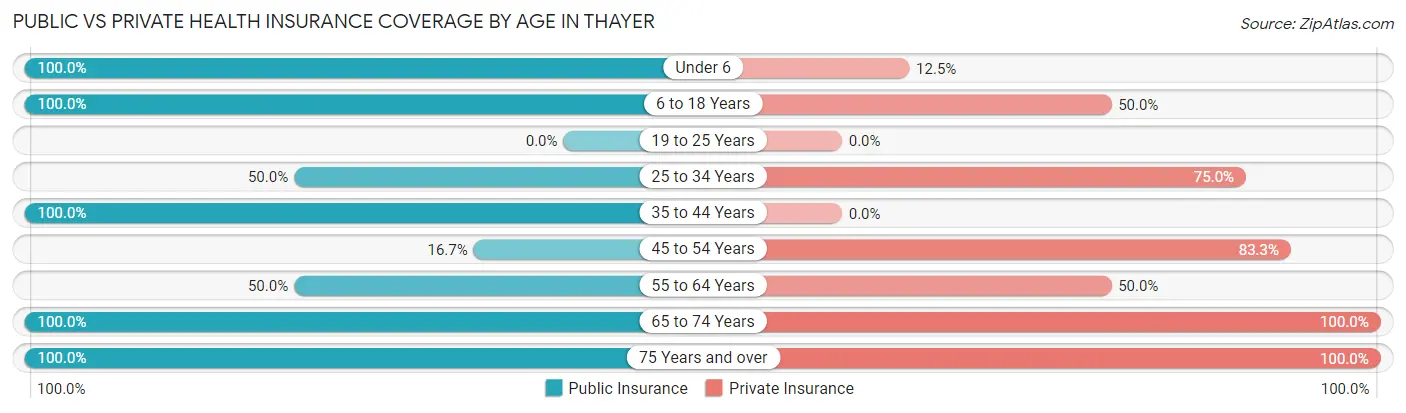
| Age Bracket | Public Insurance | Private Insurance |
| Under 6 | 8 (100.0%) | 1 (12.5%) |
| 6 to 18 Years | 8 (100.0%) | 4 (50.0%) |
| 19 to 25 Years | 0 (0.0%) | 0 (0.0%) |
| 25 to 34 Years | 4 (50.0%) | 6 (75.0%) |
| 35 to 44 Years | 2 (100.0%) | 0 (0.0%) |
| 45 to 54 Years | 1 (16.7%) | 5 (83.3%) |
| 55 to 64 Years | 3 (50.0%) | 3 (50.0%) |
| 65 to 74 Years | 4 (100.0%) | 4 (100.0%) |
| 75 Years and over | 1 (100.0%) | 1 (100.0%) |
| Total | 31 (72.1%) | 24 (55.8%) |
Disability Status by Sex by Age in Thayer
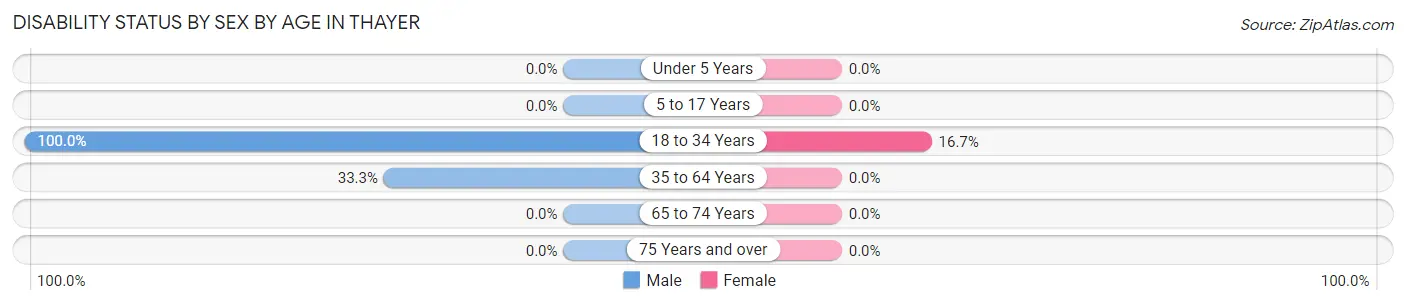
| Age Bracket | Male | Female |
| Under 5 Years | 0 (0.0%) | 0 (0.0%) |
| 5 to 17 Years | 0 (0.0%) | 0 (0.0%) |
| 18 to 34 Years | 2 (100.0%) | 1 (16.7%) |
| 35 to 64 Years | 3 (33.3%) | 0 (0.0%) |
| 65 to 74 Years | 0 (0.0%) | 0 (0.0%) |
| 75 Years and over | 0 (0.0%) | 0 (0.0%) |
Disability Class by Sex by Age in Thayer
Disability Class: Hearing Difficulty
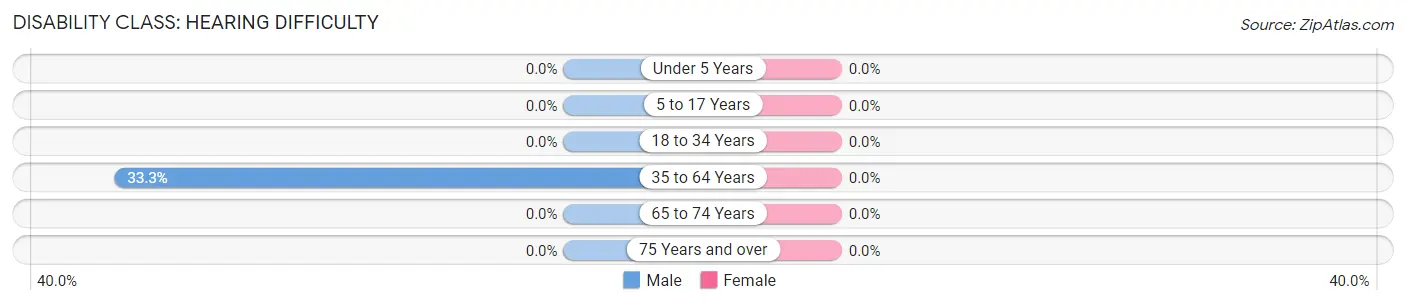
| Age Bracket | Male | Female |
| Under 5 Years | 0 (0.0%) | 0 (0.0%) |
| 5 to 17 Years | 0 (0.0%) | 0 (0.0%) |
| 18 to 34 Years | 0 (0.0%) | 0 (0.0%) |
| 35 to 64 Years | 3 (33.3%) | 0 (0.0%) |
| 65 to 74 Years | 0 (0.0%) | 0 (0.0%) |
| 75 Years and over | 0 (0.0%) | 0 (0.0%) |
Disability Class: Vision Difficulty
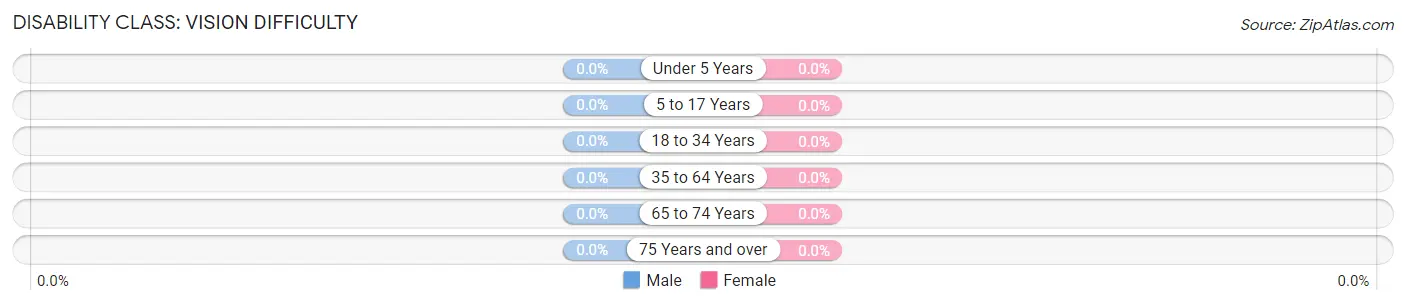
| Age Bracket | Male | Female |
| Under 5 Years | 0 (0.0%) | 0 (0.0%) |
| 5 to 17 Years | 0 (0.0%) | 0 (0.0%) |
| 18 to 34 Years | 0 (0.0%) | 0 (0.0%) |
| 35 to 64 Years | 0 (0.0%) | 0 (0.0%) |
| 65 to 74 Years | 0 (0.0%) | 0 (0.0%) |
| 75 Years and over | 0 (0.0%) | 0 (0.0%) |
Disability Class: Cognitive Difficulty
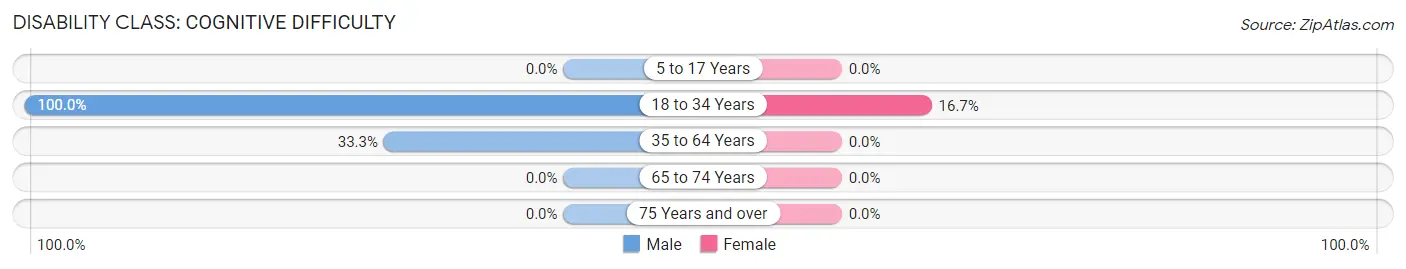
| Age Bracket | Male | Female |
| 5 to 17 Years | 0 (0.0%) | 0 (0.0%) |
| 18 to 34 Years | 2 (100.0%) | 1 (16.7%) |
| 35 to 64 Years | 3 (33.3%) | 0 (0.0%) |
| 65 to 74 Years | 0 (0.0%) | 0 (0.0%) |
| 75 Years and over | 0 (0.0%) | 0 (0.0%) |
Disability Class: Ambulatory Difficulty
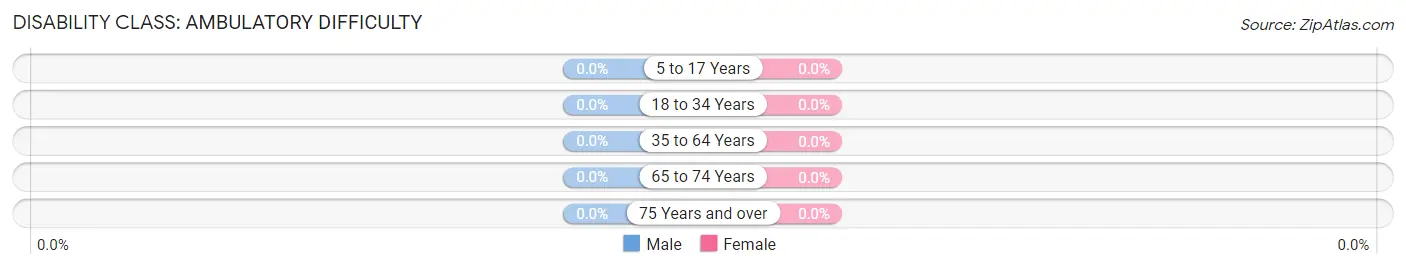
| Age Bracket | Male | Female |
| 5 to 17 Years | 0 (0.0%) | 0 (0.0%) |
| 18 to 34 Years | 0 (0.0%) | 0 (0.0%) |
| 35 to 64 Years | 0 (0.0%) | 0 (0.0%) |
| 65 to 74 Years | 0 (0.0%) | 0 (0.0%) |
| 75 Years and over | 0 (0.0%) | 0 (0.0%) |
Disability Class: Self-Care Difficulty
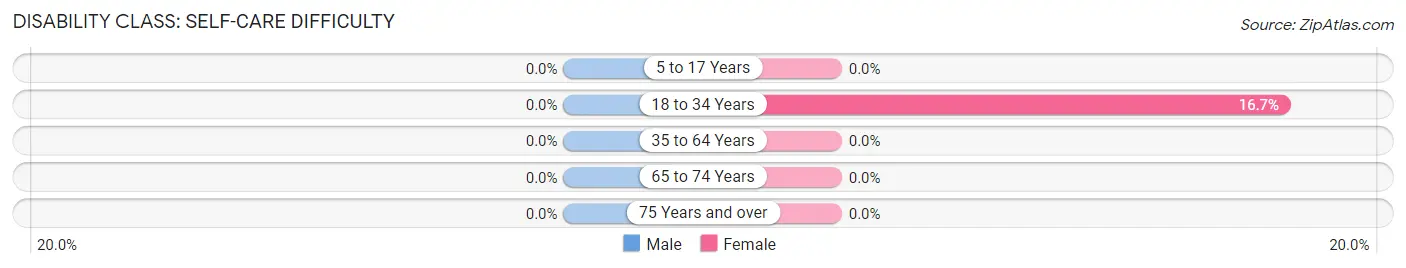
| Age Bracket | Male | Female |
| 5 to 17 Years | 0 (0.0%) | 0 (0.0%) |
| 18 to 34 Years | 0 (0.0%) | 1 (16.7%) |
| 35 to 64 Years | 0 (0.0%) | 0 (0.0%) |
| 65 to 74 Years | 0 (0.0%) | 0 (0.0%) |
| 75 Years and over | 0 (0.0%) | 0 (0.0%) |
Technology Access in Thayer
Computing Device Access in Thayer
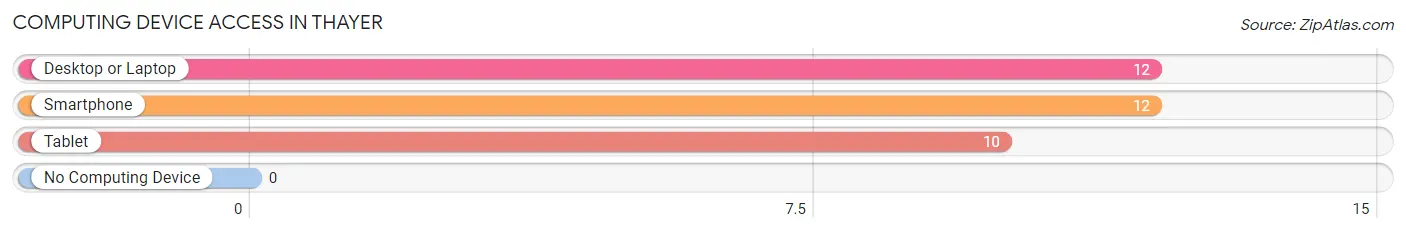
| Device Type | # Households | % Households |
| Desktop or Laptop | 12 | 92.3% |
| Smartphone | 12 | 92.3% |
| Tablet | 10 | 76.9% |
| No Computing Device | 0 | 0.0% |
| Total | 13 | 100.0% |
Internet Access in Thayer
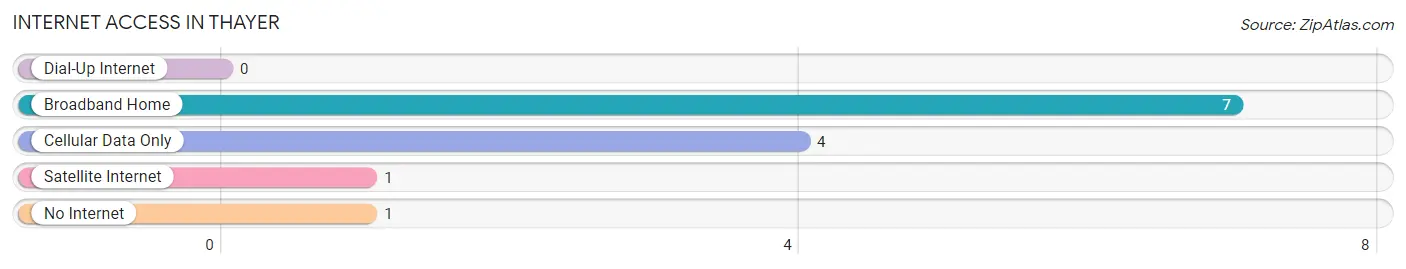
| Internet Type | # Households | % Households |
| Dial-Up Internet | 0 | 0.0% |
| Broadband Home | 7 | 53.8% |
| Cellular Data Only | 4 | 30.8% |
| Satellite Internet | 1 | 7.7% |
| No Internet | 1 | 7.7% |
| Total | 13 | 100.0% |
Thayer Summary
Thayer is a small city located in the state of Iowa, in the United States. It is situated in the southeastern corner of the state, in the county of Appanoose. The city has a population of approximately 1,000 people, and is part of the Centerville Micropolitan Statistical Area.
History
Thayer was founded in 1854 by a group of settlers from Ohio. The city was named after the Thayer family, who were among the first settlers. The city was incorporated in 1868, and the first mayor was elected in 1869.
The city was an important stop on the Chicago, Burlington and Quincy Railroad, which ran through the city from 1871 to 1971. The railroad was a major factor in the growth of the city, and it was also the site of a major train wreck in 1887.
Geography
Thayer is located in the southeastern corner of Iowa, in Appanoose County. The city is situated on the banks of the Chariton River, and is surrounded by rolling hills and farmland. The city is located approximately 50 miles south of Des Moines, the state capital.
The climate in Thayer is typical of the Midwest, with hot summers and cold winters. The average temperature in the summer is around 80 degrees Fahrenheit, and the average temperature in the winter is around 20 degrees Fahrenheit.
Economy
The economy of Thayer is largely based on agriculture. The city is home to several large farms, and the surrounding area is known for its production of corn, soybeans, and other crops. The city is also home to several small businesses, including a grocery store, a hardware store, and a few restaurants.
The city is also home to a small manufacturing sector, which produces a variety of products, including furniture, clothing, and automotive parts.
Demographics
As of the 2010 census, the population of Thayer was 1,000 people. The racial makeup of the city was 97.2% White, 0.7% African American, 0.3% Native American, 0.2% Asian, and 1.6% from other races. The median household income was $37,500, and the median family income was $45,000.
Thayer is a small city with a close-knit community. The city is home to several churches, and the local school district is highly rated. The city is also home to a number of parks and recreational facilities, including a public swimming pool and a golf course.
Common Questions
What is Per Capita Income in Thayer?
Per Capita income in Thayer is $29,402.
What is the Median Household income in Thayer?
Median Household Income in Thayer is $68,750.
What is Inequality or Gini Index in Thayer?
Inequality or Gini Index in Thayer is 0.36.
What is the Total Population of Thayer?
Total Population of Thayer is 43.
What is the Total Male Population of Thayer?
Total Male Population of Thayer is 21.
What is the Total Female Population of Thayer?
Total Female Population of Thayer is 22.
What is the Ratio of Males per 100 Females in Thayer?
There are 95.45 Males per 100 Females in Thayer.
What is the Ratio of Females per 100 Males in Thayer?
There are 104.76 Females per 100 Males in Thayer.
What is the Median Population Age in Thayer?
Median Population Age in Thayer is 31.4 Years.
What is the Average Family Size in Thayer
Average Family Size in Thayer is 4.8 People.
What is the Average Household Size in Thayer
Average Household Size in Thayer is 3.3 People.
How Large is the Labor Force in Thayer?
There are 17 People in the Labor Forcein in Thayer.
What is the Percentage of People in the Labor Force in Thayer?
63.0% of People are in the Labor Force in Thayer.
What is the Unemployment Rate in Thayer?
Unemployment Rate in Thayer is 5.9%.