Masonville, IA Map & Demographics
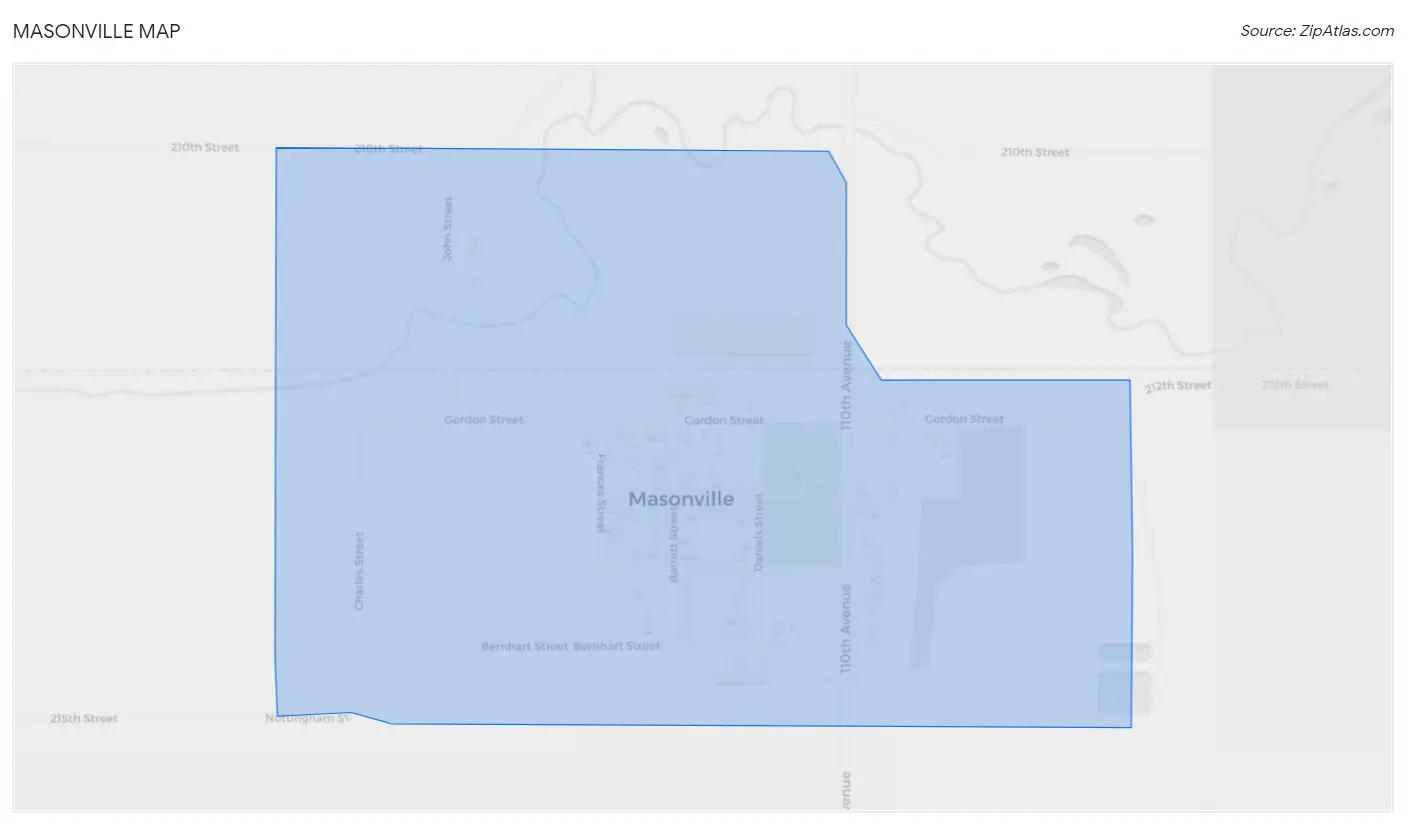
Masonville Map
Masonville Overview
$24,439
PER CAPITA INCOME
$48,750
AVG FAMILY INCOME
$42,813
AVG HOUSEHOLD INCOME
38.0%
WAGE / INCOME GAP [ % ]
62.0¢/ $1
WAGE / INCOME GAP [ $ ]
0.27
INEQUALITY / GINI INDEX
74
TOTAL POPULATION
42
MALE POPULATION
32
FEMALE POPULATION
131.25
MALES / 100 FEMALES
76.19
FEMALES / 100 MALES
46.0
MEDIAN AGE
2.8
AVG FAMILY SIZE
1.8
AVG HOUSEHOLD SIZE
42
LABOR FORCE [ PEOPLE ]
63.6%
PERCENT IN LABOR FORCE
2.4%
UNEMPLOYMENT RATE
Masonville Zip Codes
Income in Masonville
Income Overview in Masonville
Per Capita Income in Masonville is $24,439, while median incomes of families and households are $48,750 and $42,813 respectively.
| Characteristic | Number | Measure |
| Per Capita Income | 74 | $24,439 |
| Median Family Income | 17 | $48,750 |
| Mean Family Income | 17 | $55,941 |
| Median Household Income | 41 | $42,813 |
| Mean Household Income | 41 | $43,324 |
| Income Deficit | 17 | $0 |
| Wage / Income Gap (%) | 74 | 38.04% |
| Wage / Income Gap ($) | 74 | 61.96¢ per $1 |
| Gini / Inequality Index | 74 | 0.27 |
Earnings by Sex in Masonville
Average Earnings in Masonville are $31,500, $38,333 for men and $23,750 for women, a difference of 38.0%.
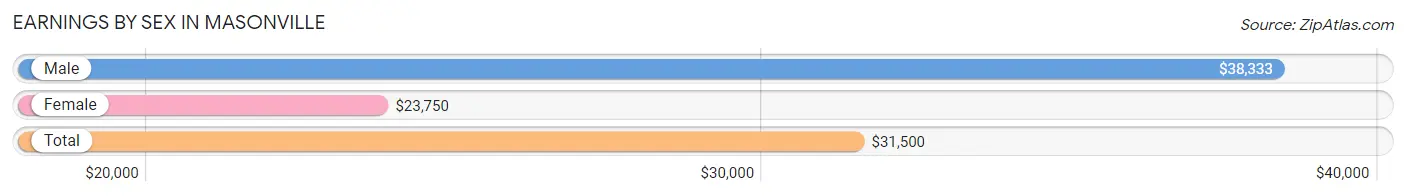
| Sex | Number | Average Earnings |
| Male | 26 (61.9%) | $38,333 |
| Female | 16 (38.1%) | $23,750 |
| Total | 42 (100.0%) | $31,500 |
Earnings by Sex by Income Bracket in Masonville
The most common earnings brackets in Masonville are $25,000 to $29,999 for men (6 | 23.1%) and $2,499 or less for women (4 | 25.0%).
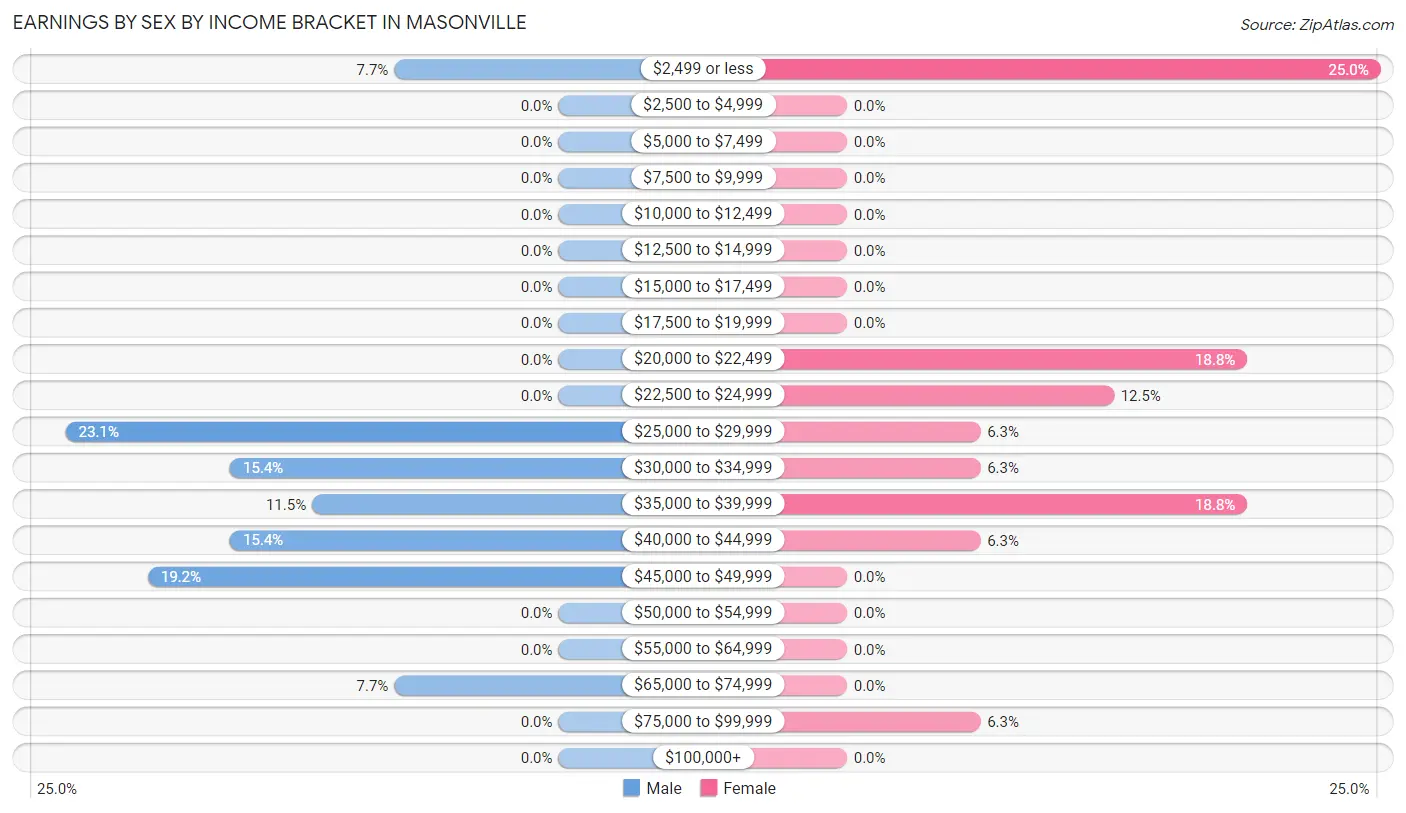
| Income | Male | Female |
| $2,499 or less | 2 (7.7%) | 4 (25.0%) |
| $2,500 to $4,999 | 0 (0.0%) | 0 (0.0%) |
| $5,000 to $7,499 | 0 (0.0%) | 0 (0.0%) |
| $7,500 to $9,999 | 0 (0.0%) | 0 (0.0%) |
| $10,000 to $12,499 | 0 (0.0%) | 0 (0.0%) |
| $12,500 to $14,999 | 0 (0.0%) | 0 (0.0%) |
| $15,000 to $17,499 | 0 (0.0%) | 0 (0.0%) |
| $17,500 to $19,999 | 0 (0.0%) | 0 (0.0%) |
| $20,000 to $22,499 | 0 (0.0%) | 3 (18.8%) |
| $22,500 to $24,999 | 0 (0.0%) | 2 (12.5%) |
| $25,000 to $29,999 | 6 (23.1%) | 1 (6.2%) |
| $30,000 to $34,999 | 4 (15.4%) | 1 (6.2%) |
| $35,000 to $39,999 | 3 (11.5%) | 3 (18.8%) |
| $40,000 to $44,999 | 4 (15.4%) | 1 (6.2%) |
| $45,000 to $49,999 | 5 (19.2%) | 0 (0.0%) |
| $50,000 to $54,999 | 0 (0.0%) | 0 (0.0%) |
| $55,000 to $64,999 | 0 (0.0%) | 0 (0.0%) |
| $65,000 to $74,999 | 2 (7.7%) | 0 (0.0%) |
| $75,000 to $99,999 | 0 (0.0%) | 1 (6.2%) |
| $100,000+ | 0 (0.0%) | 0 (0.0%) |
| Total | 26 (100.0%) | 16 (100.0%) |
Earnings by Sex by Educational Attainment in Masonville
Average earnings in Masonville are $41,250 for men and $28,750 for women, a difference of 30.3%. Men with an educational attainment of college or associate's degree enjoy the highest average annual earnings of $44,375, while those with high school diploma education earn the least with $38,750. Women with an educational attainment of high school diploma earn the most with the average annual earnings of $23,750, while those with high school diploma education have the smallest earnings of $23,750.
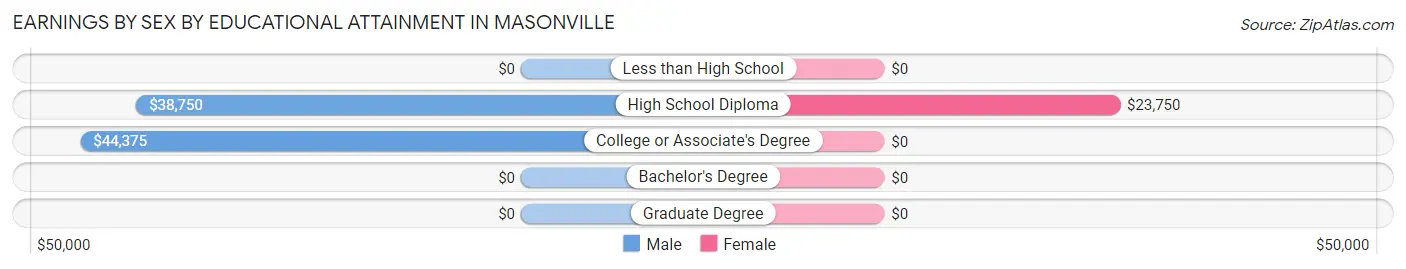
| Educational Attainment | Male Income | Female Income |
| Less than High School | - | - |
| High School Diploma | $38,750 | $23,750 |
| College or Associate's Degree | $44,375 | $0 |
| Bachelor's Degree | - | - |
| Graduate Degree | - | - |
| Total | $41,250 | $28,750 |
Family Income in Masonville
Family Income Brackets in Masonville
According to the Masonville family income data, there are 8 families falling into the $35,000 to $49,999 income range, which is the most common income bracket and makes up 47.1% of all families.
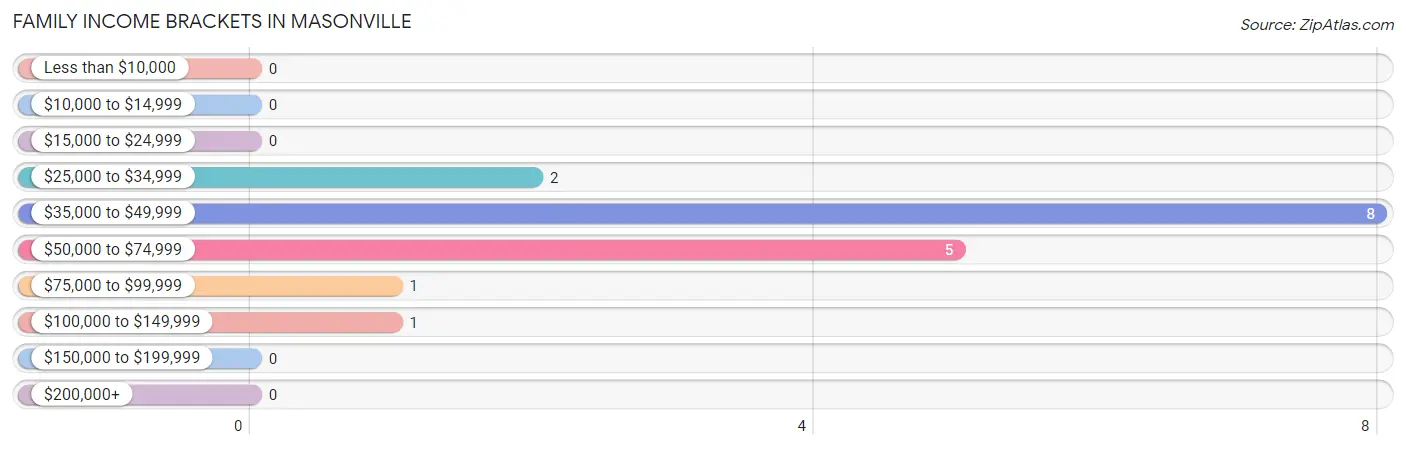
| Income Bracket | # Families | % Families |
| Less than $10,000 | 0 | 0.0% |
| $10,000 to $14,999 | 0 | 0.0% |
| $15,000 to $24,999 | 0 | 0.0% |
| $25,000 to $34,999 | 2 | 11.8% |
| $35,000 to $49,999 | 8 | 47.1% |
| $50,000 to $74,999 | 5 | 29.4% |
| $75,000 to $99,999 | 1 | 5.9% |
| $100,000 to $149,999 | 1 | 5.9% |
| $150,000 to $199,999 | 0 | 0.0% |
| $200,000+ | 0 | 0.0% |
Family Income by Famaliy Size in Masonville
2-person families (11 | 64.7%) account for the highest median family income in Masonville with $47,917 per family, while 2-person families (11 | 64.7%) have the highest median income of $23,958 per family member.
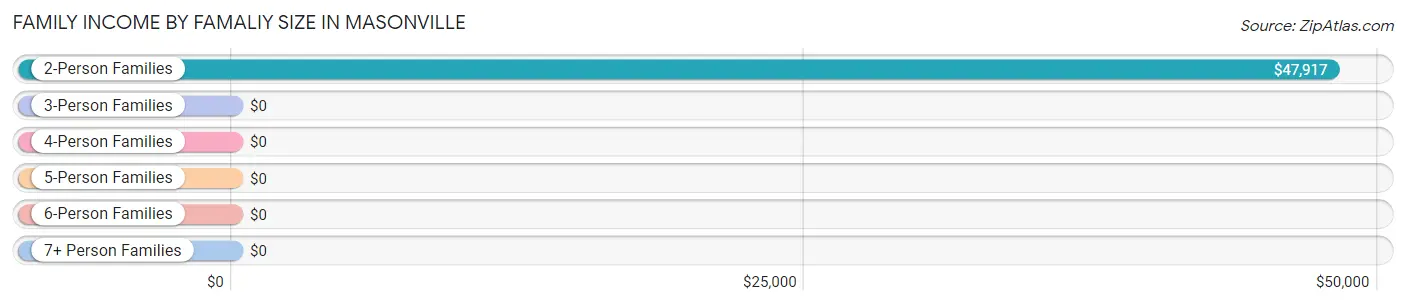
| Income Bracket | # Families | Median Income |
| 2-Person Families | 11 (64.7%) | $47,917 |
| 3-Person Families | 1 (5.9%) | $0 |
| 4-Person Families | 3 (17.6%) | $0 |
| 5-Person Families | 2 (11.8%) | $0 |
| 6-Person Families | 0 (0.0%) | $0 |
| 7+ Person Families | 0 (0.0%) | $0 |
| Total | 17 (100.0%) | $48,750 |
Family Income by Number of Earners in Masonville
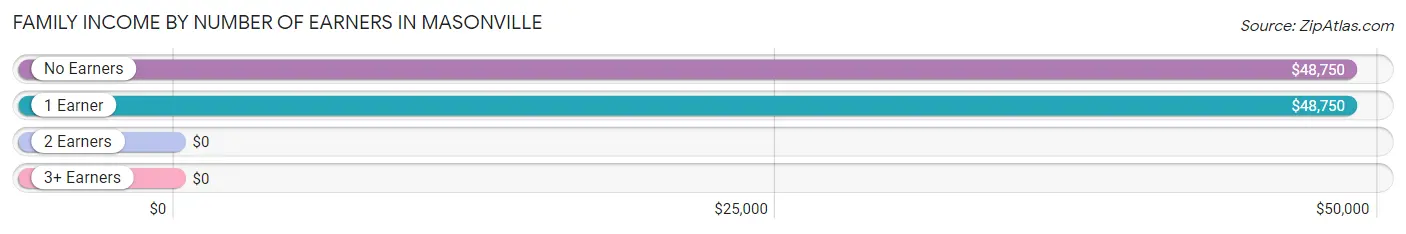
| Number of Earners | # Families | Median Income |
| No Earners | 3 (17.6%) | $48,750 |
| 1 Earner | 10 (58.8%) | $48,750 |
| 2 Earners | 3 (17.6%) | $0 |
| 3+ Earners | 1 (5.9%) | $0 |
| Total | 17 (100.0%) | $48,750 |
Household Income in Masonville
Household Income Brackets in Masonville
With 20 households falling in the category, the $35,000 to $49,999 income range is the most frequent in Masonville, accounting for 48.8% of all households.
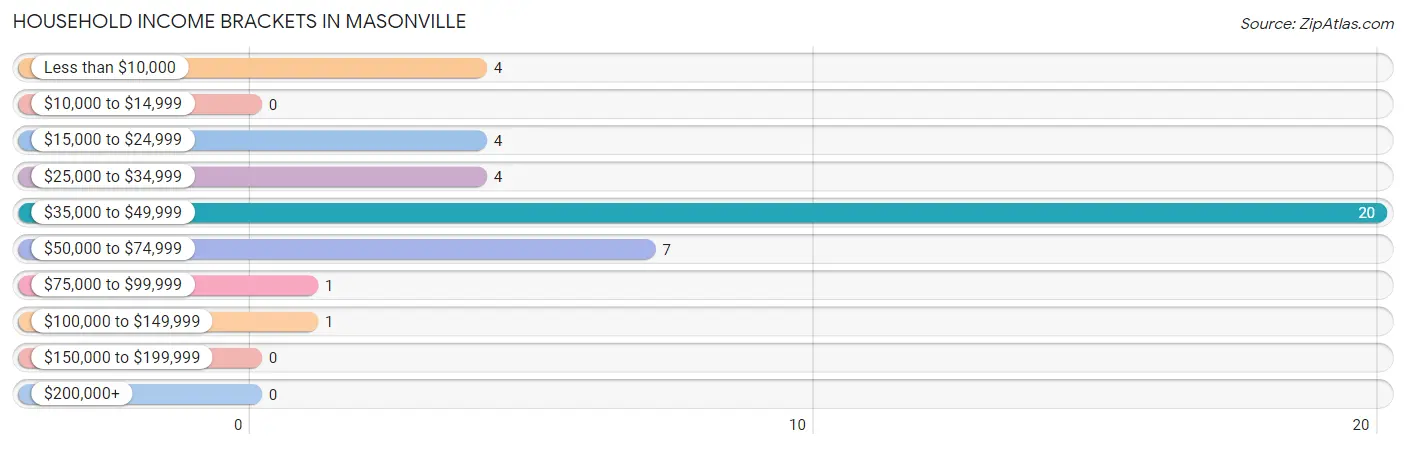
| Income Bracket | # Households | % Households |
| Less than $10,000 | 4 | 9.8% |
| $10,000 to $14,999 | 0 | 0.0% |
| $15,000 to $24,999 | 4 | 9.8% |
| $25,000 to $34,999 | 4 | 9.8% |
| $35,000 to $49,999 | 20 | 48.8% |
| $50,000 to $74,999 | 7 | 17.1% |
| $75,000 to $99,999 | 1 | 2.4% |
| $100,000 to $149,999 | 1 | 2.4% |
| $150,000 to $199,999 | 0 | 0.0% |
| $200,000+ | 0 | 0.0% |
Household Income by Householder Age in Masonville
The median household income in Masonville is $42,813, with the highest median household income of $43,750 found in the 65+ years age bracket for the primary householder. A total of 12 households (29.3%) fall into this category. Meanwhile, the 15 to 24 years age bracket for the primary householder has the lowest median household income of $0, with 2 households (4.9%) in this group.
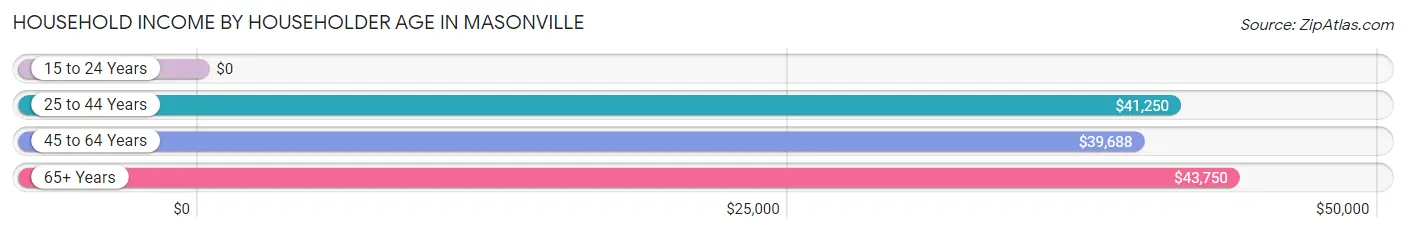
| Income Bracket | # Households | Median Income |
| 15 to 24 Years | 2 (4.9%) | $0 |
| 25 to 44 Years | 14 (34.2%) | $41,250 |
| 45 to 64 Years | 13 (31.7%) | $39,688 |
| 65+ Years | 12 (29.3%) | $43,750 |
| Total | 41 (100.0%) | $42,813 |
Poverty in Masonville
Income Below Poverty by Sex and Age in Masonville
With 9.5% poverty level for males and 6.2% for females among the residents of Masonville, 65 to 74 year old males and 18 to 24 year old females are the most vulnerable to poverty, with 4 males (44.4%) and 2 females (40.0%) in their respective age groups living below the poverty level.
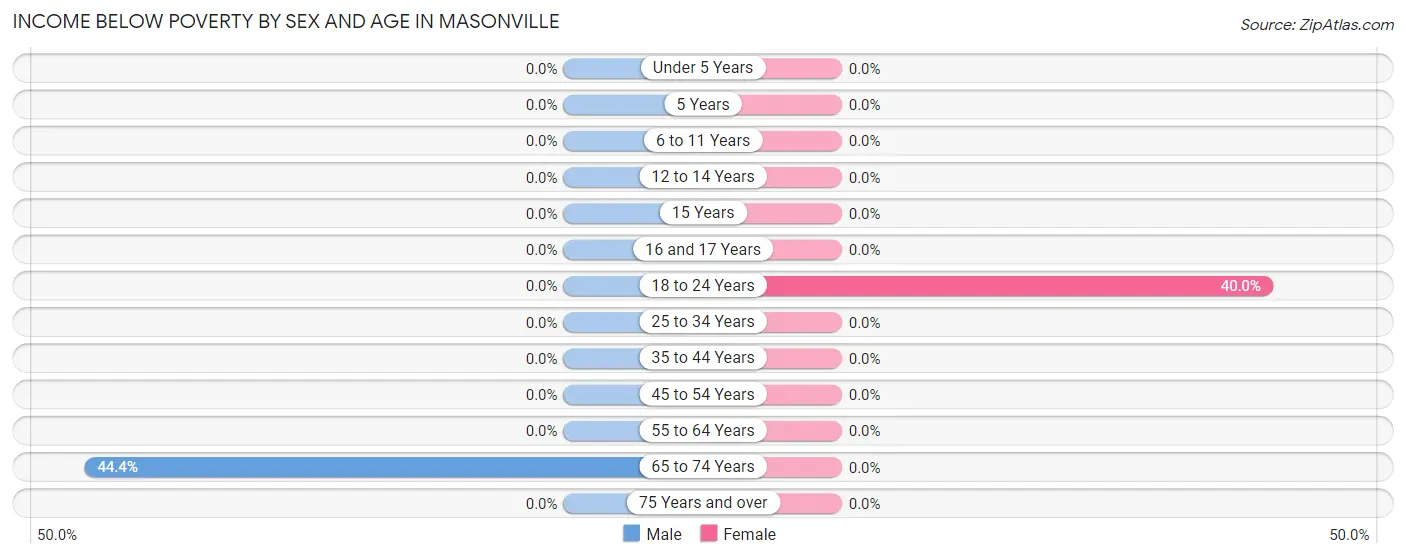
| Age Bracket | Male | Female |
| Under 5 Years | 0 (0.0%) | 0 (0.0%) |
| 5 Years | 0 (0.0%) | 0 (0.0%) |
| 6 to 11 Years | 0 (0.0%) | 0 (0.0%) |
| 12 to 14 Years | 0 (0.0%) | 0 (0.0%) |
| 15 Years | 0 (0.0%) | 0 (0.0%) |
| 16 and 17 Years | 0 (0.0%) | 0 (0.0%) |
| 18 to 24 Years | 0 (0.0%) | 2 (40.0%) |
| 25 to 34 Years | 0 (0.0%) | 0 (0.0%) |
| 35 to 44 Years | 0 (0.0%) | 0 (0.0%) |
| 45 to 54 Years | 0 (0.0%) | 0 (0.0%) |
| 55 to 64 Years | 0 (0.0%) | 0 (0.0%) |
| 65 to 74 Years | 4 (44.4%) | 0 (0.0%) |
| 75 Years and over | 0 (0.0%) | 0 (0.0%) |
| Total | 4 (9.5%) | 2 (6.2%) |
Income Above Poverty by Sex and Age in Masonville
According to the poverty statistics in Masonville, males aged under 5 years and females aged under 5 years are the age groups that are most secure financially, with 100.0% of males and 100.0% of females in these age groups living above the poverty line.
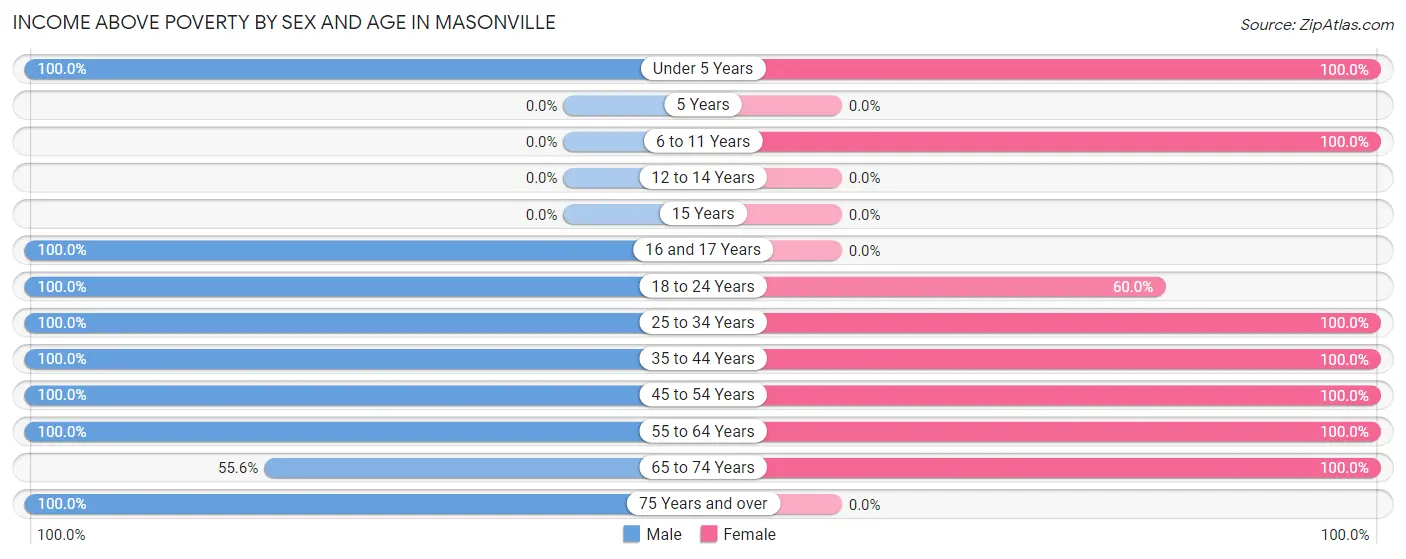
| Age Bracket | Male | Female |
| Under 5 Years | 3 (100.0%) | 4 (100.0%) |
| 5 Years | 0 (0.0%) | 0 (0.0%) |
| 6 to 11 Years | 0 (0.0%) | 1 (100.0%) |
| 12 to 14 Years | 0 (0.0%) | 0 (0.0%) |
| 15 Years | 0 (0.0%) | 0 (0.0%) |
| 16 and 17 Years | 2 (100.0%) | 0 (0.0%) |
| 18 to 24 Years | 2 (100.0%) | 3 (60.0%) |
| 25 to 34 Years | 5 (100.0%) | 2 (100.0%) |
| 35 to 44 Years | 4 (100.0%) | 9 (100.0%) |
| 45 to 54 Years | 8 (100.0%) | 1 (100.0%) |
| 55 to 64 Years | 6 (100.0%) | 2 (100.0%) |
| 65 to 74 Years | 5 (55.6%) | 8 (100.0%) |
| 75 Years and over | 3 (100.0%) | 0 (0.0%) |
| Total | 38 (90.5%) | 30 (93.8%) |
Income Below Poverty Among Married-Couple Families in Masonville
| Children | Above Poverty | Below Poverty |
| No Children | 9 (100.0%) | 0 (0.0%) |
| 1 or 2 Children | 1 (100.0%) | 0 (0.0%) |
| 3 or 4 Children | 2 (100.0%) | 0 (0.0%) |
| 5 or more Children | 0 (0.0%) | 0 (0.0%) |
| Total | 12 (100.0%) | 0 (0.0%) |
Income Below Poverty Among Single-Parent Households in Masonville
| Children | Single Father | Single Mother |
| No Children | 0 (0.0%) | 0 (0.0%) |
| 1 or 2 Children | 0 (0.0%) | 0 (0.0%) |
| 3 or 4 Children | 0 (0.0%) | 0 (0.0%) |
| 5 or more Children | 0 (0.0%) | 0 (0.0%) |
| Total | 0 (0.0%) | 0 (0.0%) |
Income Below Poverty Among Married-Couple vs Single-Parent Households in Masonville
| Children | Married-Couple Families | Single-Parent Households |
| No Children | 0 (0.0%) | 0 (0.0%) |
| 1 or 2 Children | 0 (0.0%) | 0 (0.0%) |
| 3 or 4 Children | 0 (0.0%) | 0 (0.0%) |
| 5 or more Children | 0 (0.0%) | 0 (0.0%) |
| Total | 0 (0.0%) | 0 (0.0%) |
Race in Masonville
The most populous races in Masonville are White / Caucasian (70 | 94.6%), and Two or more Races (4 | 5.4%).
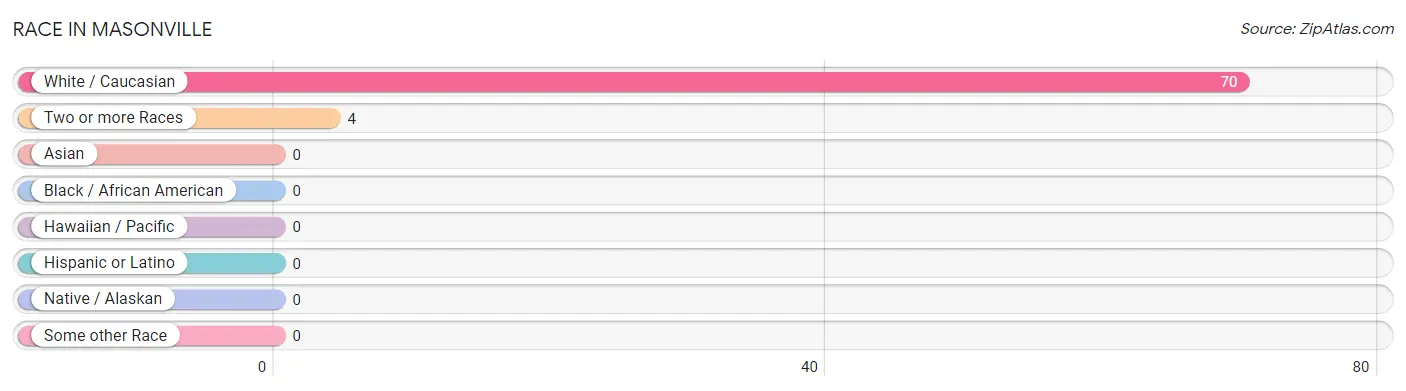
| Race | # Population | % Population |
| Asian | 0 | 0.0% |
| Black / African American | 0 | 0.0% |
| Hawaiian / Pacific | 0 | 0.0% |
| Hispanic or Latino | 0 | 0.0% |
| Native / Alaskan | 0 | 0.0% |
| White / Caucasian | 70 | 94.6% |
| Two or more Races | 4 | 5.4% |
| Some other Race | 0 | 0.0% |
| Total | 74 | 100.0% |
Ancestry in Masonville
The most populous ancestries reported in Masonville are German (32 | 43.2%), Irish (14 | 18.9%), English (8 | 10.8%), American (6 | 8.1%), and Swedish (4 | 5.4%), together accounting for 86.5% of all Masonville residents.
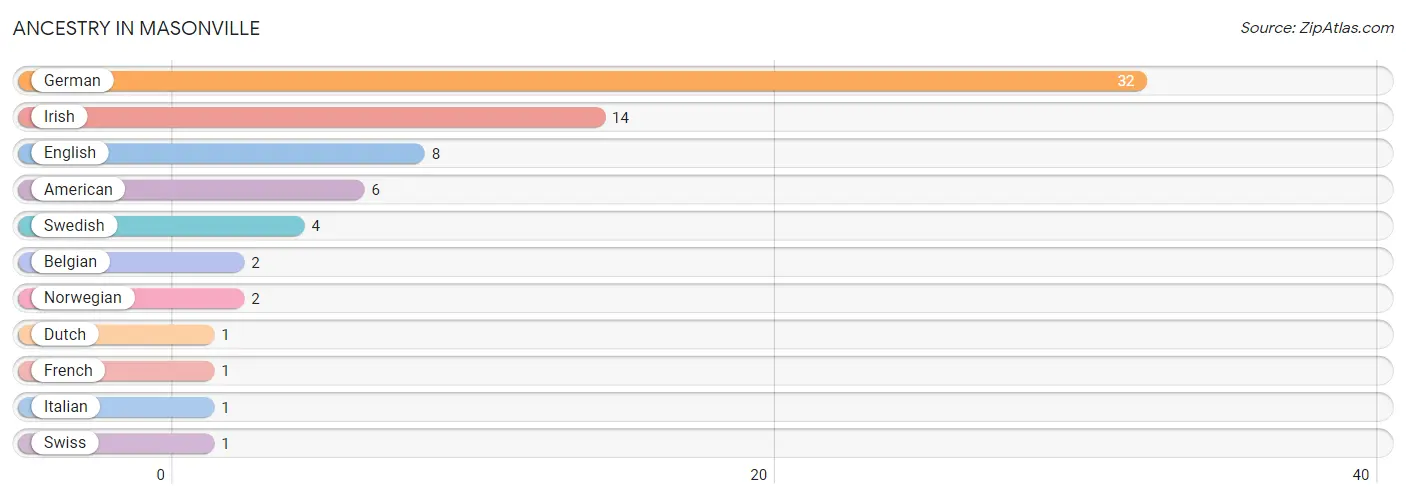
| Ancestry | # Population | % Population |
| American | 6 | 8.1% |
| Belgian | 2 | 2.7% |
| Dutch | 1 | 1.3% |
| English | 8 | 10.8% |
| French | 1 | 1.3% |
| German | 32 | 43.2% |
| Irish | 14 | 18.9% |
| Italian | 1 | 1.3% |
| Norwegian | 2 | 2.7% |
| Swedish | 4 | 5.4% |
| Swiss | 1 | 1.3% | View All 11 Rows |
Immigrants in Masonville

| Immigration Origin | # Population | % Population | View All 0 Rows |
Sex and Age in Masonville
Sex and Age in Masonville
The most populous age groups in Masonville are 65 to 69 Years (6 | 14.3%) for men and 35 to 39 Years (6 | 18.8%) for women.
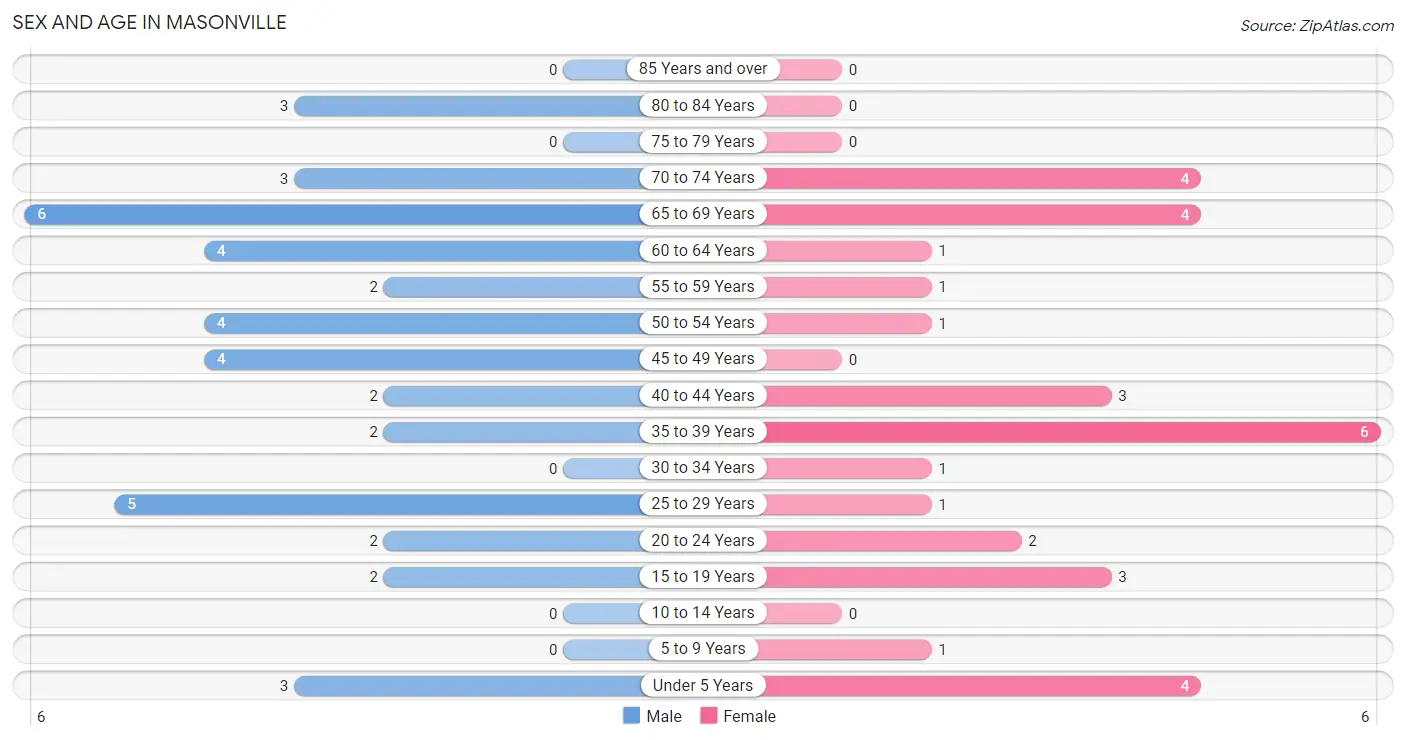
| Age Bracket | Male | Female |
| Under 5 Years | 3 (7.1%) | 4 (12.5%) |
| 5 to 9 Years | 0 (0.0%) | 1 (3.1%) |
| 10 to 14 Years | 0 (0.0%) | 0 (0.0%) |
| 15 to 19 Years | 2 (4.8%) | 3 (9.4%) |
| 20 to 24 Years | 2 (4.8%) | 2 (6.2%) |
| 25 to 29 Years | 5 (11.9%) | 1 (3.1%) |
| 30 to 34 Years | 0 (0.0%) | 1 (3.1%) |
| 35 to 39 Years | 2 (4.8%) | 6 (18.8%) |
| 40 to 44 Years | 2 (4.8%) | 3 (9.4%) |
| 45 to 49 Years | 4 (9.5%) | 0 (0.0%) |
| 50 to 54 Years | 4 (9.5%) | 1 (3.1%) |
| 55 to 59 Years | 2 (4.8%) | 1 (3.1%) |
| 60 to 64 Years | 4 (9.5%) | 1 (3.1%) |
| 65 to 69 Years | 6 (14.3%) | 4 (12.5%) |
| 70 to 74 Years | 3 (7.1%) | 4 (12.5%) |
| 75 to 79 Years | 0 (0.0%) | 0 (0.0%) |
| 80 to 84 Years | 3 (7.1%) | 0 (0.0%) |
| 85 Years and over | 0 (0.0%) | 0 (0.0%) |
| Total | 42 (100.0%) | 32 (100.0%) |
Families and Households in Masonville
Median Family Size in Masonville
The median family size in Masonville is 2.76 persons per family, with married-couple families (12 | 70.6%) accounting for the largest median family size of 2.92 persons per family. On the other hand, single female/mother families (1 | 5.9%) represent the smallest median family size with 2.00 persons per family.
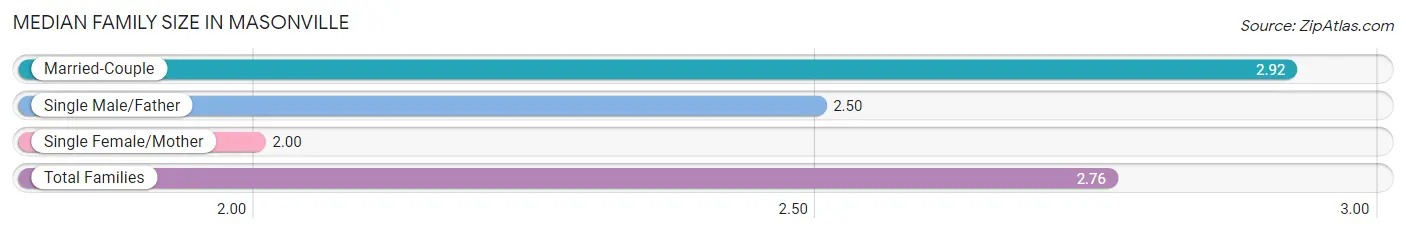
| Family Type | # Families | Family Size |
| Married-Couple | 12 (70.6%) | 2.92 |
| Single Male/Father | 4 (23.5%) | 2.50 |
| Single Female/Mother | 1 (5.9%) | 2.00 |
| Total Families | 17 (100.0%) | 2.76 |
Median Household Size in Masonville
The median household size in Masonville is 1.80 persons per household, with single male/father households (4 | 9.8%) accounting for the largest median household size of 3 persons per household. non-family households (24 | 58.5%) represent the smallest median household size with 1.04 persons per household.
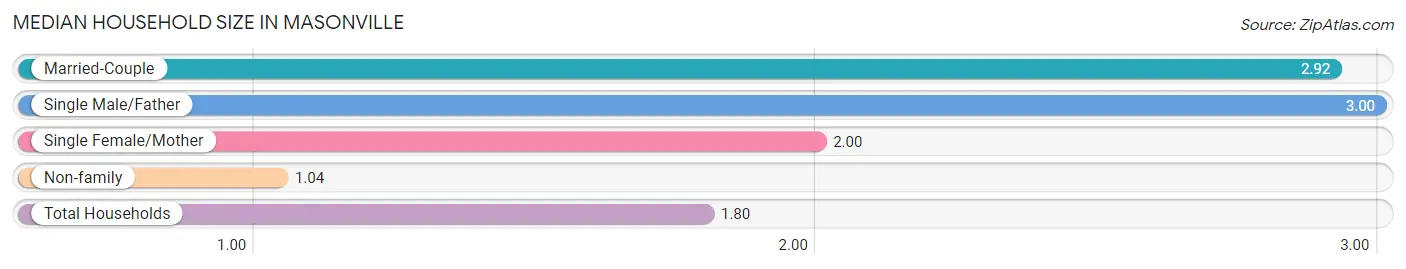
| Household Type | # Households | Household Size |
| Married-Couple | 12 (29.3%) | 2.92 |
| Single Male/Father | 4 (9.8%) | 3.00 |
| Single Female/Mother | 1 (2.4%) | 2.00 |
| Non-family | 24 (58.5%) | 1.04 |
| Total Households | 41 (100.0%) | 1.80 |
Household Size by Marriage Status in Masonville
Out of a total of 41 households in Masonville, 17 (41.5%) are family households, while 24 (58.5%) are nonfamily households. The most numerous type of family households are 2-person households, comprising 11, and the most common type of nonfamily households are 1-person households, comprising 22.
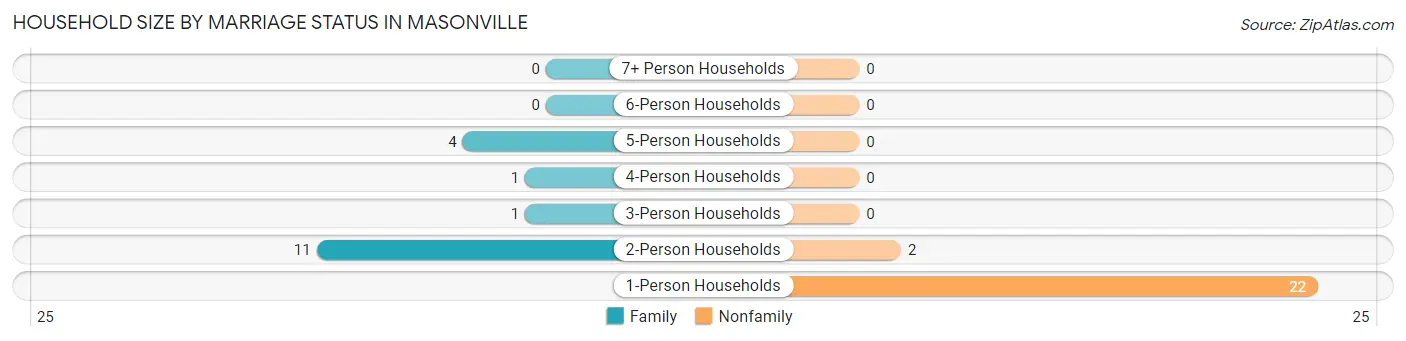
| Household Size | Family Households | Nonfamily Households |
| 1-Person Households | - | 22 (53.7%) |
| 2-Person Households | 11 (26.8%) | 2 (4.9%) |
| 3-Person Households | 1 (2.4%) | 0 (0.0%) |
| 4-Person Households | 1 (2.4%) | 0 (0.0%) |
| 5-Person Households | 4 (9.8%) | 0 (0.0%) |
| 6-Person Households | 0 (0.0%) | 0 (0.0%) |
| 7+ Person Households | 0 (0.0%) | 0 (0.0%) |
| Total | 17 (41.5%) | 24 (58.5%) |
Female Fertility in Masonville
Fertility by Age in Masonville
Average fertility rate in Masonville is 188.0 births per 1,000 women. Women in the age bracket of 20 to 34 years have the highest fertility rate with 250.0 births per 1,000 women. Women in the age bracket of 35 to 50 years acount for 66.7% of all women with births.
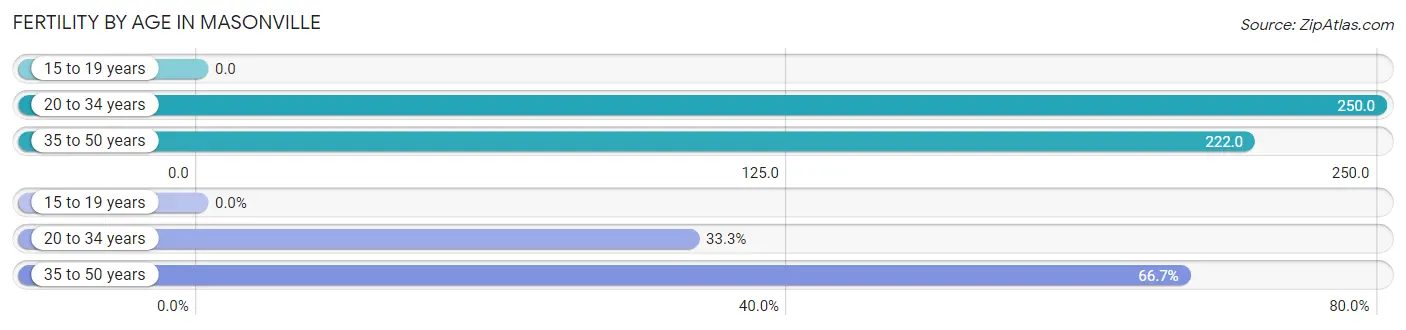
| Age Bracket | Women with Births | Births / 1,000 Women |
| 15 to 19 years | 0 (0.0%) | 0.0 |
| 20 to 34 years | 1 (33.3%) | 250.0 |
| 35 to 50 years | 2 (66.7%) | 222.0 |
| Total | 3 (100.0%) | 188.0 |
Fertility by Age by Marriage Status in Masonville
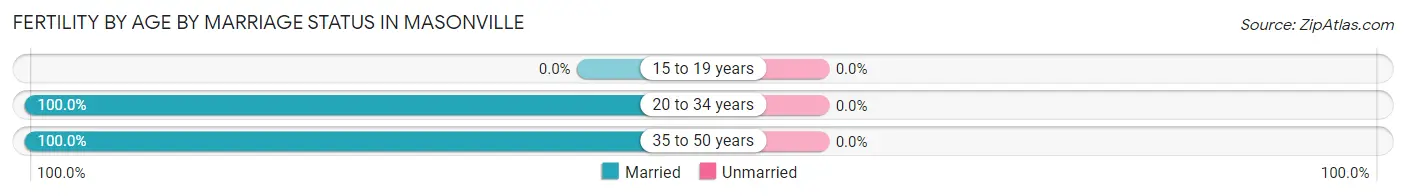
| Age Bracket | Married | Unmarried |
| 15 to 19 years | 0 (0.0%) | 0 (0.0%) |
| 20 to 34 years | 1 (100.0%) | 0 (0.0%) |
| 35 to 50 years | 2 (100.0%) | 0 (0.0%) |
| Total | 3 (100.0%) | 0 (0.0%) |
Fertility by Education in Masonville
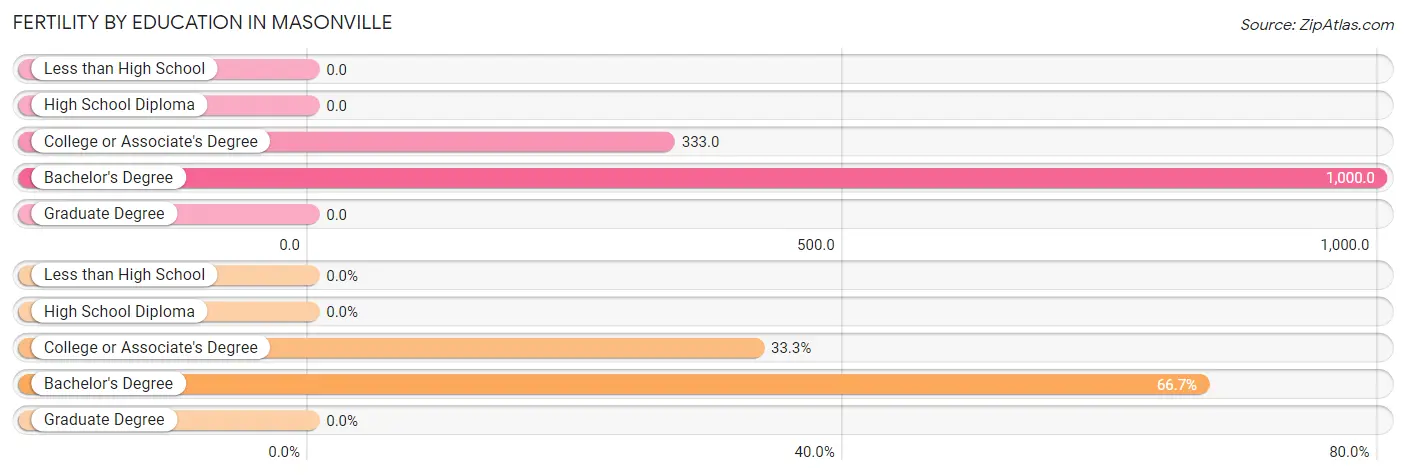
| Educational Attainment | Women with Births | Births / 1,000 Women |
| Less than High School | 0 (0.0%) | 0.0 |
| High School Diploma | 0 (0.0%) | 0.0 |
| College or Associate's Degree | 1 (33.3%) | 333.0 |
| Bachelor's Degree | 2 (66.7%) | 1,000.0 |
| Graduate Degree | 0 (0.0%) | 0.0 |
| Total | 3 (100.0%) | 188.0 |
Fertility by Education by Marriage Status in Masonville
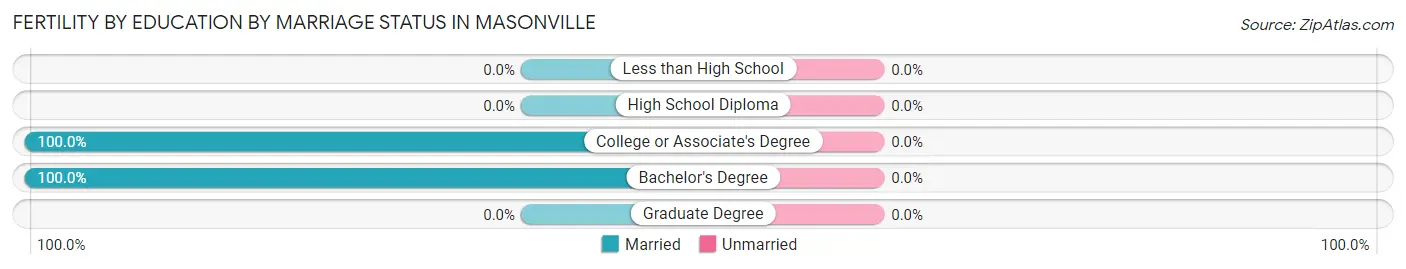
| Educational Attainment | Married | Unmarried |
| Less than High School | 0 (0.0%) | 0 (0.0%) |
| High School Diploma | 0 (0.0%) | 0 (0.0%) |
| College or Associate's Degree | 1 (100.0%) | 0 (0.0%) |
| Bachelor's Degree | 2 (100.0%) | 0 (0.0%) |
| Graduate Degree | 0 (0.0%) | 0 (0.0%) |
| Total | 3 (100.0%) | 0 (0.0%) |
Employment Characteristics in Masonville
Employment by Class of Employer in Masonville
Among the 41 employed individuals in Masonville, private company employees (35 | 85.4%), not-for-profit organizations (2 | 4.9%), and local government employees (2 | 4.9%) make up the most common classes of employment.
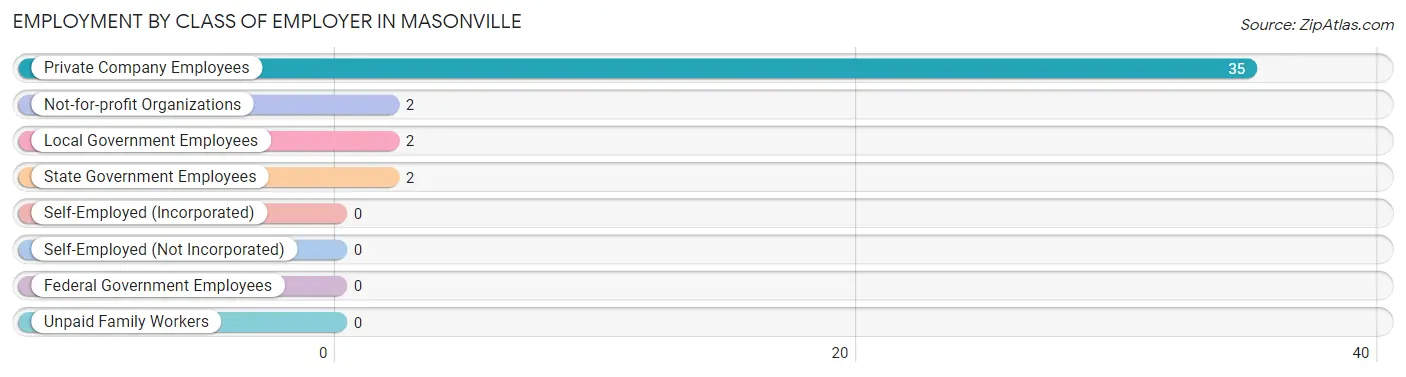
| Employer Class | # Employees | % Employees |
| Private Company Employees | 35 | 85.4% |
| Self-Employed (Incorporated) | 0 | 0.0% |
| Self-Employed (Not Incorporated) | 0 | 0.0% |
| Not-for-profit Organizations | 2 | 4.9% |
| Local Government Employees | 2 | 4.9% |
| State Government Employees | 2 | 4.9% |
| Federal Government Employees | 0 | 0.0% |
| Unpaid Family Workers | 0 | 0.0% |
| Total | 41 | 100.0% |
Employment Status by Age in Masonville
According to the labor force statistics for Masonville, out of the total population over 16 years of age (66), 63.6% or 42 individuals are in the labor force, with 2.4% or 1 of them unemployed. The age group with the highest labor force participation rate is 16 to 19 years, with 100.0% or 5 individuals in the labor force. Within the labor force, the 65 to 74 years age range has the highest percentage of unemployed individuals, with 20.0% or 1 of them being unemployed.
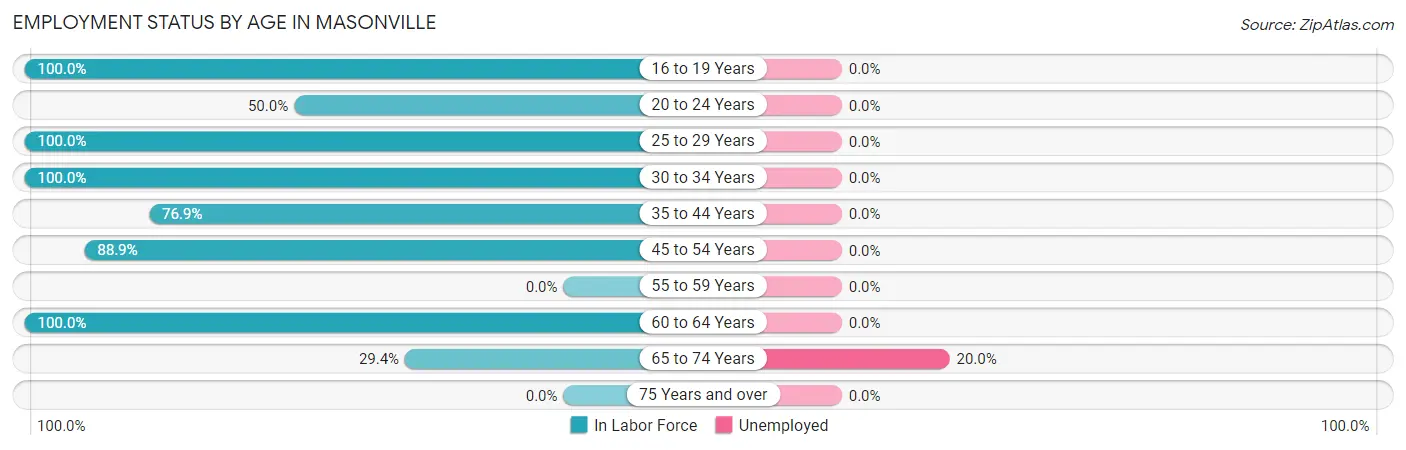
| Age Bracket | In Labor Force | Unemployed |
| 16 to 19 Years | 5 (100.0%) | 0 (0.0%) |
| 20 to 24 Years | 2 (50.0%) | 0 (0.0%) |
| 25 to 29 Years | 6 (100.0%) | 0 (0.0%) |
| 30 to 34 Years | 1 (100.0%) | 0 (0.0%) |
| 35 to 44 Years | 10 (76.9%) | 0 (0.0%) |
| 45 to 54 Years | 8 (88.9%) | 0 (0.0%) |
| 55 to 59 Years | 0 (0.0%) | 0 (0.0%) |
| 60 to 64 Years | 5 (100.0%) | 0 (0.0%) |
| 65 to 74 Years | 5 (29.4%) | 1 (20.0%) |
| 75 Years and over | 0 (0.0%) | 0 (0.0%) |
| Total | 42 (63.6%) | 1 (2.4%) |
Employment Status by Educational Attainment in Masonville
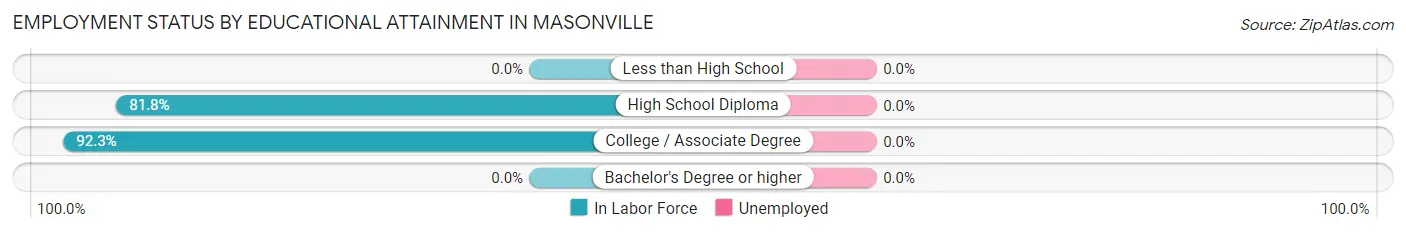
| Educational Attainment | In Labor Force | Unemployed |
| Less than High School | 0 (0.0%) | 0 (0.0%) |
| High School Diploma | 18 (81.8%) | 0 (0.0%) |
| College / Associate Degree | 12 (92.3%) | 0 (0.0%) |
| Bachelor's Degree or higher | 0 (0.0%) | 0 (0.0%) |
| Total | 30 (81.1%) | 0 (0.0%) |
Employment Occupations by Sex in Masonville
Management, Business, Science and Arts Occupations
The most common Management, Business, Science and Arts occupations in Masonville are Computers, Engineering & Science (3 | 7.3%), Architecture & Engineering (3 | 7.3%), and Management (2 | 4.9%).
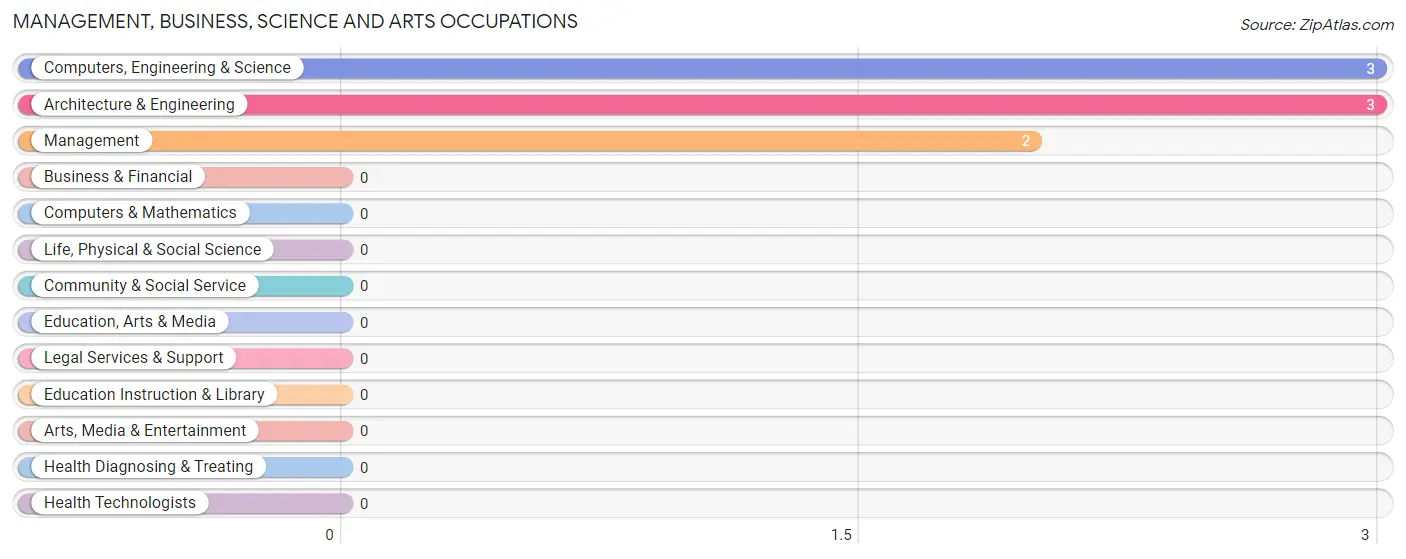
Management, Business, Science and Arts Occupations by Sex
Within the Management, Business, Science and Arts occupations in Masonville, the most male-oriented occupations are Management (100.0%), Computers, Engineering & Science (66.7%), and Architecture & Engineering (66.7%), while the most female-oriented occupations are Computers, Engineering & Science (33.3%), and Architecture & Engineering (33.3%).
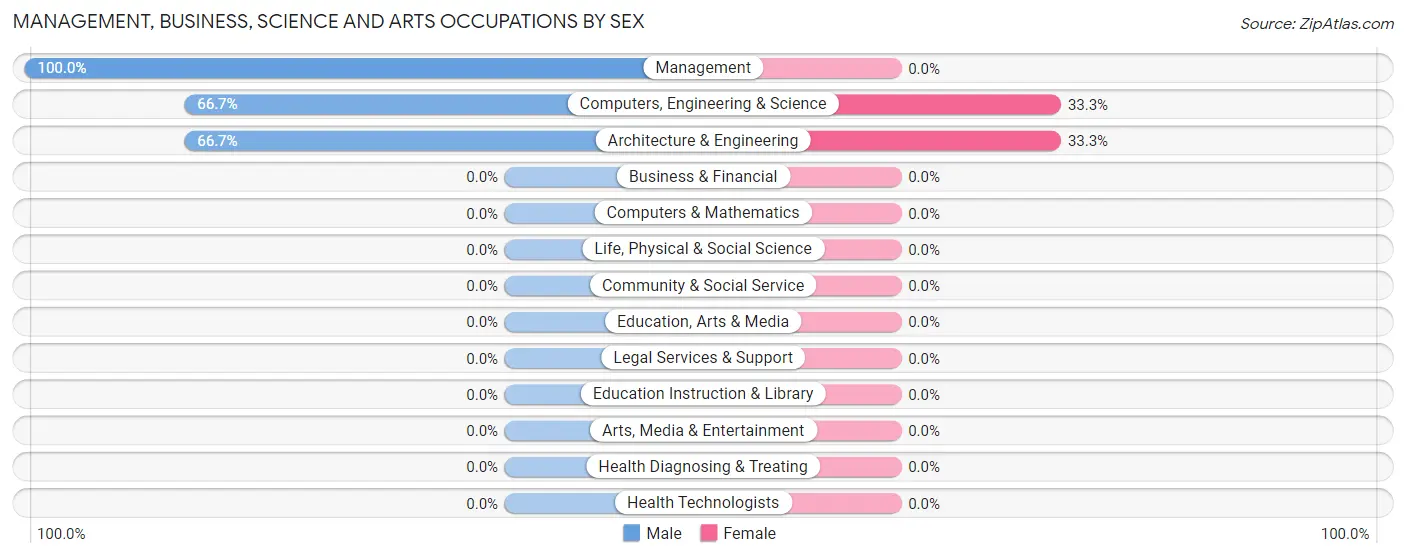
| Occupation | Male | Female |
| Management | 2 (100.0%) | 0 (0.0%) |
| Business & Financial | 0 (0.0%) | 0 (0.0%) |
| Computers, Engineering & Science | 2 (66.7%) | 1 (33.3%) |
| Computers & Mathematics | 0 (0.0%) | 0 (0.0%) |
| Architecture & Engineering | 2 (66.7%) | 1 (33.3%) |
| Life, Physical & Social Science | 0 (0.0%) | 0 (0.0%) |
| Community & Social Service | 0 (0.0%) | 0 (0.0%) |
| Education, Arts & Media | 0 (0.0%) | 0 (0.0%) |
| Legal Services & Support | 0 (0.0%) | 0 (0.0%) |
| Education Instruction & Library | 0 (0.0%) | 0 (0.0%) |
| Arts, Media & Entertainment | 0 (0.0%) | 0 (0.0%) |
| Health Diagnosing & Treating | 0 (0.0%) | 0 (0.0%) |
| Health Technologists | 0 (0.0%) | 0 (0.0%) |
| Total (Category) | 4 (80.0%) | 1 (20.0%) |
| Total (Overall) | 26 (63.4%) | 15 (36.6%) |
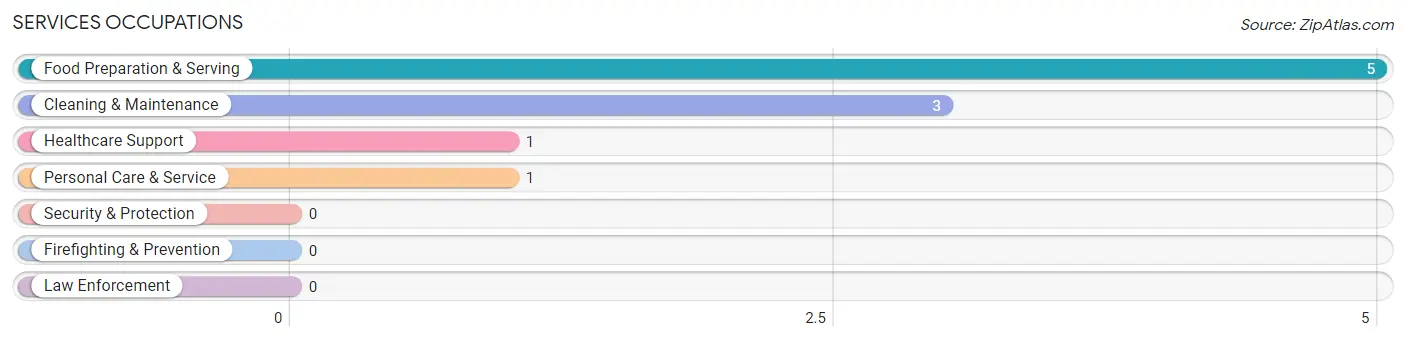
Services Occupations
The most common Services occupations in Masonville are Food Preparation & Serving (5 | 12.2%), Cleaning & Maintenance (3 | 7.3%), Healthcare Support (1 | 2.4%), and Personal Care & Service (1 | 2.4%).
Services Occupations by Sex
Within the Services occupations in Masonville, the most male-oriented occupations are Cleaning & Maintenance (100.0%), and Food Preparation & Serving (40.0%), while the most female-oriented occupations are Healthcare Support (100.0%), Personal Care & Service (100.0%), and Food Preparation & Serving (60.0%).
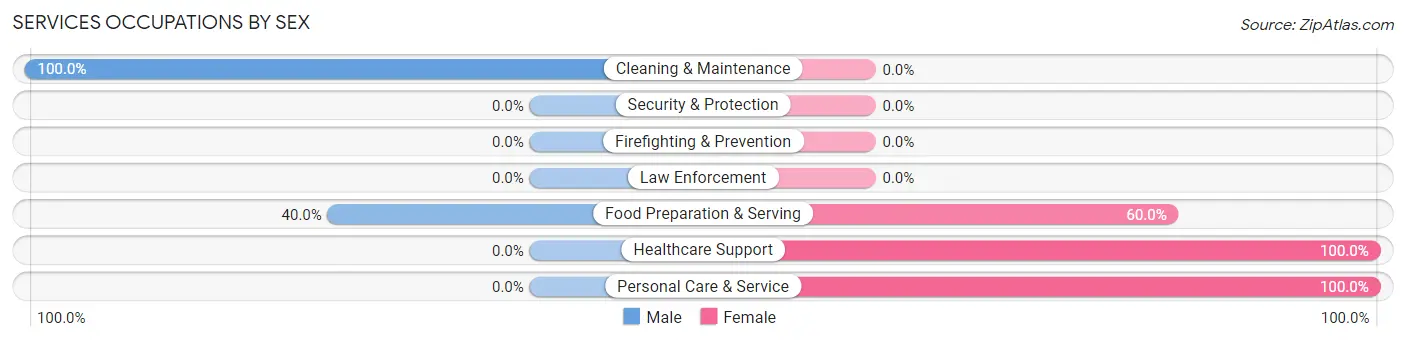
| Occupation | Male | Female |
| Healthcare Support | 0 (0.0%) | 1 (100.0%) |
| Security & Protection | 0 (0.0%) | 0 (0.0%) |
| Firefighting & Prevention | 0 (0.0%) | 0 (0.0%) |
| Law Enforcement | 0 (0.0%) | 0 (0.0%) |
| Food Preparation & Serving | 2 (40.0%) | 3 (60.0%) |
| Cleaning & Maintenance | 3 (100.0%) | 0 (0.0%) |
| Personal Care & Service | 0 (0.0%) | 1 (100.0%) |
| Total (Category) | 5 (50.0%) | 5 (50.0%) |
| Total (Overall) | 26 (63.4%) | 15 (36.6%) |
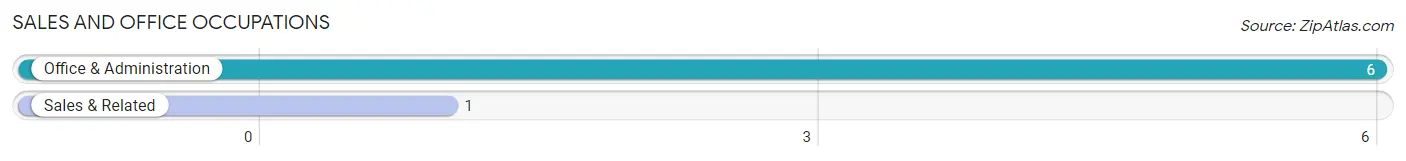
Sales and Office Occupations
The most common Sales and Office occupations in Masonville are Office & Administration (6 | 14.6%), and Sales & Related (1 | 2.4%).
Sales and Office Occupations by Sex
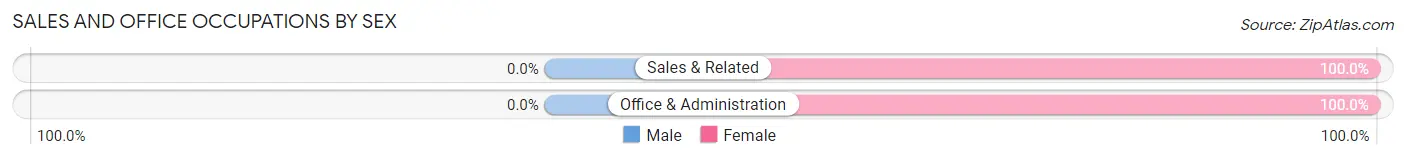
| Occupation | Male | Female |
| Sales & Related | 0 (0.0%) | 1 (100.0%) |
| Office & Administration | 0 (0.0%) | 6 (100.0%) |
| Total (Category) | 0 (0.0%) | 7 (100.0%) |
| Total (Overall) | 26 (63.4%) | 15 (36.6%) |
Natural Resources, Construction and Maintenance Occupations
The most common Natural Resources, Construction and Maintenance occupations in Masonville are Construction & Extraction (2 | 4.9%), and Installation, Maintenance & Repair (2 | 4.9%).
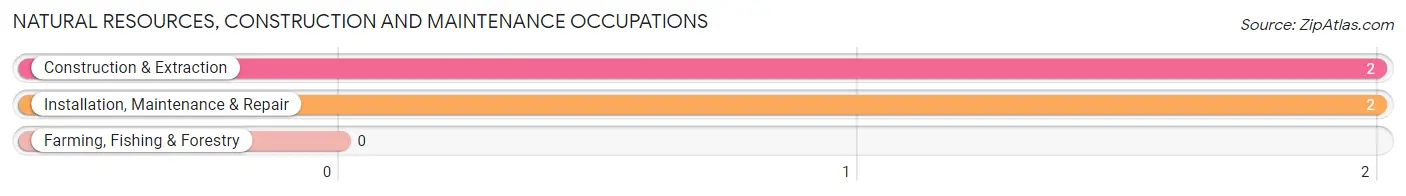
Natural Resources, Construction and Maintenance Occupations by Sex
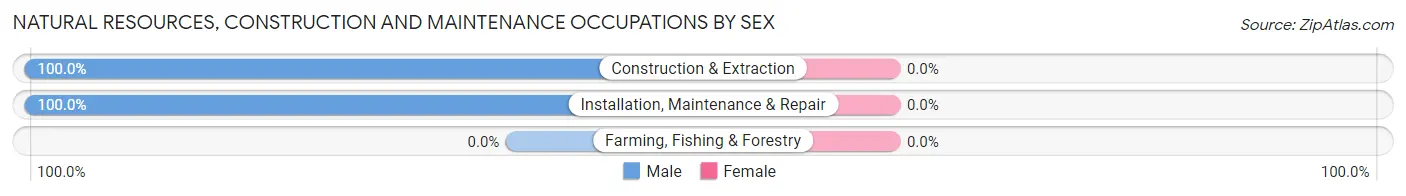
| Occupation | Male | Female |
| Farming, Fishing & Forestry | 0 (0.0%) | 0 (0.0%) |
| Construction & Extraction | 2 (100.0%) | 0 (0.0%) |
| Installation, Maintenance & Repair | 2 (100.0%) | 0 (0.0%) |
| Total (Category) | 4 (100.0%) | 0 (0.0%) |
| Total (Overall) | 26 (63.4%) | 15 (36.6%) |
Production, Transportation and Moving Occupations
The most common Production, Transportation and Moving occupations in Masonville are Material Moving (8 | 19.5%), Production (6 | 14.6%), and Transportation (1 | 2.4%).
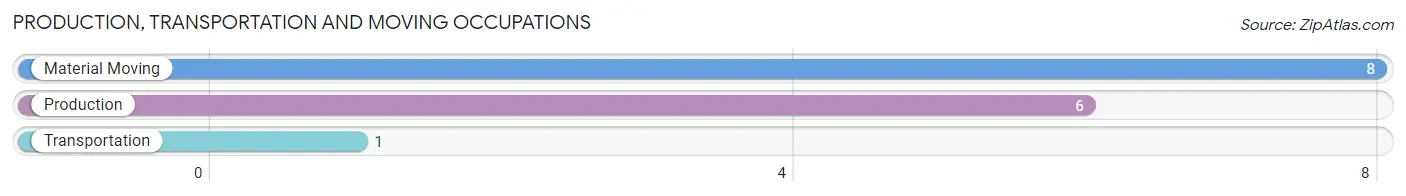
Production, Transportation and Moving Occupations by Sex
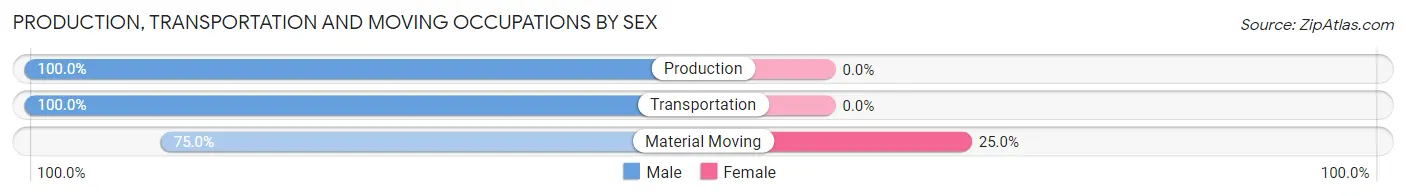
| Occupation | Male | Female |
| Production | 6 (100.0%) | 0 (0.0%) |
| Transportation | 1 (100.0%) | 0 (0.0%) |
| Material Moving | 6 (75.0%) | 2 (25.0%) |
| Total (Category) | 13 (86.7%) | 2 (13.3%) |
| Total (Overall) | 26 (63.4%) | 15 (36.6%) |
Employment Industries by Sex in Masonville
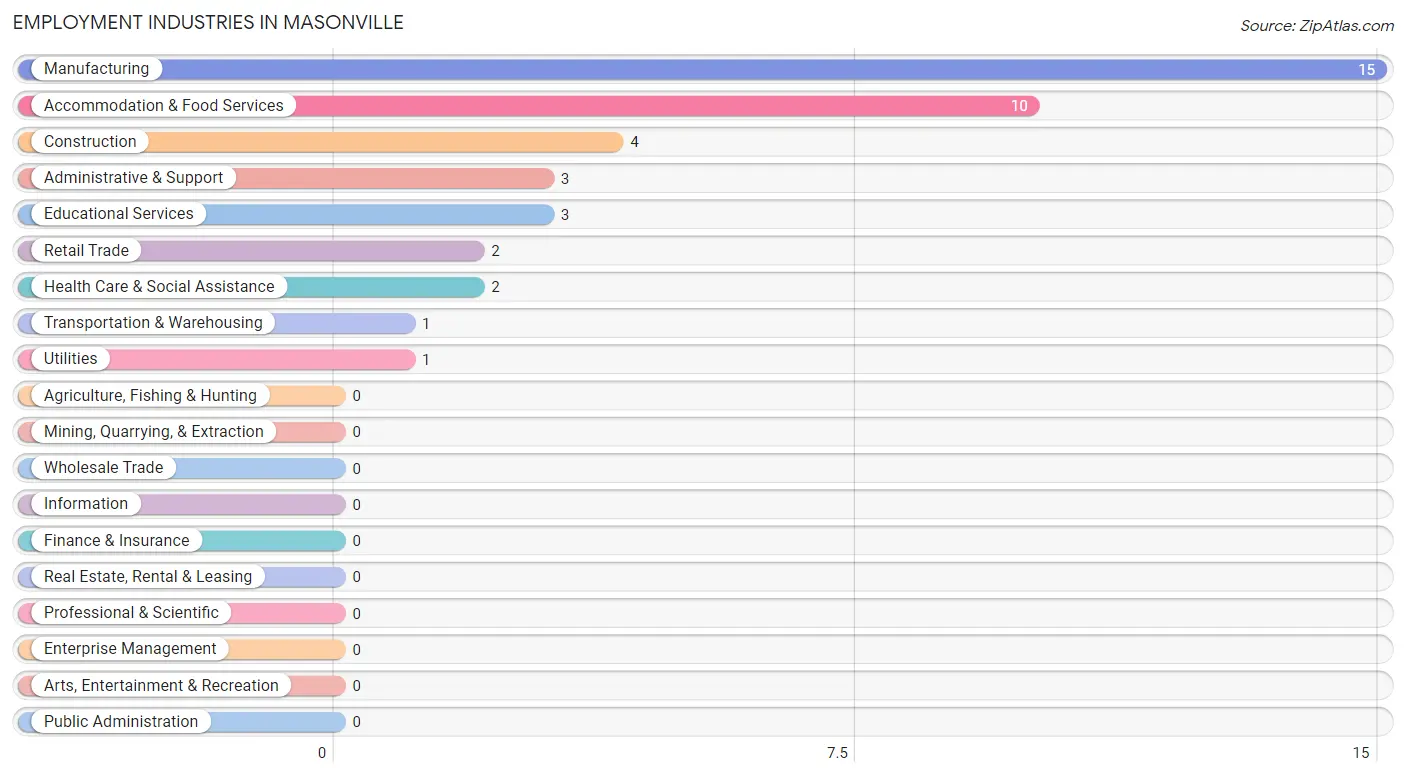
Employment Industries in Masonville
The major employment industries in Masonville include Manufacturing (15 | 36.6%), Accommodation & Food Services (10 | 24.4%), Construction (4 | 9.8%), Administrative & Support (3 | 7.3%), and Educational Services (3 | 7.3%).
Employment Industries by Sex in Masonville
The Masonville industries that see more men than women are Construction (100.0%), Transportation & Warehousing (100.0%), and Administrative & Support (100.0%), whereas the industries that tend to have a higher number of women are Utilities (100.0%), Health Care & Social Assistance (100.0%), and Accommodation & Food Services (80.0%).
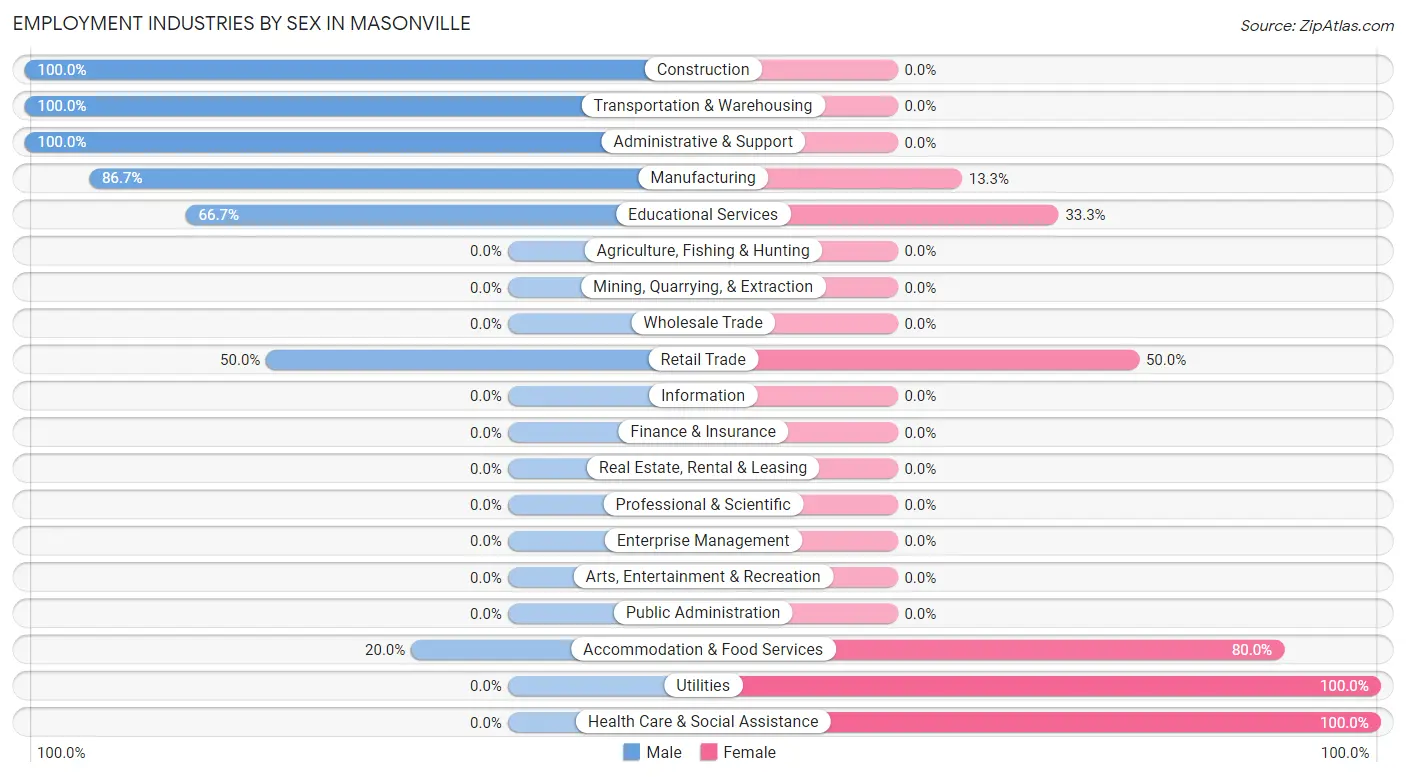
| Industry | Male | Female |
| Agriculture, Fishing & Hunting | 0 (0.0%) | 0 (0.0%) |
| Mining, Quarrying, & Extraction | 0 (0.0%) | 0 (0.0%) |
| Construction | 4 (100.0%) | 0 (0.0%) |
| Manufacturing | 13 (86.7%) | 2 (13.3%) |
| Wholesale Trade | 0 (0.0%) | 0 (0.0%) |
| Retail Trade | 1 (50.0%) | 1 (50.0%) |
| Transportation & Warehousing | 1 (100.0%) | 0 (0.0%) |
| Utilities | 0 (0.0%) | 1 (100.0%) |
| Information | 0 (0.0%) | 0 (0.0%) |
| Finance & Insurance | 0 (0.0%) | 0 (0.0%) |
| Real Estate, Rental & Leasing | 0 (0.0%) | 0 (0.0%) |
| Professional & Scientific | 0 (0.0%) | 0 (0.0%) |
| Enterprise Management | 0 (0.0%) | 0 (0.0%) |
| Administrative & Support | 3 (100.0%) | 0 (0.0%) |
| Educational Services | 2 (66.7%) | 1 (33.3%) |
| Health Care & Social Assistance | 0 (0.0%) | 2 (100.0%) |
| Arts, Entertainment & Recreation | 0 (0.0%) | 0 (0.0%) |
| Accommodation & Food Services | 2 (20.0%) | 8 (80.0%) |
| Public Administration | 0 (0.0%) | 0 (0.0%) |
| Total | 26 (63.4%) | 15 (36.6%) |
Education in Masonville
School Enrollment in Masonville
The most common levels of schooling among the 5 students in Masonville are high school (3 | 60.0%), kindergarten (1 | 20.0%), and elementary school (1 | 20.0%).
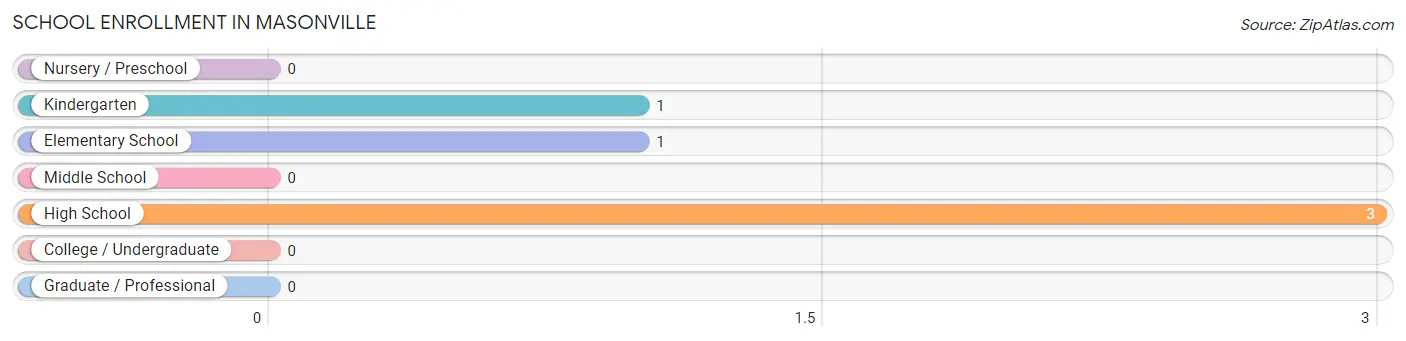
| School Level | # Students | % Students |
| Nursery / Preschool | 0 | 0.0% |
| Kindergarten | 1 | 20.0% |
| Elementary School | 1 | 20.0% |
| Middle School | 0 | 0.0% |
| High School | 3 | 60.0% |
| College / Undergraduate | 0 | 0.0% |
| Graduate / Professional | 0 | 0.0% |
| Total | 5 | 100.0% |
School Enrollment by Age by Funding Source in Masonville
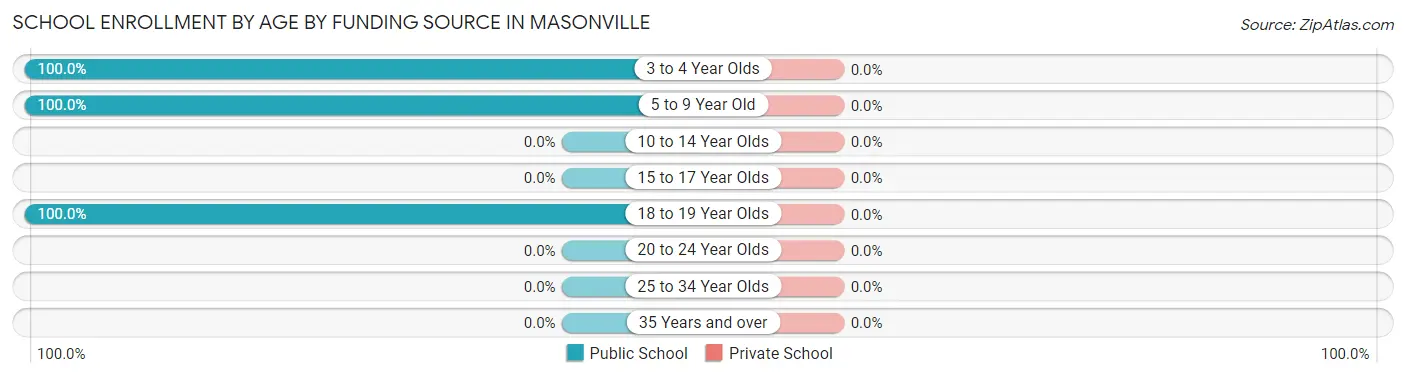
| Age Bracket | Public School | Private School |
| 3 to 4 Year Olds | 1 (100.0%) | 0 (0.0%) |
| 5 to 9 Year Old | 1 (100.0%) | 0 (0.0%) |
| 10 to 14 Year Olds | 0 (0.0%) | 0 (0.0%) |
| 15 to 17 Year Olds | 0 (0.0%) | 0 (0.0%) |
| 18 to 19 Year Olds | 3 (100.0%) | 0 (0.0%) |
| 20 to 24 Year Olds | 0 (0.0%) | 0 (0.0%) |
| 25 to 34 Year Olds | 0 (0.0%) | 0 (0.0%) |
| 35 Years and over | 0 (0.0%) | 0 (0.0%) |
| Total | 5 (100.0%) | 0 (0.0%) |
Educational Attainment by Field of Study in Masonville
, and arts & humanities (2 | 100.0%) are the most common fields of study among 2 individuals in Masonville who have obtained a bachelor's degree or higher.
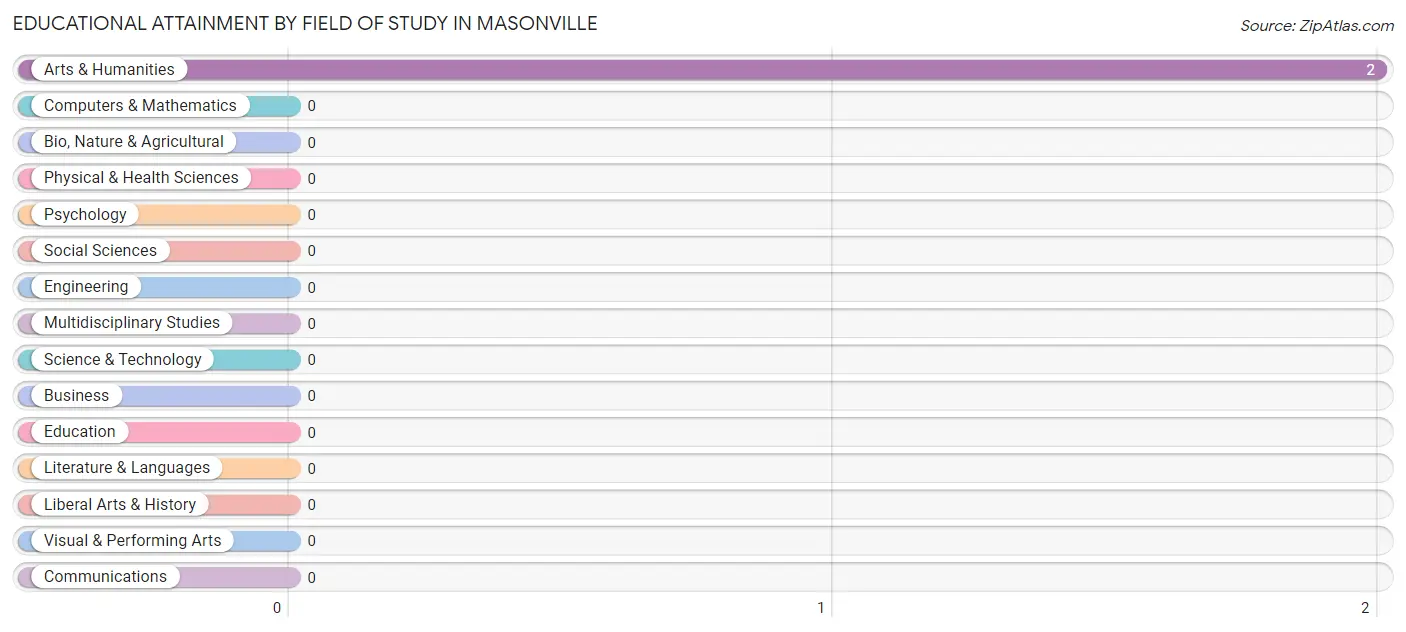
| Field of Study | # Graduates | % Graduates |
| Computers & Mathematics | 0 | 0.0% |
| Bio, Nature & Agricultural | 0 | 0.0% |
| Physical & Health Sciences | 0 | 0.0% |
| Psychology | 0 | 0.0% |
| Social Sciences | 0 | 0.0% |
| Engineering | 0 | 0.0% |
| Multidisciplinary Studies | 0 | 0.0% |
| Science & Technology | 0 | 0.0% |
| Business | 0 | 0.0% |
| Education | 0 | 0.0% |
| Literature & Languages | 0 | 0.0% |
| Liberal Arts & History | 0 | 0.0% |
| Visual & Performing Arts | 0 | 0.0% |
| Communications | 0 | 0.0% |
| Arts & Humanities | 2 | 100.0% |
| Total | 2 | 100.0% |
Transportation & Commute in Masonville
Vehicle Availability by Sex in Masonville
The most prevalent vehicle ownership categories in Masonville are males with 2 vehicles (14, accounting for 53.8%) and females with 2 vehicles (2, making up 93.3%).
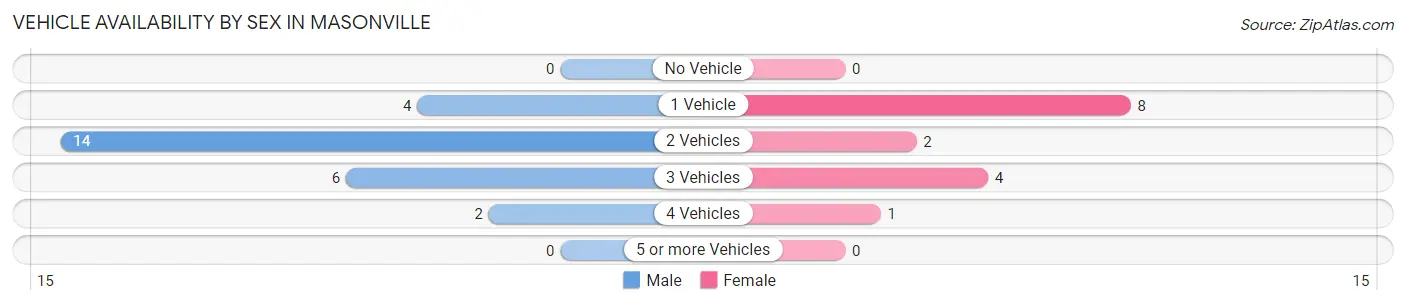
| Vehicles Available | Male | Female |
| No Vehicle | 0 (0.0%) | 0 (0.0%) |
| 1 Vehicle | 4 (15.4%) | 8 (53.3%) |
| 2 Vehicles | 14 (53.8%) | 2 (13.3%) |
| 3 Vehicles | 6 (23.1%) | 4 (26.7%) |
| 4 Vehicles | 2 (7.7%) | 1 (6.7%) |
| 5 or more Vehicles | 0 (0.0%) | 0 (0.0%) |
| Total | 26 (100.0%) | 15 (100.0%) |
Commute Time in Masonville
The most frequently occuring commute durations in Masonville are 10 to 14 minutes (14 commuters, 35.0%), 20 to 24 minutes (6 commuters, 15.0%), and 5 to 9 minutes (5 commuters, 12.5%).
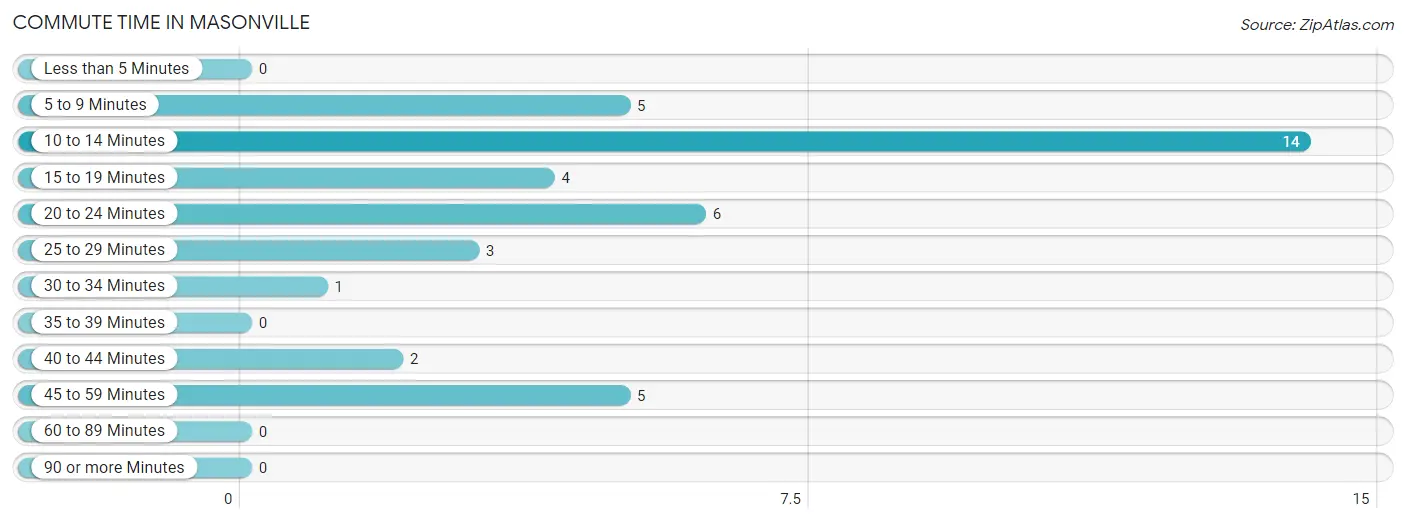
| Commute Time | # Commuters | % Commuters |
| Less than 5 Minutes | 0 | 0.0% |
| 5 to 9 Minutes | 5 | 12.5% |
| 10 to 14 Minutes | 14 | 35.0% |
| 15 to 19 Minutes | 4 | 10.0% |
| 20 to 24 Minutes | 6 | 15.0% |
| 25 to 29 Minutes | 3 | 7.5% |
| 30 to 34 Minutes | 1 | 2.5% |
| 35 to 39 Minutes | 0 | 0.0% |
| 40 to 44 Minutes | 2 | 5.0% |
| 45 to 59 Minutes | 5 | 12.5% |
| 60 to 89 Minutes | 0 | 0.0% |
| 90 or more Minutes | 0 | 0.0% |
Commute Time by Sex in Masonville
The most common commute times in Masonville are 10 to 14 minutes (11 commuters, 42.3%) for males and 20 to 24 minutes (5 commuters, 35.7%) for females.
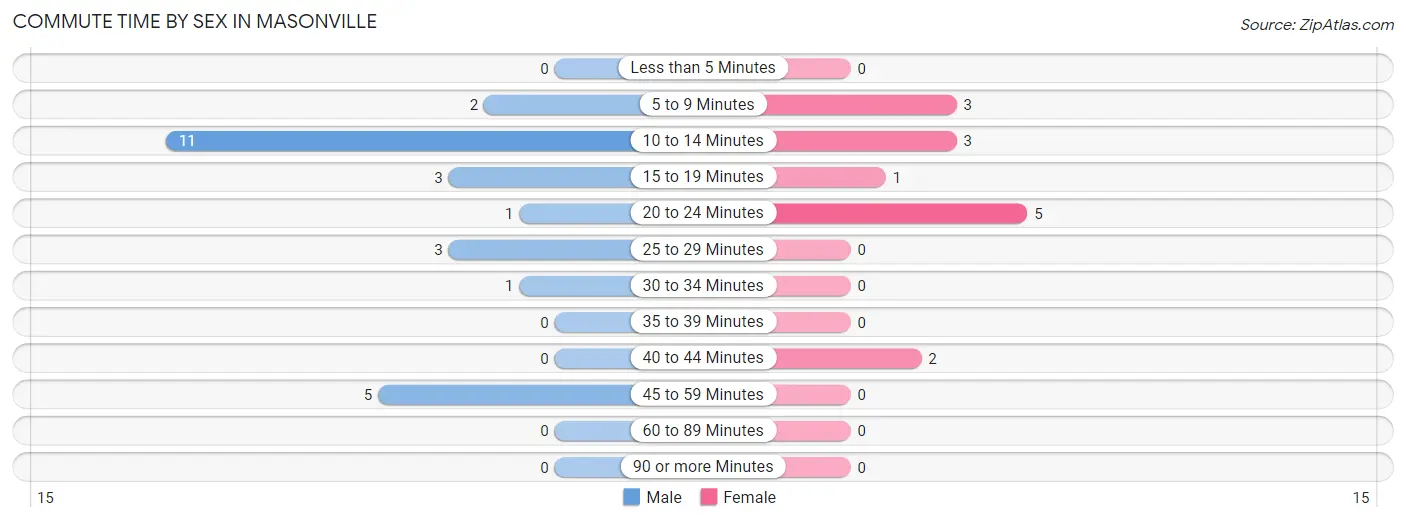
| Commute Time | Male | Female |
| Less than 5 Minutes | 0 (0.0%) | 0 (0.0%) |
| 5 to 9 Minutes | 2 (7.7%) | 3 (21.4%) |
| 10 to 14 Minutes | 11 (42.3%) | 3 (21.4%) |
| 15 to 19 Minutes | 3 (11.5%) | 1 (7.1%) |
| 20 to 24 Minutes | 1 (3.8%) | 5 (35.7%) |
| 25 to 29 Minutes | 3 (11.5%) | 0 (0.0%) |
| 30 to 34 Minutes | 1 (3.8%) | 0 (0.0%) |
| 35 to 39 Minutes | 0 (0.0%) | 0 (0.0%) |
| 40 to 44 Minutes | 0 (0.0%) | 2 (14.3%) |
| 45 to 59 Minutes | 5 (19.2%) | 0 (0.0%) |
| 60 to 89 Minutes | 0 (0.0%) | 0 (0.0%) |
| 90 or more Minutes | 0 (0.0%) | 0 (0.0%) |
Time of Departure to Work by Sex in Masonville
The most frequent times of departure to work in Masonville are 6:00 AM to 6:29 AM (5, 19.2%) for males and 4:00 PM to 11:59 PM (8, 57.1%) for females.
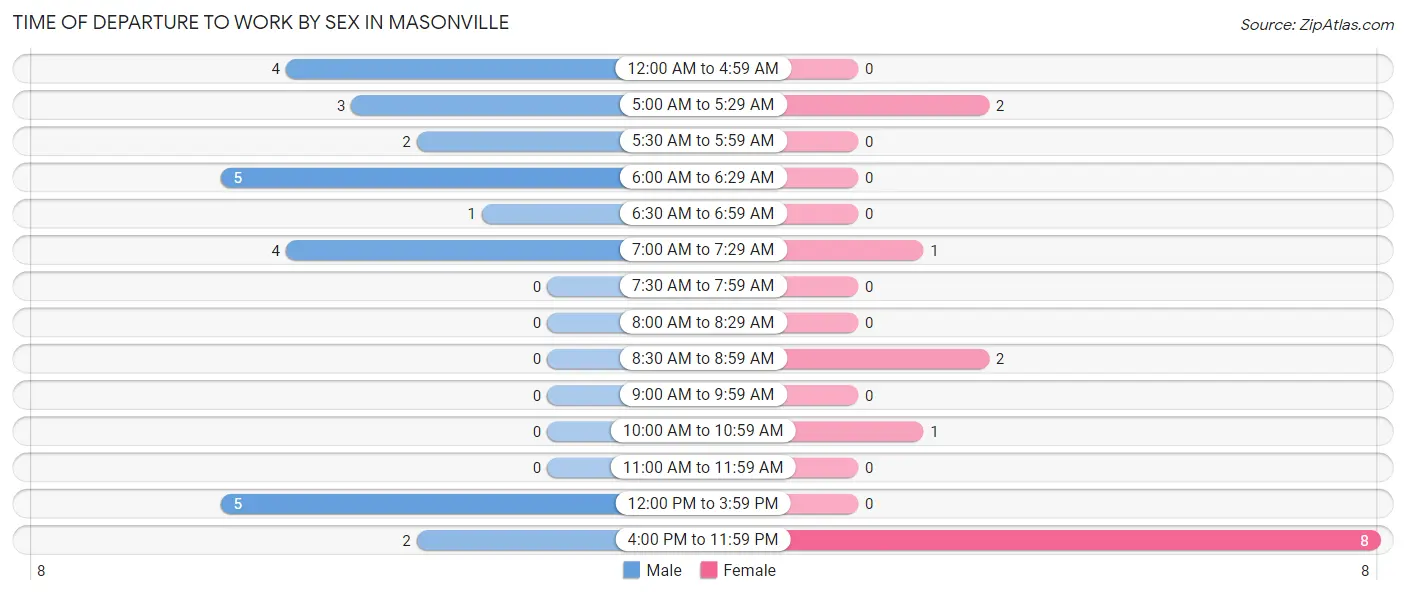
| Time of Departure | Male | Female |
| 12:00 AM to 4:59 AM | 4 (15.4%) | 0 (0.0%) |
| 5:00 AM to 5:29 AM | 3 (11.5%) | 2 (14.3%) |
| 5:30 AM to 5:59 AM | 2 (7.7%) | 0 (0.0%) |
| 6:00 AM to 6:29 AM | 5 (19.2%) | 0 (0.0%) |
| 6:30 AM to 6:59 AM | 1 (3.8%) | 0 (0.0%) |
| 7:00 AM to 7:29 AM | 4 (15.4%) | 1 (7.1%) |
| 7:30 AM to 7:59 AM | 0 (0.0%) | 0 (0.0%) |
| 8:00 AM to 8:29 AM | 0 (0.0%) | 0 (0.0%) |
| 8:30 AM to 8:59 AM | 0 (0.0%) | 2 (14.3%) |
| 9:00 AM to 9:59 AM | 0 (0.0%) | 0 (0.0%) |
| 10:00 AM to 10:59 AM | 0 (0.0%) | 1 (7.1%) |
| 11:00 AM to 11:59 AM | 0 (0.0%) | 0 (0.0%) |
| 12:00 PM to 3:59 PM | 5 (19.2%) | 0 (0.0%) |
| 4:00 PM to 11:59 PM | 2 (7.7%) | 8 (57.1%) |
| Total | 26 (100.0%) | 14 (100.0%) |
Housing Occupancy in Masonville
Occupancy by Ownership in Masonville
Of the total 41 dwellings in Masonville, owner-occupied units account for 29 (70.7%), while renter-occupied units make up 12 (29.3%).
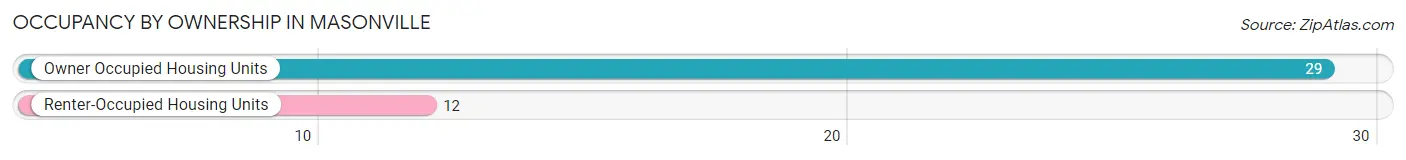
| Occupancy | # Housing Units | % Housing Units |
| Owner Occupied Housing Units | 29 | 70.7% |
| Renter-Occupied Housing Units | 12 | 29.3% |
| Total Occupied Housing Units | 41 | 100.0% |
Occupancy by Household Size in Masonville
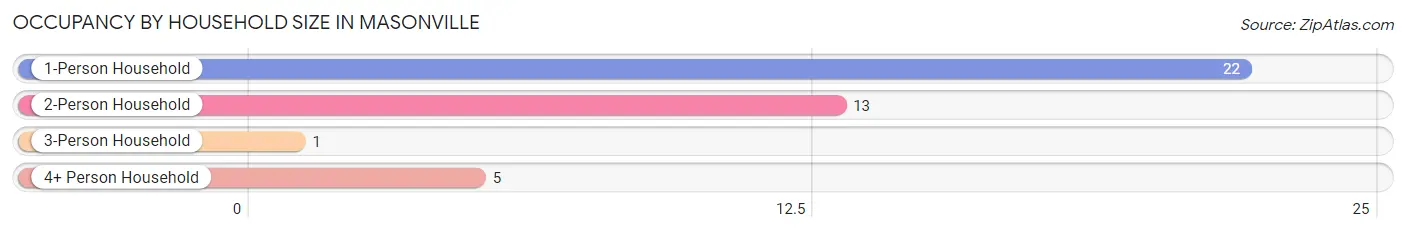
| Household Size | # Housing Units | % Housing Units |
| 1-Person Household | 22 | 53.7% |
| 2-Person Household | 13 | 31.7% |
| 3-Person Household | 1 | 2.4% |
| 4+ Person Household | 5 | 12.2% |
| Total Housing Units | 41 | 100.0% |
Occupancy by Ownership by Household Size in Masonville
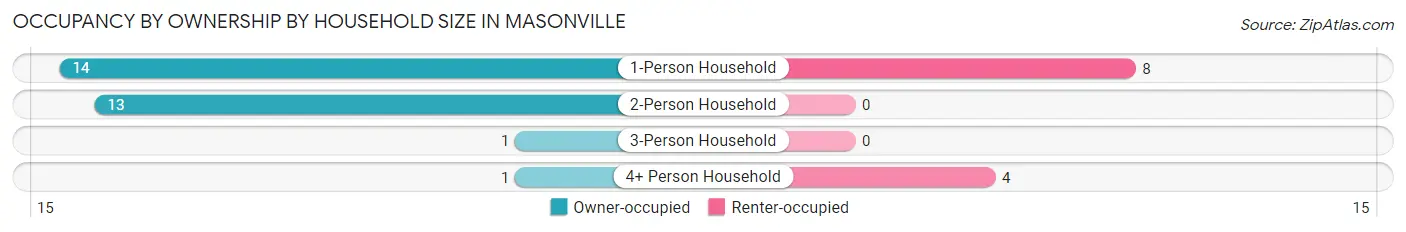
| Household Size | Owner-occupied | Renter-occupied |
| 1-Person Household | 14 (63.6%) | 8 (36.4%) |
| 2-Person Household | 13 (100.0%) | 0 (0.0%) |
| 3-Person Household | 1 (100.0%) | 0 (0.0%) |
| 4+ Person Household | 1 (20.0%) | 4 (80.0%) |
| Total Housing Units | 29 (70.7%) | 12 (29.3%) |
Occupancy by Educational Attainment in Masonville
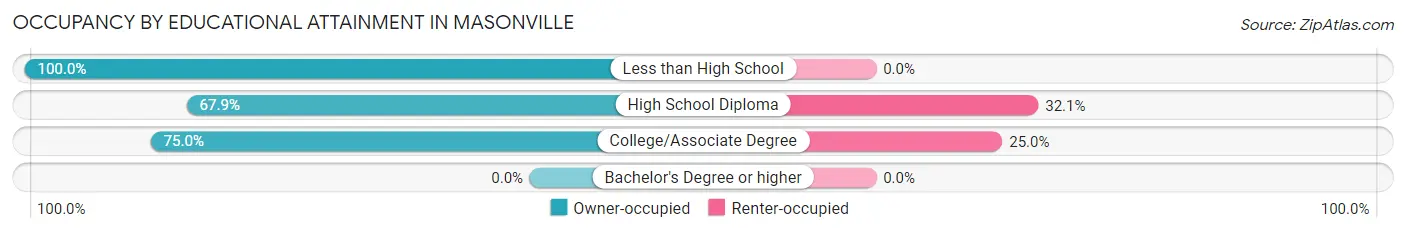
| Household Size | Owner-occupied | Renter-occupied |
| Less than High School | 1 (100.0%) | 0 (0.0%) |
| High School Diploma | 19 (67.9%) | 9 (32.1%) |
| College/Associate Degree | 9 (75.0%) | 3 (25.0%) |
| Bachelor's Degree or higher | 0 (0.0%) | 0 (0.0%) |
Occupancy by Age of Householder in Masonville
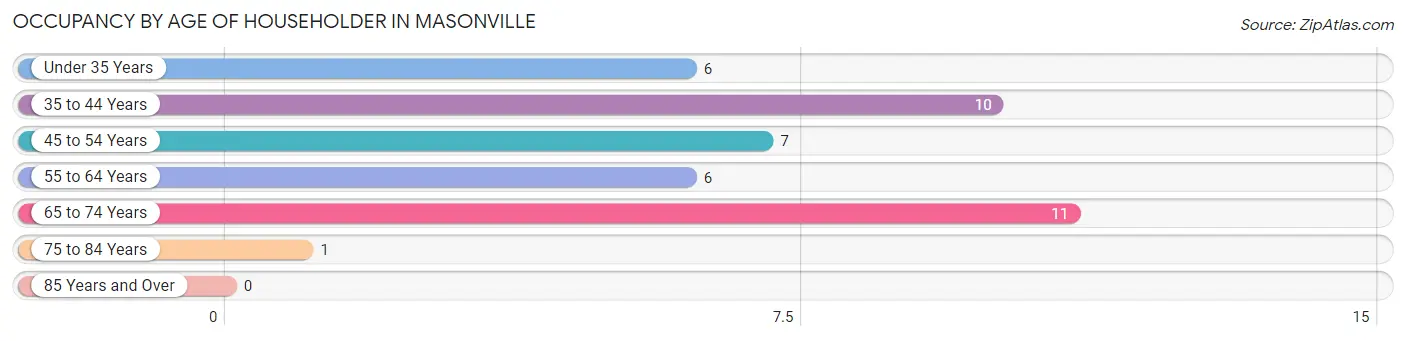
| Age Bracket | # Households | % Households |
| Under 35 Years | 6 | 14.6% |
| 35 to 44 Years | 10 | 24.4% |
| 45 to 54 Years | 7 | 17.1% |
| 55 to 64 Years | 6 | 14.6% |
| 65 to 74 Years | 11 | 26.8% |
| 75 to 84 Years | 1 | 2.4% |
| 85 Years and Over | 0 | 0.0% |
| Total | 41 | 100.0% |
Housing Finances in Masonville
Median Income by Occupancy in Masonville
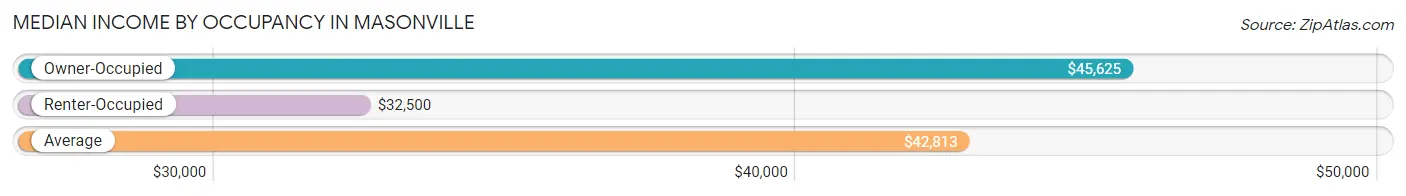
| Occupancy Type | # Households | Median Income |
| Owner-Occupied | 29 (70.7%) | $45,625 |
| Renter-Occupied | 12 (29.3%) | $32,500 |
| Average | 41 (100.0%) | $42,813 |
Occupancy by Householder Income Bracket in Masonville
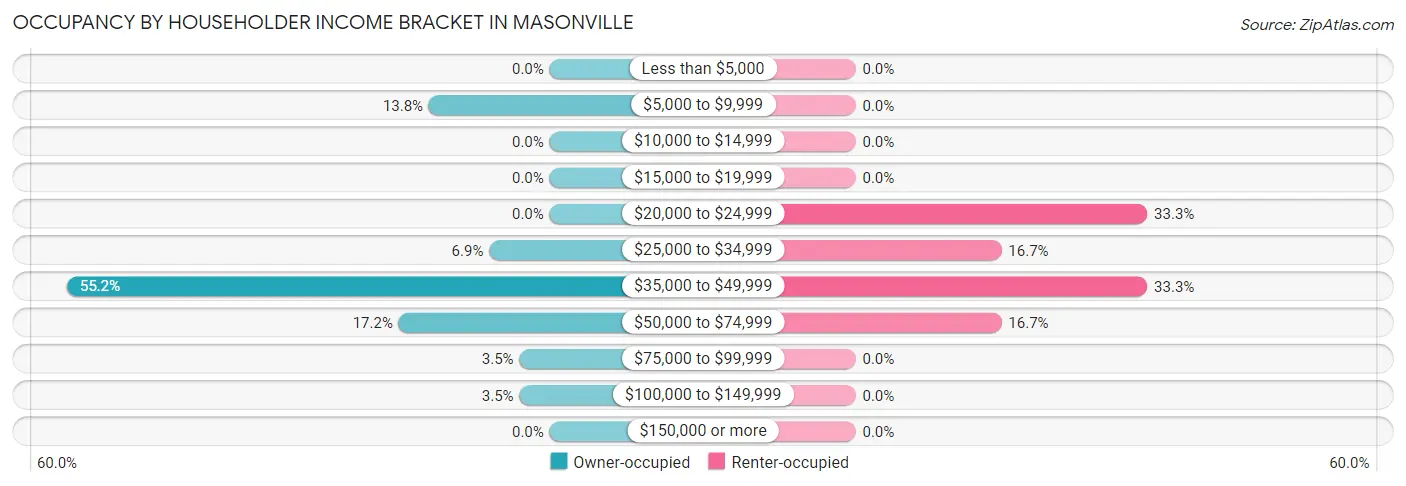
| Income Bracket | Owner-occupied | Renter-occupied |
| Less than $5,000 | 0 (0.0%) | 0 (0.0%) |
| $5,000 to $9,999 | 4 (13.8%) | 0 (0.0%) |
| $10,000 to $14,999 | 0 (0.0%) | 0 (0.0%) |
| $15,000 to $19,999 | 0 (0.0%) | 0 (0.0%) |
| $20,000 to $24,999 | 0 (0.0%) | 4 (33.3%) |
| $25,000 to $34,999 | 2 (6.9%) | 2 (16.7%) |
| $35,000 to $49,999 | 16 (55.2%) | 4 (33.3%) |
| $50,000 to $74,999 | 5 (17.2%) | 2 (16.7%) |
| $75,000 to $99,999 | 1 (3.5%) | 0 (0.0%) |
| $100,000 to $149,999 | 1 (3.5%) | 0 (0.0%) |
| $150,000 or more | 0 (0.0%) | 0 (0.0%) |
| Total | 29 (100.0%) | 12 (100.0%) |
Monthly Housing Cost Tiers in Masonville
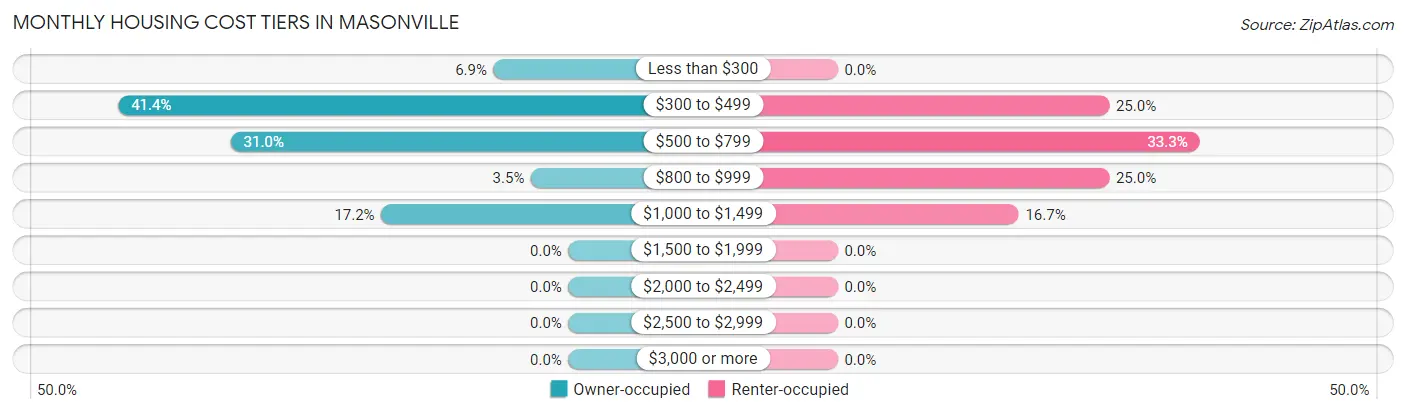
| Monthly Cost | Owner-occupied | Renter-occupied |
| Less than $300 | 2 (6.9%) | 0 (0.0%) |
| $300 to $499 | 12 (41.4%) | 3 (25.0%) |
| $500 to $799 | 9 (31.0%) | 4 (33.3%) |
| $800 to $999 | 1 (3.5%) | 3 (25.0%) |
| $1,000 to $1,499 | 5 (17.2%) | 2 (16.7%) |
| $1,500 to $1,999 | 0 (0.0%) | 0 (0.0%) |
| $2,000 to $2,499 | 0 (0.0%) | 0 (0.0%) |
| $2,500 to $2,999 | 0 (0.0%) | 0 (0.0%) |
| $3,000 or more | 0 (0.0%) | 0 (0.0%) |
| Total | 29 (100.0%) | 12 (100.0%) |
Physical Housing Characteristics in Masonville
Housing Structures in Masonville
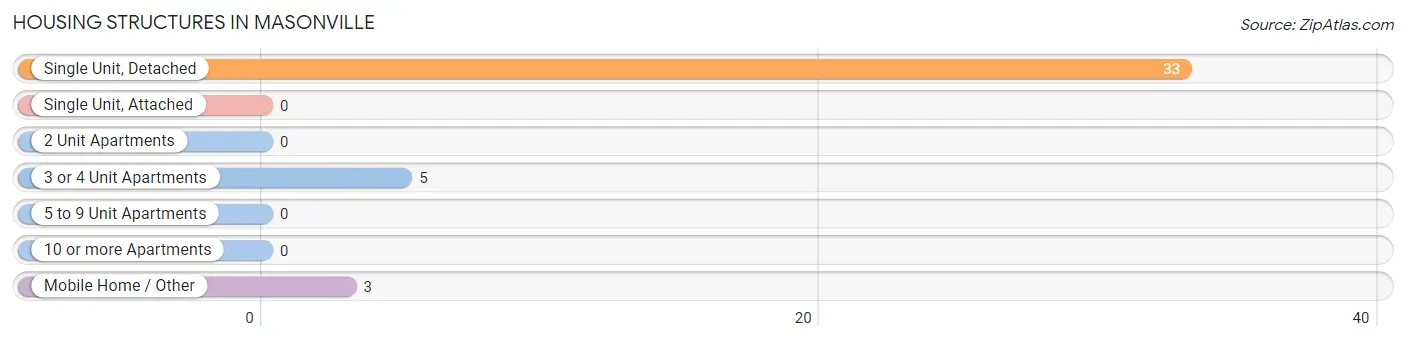
| Structure Type | # Housing Units | % Housing Units |
| Single Unit, Detached | 33 | 80.5% |
| Single Unit, Attached | 0 | 0.0% |
| 2 Unit Apartments | 0 | 0.0% |
| 3 or 4 Unit Apartments | 5 | 12.2% |
| 5 to 9 Unit Apartments | 0 | 0.0% |
| 10 or more Apartments | 0 | 0.0% |
| Mobile Home / Other | 3 | 7.3% |
| Total | 41 | 100.0% |
Housing Structures by Occupancy in Masonville
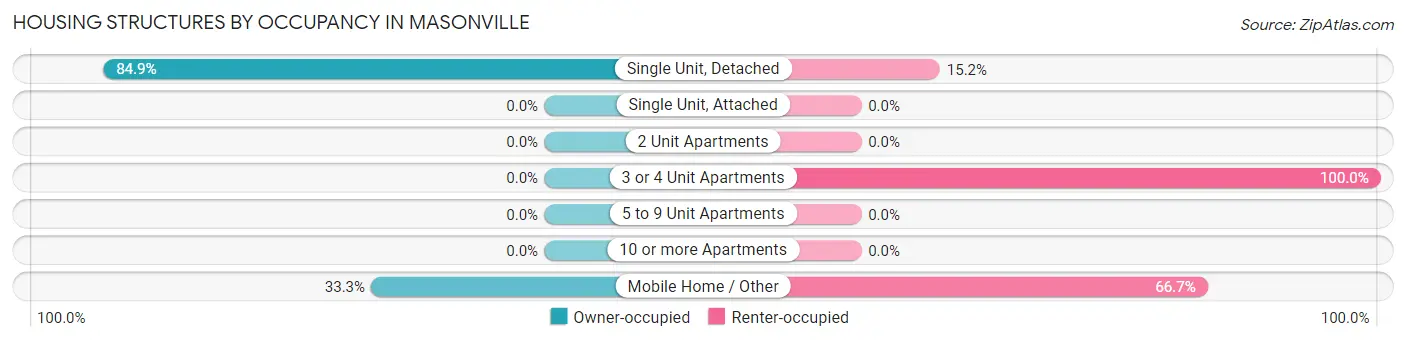
| Structure Type | Owner-occupied | Renter-occupied |
| Single Unit, Detached | 28 (84.9%) | 5 (15.1%) |
| Single Unit, Attached | 0 (0.0%) | 0 (0.0%) |
| 2 Unit Apartments | 0 (0.0%) | 0 (0.0%) |
| 3 or 4 Unit Apartments | 0 (0.0%) | 5 (100.0%) |
| 5 to 9 Unit Apartments | 0 (0.0%) | 0 (0.0%) |
| 10 or more Apartments | 0 (0.0%) | 0 (0.0%) |
| Mobile Home / Other | 1 (33.3%) | 2 (66.7%) |
| Total | 29 (70.7%) | 12 (29.3%) |
Housing Structures by Number of Rooms in Masonville
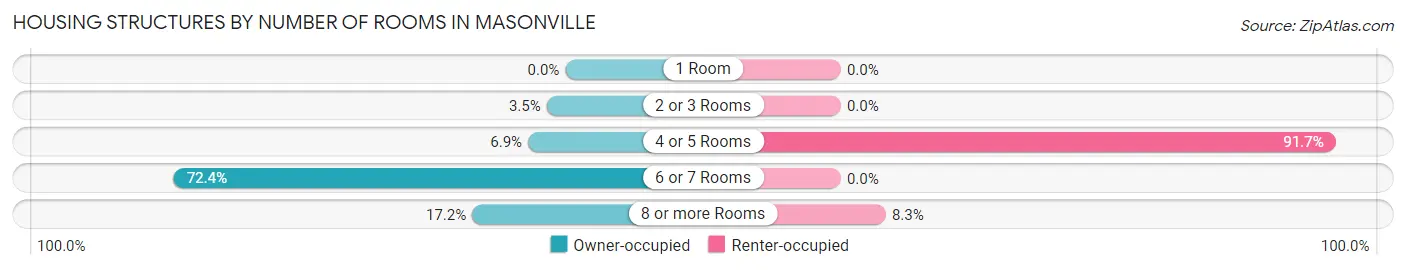
| Number of Rooms | Owner-occupied | Renter-occupied |
| 1 Room | 0 (0.0%) | 0 (0.0%) |
| 2 or 3 Rooms | 1 (3.5%) | 0 (0.0%) |
| 4 or 5 Rooms | 2 (6.9%) | 11 (91.7%) |
| 6 or 7 Rooms | 21 (72.4%) | 0 (0.0%) |
| 8 or more Rooms | 5 (17.2%) | 1 (8.3%) |
| Total | 29 (100.0%) | 12 (100.0%) |
Housing Structure by Heating Type in Masonville
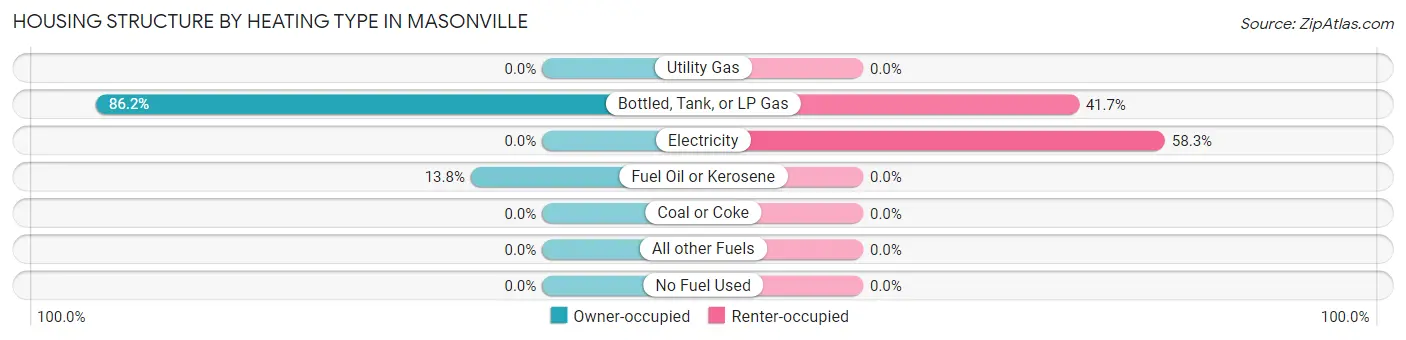
| Heating Type | Owner-occupied | Renter-occupied |
| Utility Gas | 0 (0.0%) | 0 (0.0%) |
| Bottled, Tank, or LP Gas | 25 (86.2%) | 5 (41.7%) |
| Electricity | 0 (0.0%) | 7 (58.3%) |
| Fuel Oil or Kerosene | 4 (13.8%) | 0 (0.0%) |
| Coal or Coke | 0 (0.0%) | 0 (0.0%) |
| All other Fuels | 0 (0.0%) | 0 (0.0%) |
| No Fuel Used | 0 (0.0%) | 0 (0.0%) |
| Total | 29 (100.0%) | 12 (100.0%) |
Household Vehicle Usage in Masonville
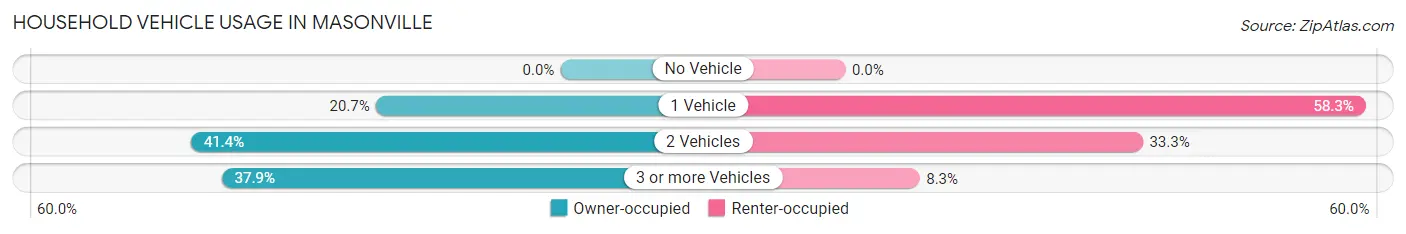
| Vehicles per Household | Owner-occupied | Renter-occupied |
| No Vehicle | 0 (0.0%) | 0 (0.0%) |
| 1 Vehicle | 6 (20.7%) | 7 (58.3%) |
| 2 Vehicles | 12 (41.4%) | 4 (33.3%) |
| 3 or more Vehicles | 11 (37.9%) | 1 (8.3%) |
| Total | 29 (100.0%) | 12 (100.0%) |
Real Estate & Mortgages in Masonville
Real Estate and Mortgage Overview in Masonville
| Characteristic | Without Mortgage | With Mortgage |
| Housing Units | 19 | 10 |
| Median Property Value | $65,000 | $43,300 |
| Median Household Income | $45,625 | $0 |
| Monthly Housing Costs | $413 | $0 |
| Real Estate Taxes | $688 | $0 |
Property Value by Mortgage Status in Masonville
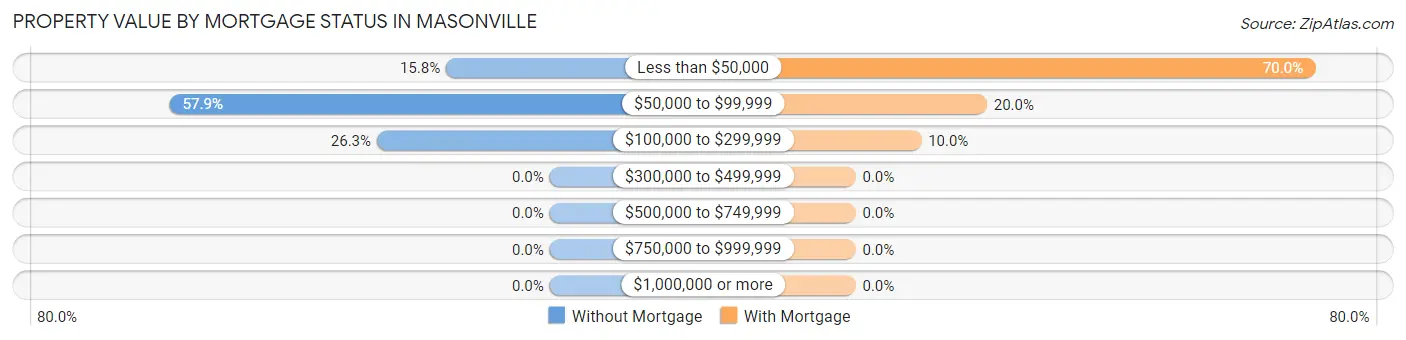
| Property Value | Without Mortgage | With Mortgage |
| Less than $50,000 | 3 (15.8%) | 7 (70.0%) |
| $50,000 to $99,999 | 11 (57.9%) | 2 (20.0%) |
| $100,000 to $299,999 | 5 (26.3%) | 1 (10.0%) |
| $300,000 to $499,999 | 0 (0.0%) | 0 (0.0%) |
| $500,000 to $749,999 | 0 (0.0%) | 0 (0.0%) |
| $750,000 to $999,999 | 0 (0.0%) | 0 (0.0%) |
| $1,000,000 or more | 0 (0.0%) | 0 (0.0%) |
| Total | 19 (100.0%) | 10 (100.0%) |
Household Income by Mortgage Status in Masonville
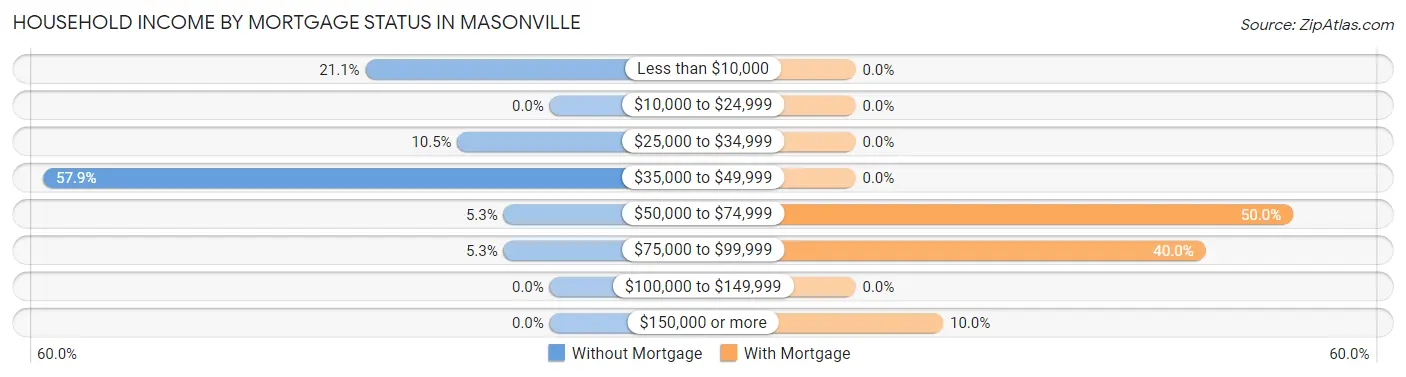
| Household Income | Without Mortgage | With Mortgage |
| Less than $10,000 | 4 (21.0%) | 0 (0.0%) |
| $10,000 to $24,999 | 0 (0.0%) | 0 (0.0%) |
| $25,000 to $34,999 | 2 (10.5%) | 0 (0.0%) |
| $35,000 to $49,999 | 11 (57.9%) | 0 (0.0%) |
| $50,000 to $74,999 | 1 (5.3%) | 5 (50.0%) |
| $75,000 to $99,999 | 1 (5.3%) | 4 (40.0%) |
| $100,000 to $149,999 | 0 (0.0%) | 0 (0.0%) |
| $150,000 or more | 0 (0.0%) | 1 (10.0%) |
| Total | 19 (100.0%) | 10 (100.0%) |
Property Value to Household Income Ratio in Masonville
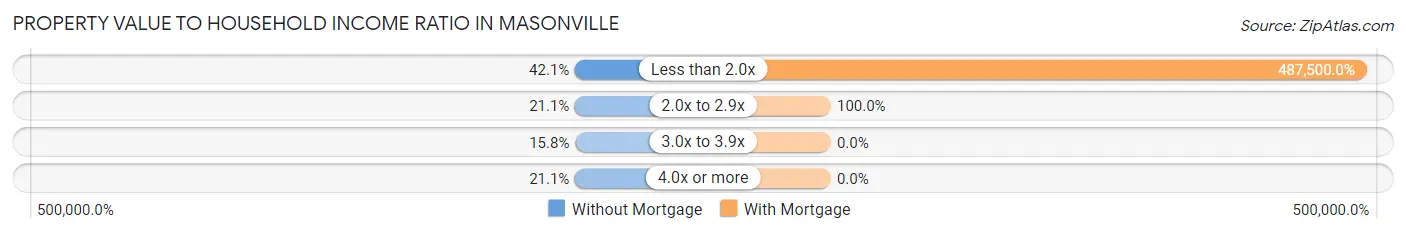
| Value-to-Income Ratio | Without Mortgage | With Mortgage |
| Less than 2.0x | 8 (42.1%) | 48,750 (487,500.0%) |
| 2.0x to 2.9x | 4 (21.0%) | 10 (100.0%) |
| 3.0x to 3.9x | 3 (15.8%) | 0 (0.0%) |
| 4.0x or more | 4 (21.0%) | 0 (0.0%) |
| Total | 19 (100.0%) | 10 (100.0%) |
Real Estate Taxes by Mortgage Status in Masonville
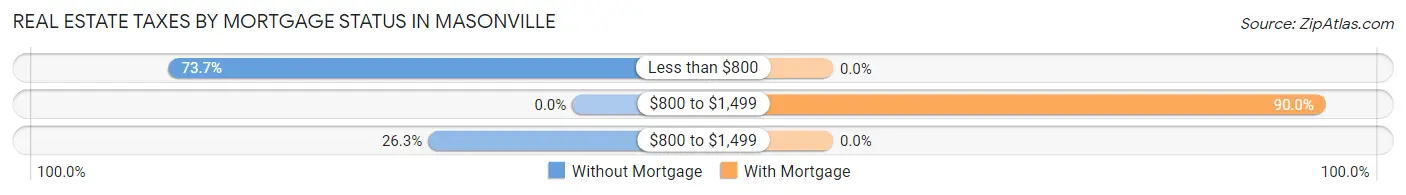
| Property Taxes | Without Mortgage | With Mortgage |
| Less than $800 | 14 (73.7%) | 0 (0.0%) |
| $800 to $1,499 | 0 (0.0%) | 9 (90.0%) |
| $800 to $1,499 | 5 (26.3%) | 0 (0.0%) |
| Total | 19 (100.0%) | 10 (100.0%) |
Health & Disability in Masonville
Health Insurance Coverage by Age in Masonville
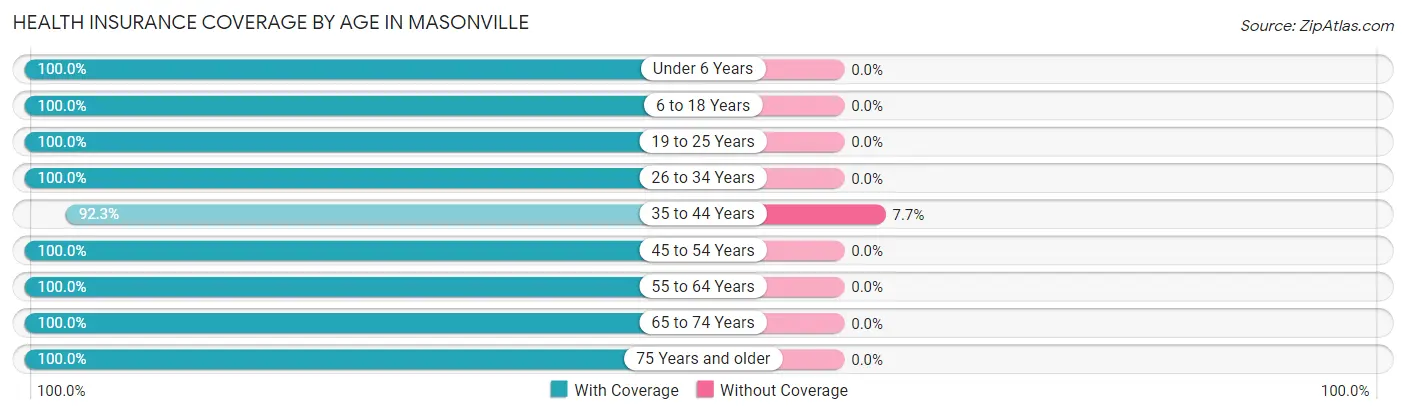
| Age Bracket | With Coverage | Without Coverage |
| Under 6 Years | 7 (100.0%) | 0 (0.0%) |
| 6 to 18 Years | 6 (100.0%) | 0 (0.0%) |
| 19 to 25 Years | 5 (100.0%) | 0 (0.0%) |
| 26 to 34 Years | 6 (100.0%) | 0 (0.0%) |
| 35 to 44 Years | 12 (92.3%) | 1 (7.7%) |
| 45 to 54 Years | 9 (100.0%) | 0 (0.0%) |
| 55 to 64 Years | 8 (100.0%) | 0 (0.0%) |
| 65 to 74 Years | 17 (100.0%) | 0 (0.0%) |
| 75 Years and older | 3 (100.0%) | 0 (0.0%) |
| Total | 73 (98.7%) | 1 (1.3%) |
Health Insurance Coverage by Citizenship Status in Masonville
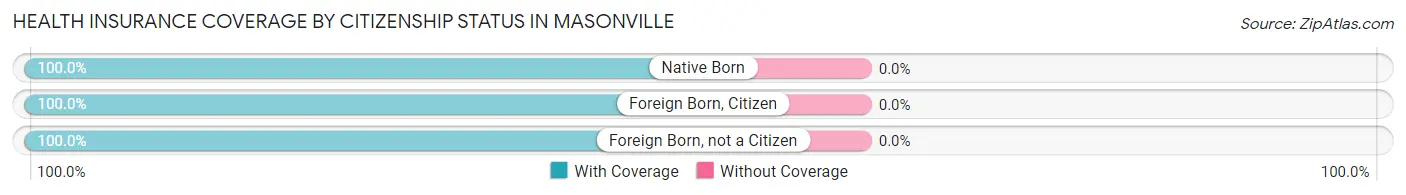
| Citizenship Status | With Coverage | Without Coverage |
| Native Born | 7 (100.0%) | 0 (0.0%) |
| Foreign Born, Citizen | 6 (100.0%) | 0 (0.0%) |
| Foreign Born, not a Citizen | 5 (100.0%) | 0 (0.0%) |
Health Insurance Coverage by Household Income in Masonville
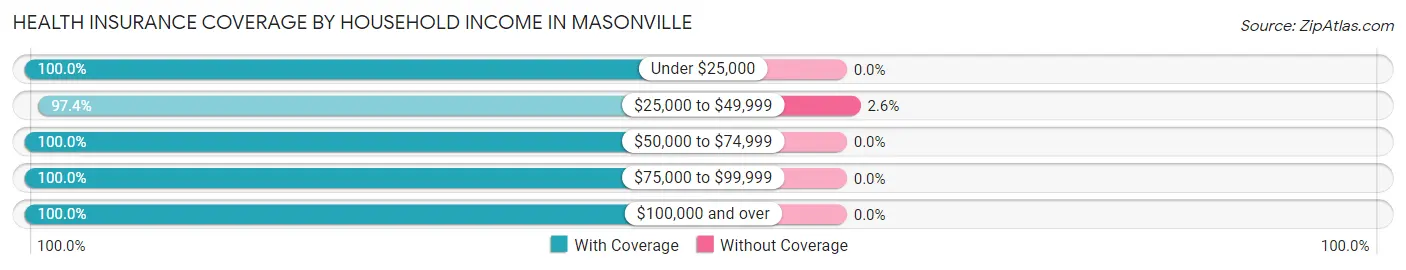
| Household Income | With Coverage | Without Coverage |
| Under $25,000 | 8 (100.0%) | 0 (0.0%) |
| $25,000 to $49,999 | 38 (97.4%) | 1 (2.6%) |
| $50,000 to $74,999 | 19 (100.0%) | 0 (0.0%) |
| $75,000 to $99,999 | 2 (100.0%) | 0 (0.0%) |
| $100,000 and over | 6 (100.0%) | 0 (0.0%) |
Public vs Private Health Insurance Coverage by Age in Masonville
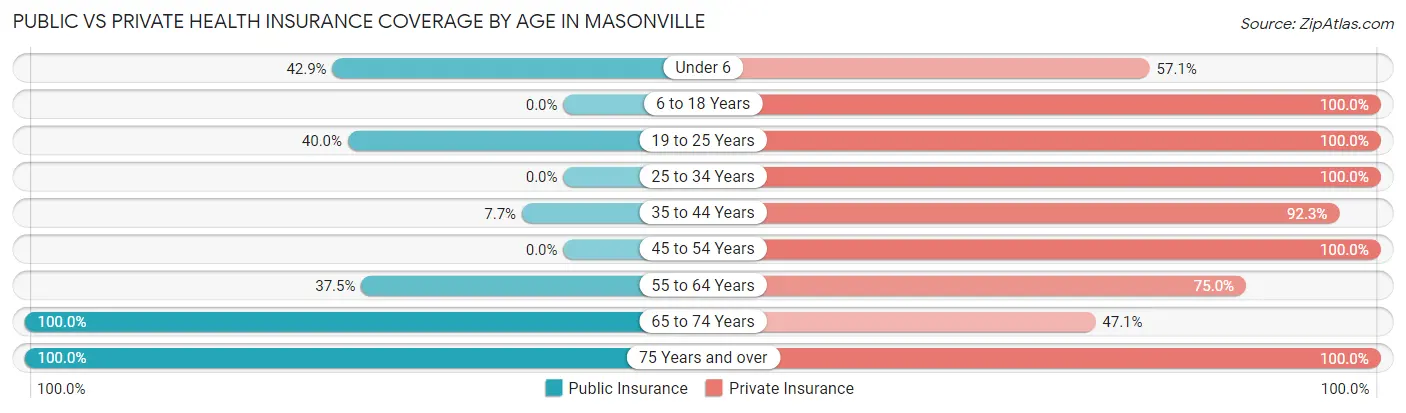
| Age Bracket | Public Insurance | Private Insurance |
| Under 6 | 3 (42.9%) | 4 (57.1%) |
| 6 to 18 Years | 0 (0.0%) | 6 (100.0%) |
| 19 to 25 Years | 2 (40.0%) | 5 (100.0%) |
| 25 to 34 Years | 0 (0.0%) | 6 (100.0%) |
| 35 to 44 Years | 1 (7.7%) | 12 (92.3%) |
| 45 to 54 Years | 0 (0.0%) | 9 (100.0%) |
| 55 to 64 Years | 3 (37.5%) | 6 (75.0%) |
| 65 to 74 Years | 17 (100.0%) | 8 (47.1%) |
| 75 Years and over | 3 (100.0%) | 3 (100.0%) |
| Total | 29 (39.2%) | 59 (79.7%) |
Disability Status by Sex by Age in Masonville
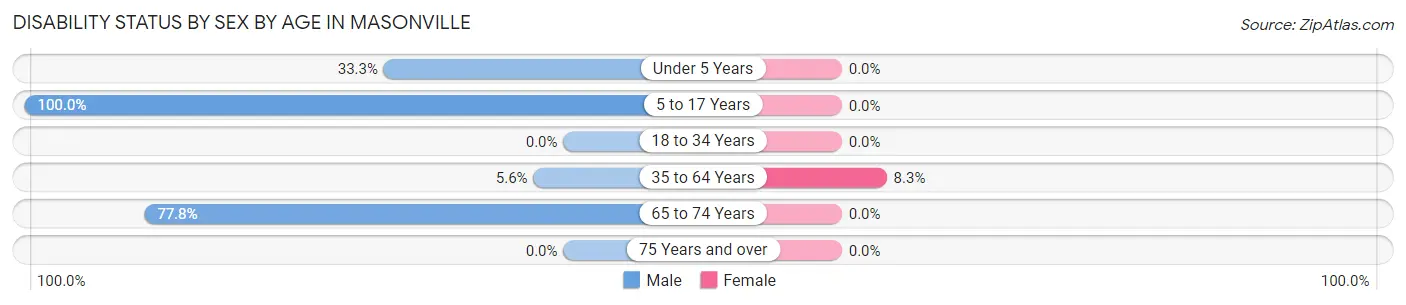
| Age Bracket | Male | Female |
| Under 5 Years | 1 (33.3%) | 0 (0.0%) |
| 5 to 17 Years | 2 (100.0%) | 0 (0.0%) |
| 18 to 34 Years | 0 (0.0%) | 0 (0.0%) |
| 35 to 64 Years | 1 (5.6%) | 1 (8.3%) |
| 65 to 74 Years | 7 (77.8%) | 0 (0.0%) |
| 75 Years and over | 0 (0.0%) | 0 (0.0%) |
Disability Class by Sex by Age in Masonville
Disability Class: Hearing Difficulty
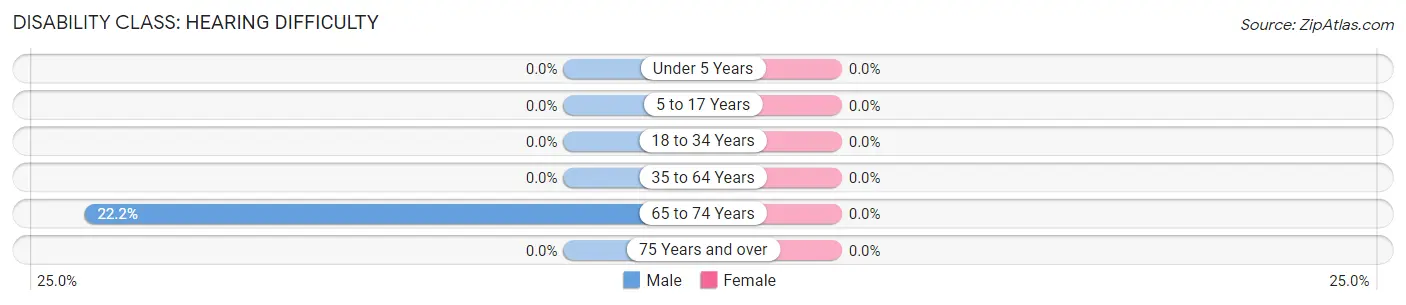
| Age Bracket | Male | Female |
| Under 5 Years | 0 (0.0%) | 0 (0.0%) |
| 5 to 17 Years | 0 (0.0%) | 0 (0.0%) |
| 18 to 34 Years | 0 (0.0%) | 0 (0.0%) |
| 35 to 64 Years | 0 (0.0%) | 0 (0.0%) |
| 65 to 74 Years | 2 (22.2%) | 0 (0.0%) |
| 75 Years and over | 0 (0.0%) | 0 (0.0%) |
Disability Class: Vision Difficulty
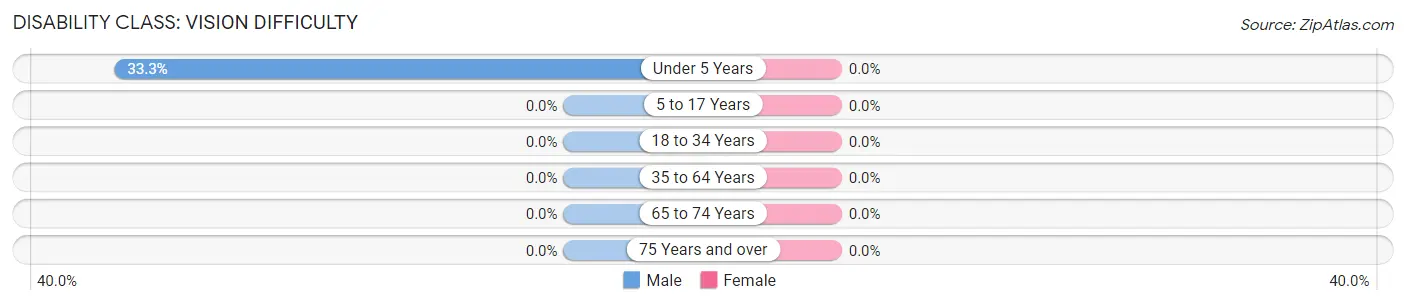
| Age Bracket | Male | Female |
| Under 5 Years | 1 (33.3%) | 0 (0.0%) |
| 5 to 17 Years | 0 (0.0%) | 0 (0.0%) |
| 18 to 34 Years | 0 (0.0%) | 0 (0.0%) |
| 35 to 64 Years | 0 (0.0%) | 0 (0.0%) |
| 65 to 74 Years | 0 (0.0%) | 0 (0.0%) |
| 75 Years and over | 0 (0.0%) | 0 (0.0%) |
Disability Class: Cognitive Difficulty
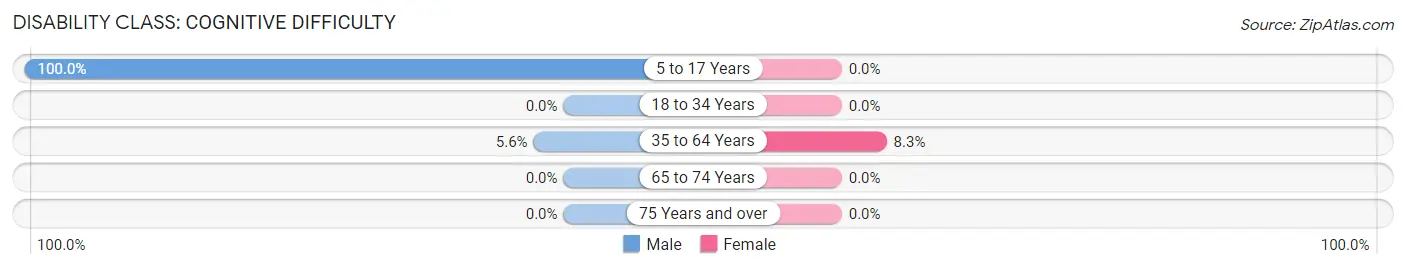
| Age Bracket | Male | Female |
| 5 to 17 Years | 2 (100.0%) | 0 (0.0%) |
| 18 to 34 Years | 0 (0.0%) | 0 (0.0%) |
| 35 to 64 Years | 1 (5.6%) | 1 (8.3%) |
| 65 to 74 Years | 0 (0.0%) | 0 (0.0%) |
| 75 Years and over | 0 (0.0%) | 0 (0.0%) |
Disability Class: Ambulatory Difficulty
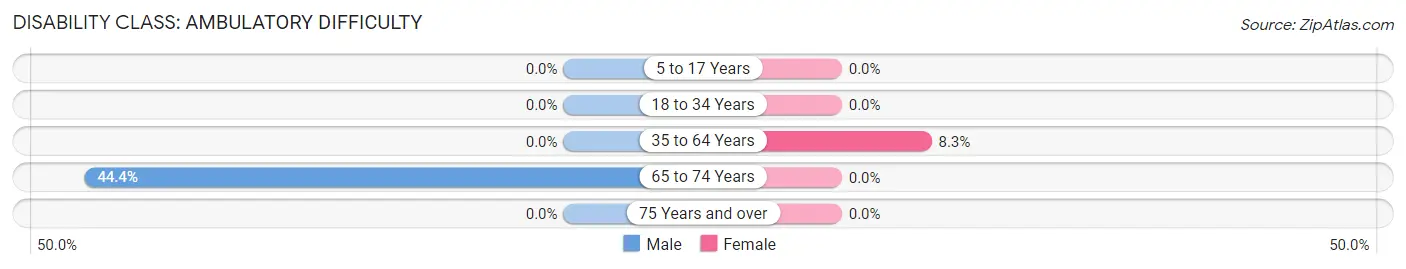
| Age Bracket | Male | Female |
| 5 to 17 Years | 0 (0.0%) | 0 (0.0%) |
| 18 to 34 Years | 0 (0.0%) | 0 (0.0%) |
| 35 to 64 Years | 0 (0.0%) | 1 (8.3%) |
| 65 to 74 Years | 4 (44.4%) | 0 (0.0%) |
| 75 Years and over | 0 (0.0%) | 0 (0.0%) |
Disability Class: Self-Care Difficulty
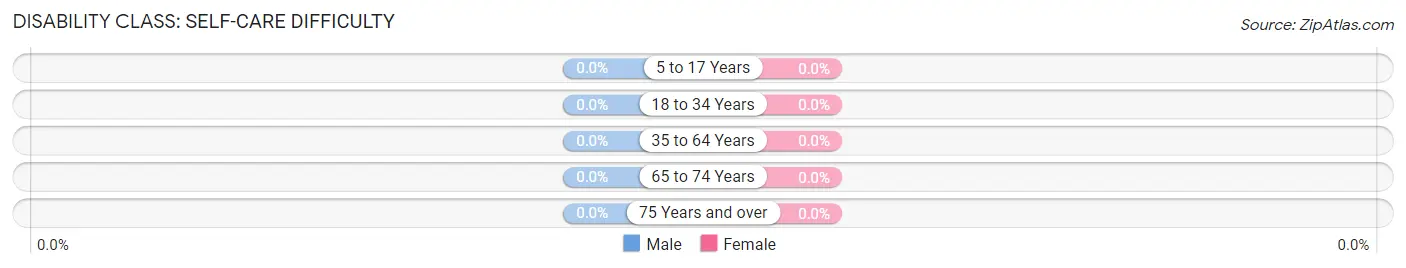
| Age Bracket | Male | Female |
| 5 to 17 Years | 0 (0.0%) | 0 (0.0%) |
| 18 to 34 Years | 0 (0.0%) | 0 (0.0%) |
| 35 to 64 Years | 0 (0.0%) | 0 (0.0%) |
| 65 to 74 Years | 0 (0.0%) | 0 (0.0%) |
| 75 Years and over | 0 (0.0%) | 0 (0.0%) |
Technology Access in Masonville
Computing Device Access in Masonville
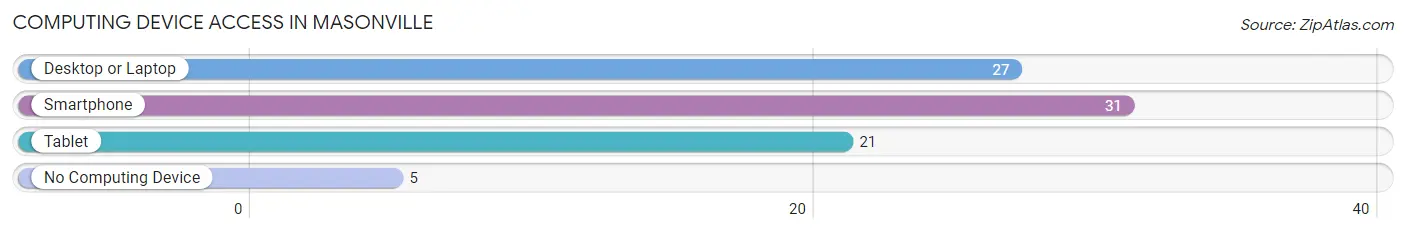
| Device Type | # Households | % Households |
| Desktop or Laptop | 27 | 65.8% |
| Smartphone | 31 | 75.6% |
| Tablet | 21 | 51.2% |
| No Computing Device | 5 | 12.2% |
| Total | 41 | 100.0% |
Internet Access in Masonville
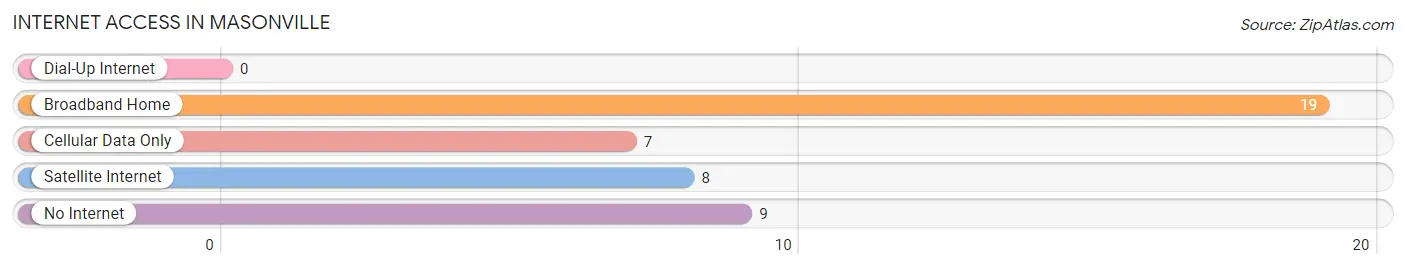
| Internet Type | # Households | % Households |
| Dial-Up Internet | 0 | 0.0% |
| Broadband Home | 19 | 46.3% |
| Cellular Data Only | 7 | 17.1% |
| Satellite Internet | 8 | 19.5% |
| No Internet | 9 | 22.0% |
| Total | 41 | 100.0% |
Masonville Summary
Masonville is a small unincorporated community located in Delaware County, Iowa, United States. It is situated in the extreme northeast corner of the county, near the border with Dubuque County. The population of Masonville was estimated to be around 200 in 2020.
History
Masonville was founded in 1854 by a group of settlers from Masonville, New York. The town was named after the original Masonville, and the settlers brought with them many of the same customs and traditions. The first post office was established in 1855, and the town was officially incorporated in 1856.
Masonville was a thriving community in the late 19th and early 20th centuries. It had a variety of businesses, including a general store, a blacksmith shop, a hotel, a bank, a sawmill, and a grist mill. The town also had a school, a church, and a cemetery.
Geography
Masonville is located in the extreme northeast corner of Delaware County, near the border with Dubuque County. It is situated on the banks of the Maquoketa River, which flows through the town. The town is surrounded by rolling hills and farmland.
The climate in Masonville is typical of the Midwest, with hot summers and cold winters. The average annual temperature is around 50 degrees Fahrenheit, and the average annual precipitation is around 40 inches.
Economy
Masonville’s economy is largely based on agriculture. The town is surrounded by farmland, and many of the residents are involved in farming or related activities. The town also has a few small businesses, including a general store, a gas station, and a restaurant.
Demographics
Masonville is a small, rural community with a population of around 200 people. The population is mostly white, with a small minority of African Americans and Hispanics. The median household income is around $40,000, and the median home value is around $100,000.
Conclusion
Masonville is a small, rural community located in Delaware County, Iowa. It was founded in 1854 by a group of settlers from Masonville, New York, and the town has retained many of the same customs and traditions. The economy of Masonville is largely based on agriculture, and the population is mostly white. Masonville is a peaceful, quiet community with a population of around 200 people.
Common Questions
What is Per Capita Income in Masonville?
Per Capita income in Masonville is $24,439.
What is the Median Family Income in Masonville?
Median Family Income in Masonville is $48,750.
What is the Median Household income in Masonville?
Median Household Income in Masonville is $42,813.
What is Income or Wage Gap in Masonville?
Income or Wage Gap in Masonville is 38.0%.
Women in Masonville earn 62.0 cents for every dollar earned by a man.
What is Inequality or Gini Index in Masonville?
Inequality or Gini Index in Masonville is 0.27.
What is the Total Population of Masonville?
Total Population of Masonville is 74.
What is the Total Male Population of Masonville?
Total Male Population of Masonville is 42.
What is the Total Female Population of Masonville?
Total Female Population of Masonville is 32.
What is the Ratio of Males per 100 Females in Masonville?
There are 131.25 Males per 100 Females in Masonville.
What is the Ratio of Females per 100 Males in Masonville?
There are 76.19 Females per 100 Males in Masonville.
What is the Median Population Age in Masonville?
Median Population Age in Masonville is 46.0 Years.
What is the Average Family Size in Masonville
Average Family Size in Masonville is 2.8 People.
What is the Average Household Size in Masonville
Average Household Size in Masonville is 1.8 People.
How Large is the Labor Force in Masonville?
There are 42 People in the Labor Forcein in Masonville.
What is the Percentage of People in the Labor Force in Masonville?
63.6% of People are in the Labor Force in Masonville.
What is the Unemployment Rate in Masonville?
Unemployment Rate in Masonville is 2.4%.