Pleasant Plain, IA Map & Demographics
Pleasant Plain Map
Pleasant Plain Overview
$36,792
PER CAPITA INCOME
0.34
INEQUALITY / GINI INDEX
79
TOTAL POPULATION
31
MALE POPULATION
48
FEMALE POPULATION
64.58
MALES / 100 FEMALES
154.84
FEMALES / 100 MALES
55.1
MEDIAN AGE
1.9
AVG FAMILY SIZE
1.8
AVG HOUSEHOLD SIZE
38
LABOR FORCE [ PEOPLE ]
49.4%
PERCENT IN LABOR FORCE
Income in Pleasant Plain
Income Overview in Pleasant Plain
| Characteristic | Number | Measure |
| Per Capita Income | 79 | $36,792 |
| Median Family Income | 34 | $0 |
| Mean Family Income | 34 | $74,941 |
| Median Household Income | 44 | $0 |
| Mean Household Income | 44 | $64,759 |
| Income Deficit | 34 | $0 |
| Wage / Income Gap (%) | 79 | 0.00% |
| Wage / Income Gap ($) | 79 | 100.00¢ per $1 |
| Gini / Inequality Index | 79 | 0.34 |
Earnings by Sex in Pleasant Plain
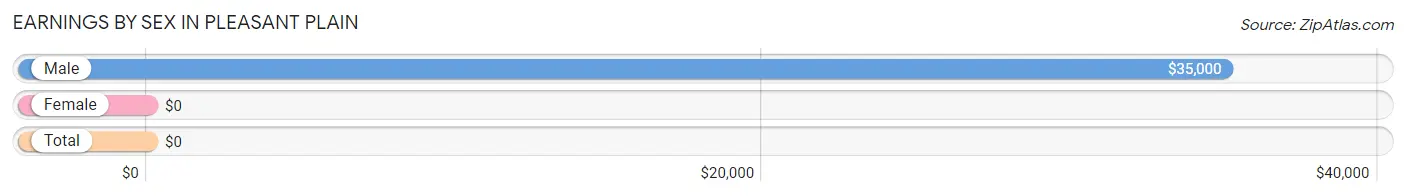
| Sex | Number | Average Earnings |
| Male | 16 (38.1%) | $35,000 |
| Female | 26 (61.9%) | $0 |
| Total | 42 (100.0%) | $0 |
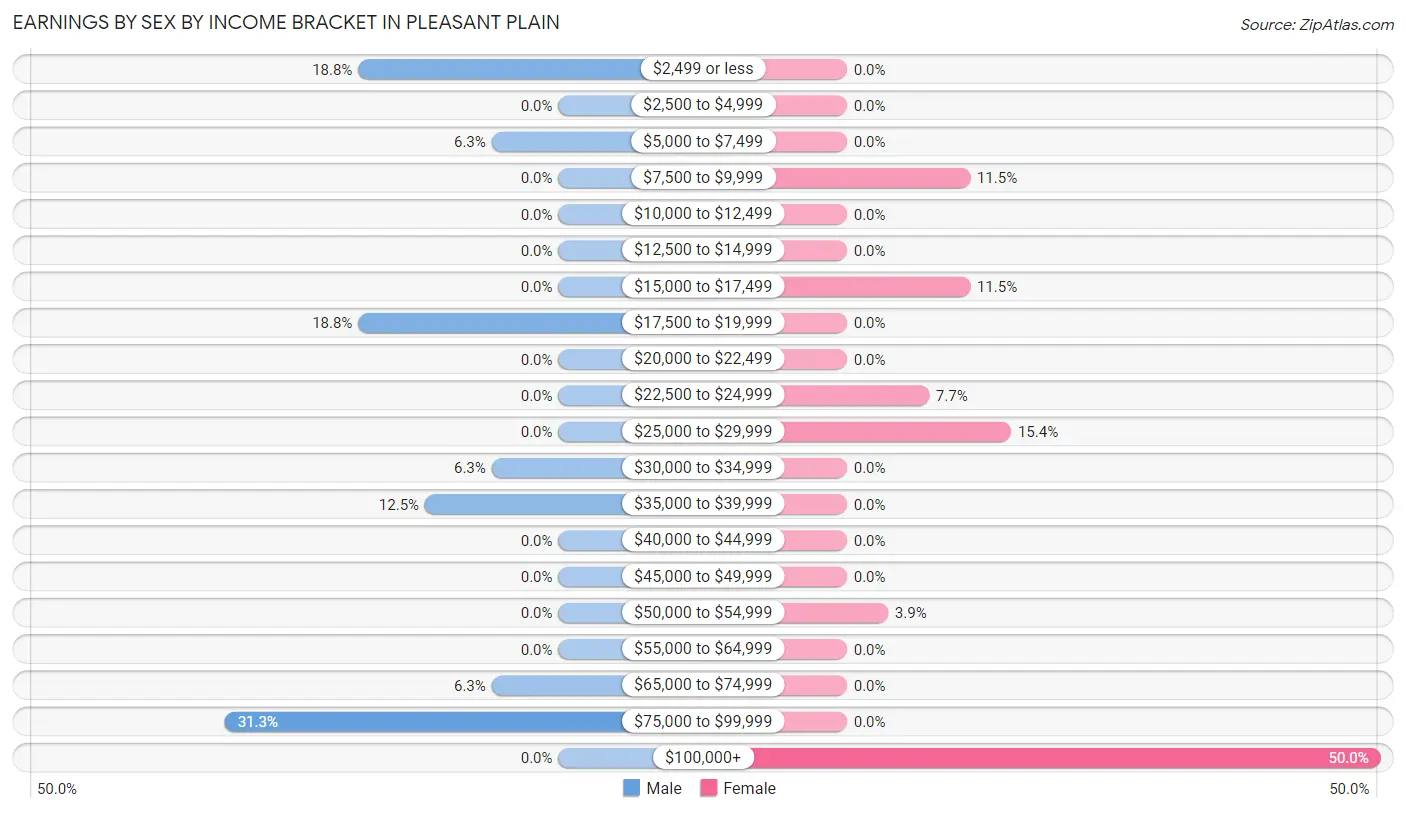
Earnings by Sex by Income Bracket in Pleasant Plain
The most common earnings brackets in Pleasant Plain are $75,000 to $99,999 for men (5 | 31.2%) and $100,000+ for women (13 | 50.0%).
| Income | Male | Female |
| $2,499 or less | 3 (18.8%) | 0 (0.0%) |
| $2,500 to $4,999 | 0 (0.0%) | 0 (0.0%) |
| $5,000 to $7,499 | 1 (6.2%) | 0 (0.0%) |
| $7,500 to $9,999 | 0 (0.0%) | 3 (11.5%) |
| $10,000 to $12,499 | 0 (0.0%) | 0 (0.0%) |
| $12,500 to $14,999 | 0 (0.0%) | 0 (0.0%) |
| $15,000 to $17,499 | 0 (0.0%) | 3 (11.5%) |
| $17,500 to $19,999 | 3 (18.8%) | 0 (0.0%) |
| $20,000 to $22,499 | 0 (0.0%) | 0 (0.0%) |
| $22,500 to $24,999 | 0 (0.0%) | 2 (7.7%) |
| $25,000 to $29,999 | 0 (0.0%) | 4 (15.4%) |
| $30,000 to $34,999 | 1 (6.2%) | 0 (0.0%) |
| $35,000 to $39,999 | 2 (12.5%) | 0 (0.0%) |
| $40,000 to $44,999 | 0 (0.0%) | 0 (0.0%) |
| $45,000 to $49,999 | 0 (0.0%) | 0 (0.0%) |
| $50,000 to $54,999 | 0 (0.0%) | 1 (3.8%) |
| $55,000 to $64,999 | 0 (0.0%) | 0 (0.0%) |
| $65,000 to $74,999 | 1 (6.2%) | 0 (0.0%) |
| $75,000 to $99,999 | 5 (31.2%) | 0 (0.0%) |
| $100,000+ | 0 (0.0%) | 13 (50.0%) |
| Total | 16 (100.0%) | 26 (100.0%) |
Earnings by Sex by Educational Attainment in Pleasant Plain
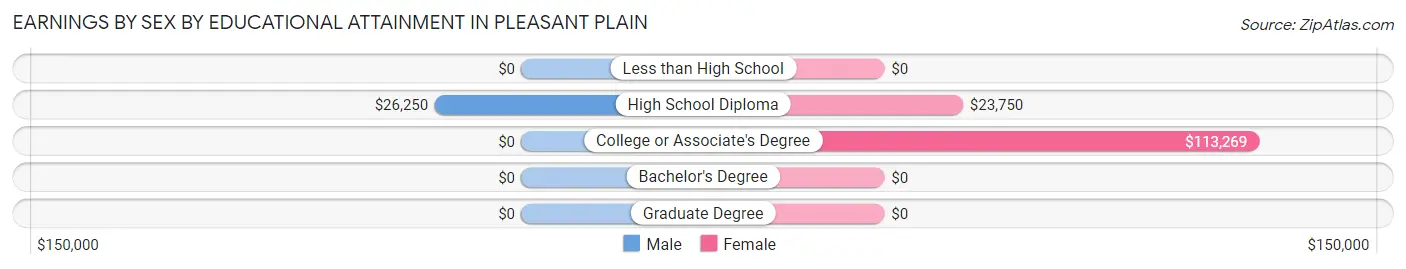
| Educational Attainment | Male Income | Female Income |
| Less than High School | - | - |
| High School Diploma | $26,250 | $23,750 |
| College or Associate's Degree | - | - |
| Bachelor's Degree | - | - |
| Graduate Degree | - | - |
| Total | - | - |
Family Income in Pleasant Plain
Family Income Brackets in Pleasant Plain
According to the Pleasant Plain family income data, there are 14 families falling into the $100,000 to $149,999 income range, which is the most common income bracket and makes up 41.2% of all families.
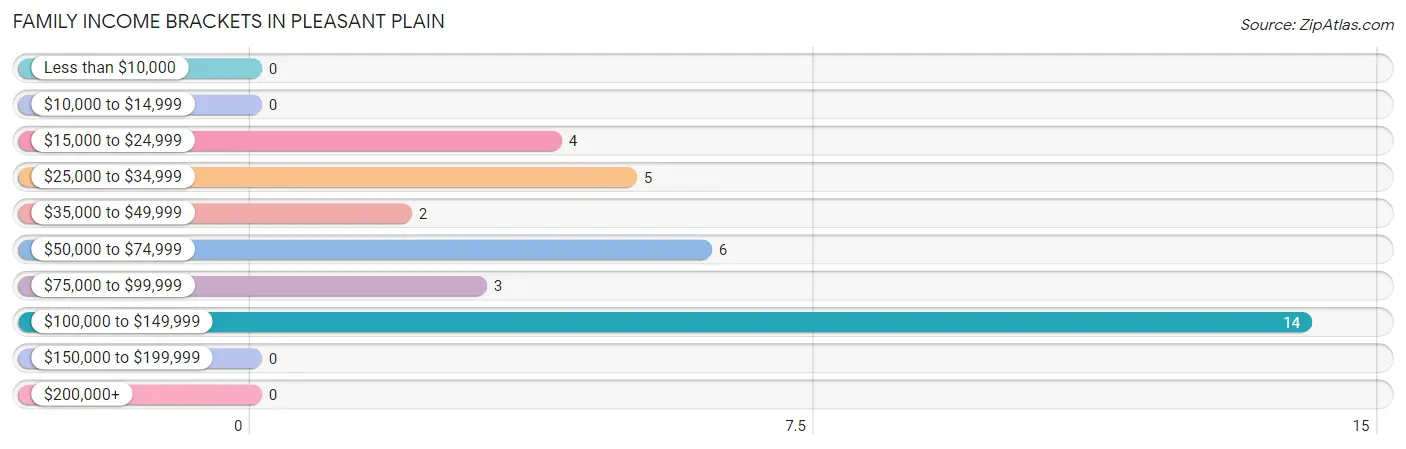
| Income Bracket | # Families | % Families |
| Less than $10,000 | 0 | 0.0% |
| $10,000 to $14,999 | 0 | 0.0% |
| $15,000 to $24,999 | 4 | 11.8% |
| $25,000 to $34,999 | 5 | 14.7% |
| $35,000 to $49,999 | 2 | 5.9% |
| $50,000 to $74,999 | 6 | 17.6% |
| $75,000 to $99,999 | 3 | 8.8% |
| $100,000 to $149,999 | 14 | 41.2% |
| $150,000 to $199,999 | 0 | 0.0% |
| $200,000+ | 0 | 0.0% |
Family Income by Famaliy Size in Pleasant Plain
| Income Bracket | # Families | Median Income |
| 2-Person Families | 31 (91.2%) | $0 |
| 3-Person Families | 2 (5.9%) | $0 |
| 4-Person Families | 1 (2.9%) | $0 |
| 5-Person Families | 0 (0.0%) | $0 |
| 6-Person Families | 0 (0.0%) | $0 |
| 7+ Person Families | 0 (0.0%) | $0 |
| Total | 34 (100.0%) | $0 |
Family Income by Number of Earners in Pleasant Plain
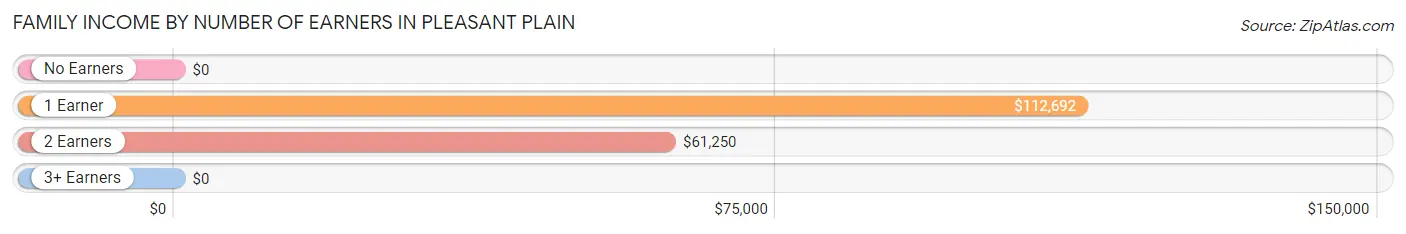
| Number of Earners | # Families | Median Income |
| No Earners | 3 (8.8%) | $0 |
| 1 Earner | 24 (70.6%) | $112,692 |
| 2 Earners | 6 (17.6%) | $61,250 |
| 3+ Earners | 1 (2.9%) | $0 |
| Total | 34 (100.0%) | $0 |
Household Income in Pleasant Plain
Household Income Brackets in Pleasant Plain
With 14 households falling in the category, the $100,000 to $149,999 income range is the most frequent in Pleasant Plain, accounting for 31.8% of all households.
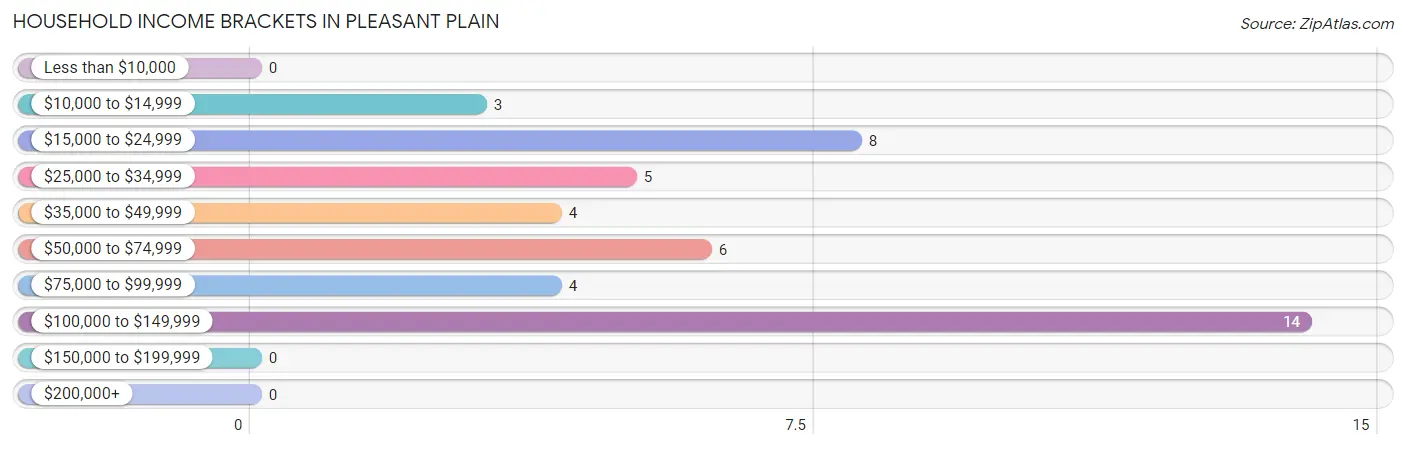
| Income Bracket | # Households | % Households |
| Less than $10,000 | 0 | 0.0% |
| $10,000 to $14,999 | 3 | 6.8% |
| $15,000 to $24,999 | 8 | 18.2% |
| $25,000 to $34,999 | 5 | 11.4% |
| $35,000 to $49,999 | 4 | 9.1% |
| $50,000 to $74,999 | 6 | 13.6% |
| $75,000 to $99,999 | 4 | 9.1% |
| $100,000 to $149,999 | 14 | 31.8% |
| $150,000 to $199,999 | 0 | 0.0% |
| $200,000+ | 0 | 0.0% |
Household Income by Householder Age in Pleasant Plain
The median household income in Pleasant Plain is $0, with the highest median household income of $112,788 found in the 45 to 64 years age bracket for the primary householder. A total of 25 households (56.8%) fall into this category. Meanwhile, the 15 to 24 years age bracket for the primary householder has the lowest median household income of $0, with 1 households (2.3%) in this group.
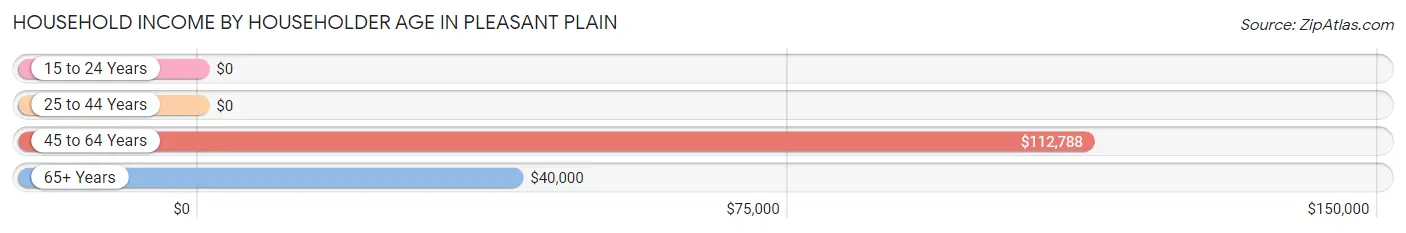
| Income Bracket | # Households | Median Income |
| 15 to 24 Years | 1 (2.3%) | $0 |
| 25 to 44 Years | 2 (4.5%) | $0 |
| 45 to 64 Years | 25 (56.8%) | $112,788 |
| 65+ Years | 16 (36.4%) | $40,000 |
| Total | 44 (100.0%) | $0 |
Poverty in Pleasant Plain
Income Below Poverty by Sex and Age in Pleasant Plain
With 6.5% poverty level for males and 8.3% for females among the residents of Pleasant Plain, 55 to 64 year old males and 55 to 64 year old females are the most vulnerable to poverty, with 2 males (40.0%) and 3 females (25.0%) in their respective age groups living below the poverty level.
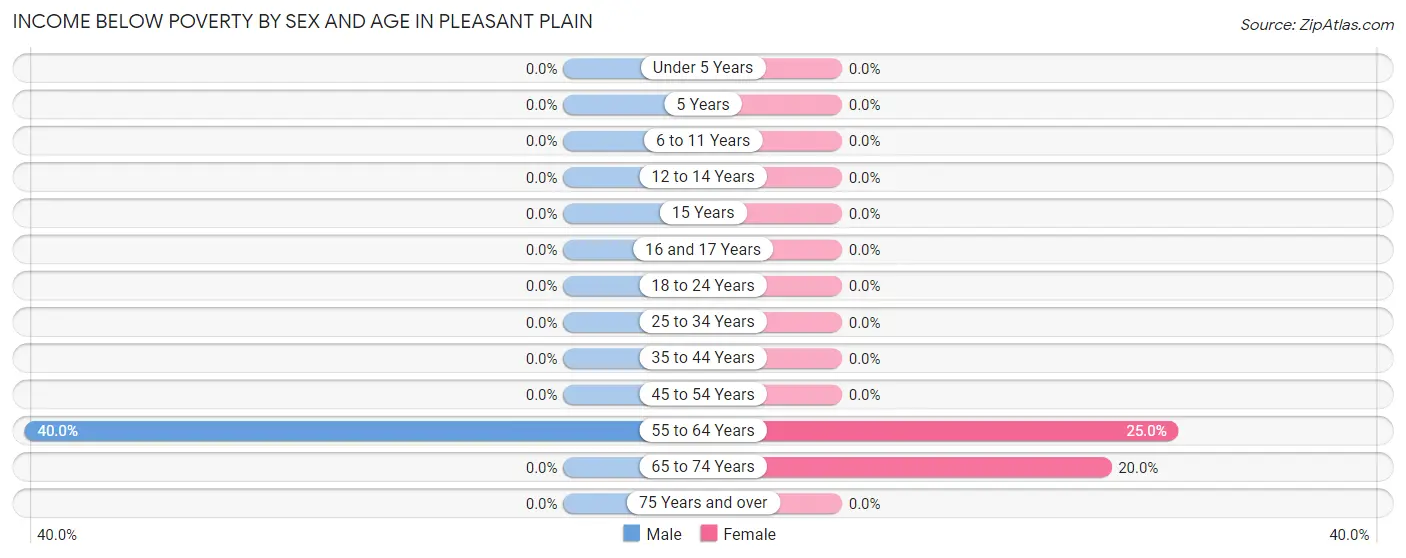
| Age Bracket | Male | Female |
| Under 5 Years | 0 (0.0%) | 0 (0.0%) |
| 5 Years | 0 (0.0%) | 0 (0.0%) |
| 6 to 11 Years | 0 (0.0%) | 0 (0.0%) |
| 12 to 14 Years | 0 (0.0%) | 0 (0.0%) |
| 15 Years | 0 (0.0%) | 0 (0.0%) |
| 16 and 17 Years | 0 (0.0%) | 0 (0.0%) |
| 18 to 24 Years | 0 (0.0%) | 0 (0.0%) |
| 25 to 34 Years | 0 (0.0%) | 0 (0.0%) |
| 35 to 44 Years | 0 (0.0%) | 0 (0.0%) |
| 45 to 54 Years | 0 (0.0%) | 0 (0.0%) |
| 55 to 64 Years | 2 (40.0%) | 3 (25.0%) |
| 65 to 74 Years | 0 (0.0%) | 1 (20.0%) |
| 75 Years and over | 0 (0.0%) | 0 (0.0%) |
| Total | 2 (6.5%) | 4 (8.3%) |
Income Above Poverty by Sex and Age in Pleasant Plain
According to the poverty statistics in Pleasant Plain, males aged under 5 years and females aged 16 and 17 years are the age groups that are most secure financially, with 100.0% of males and 100.0% of females in these age groups living above the poverty line.
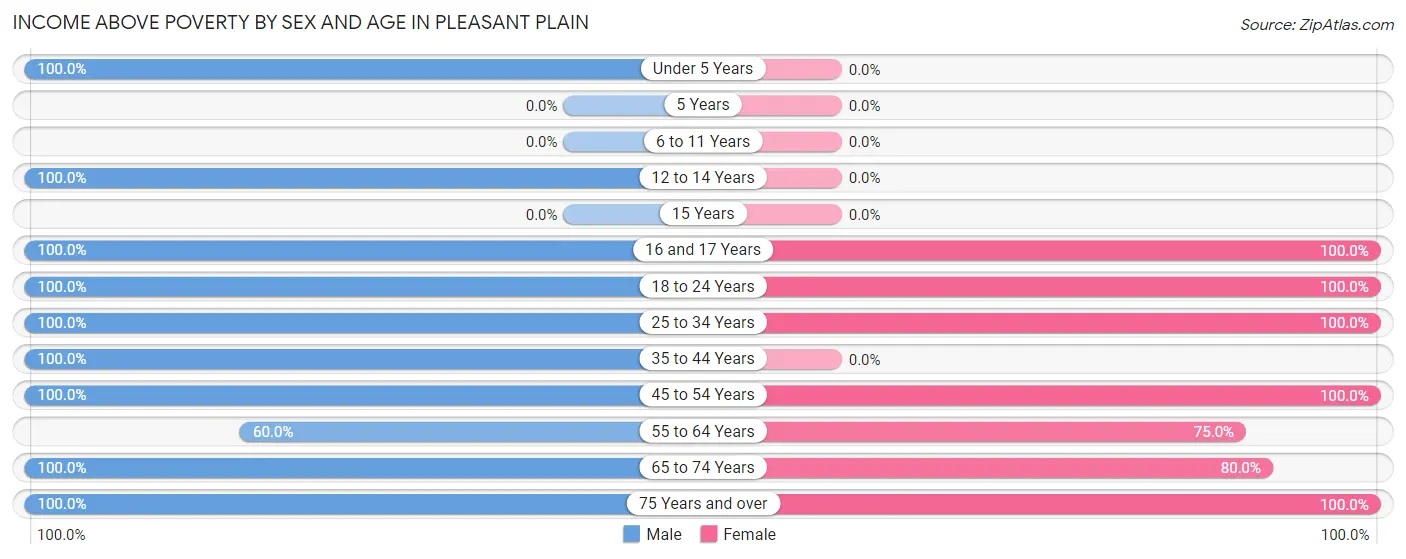
| Age Bracket | Male | Female |
| Under 5 Years | 1 (100.0%) | 0 (0.0%) |
| 5 Years | 0 (0.0%) | 0 (0.0%) |
| 6 to 11 Years | 0 (0.0%) | 0 (0.0%) |
| 12 to 14 Years | 1 (100.0%) | 0 (0.0%) |
| 15 Years | 0 (0.0%) | 0 (0.0%) |
| 16 and 17 Years | 1 (100.0%) | 7 (100.0%) |
| 18 to 24 Years | 2 (100.0%) | 1 (100.0%) |
| 25 to 34 Years | 3 (100.0%) | 2 (100.0%) |
| 35 to 44 Years | 3 (100.0%) | 0 (0.0%) |
| 45 to 54 Years | 1 (100.0%) | 17 (100.0%) |
| 55 to 64 Years | 3 (60.0%) | 9 (75.0%) |
| 65 to 74 Years | 10 (100.0%) | 4 (80.0%) |
| 75 Years and over | 4 (100.0%) | 4 (100.0%) |
| Total | 29 (93.5%) | 44 (91.7%) |
Income Below Poverty Among Married-Couple Families in Pleasant Plain
The poverty statistics for married-couple families in Pleasant Plain show that 10.5% or 2 of the total 19 families live below the poverty line. Families with no children have the highest poverty rate of 11.8%, comprising of 2 families. On the other hand, families with 1 or 2 children have the lowest poverty rate of 0.0%, which includes 0 families.
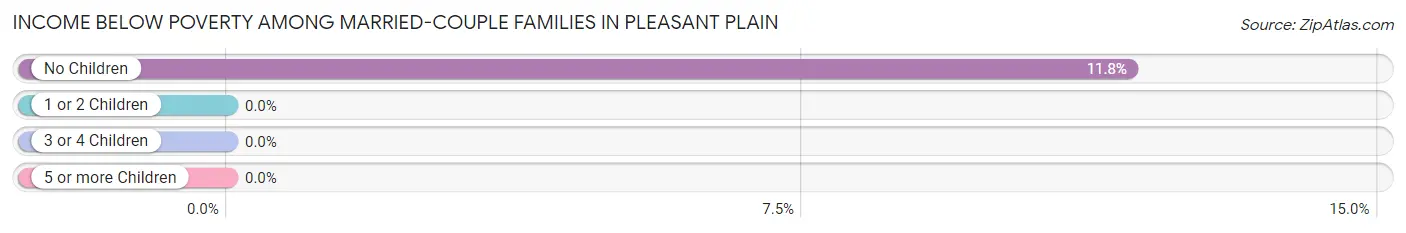
| Children | Above Poverty | Below Poverty |
| No Children | 15 (88.2%) | 2 (11.8%) |
| 1 or 2 Children | 2 (100.0%) | 0 (0.0%) |
| 3 or 4 Children | 0 (0.0%) | 0 (0.0%) |
| 5 or more Children | 0 (0.0%) | 0 (0.0%) |
| Total | 17 (89.5%) | 2 (10.5%) |
Income Below Poverty Among Single-Parent Households in Pleasant Plain
| Children | Single Father | Single Mother |
| No Children | 0 (0.0%) | 0 (0.0%) |
| 1 or 2 Children | 0 (0.0%) | 0 (0.0%) |
| 3 or 4 Children | 0 (0.0%) | 0 (0.0%) |
| 5 or more Children | 0 (0.0%) | 0 (0.0%) |
| Total | 0 (0.0%) | 0 (0.0%) |
Income Below Poverty Among Married-Couple vs Single-Parent Households in Pleasant Plain
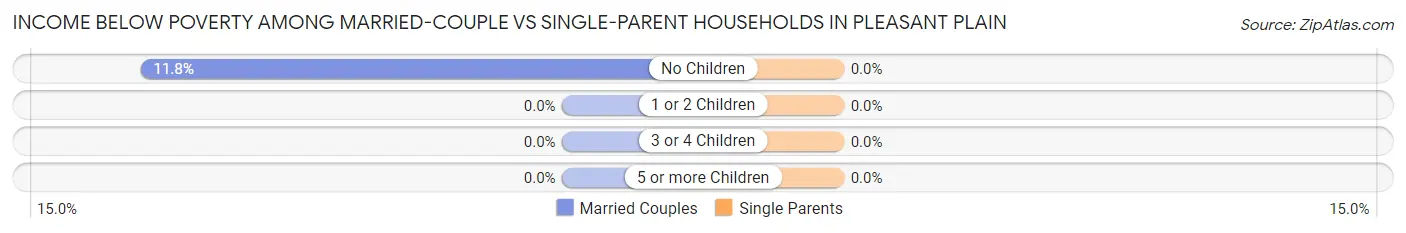
| Children | Married-Couple Families | Single-Parent Households |
| No Children | 2 (11.8%) | 0 (0.0%) |
| 1 or 2 Children | 0 (0.0%) | 0 (0.0%) |
| 3 or 4 Children | 0 (0.0%) | 0 (0.0%) |
| 5 or more Children | 0 (0.0%) | 0 (0.0%) |
| Total | 2 (10.5%) | 0 (0.0%) |
Race in Pleasant Plain
The most populous races in Pleasant Plain are , and White / Caucasian (79 | 100.0%).
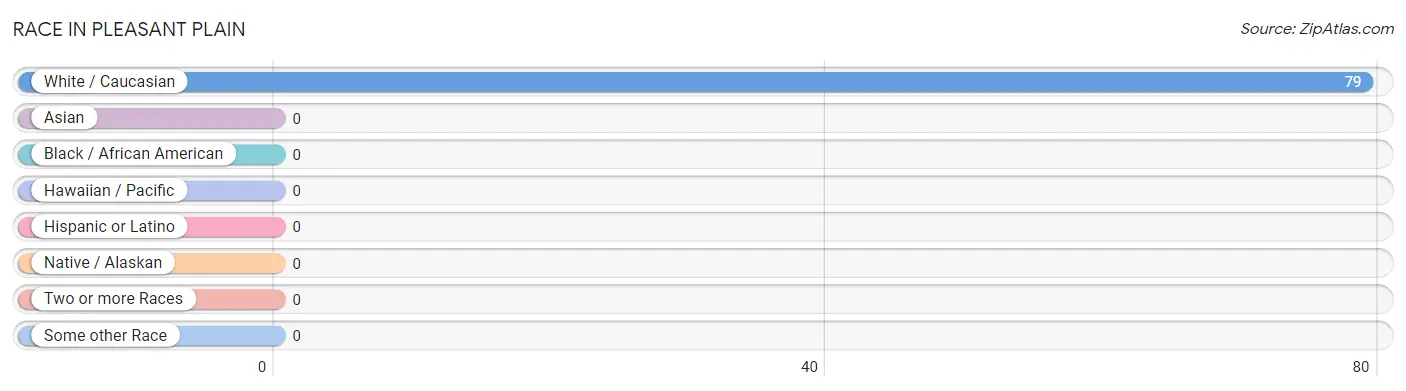
| Race | # Population | % Population |
| Asian | 0 | 0.0% |
| Black / African American | 0 | 0.0% |
| Hawaiian / Pacific | 0 | 0.0% |
| Hispanic or Latino | 0 | 0.0% |
| Native / Alaskan | 0 | 0.0% |
| White / Caucasian | 79 | 100.0% |
| Two or more Races | 0 | 0.0% |
| Some other Race | 0 | 0.0% |
| Total | 79 | 100.0% |
Ancestry in Pleasant Plain
The most populous ancestries reported in Pleasant Plain are German (20 | 25.3%), Irish (6 | 7.6%), American (5 | 6.3%), Scottish (5 | 6.3%), and English (2 | 2.5%), together accounting for 48.1% of all Pleasant Plain residents.
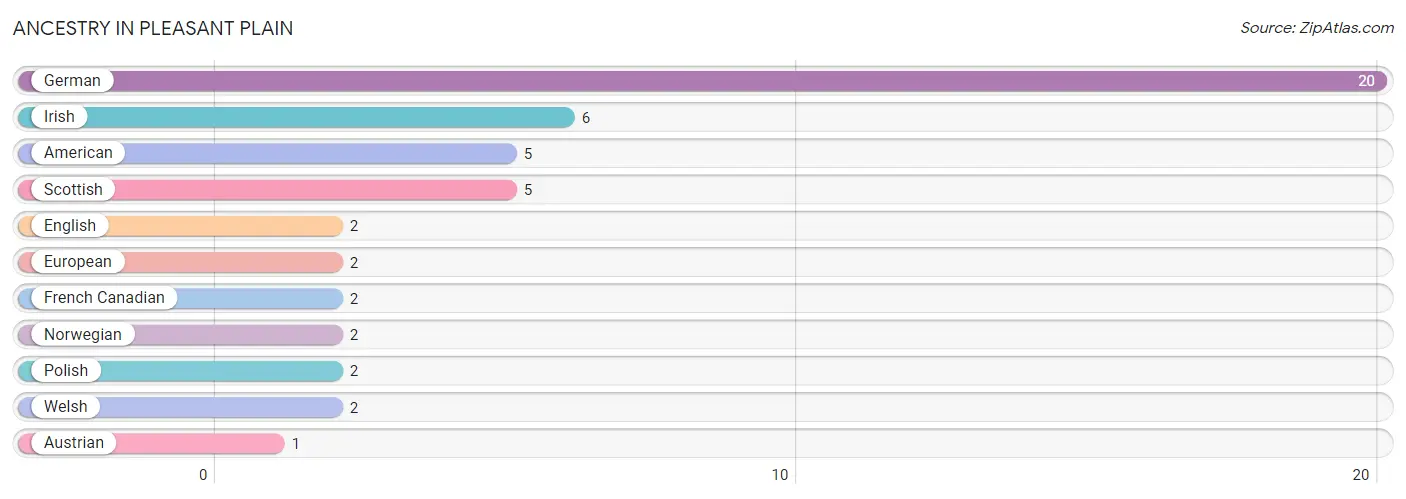
| Ancestry | # Population | % Population |
| American | 5 | 6.3% |
| Austrian | 1 | 1.3% |
| English | 2 | 2.5% |
| European | 2 | 2.5% |
| French Canadian | 2 | 2.5% |
| German | 20 | 25.3% |
| Irish | 6 | 7.6% |
| Norwegian | 2 | 2.5% |
| Polish | 2 | 2.5% |
| Scottish | 5 | 6.3% |
| Welsh | 2 | 2.5% | View All 11 Rows |
Immigrants in Pleasant Plain

| Immigration Origin | # Population | % Population | View All 0 Rows |
Sex and Age in Pleasant Plain
Sex and Age in Pleasant Plain
The most populous age groups in Pleasant Plain are 70 to 74 Years (8 | 25.8%) for men and 45 to 49 Years (17 | 35.4%) for women.
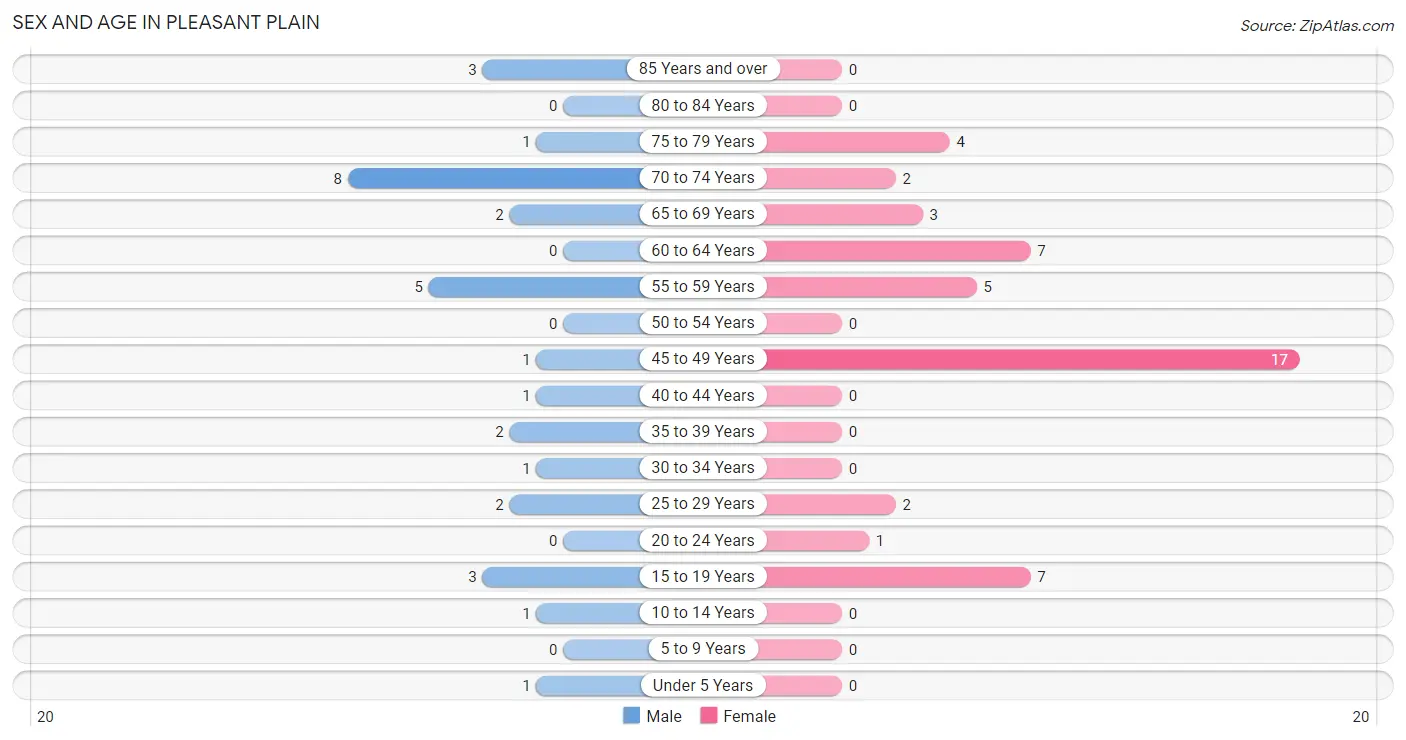
| Age Bracket | Male | Female |
| Under 5 Years | 1 (3.2%) | 0 (0.0%) |
| 5 to 9 Years | 0 (0.0%) | 0 (0.0%) |
| 10 to 14 Years | 1 (3.2%) | 0 (0.0%) |
| 15 to 19 Years | 3 (9.7%) | 7 (14.6%) |
| 20 to 24 Years | 0 (0.0%) | 1 (2.1%) |
| 25 to 29 Years | 2 (6.5%) | 2 (4.2%) |
| 30 to 34 Years | 1 (3.2%) | 0 (0.0%) |
| 35 to 39 Years | 2 (6.5%) | 0 (0.0%) |
| 40 to 44 Years | 1 (3.2%) | 0 (0.0%) |
| 45 to 49 Years | 1 (3.2%) | 17 (35.4%) |
| 50 to 54 Years | 0 (0.0%) | 0 (0.0%) |
| 55 to 59 Years | 5 (16.1%) | 5 (10.4%) |
| 60 to 64 Years | 0 (0.0%) | 7 (14.6%) |
| 65 to 69 Years | 2 (6.5%) | 3 (6.2%) |
| 70 to 74 Years | 8 (25.8%) | 2 (4.2%) |
| 75 to 79 Years | 1 (3.2%) | 4 (8.3%) |
| 80 to 84 Years | 0 (0.0%) | 0 (0.0%) |
| 85 Years and over | 3 (9.7%) | 0 (0.0%) |
| Total | 31 (100.0%) | 48 (100.0%) |
Families and Households in Pleasant Plain
Median Family Size in Pleasant Plain
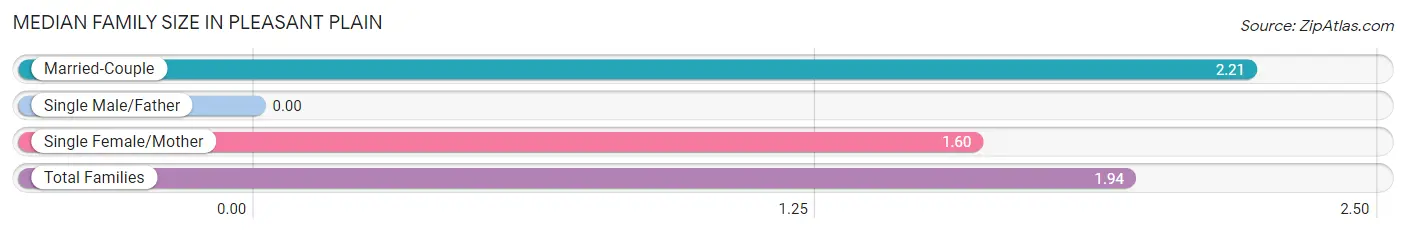
| Family Type | # Families | Family Size |
| Married-Couple | 19 (55.9%) | 2.21 |
| Single Male/Father | 0 (0.0%) | - |
| Single Female/Mother | 15 (44.1%) | 1.60 |
| Total Families | 34 (100.0%) | 1.94 |
Median Household Size in Pleasant Plain
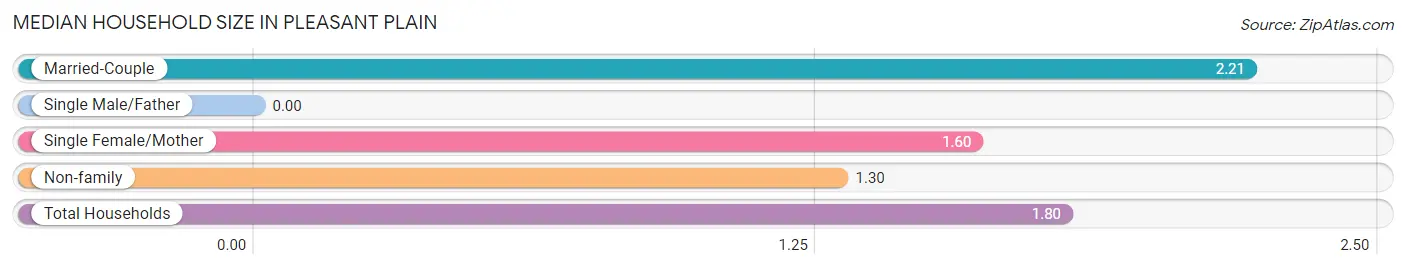
| Household Type | # Households | Household Size |
| Married-Couple | 19 (43.2%) | 2.21 |
| Single Male/Father | 0 (0.0%) | - |
| Single Female/Mother | 15 (34.1%) | 1.60 |
| Non-family | 10 (22.7%) | 1.30 |
| Total Households | 44 (100.0%) | 1.80 |
Household Size by Marriage Status in Pleasant Plain
Out of a total of 44 households in Pleasant Plain, 34 (77.3%) are family households, while 10 (22.7%) are nonfamily households. The most numerous type of family households are 2-person households, comprising 31, and the most common type of nonfamily households are 1-person households, comprising 8.
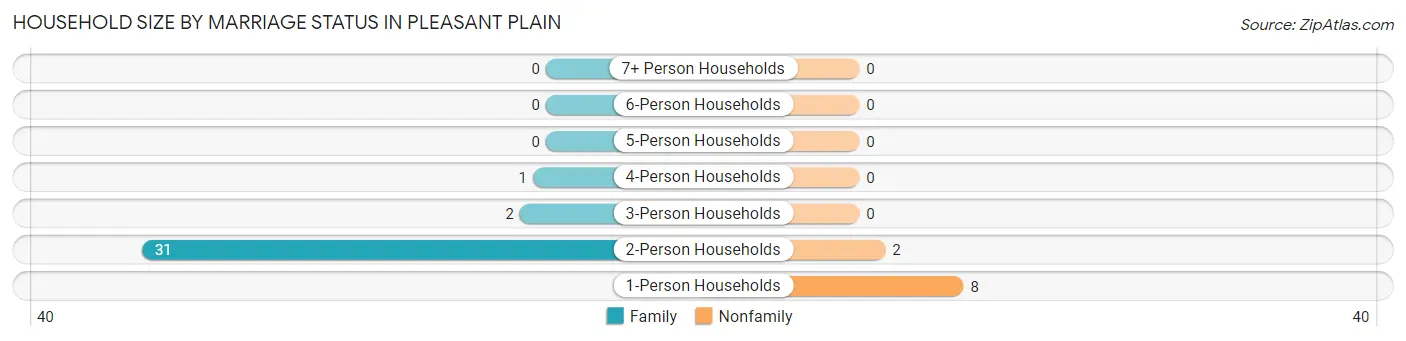
| Household Size | Family Households | Nonfamily Households |
| 1-Person Households | - | 8 (18.2%) |
| 2-Person Households | 31 (70.5%) | 2 (4.5%) |
| 3-Person Households | 2 (4.5%) | 0 (0.0%) |
| 4-Person Households | 1 (2.3%) | 0 (0.0%) |
| 5-Person Households | 0 (0.0%) | 0 (0.0%) |
| 6-Person Households | 0 (0.0%) | 0 (0.0%) |
| 7+ Person Households | 0 (0.0%) | 0 (0.0%) |
| Total | 34 (77.3%) | 10 (22.7%) |
Female Fertility in Pleasant Plain
Fertility by Age in Pleasant Plain
| Age Bracket | Women with Births | Births / 1,000 Women |
| 15 to 19 years | 0 (0.0%) | 0.0 |
| 20 to 34 years | 0 (0.0%) | 0.0 |
| 35 to 50 years | 0 (0.0%) | 0.0 |
| Total | 0 (0.0%) | 0.0 |
Fertility by Age by Marriage Status in Pleasant Plain
| Age Bracket | Married | Unmarried |
| 15 to 19 years | 0 (0.0%) | 0 (0.0%) |
| 20 to 34 years | 0 (0.0%) | 0 (0.0%) |
| 35 to 50 years | 0 (0.0%) | 0 (0.0%) |
| Total | 0 (0.0%) | 0 (0.0%) |
Fertility by Education in Pleasant Plain
| Educational Attainment | Women with Births | Births / 1,000 Women |
| Less than High School | 0 (0.0%) | 0.0 |
| High School Diploma | 0 (0.0%) | 0.0 |
| College or Associate's Degree | 0 (0.0%) | 0.0 |
| Bachelor's Degree | 0 (0.0%) | 0.0 |
| Graduate Degree | 0 (0.0%) | 0.0 |
| Total | 0 (0.0%) | 0.0 |
Fertility by Education by Marriage Status in Pleasant Plain
| Educational Attainment | Married | Unmarried |
| Less than High School | 0 (0.0%) | 0 (0.0%) |
| High School Diploma | 0 (0.0%) | 0 (0.0%) |
| College or Associate's Degree | 0 (0.0%) | 0 (0.0%) |
| Bachelor's Degree | 0 (0.0%) | 0 (0.0%) |
| Graduate Degree | 0 (0.0%) | 0 (0.0%) |
| Total | 0 (0.0%) | 0 (0.0%) |
Employment Characteristics in Pleasant Plain
Employment by Class of Employer in Pleasant Plain
Among the 38 employed individuals in Pleasant Plain, private company employees (25 | 65.8%), self-employed (incorporated) (3 | 7.9%), and self-employed (not incorporated) (3 | 7.9%) make up the most common classes of employment.
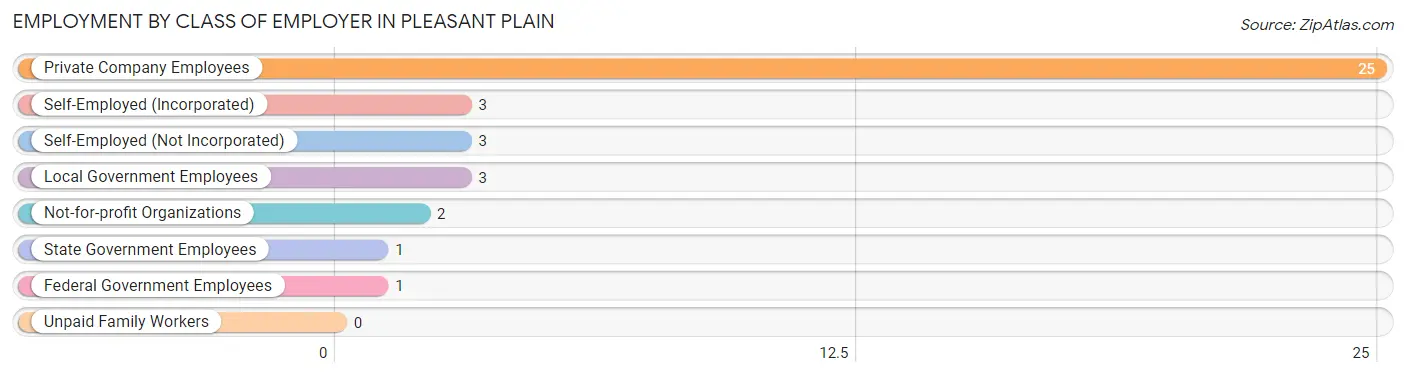
| Employer Class | # Employees | % Employees |
| Private Company Employees | 25 | 65.8% |
| Self-Employed (Incorporated) | 3 | 7.9% |
| Self-Employed (Not Incorporated) | 3 | 7.9% |
| Not-for-profit Organizations | 2 | 5.3% |
| Local Government Employees | 3 | 7.9% |
| State Government Employees | 1 | 2.6% |
| Federal Government Employees | 1 | 2.6% |
| Unpaid Family Workers | 0 | 0.0% |
| Total | 38 | 100.0% |
Employment Status by Age in Pleasant Plain
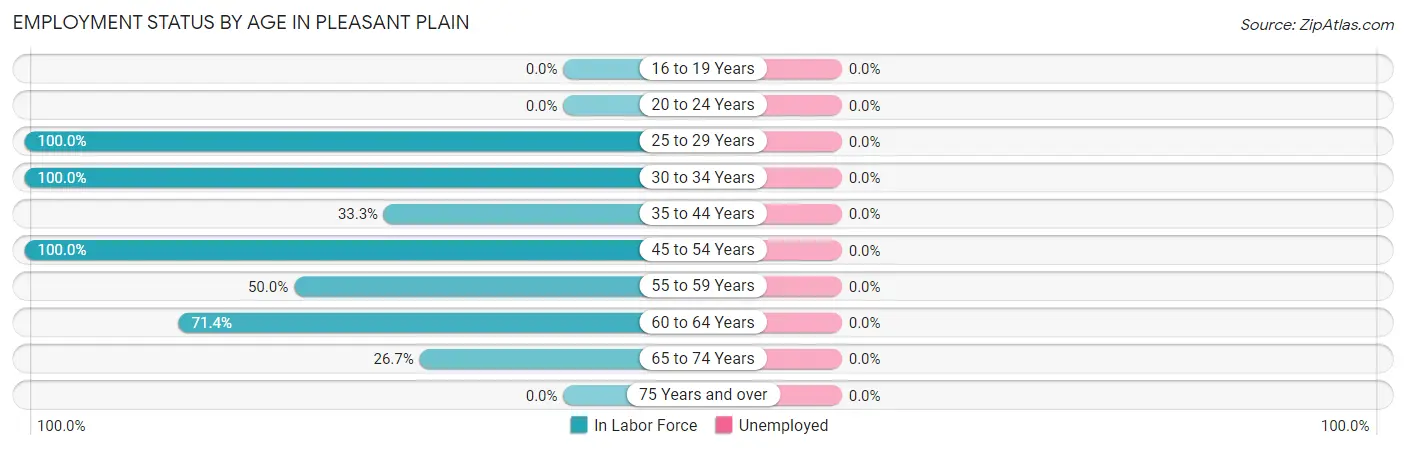
| Age Bracket | In Labor Force | Unemployed |
| 16 to 19 Years | 0 (0.0%) | 0 (0.0%) |
| 20 to 24 Years | 0 (0.0%) | 0 (0.0%) |
| 25 to 29 Years | 4 (100.0%) | 0 (0.0%) |
| 30 to 34 Years | 1 (100.0%) | 0 (0.0%) |
| 35 to 44 Years | 1 (33.3%) | 0 (0.0%) |
| 45 to 54 Years | 18 (100.0%) | 0 (0.0%) |
| 55 to 59 Years | 5 (50.0%) | 0 (0.0%) |
| 60 to 64 Years | 5 (71.4%) | 0 (0.0%) |
| 65 to 74 Years | 4 (26.7%) | 0 (0.0%) |
| 75 Years and over | 0 (0.0%) | 0 (0.0%) |
| Total | 38 (49.4%) | 0 (0.0%) |
Employment Status by Educational Attainment in Pleasant Plain
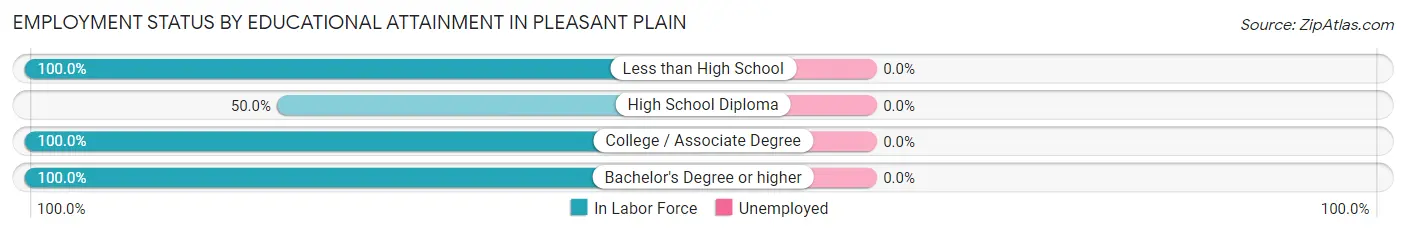
| Educational Attainment | In Labor Force | Unemployed |
| Less than High School | 2 (100.0%) | 0 (0.0%) |
| High School Diploma | 9 (50.0%) | 0 (0.0%) |
| College / Associate Degree | 20 (100.0%) | 0 (0.0%) |
| Bachelor's Degree or higher | 3 (100.0%) | 0 (0.0%) |
| Total | 34 (79.1%) | 0 (0.0%) |
Employment Occupations by Sex in Pleasant Plain
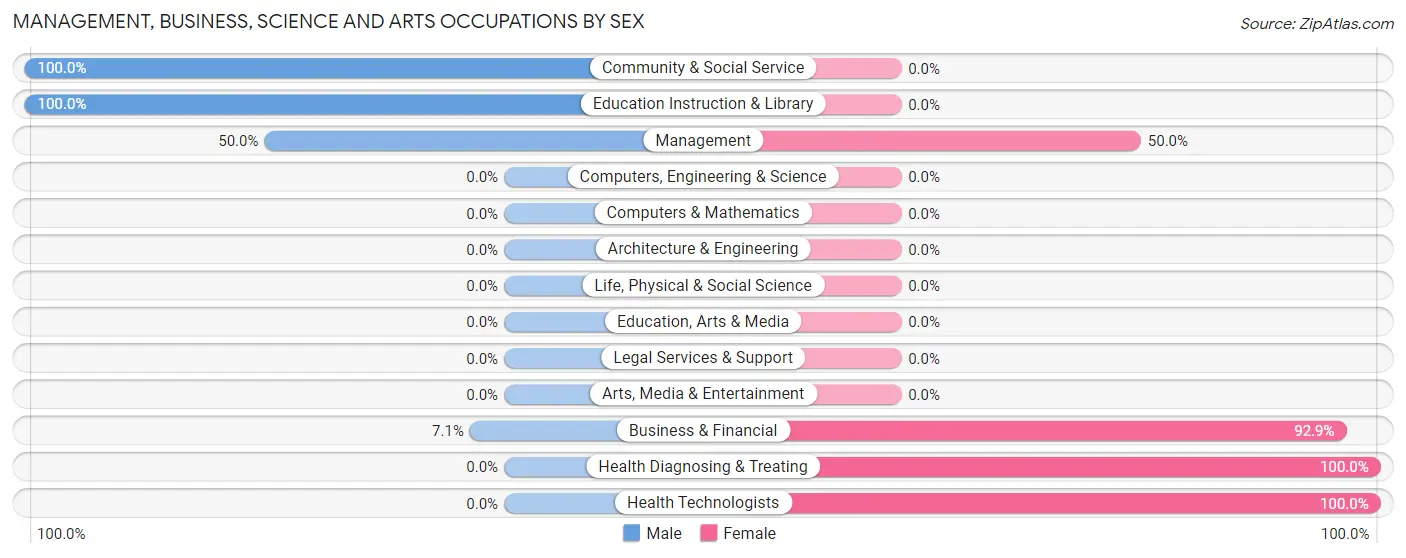
Management, Business, Science and Arts Occupations
The most common Management, Business, Science and Arts occupations in Pleasant Plain are Business & Financial (14 | 36.8%), Management (4 | 10.5%), Community & Social Service (2 | 5.3%), Education Instruction & Library (2 | 5.3%), and Health Diagnosing & Treating (1 | 2.6%).
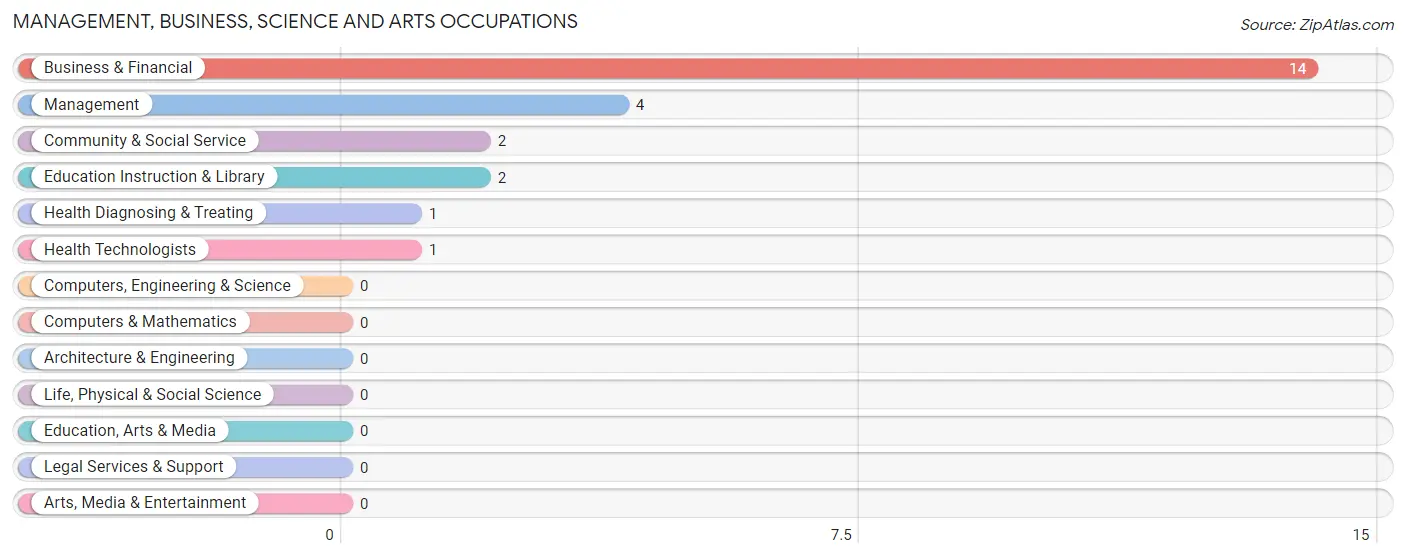
Management, Business, Science and Arts Occupations by Sex
Within the Management, Business, Science and Arts occupations in Pleasant Plain, the most male-oriented occupations are Community & Social Service (100.0%), Education Instruction & Library (100.0%), and Management (50.0%), while the most female-oriented occupations are Health Diagnosing & Treating (100.0%), Health Technologists (100.0%), and Business & Financial (92.9%).
| Occupation | Male | Female |
| Management | 2 (50.0%) | 2 (50.0%) |
| Business & Financial | 1 (7.1%) | 13 (92.9%) |
| Computers, Engineering & Science | 0 (0.0%) | 0 (0.0%) |
| Computers & Mathematics | 0 (0.0%) | 0 (0.0%) |
| Architecture & Engineering | 0 (0.0%) | 0 (0.0%) |
| Life, Physical & Social Science | 0 (0.0%) | 0 (0.0%) |
| Community & Social Service | 2 (100.0%) | 0 (0.0%) |
| Education, Arts & Media | 0 (0.0%) | 0 (0.0%) |
| Legal Services & Support | 0 (0.0%) | 0 (0.0%) |
| Education Instruction & Library | 2 (100.0%) | 0 (0.0%) |
| Arts, Media & Entertainment | 0 (0.0%) | 0 (0.0%) |
| Health Diagnosing & Treating | 0 (0.0%) | 1 (100.0%) |
| Health Technologists | 0 (0.0%) | 1 (100.0%) |
| Total (Category) | 5 (23.8%) | 16 (76.2%) |
| Total (Overall) | 12 (31.6%) | 26 (68.4%) |
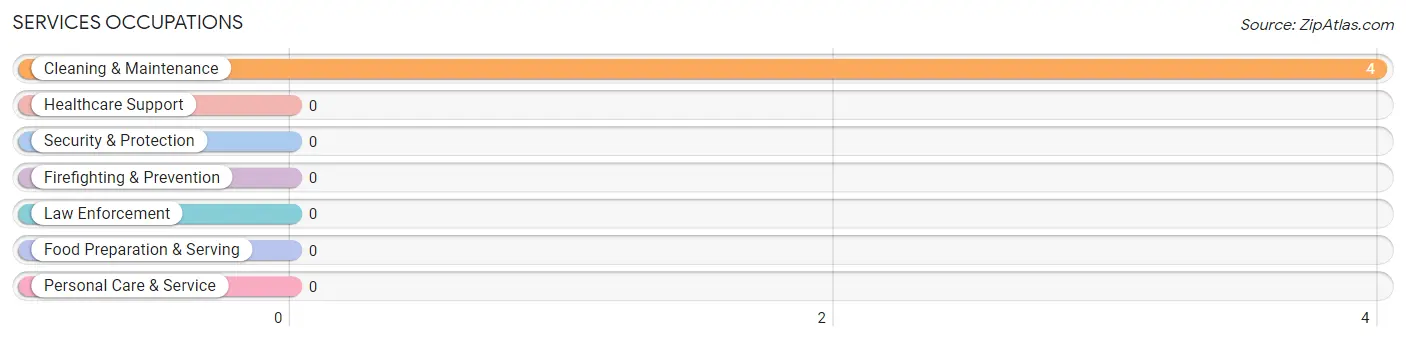
Services Occupations
The most common Services occupations in Pleasant Plain are , and Cleaning & Maintenance (4 | 10.5%).
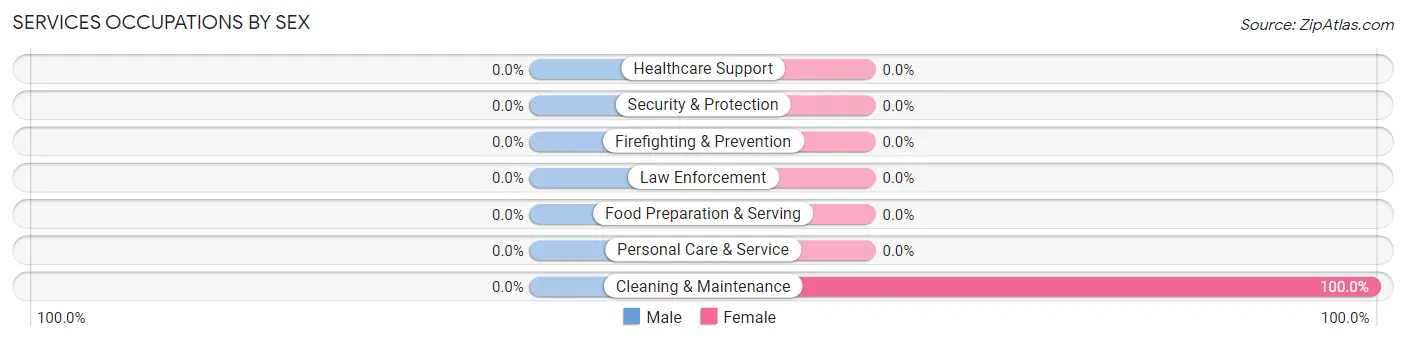
Services Occupations by Sex
| Occupation | Male | Female |
| Healthcare Support | 0 (0.0%) | 0 (0.0%) |
| Security & Protection | 0 (0.0%) | 0 (0.0%) |
| Firefighting & Prevention | 0 (0.0%) | 0 (0.0%) |
| Law Enforcement | 0 (0.0%) | 0 (0.0%) |
| Food Preparation & Serving | 0 (0.0%) | 0 (0.0%) |
| Cleaning & Maintenance | 0 (0.0%) | 4 (100.0%) |
| Personal Care & Service | 0 (0.0%) | 0 (0.0%) |
| Total (Category) | 0 (0.0%) | 4 (100.0%) |
| Total (Overall) | 12 (31.6%) | 26 (68.4%) |
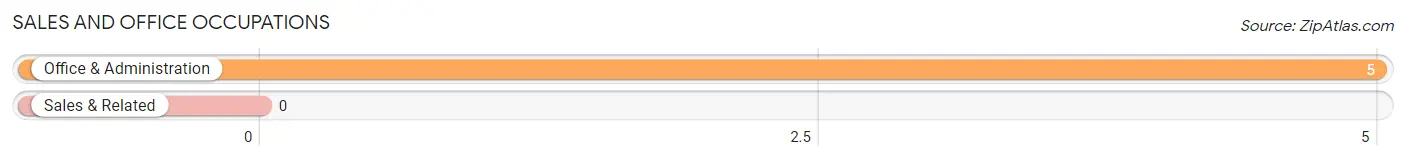
Sales and Office Occupations
The most common Sales and Office occupations in Pleasant Plain are , and Office & Administration (5 | 13.2%).
Sales and Office Occupations by Sex
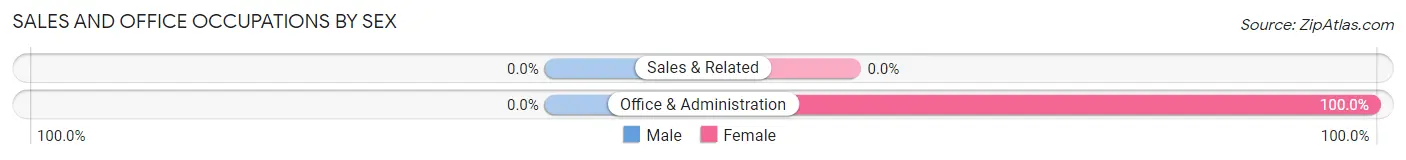
| Occupation | Male | Female |
| Sales & Related | 0 (0.0%) | 0 (0.0%) |
| Office & Administration | 0 (0.0%) | 5 (100.0%) |
| Total (Category) | 0 (0.0%) | 5 (100.0%) |
| Total (Overall) | 12 (31.6%) | 26 (68.4%) |
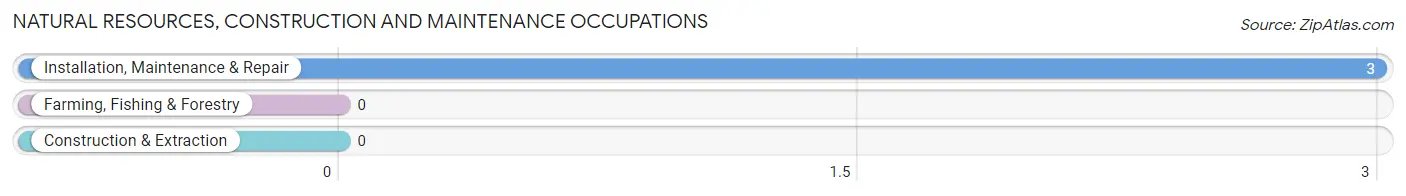
Natural Resources, Construction and Maintenance Occupations
The most common Natural Resources, Construction and Maintenance occupations in Pleasant Plain are , and Installation, Maintenance & Repair (3 | 7.9%).
Natural Resources, Construction and Maintenance Occupations by Sex
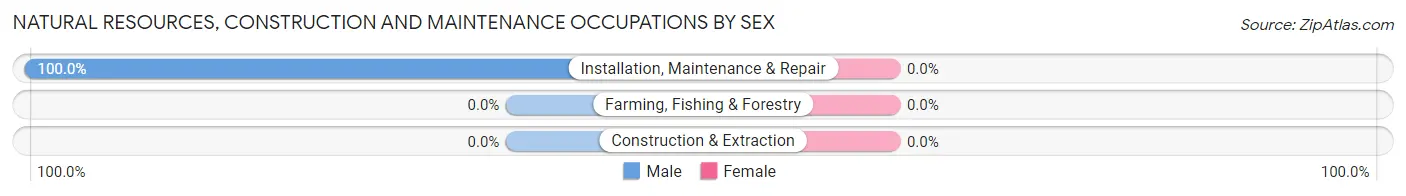
| Occupation | Male | Female |
| Farming, Fishing & Forestry | 0 (0.0%) | 0 (0.0%) |
| Construction & Extraction | 0 (0.0%) | 0 (0.0%) |
| Installation, Maintenance & Repair | 3 (100.0%) | 0 (0.0%) |
| Total (Category) | 3 (100.0%) | 0 (0.0%) |
| Total (Overall) | 12 (31.6%) | 26 (68.4%) |
Production, Transportation and Moving Occupations
The most common Production, Transportation and Moving occupations in Pleasant Plain are Transportation (3 | 7.9%), Production (1 | 2.6%), and Material Moving (1 | 2.6%).
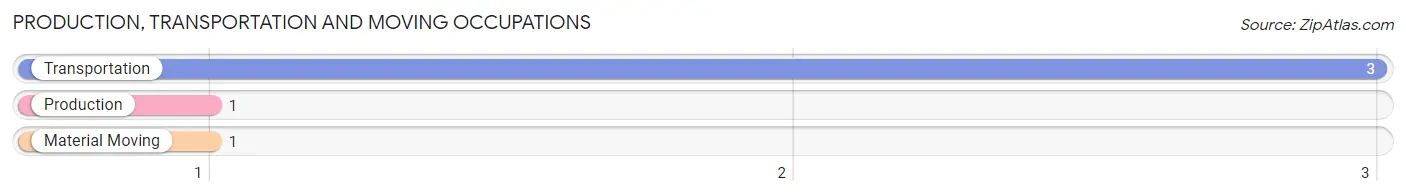
Production, Transportation and Moving Occupations by Sex
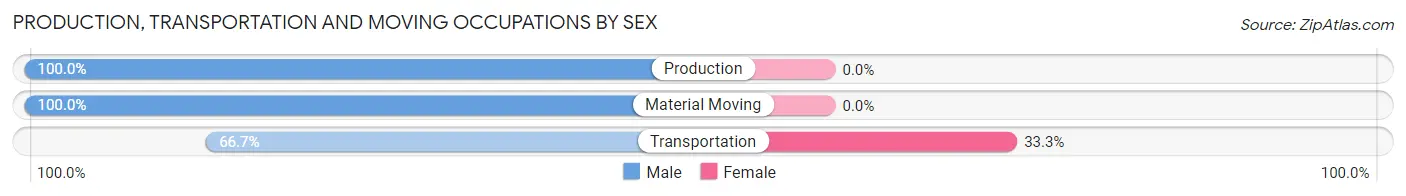
| Occupation | Male | Female |
| Production | 1 (100.0%) | 0 (0.0%) |
| Transportation | 2 (66.7%) | 1 (33.3%) |
| Material Moving | 1 (100.0%) | 0 (0.0%) |
| Total (Category) | 4 (80.0%) | 1 (20.0%) |
| Total (Overall) | 12 (31.6%) | 26 (68.4%) |
Employment Industries by Sex in Pleasant Plain
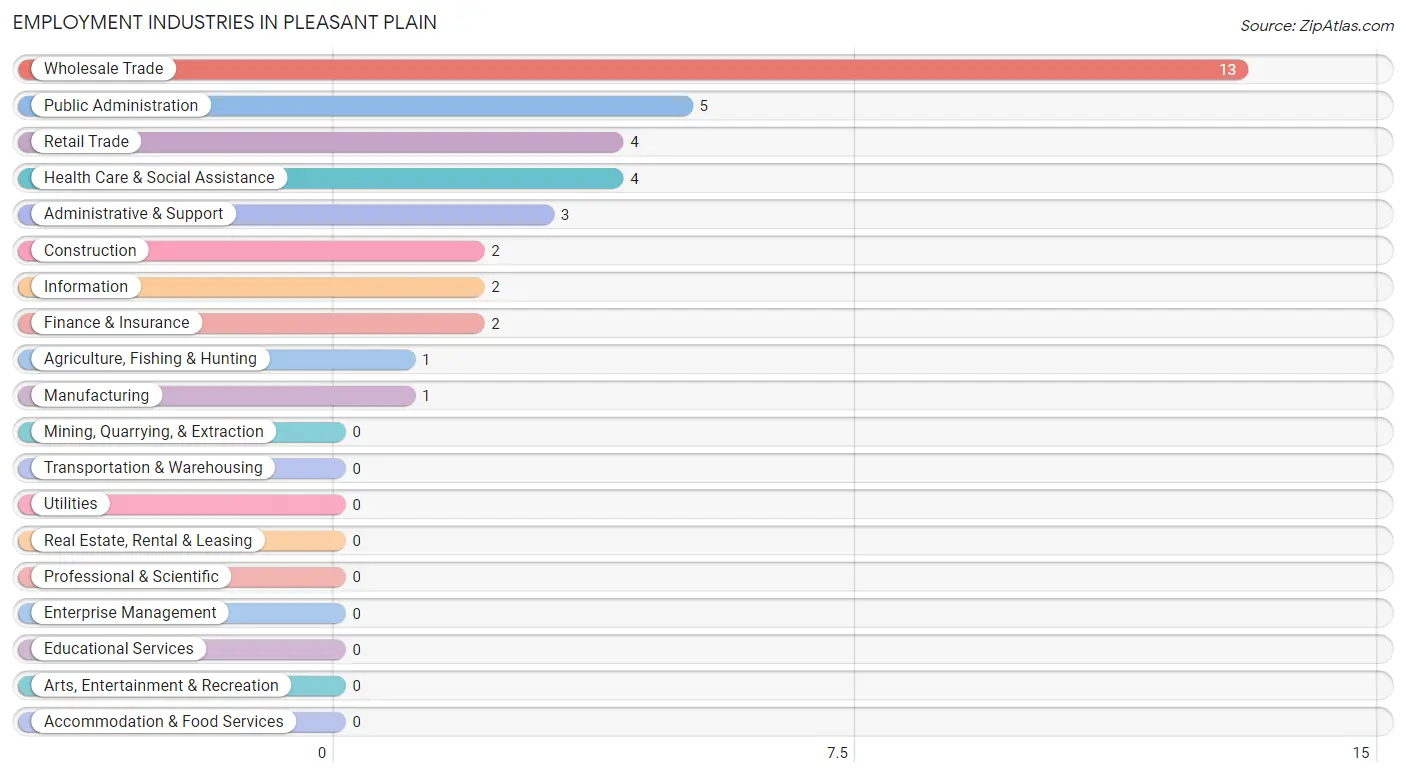
Employment Industries in Pleasant Plain
The major employment industries in Pleasant Plain include Wholesale Trade (13 | 34.2%), Public Administration (5 | 13.2%), Retail Trade (4 | 10.5%), Health Care & Social Assistance (4 | 10.5%), and Administrative & Support (3 | 7.9%).
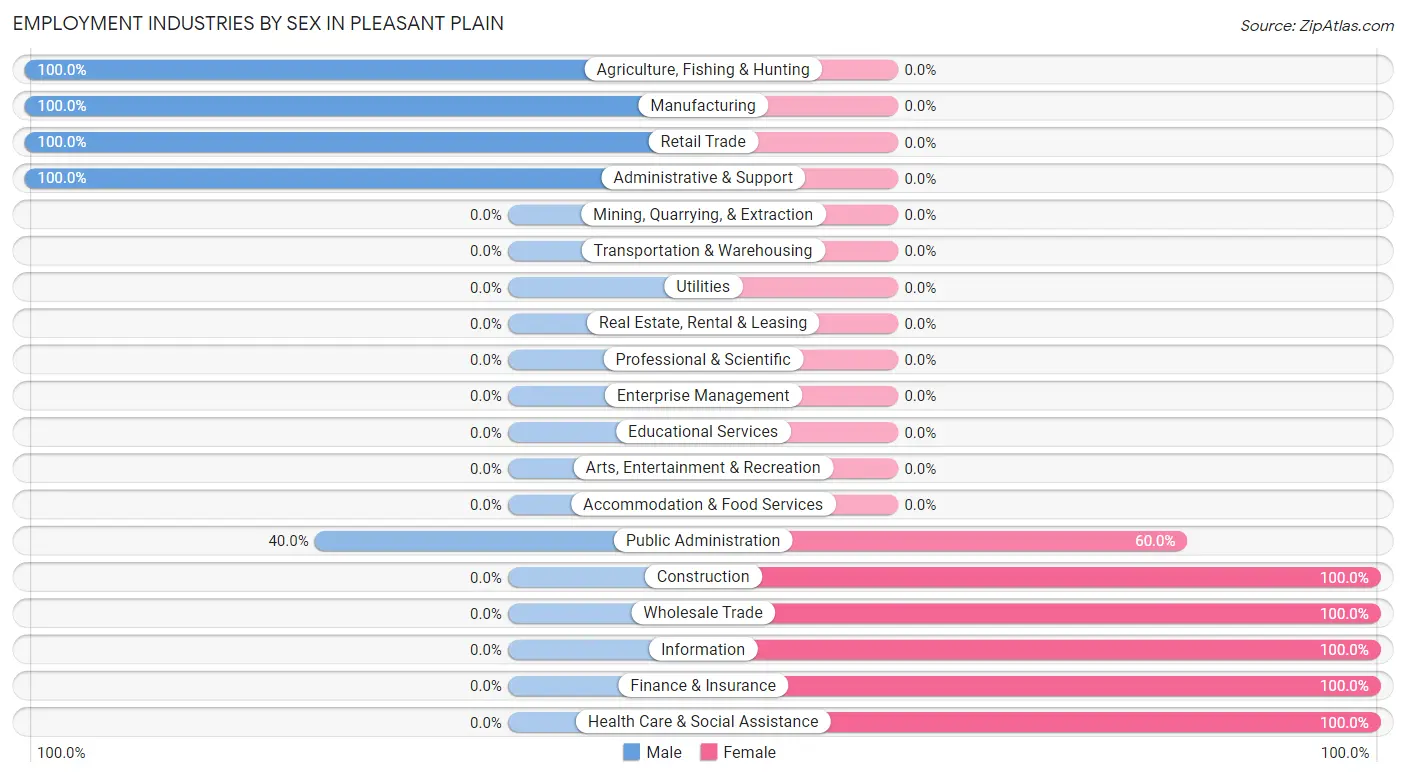
Employment Industries by Sex in Pleasant Plain
The Pleasant Plain industries that see more men than women are Agriculture, Fishing & Hunting (100.0%), Manufacturing (100.0%), and Retail Trade (100.0%), whereas the industries that tend to have a higher number of women are Construction (100.0%), Wholesale Trade (100.0%), and Information (100.0%).
| Industry | Male | Female |
| Agriculture, Fishing & Hunting | 1 (100.0%) | 0 (0.0%) |
| Mining, Quarrying, & Extraction | 0 (0.0%) | 0 (0.0%) |
| Construction | 0 (0.0%) | 2 (100.0%) |
| Manufacturing | 1 (100.0%) | 0 (0.0%) |
| Wholesale Trade | 0 (0.0%) | 13 (100.0%) |
| Retail Trade | 4 (100.0%) | 0 (0.0%) |
| Transportation & Warehousing | 0 (0.0%) | 0 (0.0%) |
| Utilities | 0 (0.0%) | 0 (0.0%) |
| Information | 0 (0.0%) | 2 (100.0%) |
| Finance & Insurance | 0 (0.0%) | 2 (100.0%) |
| Real Estate, Rental & Leasing | 0 (0.0%) | 0 (0.0%) |
| Professional & Scientific | 0 (0.0%) | 0 (0.0%) |
| Enterprise Management | 0 (0.0%) | 0 (0.0%) |
| Administrative & Support | 3 (100.0%) | 0 (0.0%) |
| Educational Services | 0 (0.0%) | 0 (0.0%) |
| Health Care & Social Assistance | 0 (0.0%) | 4 (100.0%) |
| Arts, Entertainment & Recreation | 0 (0.0%) | 0 (0.0%) |
| Accommodation & Food Services | 0 (0.0%) | 0 (0.0%) |
| Public Administration | 2 (40.0%) | 3 (60.0%) |
| Total | 12 (31.6%) | 26 (68.4%) |
Education in Pleasant Plain
School Enrollment in Pleasant Plain
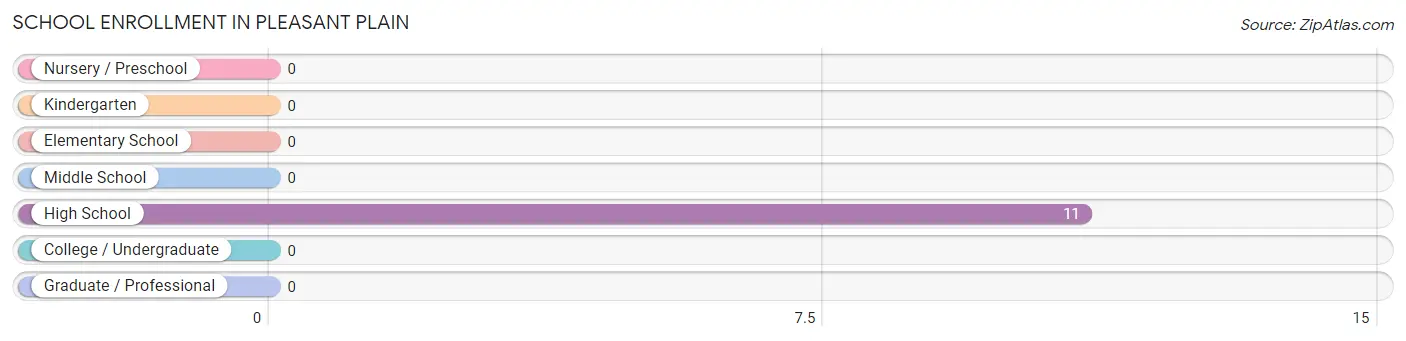
| School Level | # Students | % Students |
| Nursery / Preschool | 0 | 0.0% |
| Kindergarten | 0 | 0.0% |
| Elementary School | 0 | 0.0% |
| Middle School | 0 | 0.0% |
| High School | 11 | 100.0% |
| College / Undergraduate | 0 | 0.0% |
| Graduate / Professional | 0 | 0.0% |
| Total | 11 | 100.0% |
School Enrollment by Age by Funding Source in Pleasant Plain
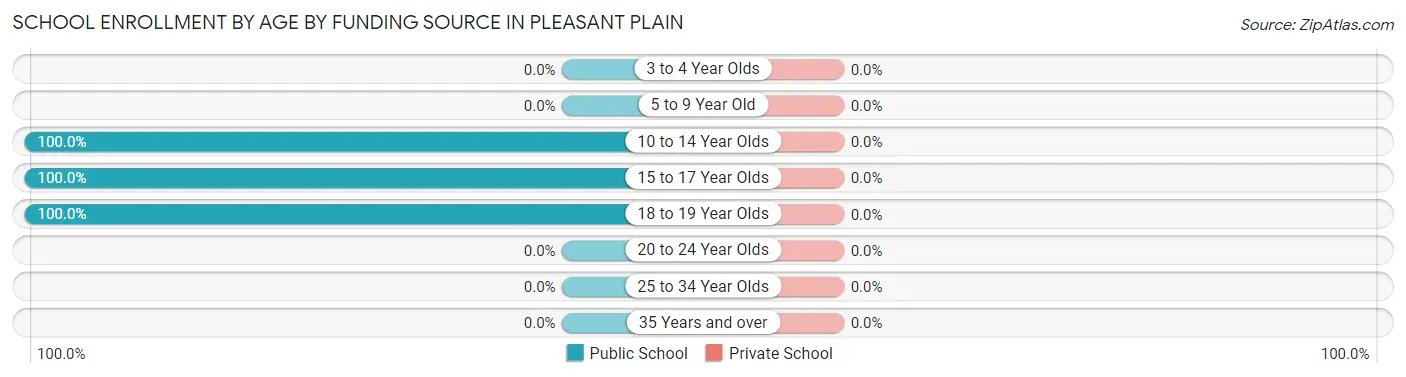
| Age Bracket | Public School | Private School |
| 3 to 4 Year Olds | 0 (0.0%) | 0 (0.0%) |
| 5 to 9 Year Old | 0 (0.0%) | 0 (0.0%) |
| 10 to 14 Year Olds | 1 (100.0%) | 0 (0.0%) |
| 15 to 17 Year Olds | 8 (100.0%) | 0 (0.0%) |
| 18 to 19 Year Olds | 2 (100.0%) | 0 (0.0%) |
| 20 to 24 Year Olds | 0 (0.0%) | 0 (0.0%) |
| 25 to 34 Year Olds | 0 (0.0%) | 0 (0.0%) |
| 35 Years and over | 0 (0.0%) | 0 (0.0%) |
| Total | 11 (100.0%) | 0 (0.0%) |
Educational Attainment by Field of Study in Pleasant Plain
Science & technology (1 | 25.0%), business (1 | 25.0%), visual & performing arts (1 | 25.0%), and communications (1 | 25.0%) are the most common fields of study among 4 individuals in Pleasant Plain who have obtained a bachelor's degree or higher.
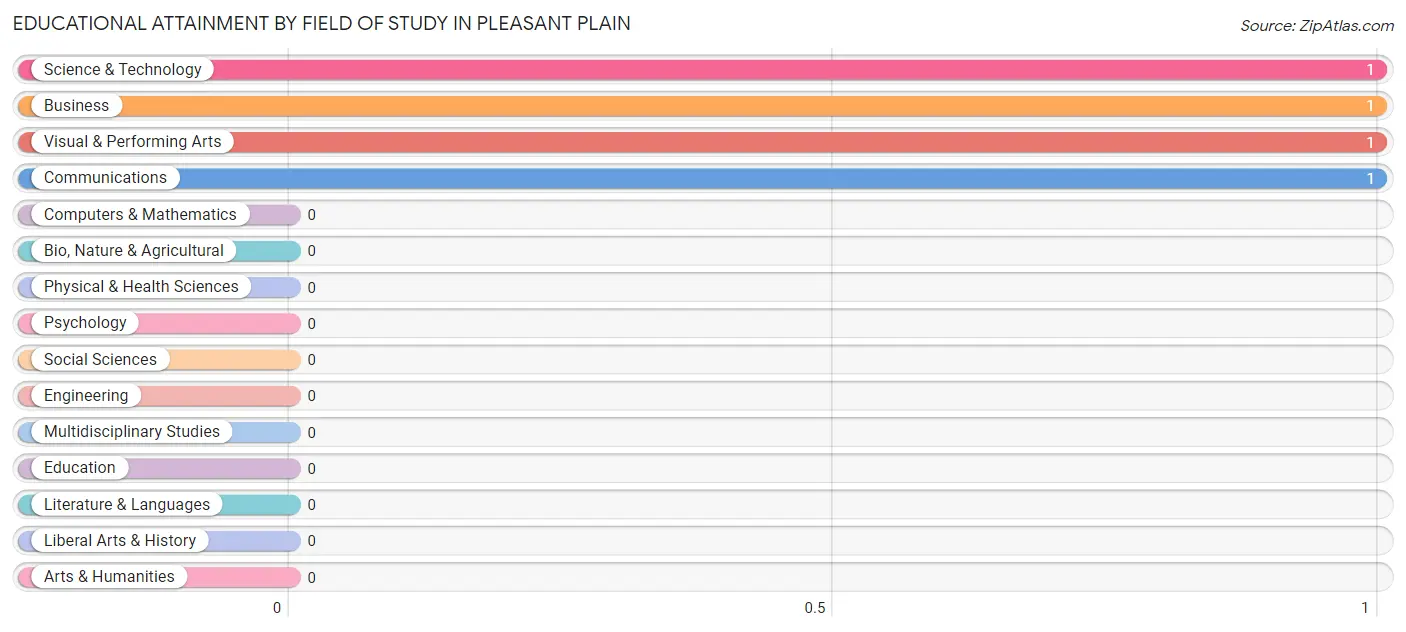
| Field of Study | # Graduates | % Graduates |
| Computers & Mathematics | 0 | 0.0% |
| Bio, Nature & Agricultural | 0 | 0.0% |
| Physical & Health Sciences | 0 | 0.0% |
| Psychology | 0 | 0.0% |
| Social Sciences | 0 | 0.0% |
| Engineering | 0 | 0.0% |
| Multidisciplinary Studies | 0 | 0.0% |
| Science & Technology | 1 | 25.0% |
| Business | 1 | 25.0% |
| Education | 0 | 0.0% |
| Literature & Languages | 0 | 0.0% |
| Liberal Arts & History | 0 | 0.0% |
| Visual & Performing Arts | 1 | 25.0% |
| Communications | 1 | 25.0% |
| Arts & Humanities | 0 | 0.0% |
| Total | 4 | 100.0% |
Transportation & Commute in Pleasant Plain
Vehicle Availability by Sex in Pleasant Plain
The most prevalent vehicle ownership categories in Pleasant Plain are males with 2 vehicles (6, accounting for 50.0%) and females with 2 vehicles (10, making up 23.1%).
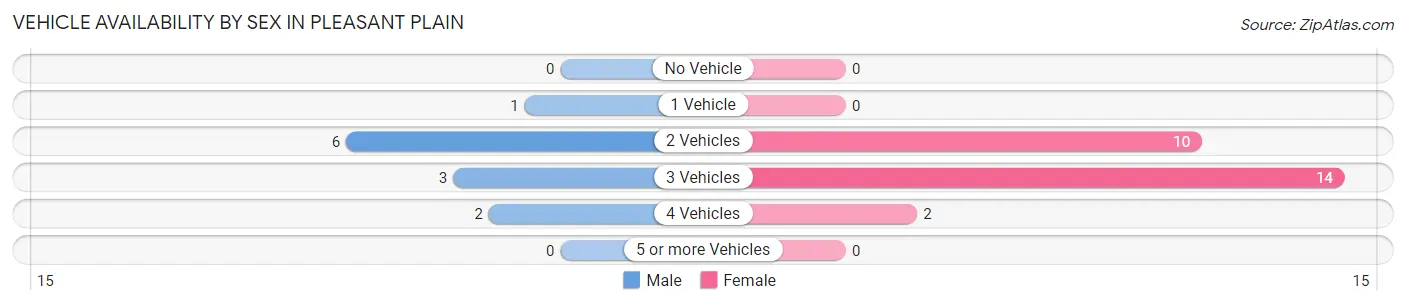
| Vehicles Available | Male | Female |
| No Vehicle | 0 (0.0%) | 0 (0.0%) |
| 1 Vehicle | 1 (8.3%) | 0 (0.0%) |
| 2 Vehicles | 6 (50.0%) | 10 (38.5%) |
| 3 Vehicles | 3 (25.0%) | 14 (53.8%) |
| 4 Vehicles | 2 (16.7%) | 2 (7.7%) |
| 5 or more Vehicles | 0 (0.0%) | 0 (0.0%) |
| Total | 12 (100.0%) | 26 (100.0%) |
Commute Time in Pleasant Plain
The most frequently occuring commute durations in Pleasant Plain are 15 to 19 minutes (19 commuters, 50.0%), 20 to 24 minutes (8 commuters, 21.0%), and 30 to 34 minutes (3 commuters, 7.9%).
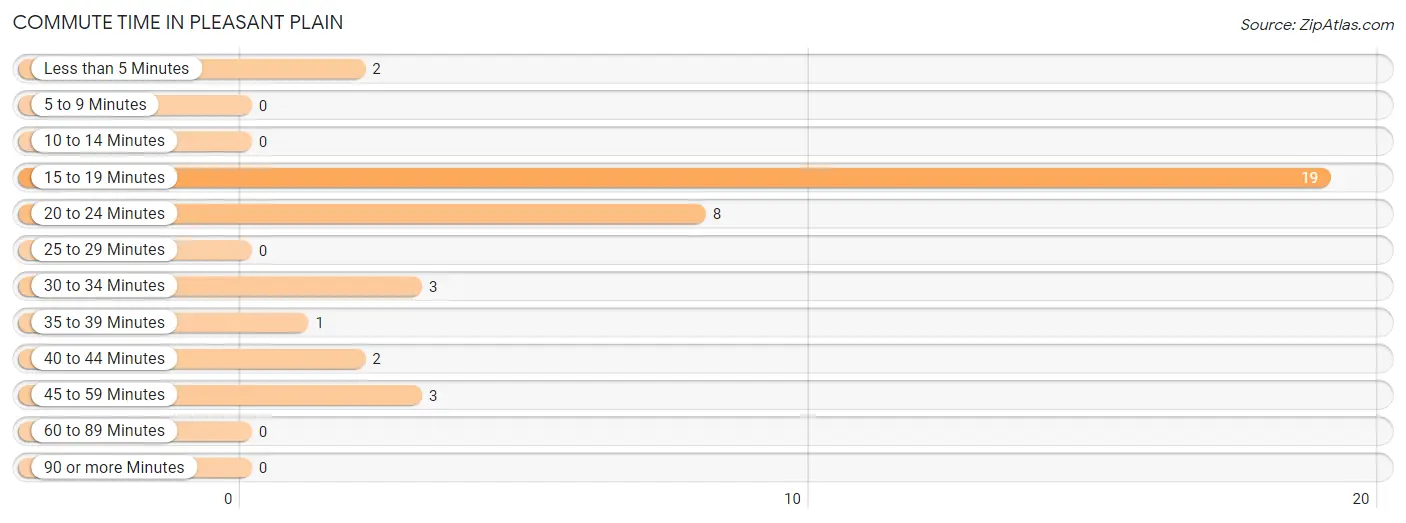
| Commute Time | # Commuters | % Commuters |
| Less than 5 Minutes | 2 | 5.3% |
| 5 to 9 Minutes | 0 | 0.0% |
| 10 to 14 Minutes | 0 | 0.0% |
| 15 to 19 Minutes | 19 | 50.0% |
| 20 to 24 Minutes | 8 | 21.0% |
| 25 to 29 Minutes | 0 | 0.0% |
| 30 to 34 Minutes | 3 | 7.9% |
| 35 to 39 Minutes | 1 | 2.6% |
| 40 to 44 Minutes | 2 | 5.3% |
| 45 to 59 Minutes | 3 | 7.9% |
| 60 to 89 Minutes | 0 | 0.0% |
| 90 or more Minutes | 0 | 0.0% |
Commute Time by Sex in Pleasant Plain
The most common commute times in Pleasant Plain are 20 to 24 minutes (6 commuters, 50.0%) for males and 15 to 19 minutes (17 commuters, 65.4%) for females.
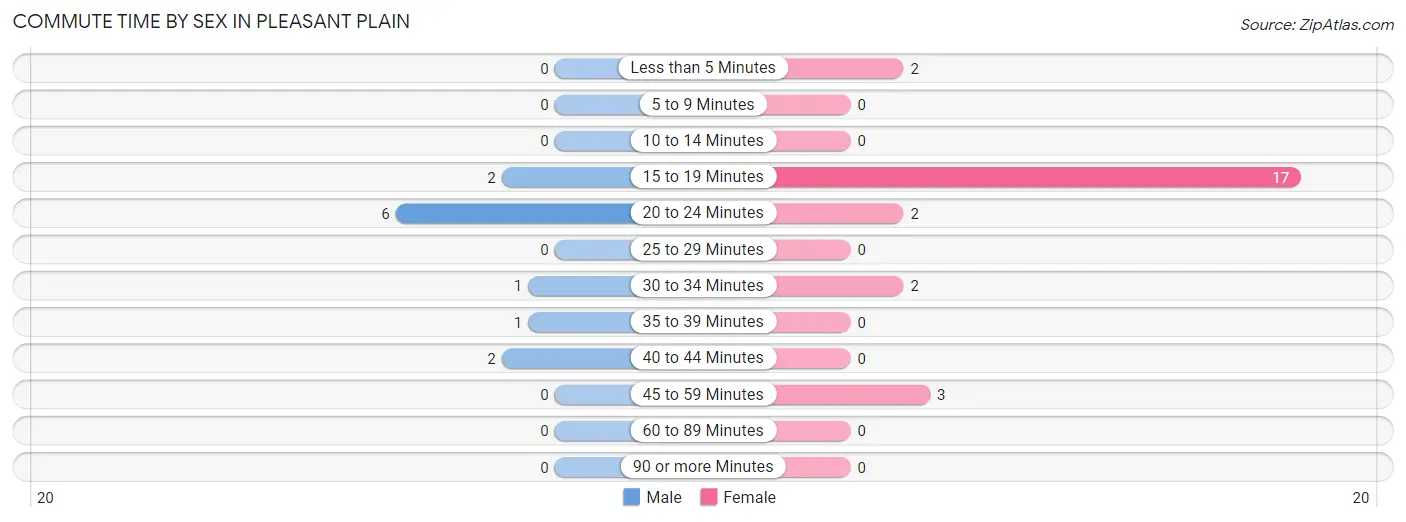
| Commute Time | Male | Female |
| Less than 5 Minutes | 0 (0.0%) | 2 (7.7%) |
| 5 to 9 Minutes | 0 (0.0%) | 0 (0.0%) |
| 10 to 14 Minutes | 0 (0.0%) | 0 (0.0%) |
| 15 to 19 Minutes | 2 (16.7%) | 17 (65.4%) |
| 20 to 24 Minutes | 6 (50.0%) | 2 (7.7%) |
| 25 to 29 Minutes | 0 (0.0%) | 0 (0.0%) |
| 30 to 34 Minutes | 1 (8.3%) | 2 (7.7%) |
| 35 to 39 Minutes | 1 (8.3%) | 0 (0.0%) |
| 40 to 44 Minutes | 2 (16.7%) | 0 (0.0%) |
| 45 to 59 Minutes | 0 (0.0%) | 3 (11.5%) |
| 60 to 89 Minutes | 0 (0.0%) | 0 (0.0%) |
| 90 or more Minutes | 0 (0.0%) | 0 (0.0%) |
Time of Departure to Work by Sex in Pleasant Plain
The most frequent times of departure to work in Pleasant Plain are 12:00 AM to 4:59 AM (4, 33.3%) for males and 8:00 AM to 8:29 AM (13, 50.0%) for females.
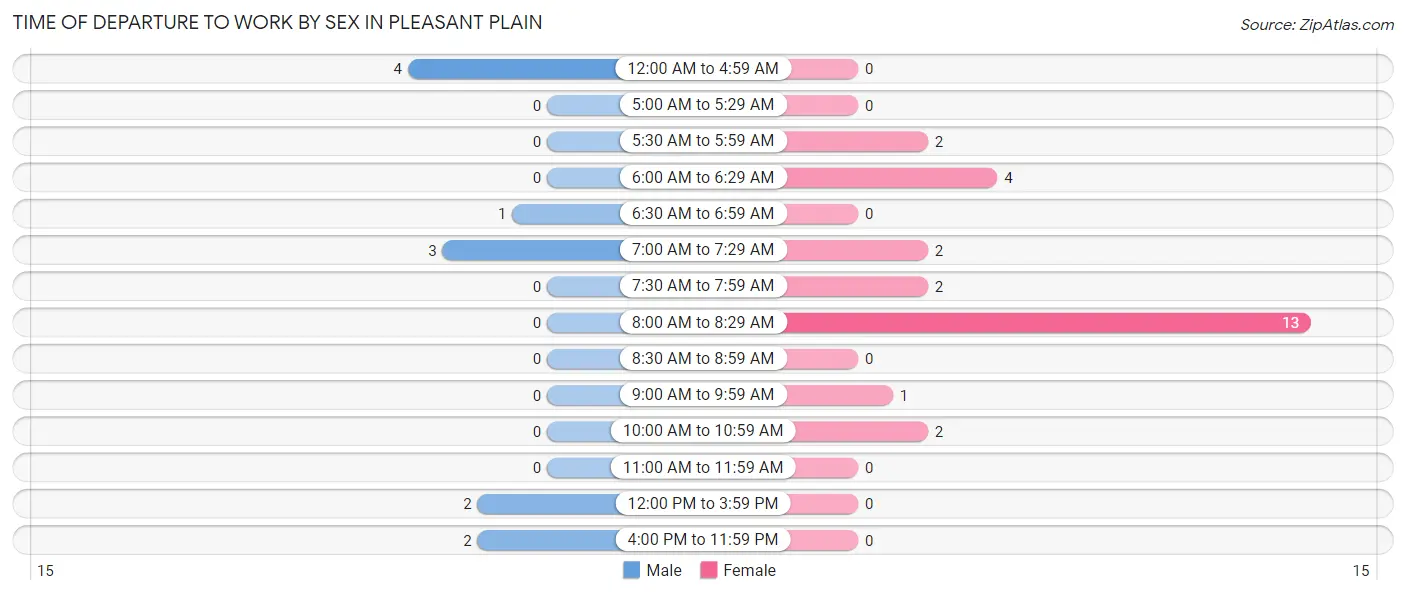
| Time of Departure | Male | Female |
| 12:00 AM to 4:59 AM | 4 (33.3%) | 0 (0.0%) |
| 5:00 AM to 5:29 AM | 0 (0.0%) | 0 (0.0%) |
| 5:30 AM to 5:59 AM | 0 (0.0%) | 2 (7.7%) |
| 6:00 AM to 6:29 AM | 0 (0.0%) | 4 (15.4%) |
| 6:30 AM to 6:59 AM | 1 (8.3%) | 0 (0.0%) |
| 7:00 AM to 7:29 AM | 3 (25.0%) | 2 (7.7%) |
| 7:30 AM to 7:59 AM | 0 (0.0%) | 2 (7.7%) |
| 8:00 AM to 8:29 AM | 0 (0.0%) | 13 (50.0%) |
| 8:30 AM to 8:59 AM | 0 (0.0%) | 0 (0.0%) |
| 9:00 AM to 9:59 AM | 0 (0.0%) | 1 (3.8%) |
| 10:00 AM to 10:59 AM | 0 (0.0%) | 2 (7.7%) |
| 11:00 AM to 11:59 AM | 0 (0.0%) | 0 (0.0%) |
| 12:00 PM to 3:59 PM | 2 (16.7%) | 0 (0.0%) |
| 4:00 PM to 11:59 PM | 2 (16.7%) | 0 (0.0%) |
| Total | 12 (100.0%) | 26 (100.0%) |
Housing Occupancy in Pleasant Plain
Occupancy by Ownership in Pleasant Plain
Of the total 44 dwellings in Pleasant Plain, owner-occupied units account for 37 (84.1%), while renter-occupied units make up 7 (15.9%).
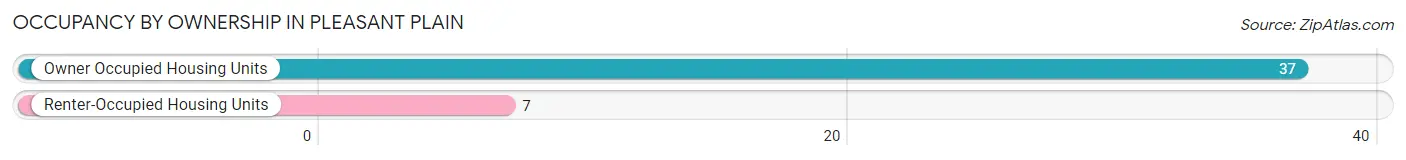
| Occupancy | # Housing Units | % Housing Units |
| Owner Occupied Housing Units | 37 | 84.1% |
| Renter-Occupied Housing Units | 7 | 15.9% |
| Total Occupied Housing Units | 44 | 100.0% |
Occupancy by Household Size in Pleasant Plain
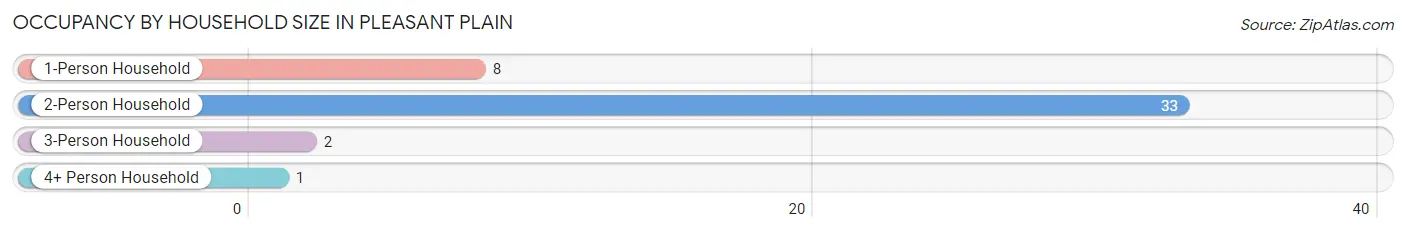
| Household Size | # Housing Units | % Housing Units |
| 1-Person Household | 8 | 18.2% |
| 2-Person Household | 33 | 75.0% |
| 3-Person Household | 2 | 4.5% |
| 4+ Person Household | 1 | 2.3% |
| Total Housing Units | 44 | 100.0% |
Occupancy by Ownership by Household Size in Pleasant Plain
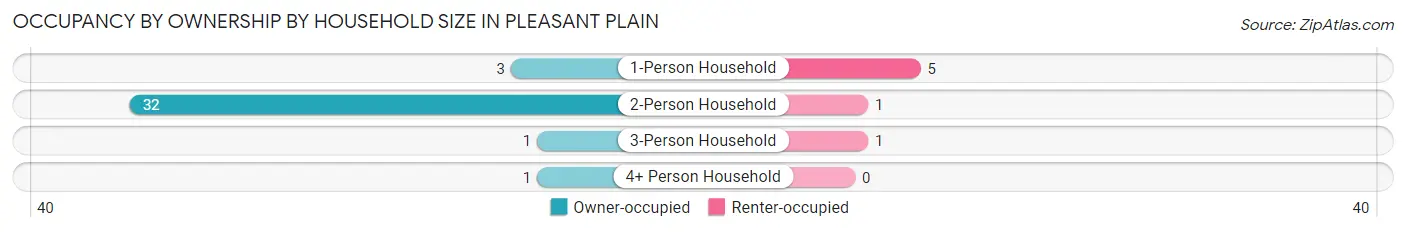
| Household Size | Owner-occupied | Renter-occupied |
| 1-Person Household | 3 (37.5%) | 5 (62.5%) |
| 2-Person Household | 32 (97.0%) | 1 (3.0%) |
| 3-Person Household | 1 (50.0%) | 1 (50.0%) |
| 4+ Person Household | 1 (100.0%) | 0 (0.0%) |
| Total Housing Units | 37 (84.1%) | 7 (15.9%) |
Occupancy by Educational Attainment in Pleasant Plain
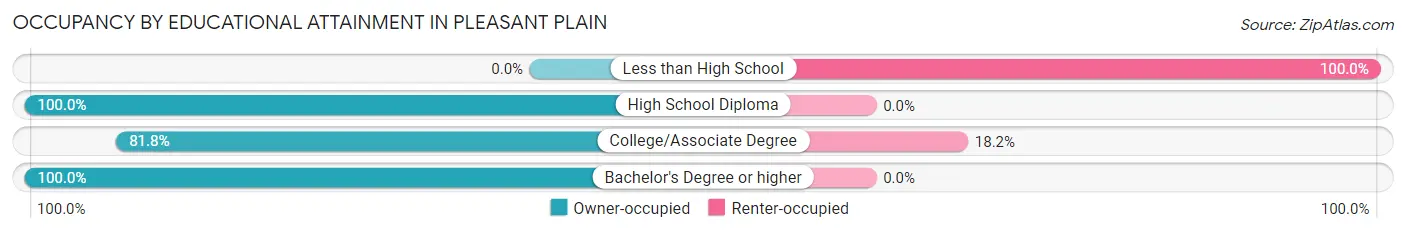
| Household Size | Owner-occupied | Renter-occupied |
| Less than High School | 0 (0.0%) | 3 (100.0%) |
| High School Diploma | 17 (100.0%) | 0 (0.0%) |
| College/Associate Degree | 18 (81.8%) | 4 (18.2%) |
| Bachelor's Degree or higher | 2 (100.0%) | 0 (0.0%) |
Occupancy by Age of Householder in Pleasant Plain
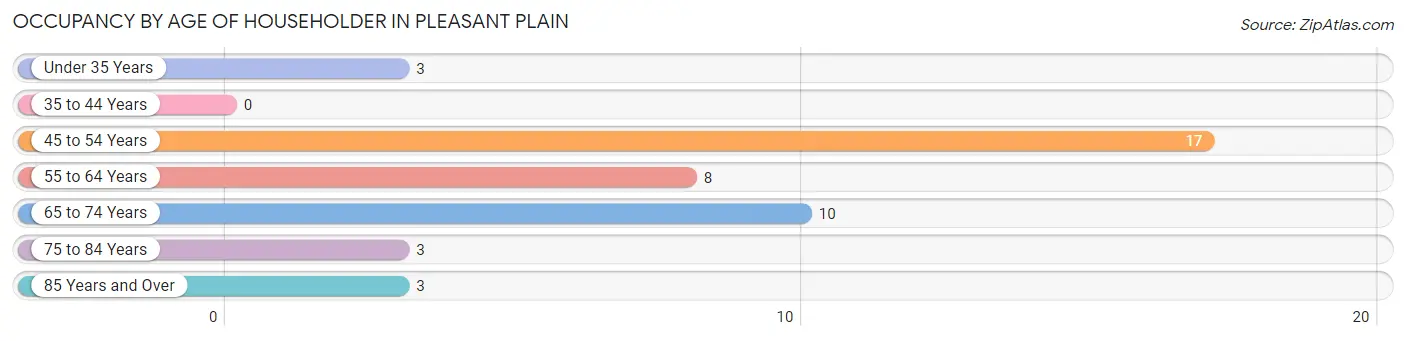
| Age Bracket | # Households | % Households |
| Under 35 Years | 3 | 6.8% |
| 35 to 44 Years | 0 | 0.0% |
| 45 to 54 Years | 17 | 38.6% |
| 55 to 64 Years | 8 | 18.2% |
| 65 to 74 Years | 10 | 22.7% |
| 75 to 84 Years | 3 | 6.8% |
| 85 Years and Over | 3 | 6.8% |
| Total | 44 | 100.0% |
Housing Finances in Pleasant Plain
Median Income by Occupancy in Pleasant Plain
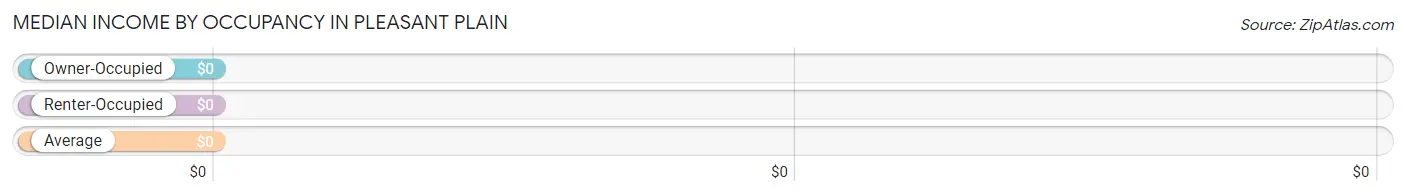
| Occupancy Type | # Households | Median Income |
| Owner-Occupied | 37 (84.1%) | $0 |
| Renter-Occupied | 7 (15.9%) | $0 |
| Average | 44 (100.0%) | $0 |
Occupancy by Householder Income Bracket in Pleasant Plain
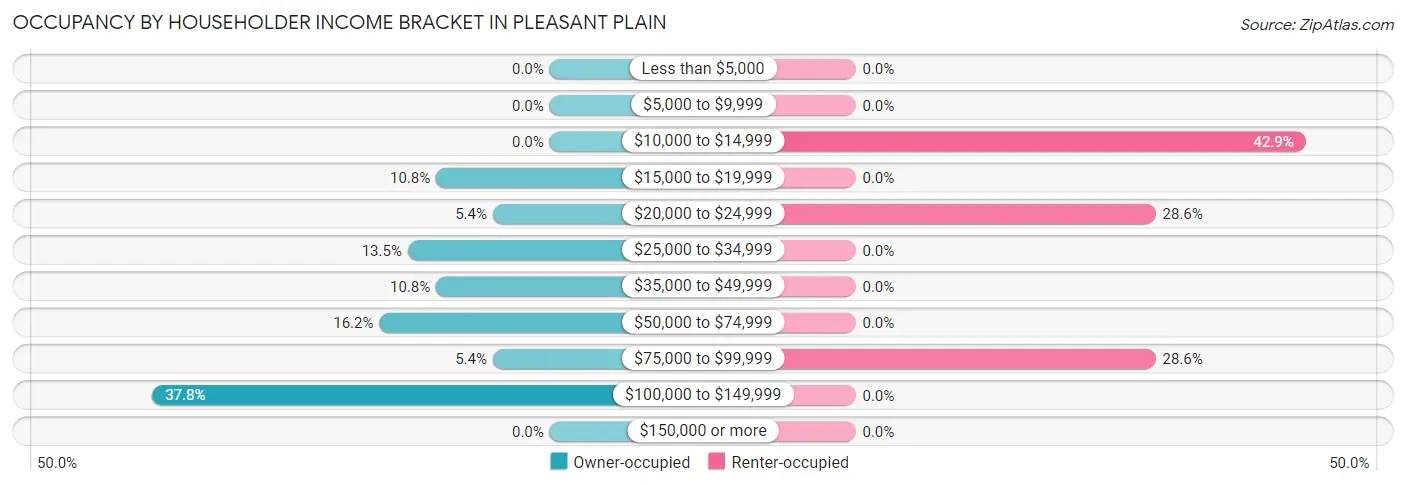
| Income Bracket | Owner-occupied | Renter-occupied |
| Less than $5,000 | 0 (0.0%) | 0 (0.0%) |
| $5,000 to $9,999 | 0 (0.0%) | 0 (0.0%) |
| $10,000 to $14,999 | 0 (0.0%) | 3 (42.9%) |
| $15,000 to $19,999 | 4 (10.8%) | 0 (0.0%) |
| $20,000 to $24,999 | 2 (5.4%) | 2 (28.6%) |
| $25,000 to $34,999 | 5 (13.5%) | 0 (0.0%) |
| $35,000 to $49,999 | 4 (10.8%) | 0 (0.0%) |
| $50,000 to $74,999 | 6 (16.2%) | 0 (0.0%) |
| $75,000 to $99,999 | 2 (5.4%) | 2 (28.6%) |
| $100,000 to $149,999 | 14 (37.8%) | 0 (0.0%) |
| $150,000 or more | 0 (0.0%) | 0 (0.0%) |
| Total | 37 (100.0%) | 7 (100.0%) |
Monthly Housing Cost Tiers in Pleasant Plain
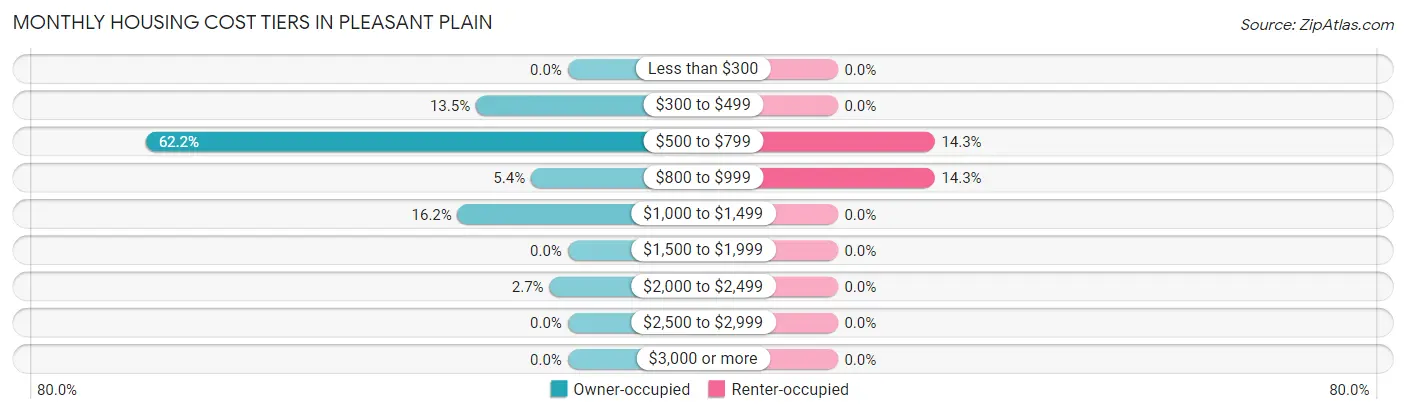
| Monthly Cost | Owner-occupied | Renter-occupied |
| Less than $300 | 0 (0.0%) | 0 (0.0%) |
| $300 to $499 | 5 (13.5%) | 0 (0.0%) |
| $500 to $799 | 23 (62.2%) | 1 (14.3%) |
| $800 to $999 | 2 (5.4%) | 1 (14.3%) |
| $1,000 to $1,499 | 6 (16.2%) | 0 (0.0%) |
| $1,500 to $1,999 | 0 (0.0%) | 0 (0.0%) |
| $2,000 to $2,499 | 1 (2.7%) | 0 (0.0%) |
| $2,500 to $2,999 | 0 (0.0%) | 0 (0.0%) |
| $3,000 or more | 0 (0.0%) | 0 (0.0%) |
| Total | 37 (100.0%) | 7 (100.0%) |
Physical Housing Characteristics in Pleasant Plain
Housing Structures in Pleasant Plain
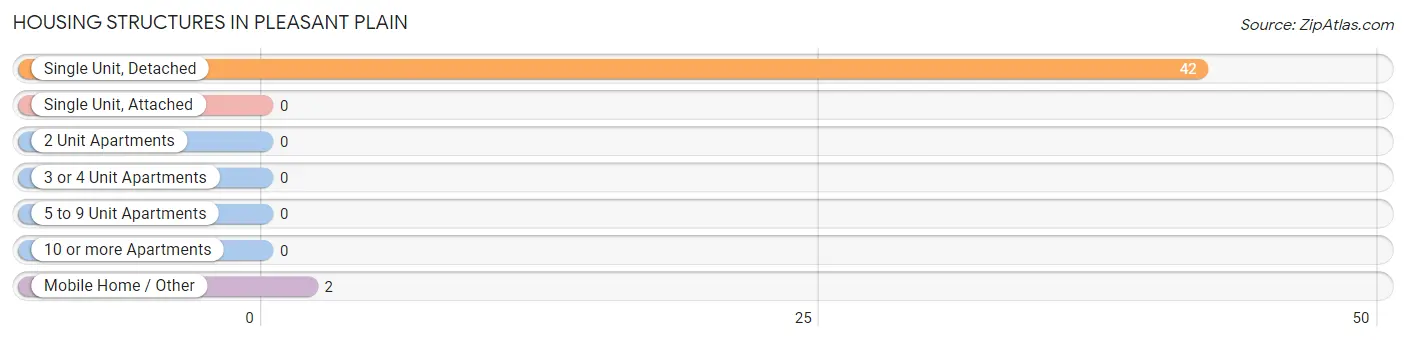
| Structure Type | # Housing Units | % Housing Units |
| Single Unit, Detached | 42 | 95.5% |
| Single Unit, Attached | 0 | 0.0% |
| 2 Unit Apartments | 0 | 0.0% |
| 3 or 4 Unit Apartments | 0 | 0.0% |
| 5 to 9 Unit Apartments | 0 | 0.0% |
| 10 or more Apartments | 0 | 0.0% |
| Mobile Home / Other | 2 | 4.5% |
| Total | 44 | 100.0% |
Housing Structures by Occupancy in Pleasant Plain
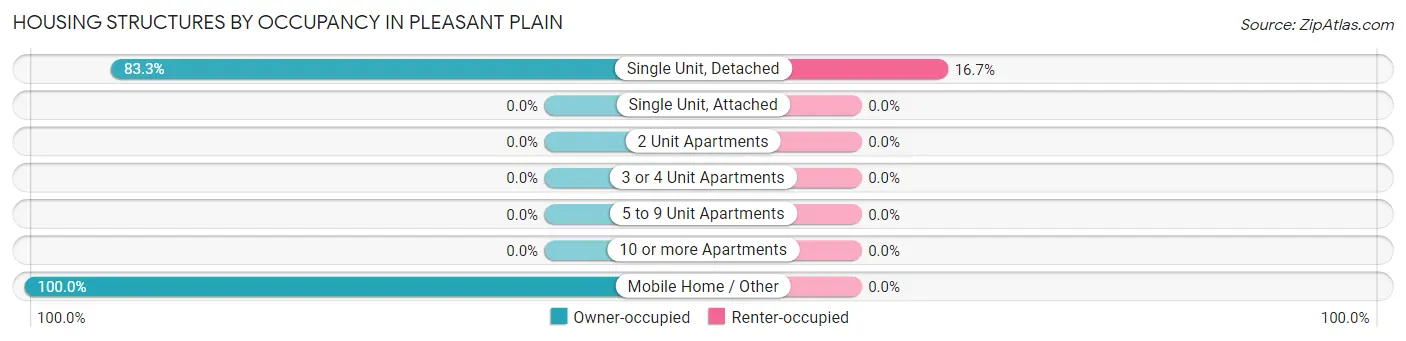
| Structure Type | Owner-occupied | Renter-occupied |
| Single Unit, Detached | 35 (83.3%) | 7 (16.7%) |
| Single Unit, Attached | 0 (0.0%) | 0 (0.0%) |
| 2 Unit Apartments | 0 (0.0%) | 0 (0.0%) |
| 3 or 4 Unit Apartments | 0 (0.0%) | 0 (0.0%) |
| 5 to 9 Unit Apartments | 0 (0.0%) | 0 (0.0%) |
| 10 or more Apartments | 0 (0.0%) | 0 (0.0%) |
| Mobile Home / Other | 2 (100.0%) | 0 (0.0%) |
| Total | 37 (84.1%) | 7 (15.9%) |
Housing Structures by Number of Rooms in Pleasant Plain
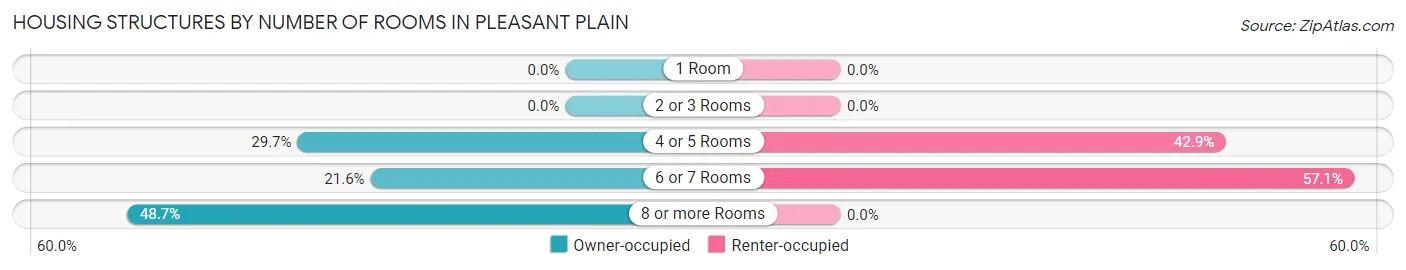
| Number of Rooms | Owner-occupied | Renter-occupied |
| 1 Room | 0 (0.0%) | 0 (0.0%) |
| 2 or 3 Rooms | 0 (0.0%) | 0 (0.0%) |
| 4 or 5 Rooms | 11 (29.7%) | 3 (42.9%) |
| 6 or 7 Rooms | 8 (21.6%) | 4 (57.1%) |
| 8 or more Rooms | 18 (48.6%) | 0 (0.0%) |
| Total | 37 (100.0%) | 7 (100.0%) |
Housing Structure by Heating Type in Pleasant Plain
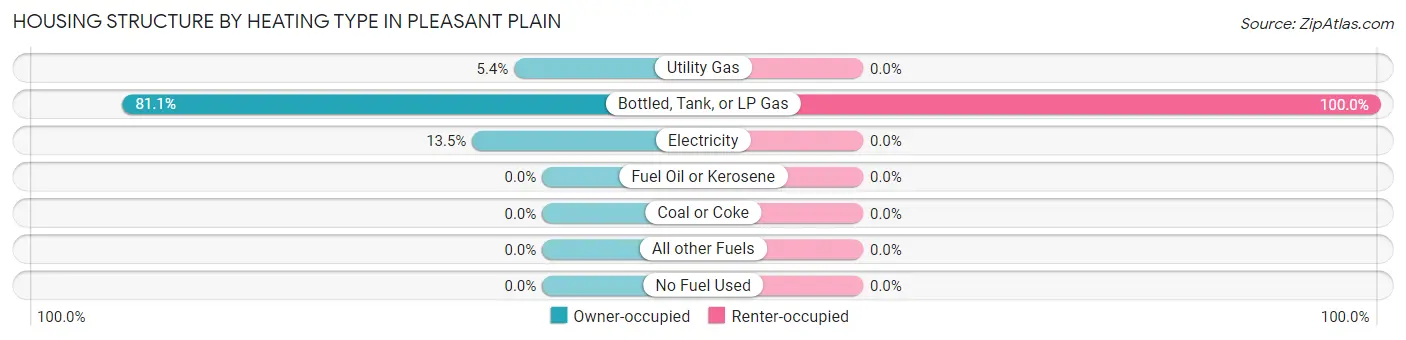
| Heating Type | Owner-occupied | Renter-occupied |
| Utility Gas | 2 (5.4%) | 0 (0.0%) |
| Bottled, Tank, or LP Gas | 30 (81.1%) | 7 (100.0%) |
| Electricity | 5 (13.5%) | 0 (0.0%) |
| Fuel Oil or Kerosene | 0 (0.0%) | 0 (0.0%) |
| Coal or Coke | 0 (0.0%) | 0 (0.0%) |
| All other Fuels | 0 (0.0%) | 0 (0.0%) |
| No Fuel Used | 0 (0.0%) | 0 (0.0%) |
| Total | 37 (100.0%) | 7 (100.0%) |
Household Vehicle Usage in Pleasant Plain
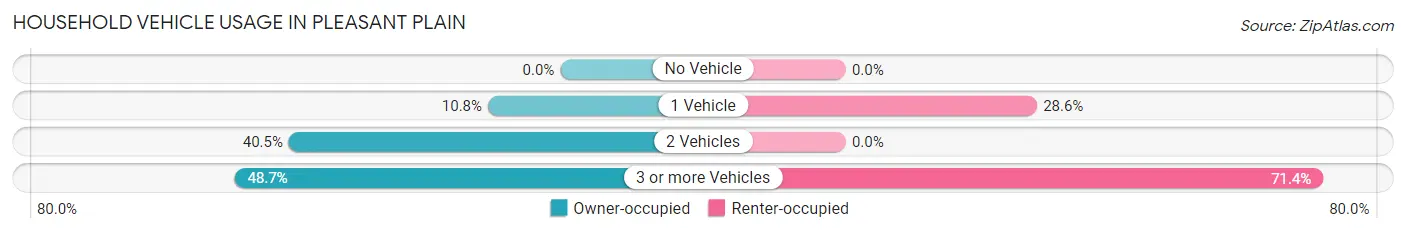
| Vehicles per Household | Owner-occupied | Renter-occupied |
| No Vehicle | 0 (0.0%) | 0 (0.0%) |
| 1 Vehicle | 4 (10.8%) | 2 (28.6%) |
| 2 Vehicles | 15 (40.5%) | 0 (0.0%) |
| 3 or more Vehicles | 18 (48.6%) | 5 (71.4%) |
| Total | 37 (100.0%) | 7 (100.0%) |
Real Estate & Mortgages in Pleasant Plain
Real Estate and Mortgage Overview in Pleasant Plain
| Characteristic | Without Mortgage | With Mortgage |
| Housing Units | 30 | 7 |
| Median Property Value | $61,500 | $0 |
| Median Household Income | - | - |
| Monthly Housing Costs | $635 | $0 |
| Real Estate Taxes | $381 | $0 |
Property Value by Mortgage Status in Pleasant Plain
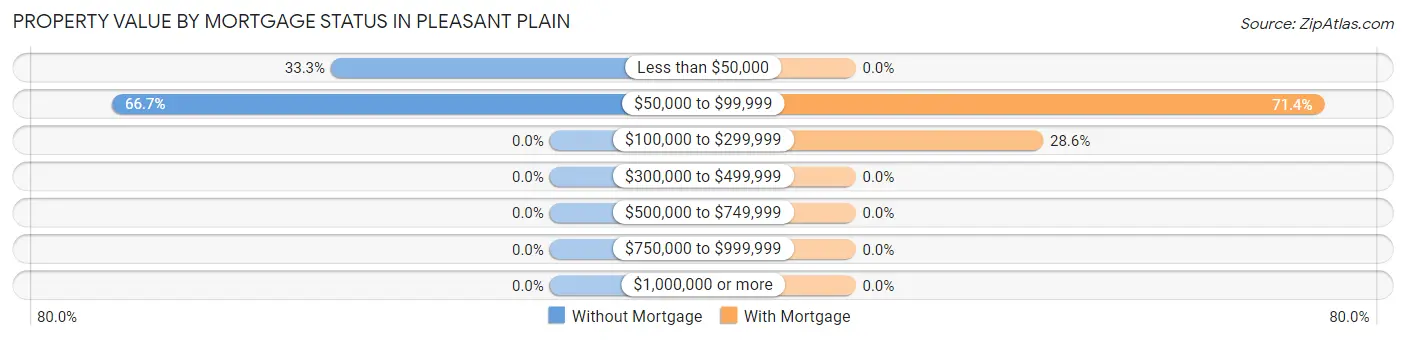
| Property Value | Without Mortgage | With Mortgage |
| Less than $50,000 | 10 (33.3%) | 0 (0.0%) |
| $50,000 to $99,999 | 20 (66.7%) | 5 (71.4%) |
| $100,000 to $299,999 | 0 (0.0%) | 2 (28.6%) |
| $300,000 to $499,999 | 0 (0.0%) | 0 (0.0%) |
| $500,000 to $749,999 | 0 (0.0%) | 0 (0.0%) |
| $750,000 to $999,999 | 0 (0.0%) | 0 (0.0%) |
| $1,000,000 or more | 0 (0.0%) | 0 (0.0%) |
| Total | 30 (100.0%) | 7 (100.0%) |
Household Income by Mortgage Status in Pleasant Plain
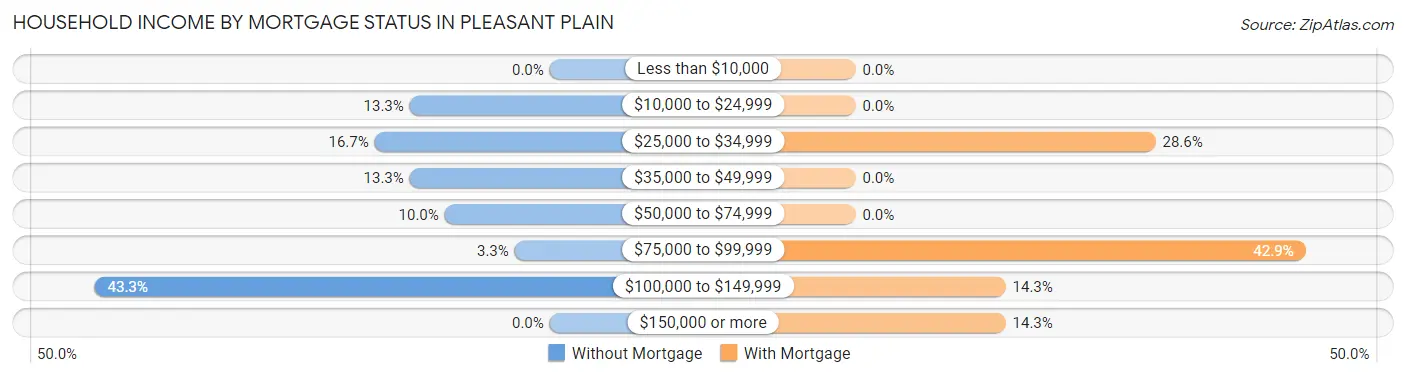
| Household Income | Without Mortgage | With Mortgage |
| Less than $10,000 | 0 (0.0%) | 0 (0.0%) |
| $10,000 to $24,999 | 4 (13.3%) | 0 (0.0%) |
| $25,000 to $34,999 | 5 (16.7%) | 2 (28.6%) |
| $35,000 to $49,999 | 4 (13.3%) | 0 (0.0%) |
| $50,000 to $74,999 | 3 (10.0%) | 0 (0.0%) |
| $75,000 to $99,999 | 1 (3.3%) | 3 (42.9%) |
| $100,000 to $149,999 | 13 (43.3%) | 1 (14.3%) |
| $150,000 or more | 0 (0.0%) | 1 (14.3%) |
| Total | 30 (100.0%) | 7 (100.0%) |
Property Value to Household Income Ratio in Pleasant Plain
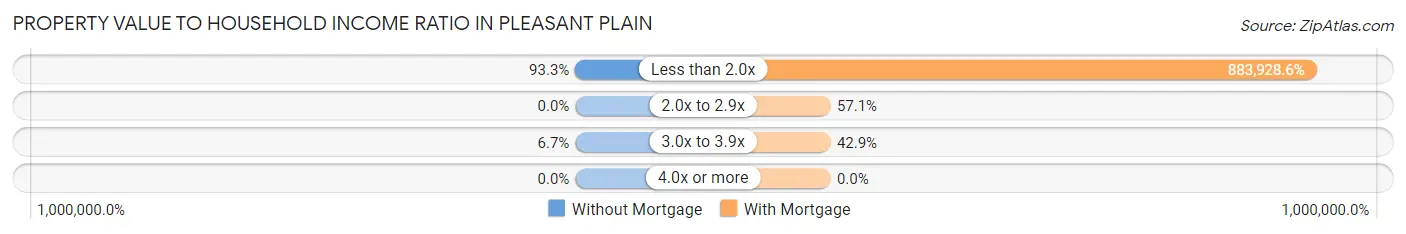
| Value-to-Income Ratio | Without Mortgage | With Mortgage |
| Less than 2.0x | 28 (93.3%) | 61,875 (883,928.6%) |
| 2.0x to 2.9x | 0 (0.0%) | 4 (57.1%) |
| 3.0x to 3.9x | 2 (6.7%) | 3 (42.9%) |
| 4.0x or more | 0 (0.0%) | 0 (0.0%) |
| Total | 30 (100.0%) | 7 (100.0%) |
Real Estate Taxes by Mortgage Status in Pleasant Plain
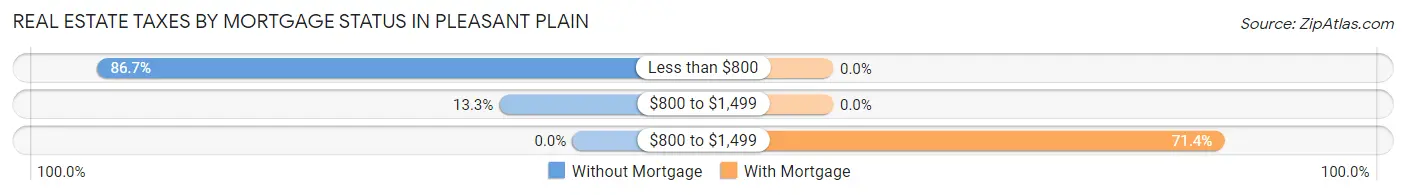
| Property Taxes | Without Mortgage | With Mortgage |
| Less than $800 | 26 (86.7%) | 0 (0.0%) |
| $800 to $1,499 | 4 (13.3%) | 0 (0.0%) |
| $800 to $1,499 | 0 (0.0%) | 5 (71.4%) |
| Total | 30 (100.0%) | 7 (100.0%) |
Health & Disability in Pleasant Plain
Health Insurance Coverage by Age in Pleasant Plain
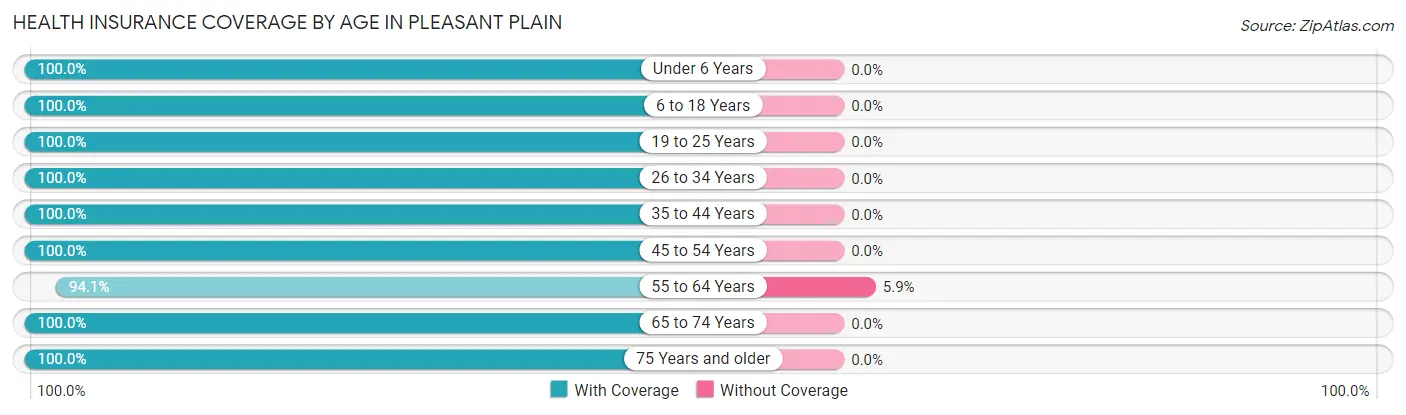
| Age Bracket | With Coverage | Without Coverage |
| Under 6 Years | 1 (100.0%) | 0 (0.0%) |
| 6 to 18 Years | 11 (100.0%) | 0 (0.0%) |
| 19 to 25 Years | 1 (100.0%) | 0 (0.0%) |
| 26 to 34 Years | 5 (100.0%) | 0 (0.0%) |
| 35 to 44 Years | 3 (100.0%) | 0 (0.0%) |
| 45 to 54 Years | 18 (100.0%) | 0 (0.0%) |
| 55 to 64 Years | 16 (94.1%) | 1 (5.9%) |
| 65 to 74 Years | 15 (100.0%) | 0 (0.0%) |
| 75 Years and older | 8 (100.0%) | 0 (0.0%) |
| Total | 78 (98.7%) | 1 (1.3%) |
Health Insurance Coverage by Citizenship Status in Pleasant Plain
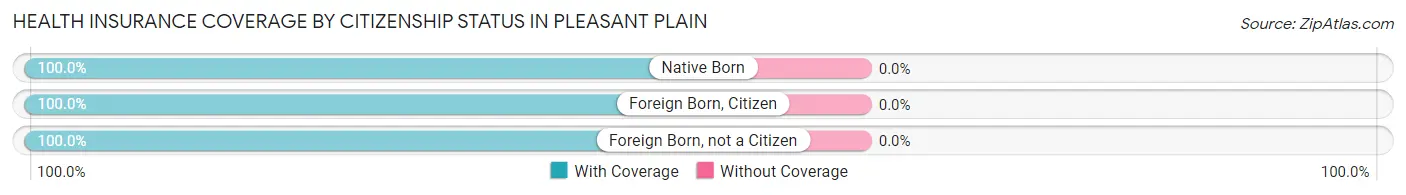
| Citizenship Status | With Coverage | Without Coverage |
| Native Born | 1 (100.0%) | 0 (0.0%) |
| Foreign Born, Citizen | 11 (100.0%) | 0 (0.0%) |
| Foreign Born, not a Citizen | 1 (100.0%) | 0 (0.0%) |
Health Insurance Coverage by Household Income in Pleasant Plain
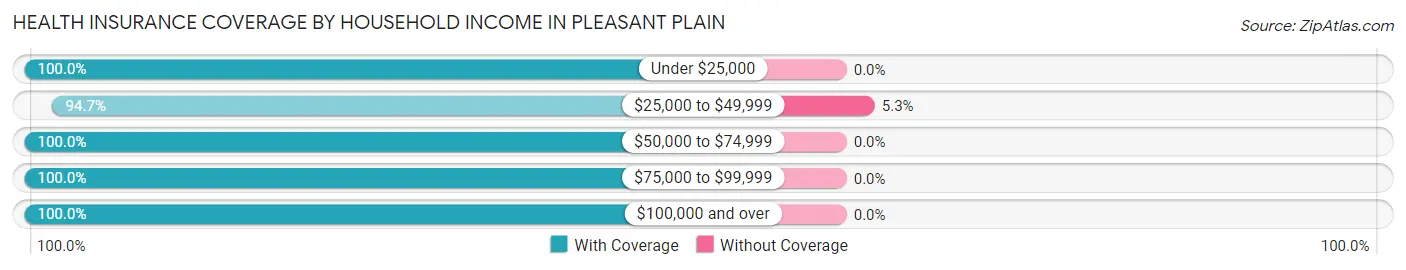
| Household Income | With Coverage | Without Coverage |
| Under $25,000 | 14 (100.0%) | 0 (0.0%) |
| $25,000 to $49,999 | 18 (94.7%) | 1 (5.3%) |
| $50,000 to $74,999 | 13 (100.0%) | 0 (0.0%) |
| $75,000 to $99,999 | 9 (100.0%) | 0 (0.0%) |
| $100,000 and over | 24 (100.0%) | 0 (0.0%) |
Public vs Private Health Insurance Coverage by Age in Pleasant Plain
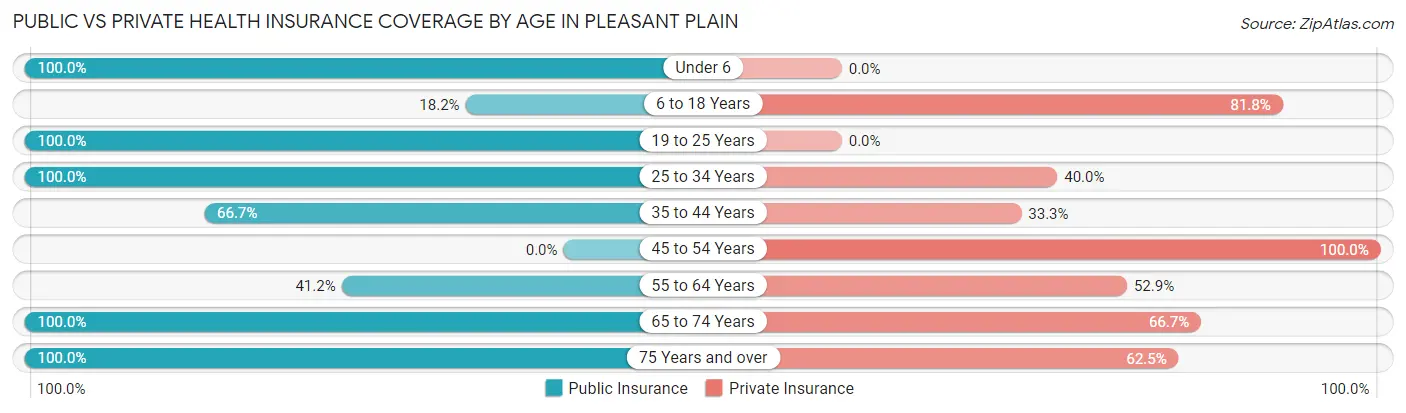
| Age Bracket | Public Insurance | Private Insurance |
| Under 6 | 1 (100.0%) | 0 (0.0%) |
| 6 to 18 Years | 2 (18.2%) | 9 (81.8%) |
| 19 to 25 Years | 1 (100.0%) | 0 (0.0%) |
| 25 to 34 Years | 5 (100.0%) | 2 (40.0%) |
| 35 to 44 Years | 2 (66.7%) | 1 (33.3%) |
| 45 to 54 Years | 0 (0.0%) | 18 (100.0%) |
| 55 to 64 Years | 7 (41.2%) | 9 (52.9%) |
| 65 to 74 Years | 15 (100.0%) | 10 (66.7%) |
| 75 Years and over | 8 (100.0%) | 5 (62.5%) |
| Total | 41 (51.9%) | 54 (68.3%) |
Disability Status by Sex by Age in Pleasant Plain
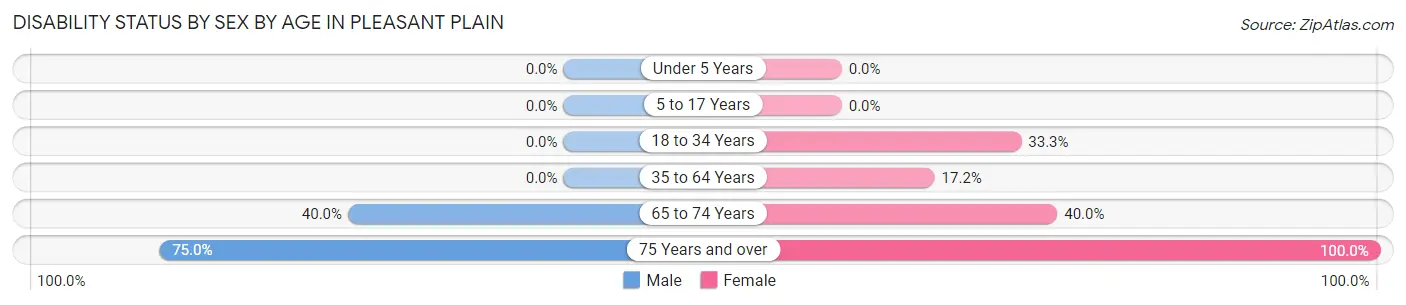
| Age Bracket | Male | Female |
| Under 5 Years | 0 (0.0%) | 0 (0.0%) |
| 5 to 17 Years | 0 (0.0%) | 0 (0.0%) |
| 18 to 34 Years | 0 (0.0%) | 1 (33.3%) |
| 35 to 64 Years | 0 (0.0%) | 5 (17.2%) |
| 65 to 74 Years | 4 (40.0%) | 2 (40.0%) |
| 75 Years and over | 3 (75.0%) | 4 (100.0%) |
Disability Class by Sex by Age in Pleasant Plain
Disability Class: Hearing Difficulty
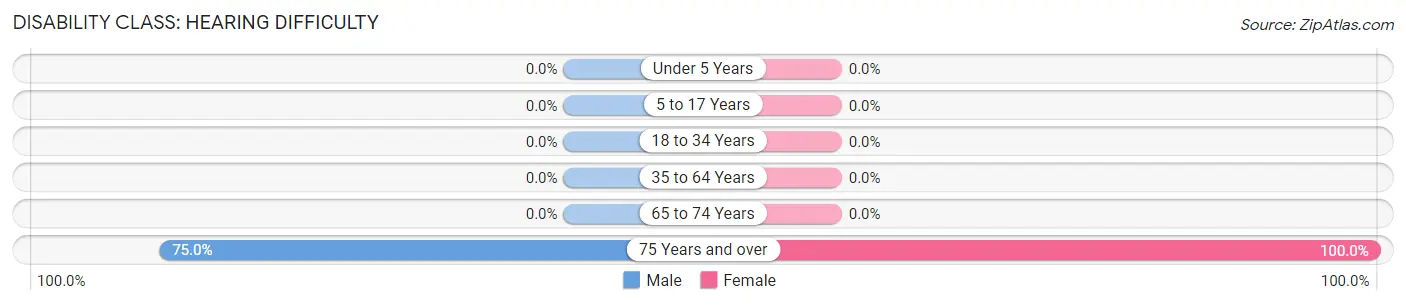
| Age Bracket | Male | Female |
| Under 5 Years | 0 (0.0%) | 0 (0.0%) |
| 5 to 17 Years | 0 (0.0%) | 0 (0.0%) |
| 18 to 34 Years | 0 (0.0%) | 0 (0.0%) |
| 35 to 64 Years | 0 (0.0%) | 0 (0.0%) |
| 65 to 74 Years | 0 (0.0%) | 0 (0.0%) |
| 75 Years and over | 3 (75.0%) | 4 (100.0%) |
Disability Class: Vision Difficulty
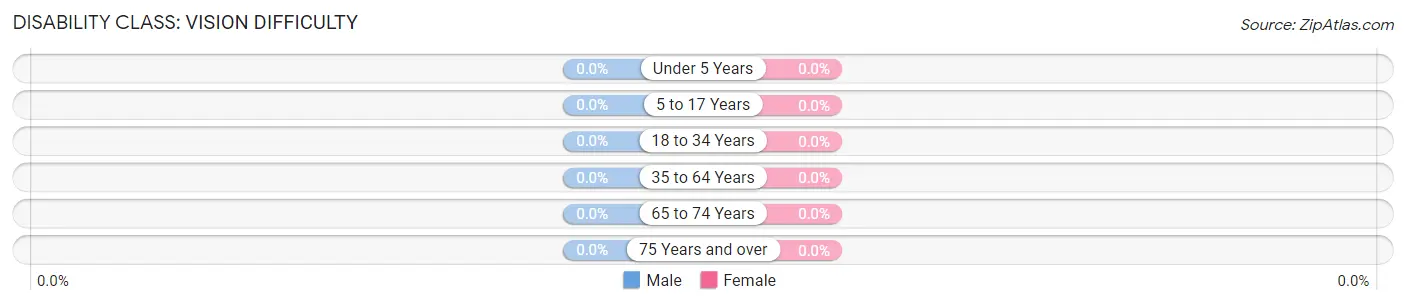
| Age Bracket | Male | Female |
| Under 5 Years | 0 (0.0%) | 0 (0.0%) |
| 5 to 17 Years | 0 (0.0%) | 0 (0.0%) |
| 18 to 34 Years | 0 (0.0%) | 0 (0.0%) |
| 35 to 64 Years | 0 (0.0%) | 0 (0.0%) |
| 65 to 74 Years | 0 (0.0%) | 0 (0.0%) |
| 75 Years and over | 0 (0.0%) | 0 (0.0%) |
Disability Class: Cognitive Difficulty
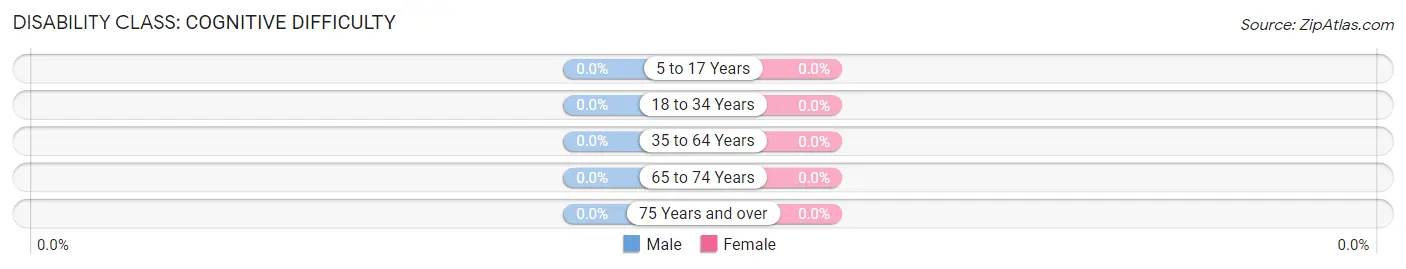
| Age Bracket | Male | Female |
| 5 to 17 Years | 0 (0.0%) | 0 (0.0%) |
| 18 to 34 Years | 0 (0.0%) | 0 (0.0%) |
| 35 to 64 Years | 0 (0.0%) | 0 (0.0%) |
| 65 to 74 Years | 0 (0.0%) | 0 (0.0%) |
| 75 Years and over | 0 (0.0%) | 0 (0.0%) |
Disability Class: Ambulatory Difficulty
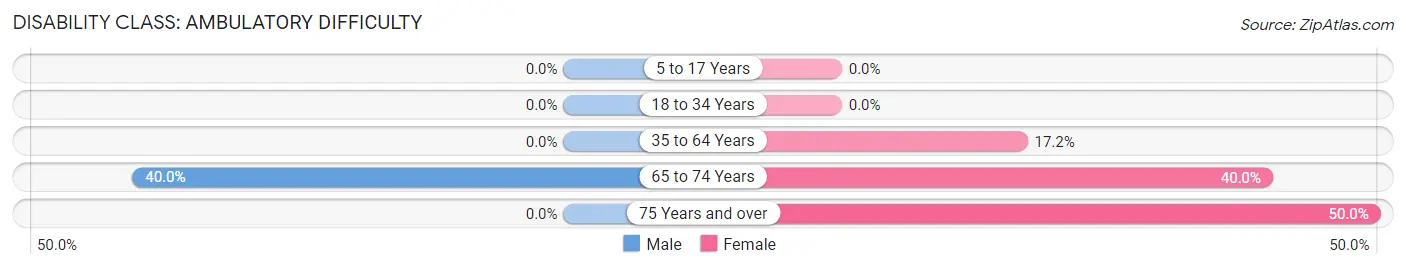
| Age Bracket | Male | Female |
| 5 to 17 Years | 0 (0.0%) | 0 (0.0%) |
| 18 to 34 Years | 0 (0.0%) | 0 (0.0%) |
| 35 to 64 Years | 0 (0.0%) | 5 (17.2%) |
| 65 to 74 Years | 4 (40.0%) | 2 (40.0%) |
| 75 Years and over | 0 (0.0%) | 2 (50.0%) |
Disability Class: Self-Care Difficulty
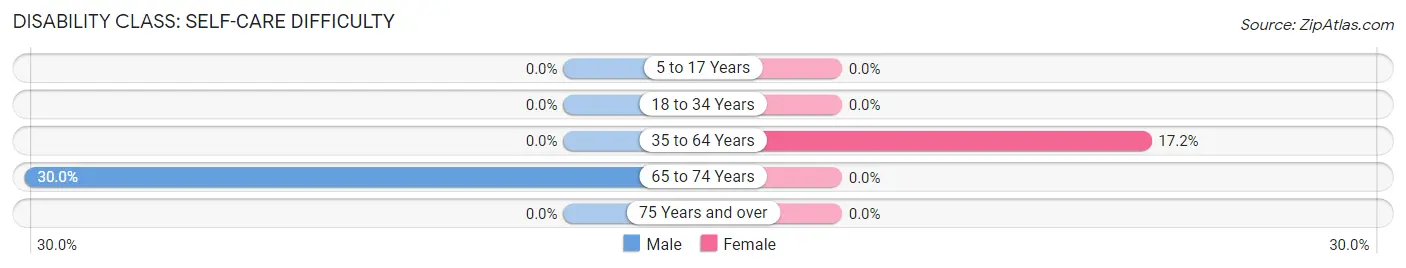
| Age Bracket | Male | Female |
| 5 to 17 Years | 0 (0.0%) | 0 (0.0%) |
| 18 to 34 Years | 0 (0.0%) | 0 (0.0%) |
| 35 to 64 Years | 0 (0.0%) | 5 (17.2%) |
| 65 to 74 Years | 3 (30.0%) | 0 (0.0%) |
| 75 Years and over | 0 (0.0%) | 0 (0.0%) |
Technology Access in Pleasant Plain
Computing Device Access in Pleasant Plain
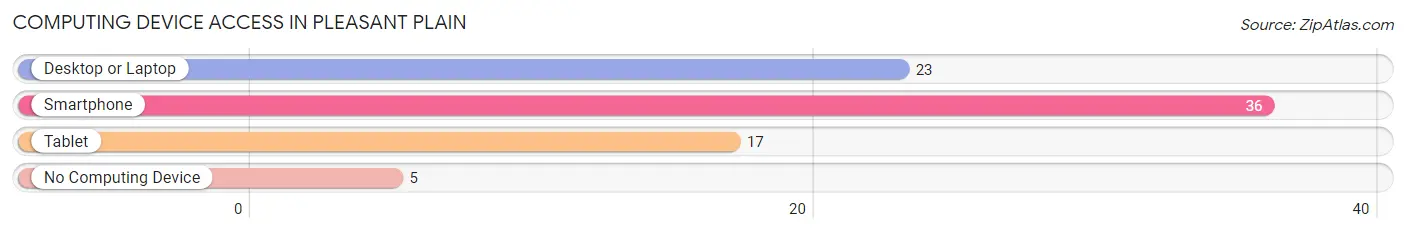
| Device Type | # Households | % Households |
| Desktop or Laptop | 23 | 52.3% |
| Smartphone | 36 | 81.8% |
| Tablet | 17 | 38.6% |
| No Computing Device | 5 | 11.4% |
| Total | 44 | 100.0% |
Internet Access in Pleasant Plain
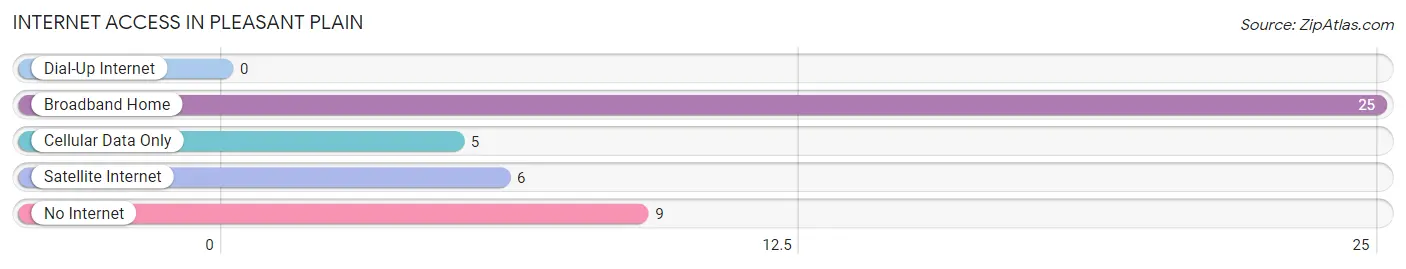
| Internet Type | # Households | % Households |
| Dial-Up Internet | 0 | 0.0% |
| Broadband Home | 25 | 56.8% |
| Cellular Data Only | 5 | 11.4% |
| Satellite Internet | 6 | 13.6% |
| No Internet | 9 | 20.4% |
| Total | 44 | 100.0% |
Pleasant Plain Summary
Pleasant Plain is a small unincorporated community located in the southeastern corner of Iowa, in Jefferson County. It is situated on the banks of the Des Moines River, about 10 miles south of the city of Fairfield. The population of Pleasant Plain was estimated to be around 200 people in 2020.
History
Pleasant Plain was first settled in 1837 by a group of settlers from Ohio. The town was originally known as “Pleasant Plains”, but the name was later shortened to “Pleasant Plain”. The town was officially incorporated in 1845.
The town was a popular stop for travelers on the Des Moines River, as it was located at the intersection of two major roads. The town was also a popular destination for farmers, as the fertile soil of the area was ideal for growing crops.
In the late 19th century, Pleasant Plain was a thriving community with a variety of businesses, including a hotel, a general store, a blacksmith shop, and a post office. The town also had a school, a church, and a cemetery.
Geography
Pleasant Plain is located in the southeastern corner of Iowa, in Jefferson County. It is situated on the banks of the Des Moines River, about 10 miles south of the city of Fairfield. The town is surrounded by rolling hills and farmland.
The climate in Pleasant Plain is typical of the Midwest, with hot summers and cold winters. The average temperature in the summer is around 75 degrees Fahrenheit, and the average temperature in the winter is around 25 degrees Fahrenheit.
Economy
The economy of Pleasant Plain is largely based on agriculture. The town is surrounded by fertile farmland, and many of the residents are involved in farming and related activities. The town also has a few small businesses, including a general store and a post office.
Demographics
The population of Pleasant Plain was estimated to be around 200 people in 2020. The town is predominantly white, with a small minority population. The median household income in the town is around $50,000, and the median home value is around $150,000.
Conclusion
Pleasant Plain is a small unincorporated community located in the southeastern corner of Iowa, in Jefferson County. It is situated on the banks of the Des Moines River, about 10 miles south of the city of Fairfield. The population of Pleasant Plain was estimated to be around 200 people in 2020. The town is predominantly white, with a small minority population. The economy of Pleasant Plain is largely based on agriculture, and the town is surrounded by fertile farmland. The town also has a few small businesses, including a general store and a post office.
Common Questions
What is Per Capita Income in Pleasant Plain?
Per Capita income in Pleasant Plain is $36,792.
What is Inequality or Gini Index in Pleasant Plain?
Inequality or Gini Index in Pleasant Plain is 0.34.
What is the Total Population of Pleasant Plain?
Total Population of Pleasant Plain is 79.
What is the Total Male Population of Pleasant Plain?
Total Male Population of Pleasant Plain is 31.
What is the Total Female Population of Pleasant Plain?
Total Female Population of Pleasant Plain is 48.
What is the Ratio of Males per 100 Females in Pleasant Plain?
There are 64.58 Males per 100 Females in Pleasant Plain.
What is the Ratio of Females per 100 Males in Pleasant Plain?
There are 154.84 Females per 100 Males in Pleasant Plain.
What is the Median Population Age in Pleasant Plain?
Median Population Age in Pleasant Plain is 55.1 Years.
What is the Average Family Size in Pleasant Plain
Average Family Size in Pleasant Plain is 1.9 People.
What is the Average Household Size in Pleasant Plain
Average Household Size in Pleasant Plain is 1.8 People.
How Large is the Labor Force in Pleasant Plain?
There are 38 People in the Labor Forcein in Pleasant Plain.
What is the Percentage of People in the Labor Force in Pleasant Plain?
49.4% of People are in the Labor Force in Pleasant Plain.