Zip Codes with the Highest Percentage of Population Employed in Administrative & Support Services in Urbandale, IA
RELATED REPORTS & OPTIONS
Administrative & Support Services
Urbandale
Compare Zip Codes
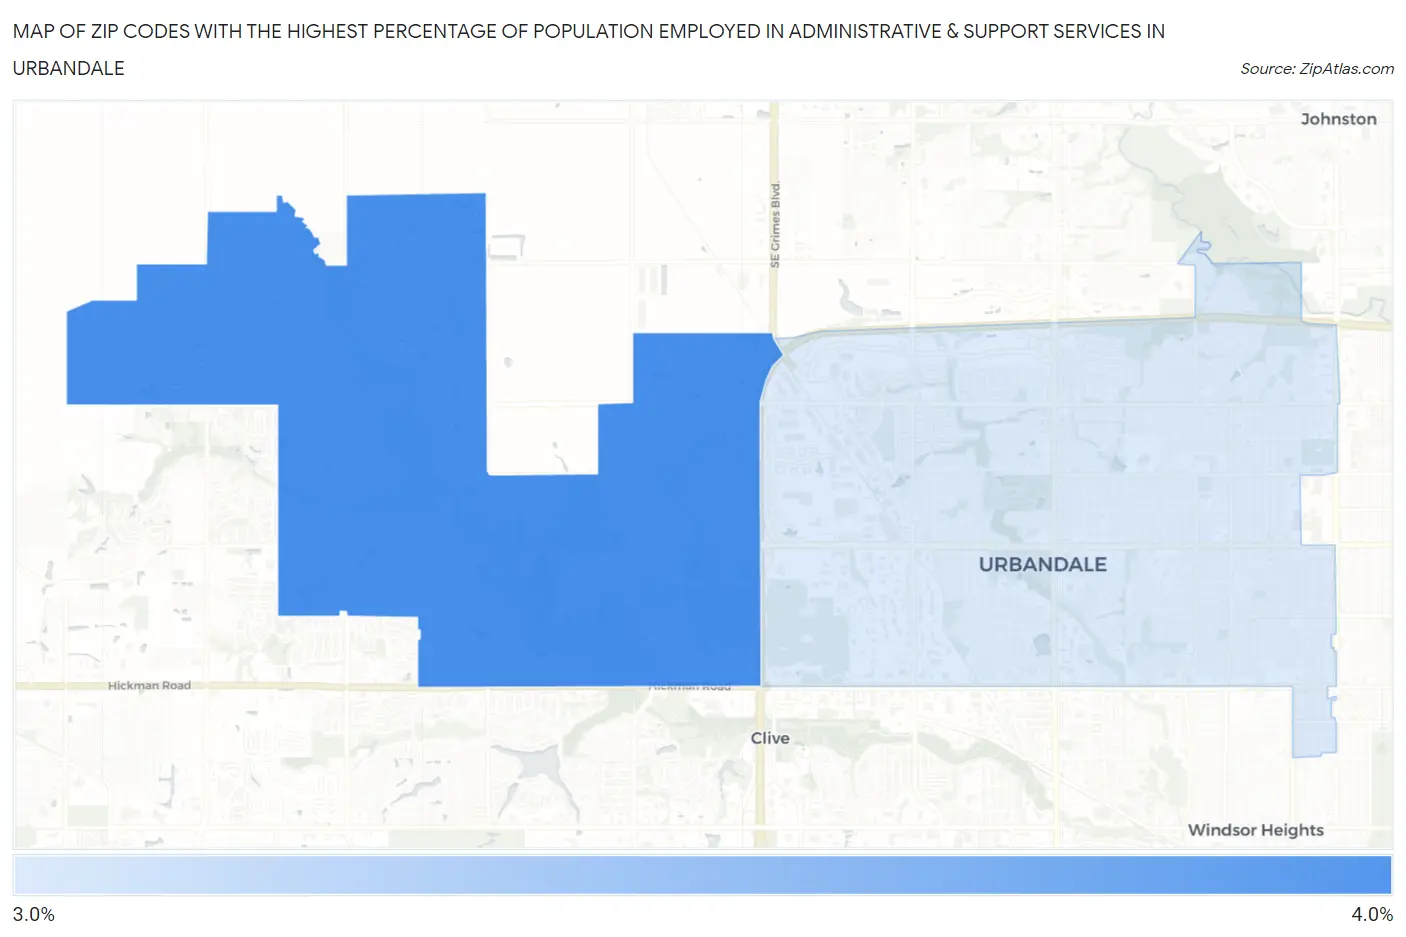
Map of Zip Codes with the Highest Percentage of Population Employed in Administrative & Support Services in Urbandale
3.0%
3.9%
Zip Codes with the Highest Percentage of Population Employed in Administrative & Support Services in Urbandale, IA
| Zip Code | % Employed | vs State | vs National | |
| 1. | 50323 | 3.9% | 3.0%(+0.888)#207 | 4.1%(-0.233)#11,023 |
| 2. | 50322 | 3.0% | 3.0%(-0.001)#301 | 4.1%(-1.12)#15,326 |
1
Common Questions
What are the Top Zip Codes with the Highest Percentage of Population Employed in Administrative & Support Services in Urbandale, IA?
Top Zip Codes with the Highest Percentage of Population Employed in Administrative & Support Services in Urbandale, IA are:
What zip code has the Highest Percentage of Population Employed in Administrative & Support Services in Urbandale, IA?
50323 has the Highest Percentage of Population Employed in Administrative & Support Services in Urbandale, IA with 3.9%.
What is the Percentage of Population Employed in Administrative & Support Services in Urbandale, IA?
Percentage of Population Employed in Administrative & Support Services in Urbandale is 3.3%.
What is the Percentage of Population Employed in Administrative & Support Services in Iowa?
Percentage of Population Employed in Administrative & Support Services in Iowa is 3.0%.
What is the Percentage of Population Employed in Administrative & Support Services in the United States?
Percentage of Population Employed in Administrative & Support Services in the United States is 4.1%.