Clarence, IA Map & Demographics
Clarence Map
Clarence Overview
$30,079
PER CAPITA INCOME
$78,929
AVG FAMILY INCOME
$63,594
AVG HOUSEHOLD INCOME
45.7%
WAGE / INCOME GAP [ % ]
54.3¢/ $1
WAGE / INCOME GAP [ $ ]
0.38
INEQUALITY / GINI INDEX
1,136
TOTAL POPULATION
479
MALE POPULATION
657
FEMALE POPULATION
72.91
MALES / 100 FEMALES
137.16
FEMALES / 100 MALES
45.1
MEDIAN AGE
2.7
AVG FAMILY SIZE
2.3
AVG HOUSEHOLD SIZE
529
LABOR FORCE [ PEOPLE ]
56.1%
PERCENT IN LABOR FORCE
1.1%
UNEMPLOYMENT RATE
Clarence Zip Codes
Clarence Area Codes
Income in Clarence
Income Overview in Clarence
Per Capita Income in Clarence is $30,079, while median incomes of families and households are $78,929 and $63,594 respectively.
| Characteristic | Number | Measure |
| Per Capita Income | 1,136 | $30,079 |
| Median Family Income | 308 | $78,929 |
| Mean Family Income | 308 | $85,958 |
| Median Household Income | 481 | $63,594 |
| Mean Household Income | 481 | $72,658 |
| Income Deficit | 308 | $0 |
| Wage / Income Gap (%) | 1,136 | 45.66% |
| Wage / Income Gap ($) | 1,136 | 54.34¢ per $1 |
| Gini / Inequality Index | 1,136 | 0.38 |
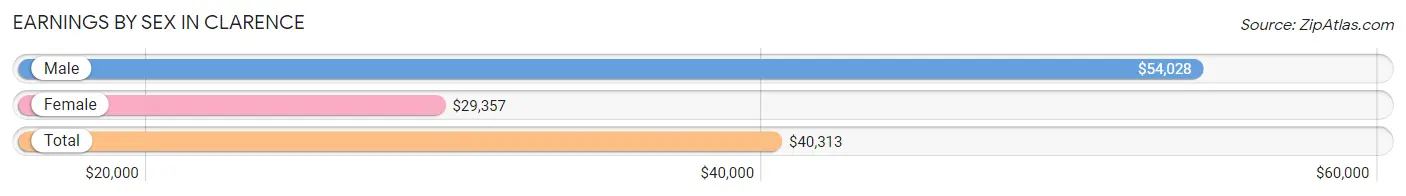
Earnings by Sex in Clarence
Average Earnings in Clarence are $40,313, $54,028 for men and $29,357 for women, a difference of 45.7%.
| Sex | Number | Average Earnings |
| Male | 269 (48.8%) | $54,028 |
| Female | 282 (51.2%) | $29,357 |
| Total | 551 (100.0%) | $40,313 |
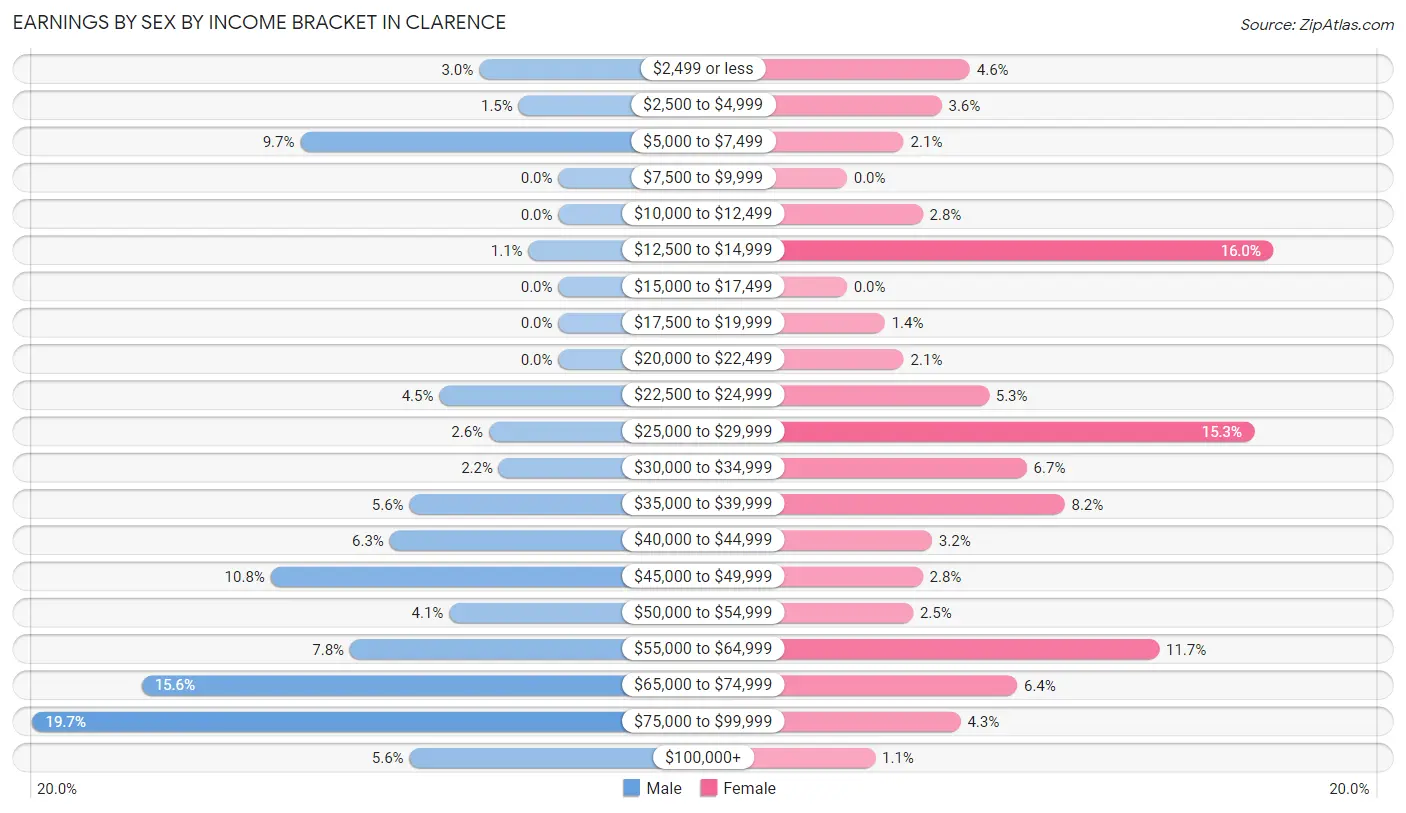
Earnings by Sex by Income Bracket in Clarence
The most common earnings brackets in Clarence are $75,000 to $99,999 for men (53 | 19.7%) and $12,500 to $14,999 for women (45 | 16.0%).
| Income | Male | Female |
| $2,499 or less | 8 (3.0%) | 13 (4.6%) |
| $2,500 to $4,999 | 4 (1.5%) | 10 (3.5%) |
| $5,000 to $7,499 | 26 (9.7%) | 6 (2.1%) |
| $7,500 to $9,999 | 0 (0.0%) | 0 (0.0%) |
| $10,000 to $12,499 | 0 (0.0%) | 8 (2.8%) |
| $12,500 to $14,999 | 3 (1.1%) | 45 (16.0%) |
| $15,000 to $17,499 | 0 (0.0%) | 0 (0.0%) |
| $17,500 to $19,999 | 0 (0.0%) | 4 (1.4%) |
| $20,000 to $22,499 | 0 (0.0%) | 6 (2.1%) |
| $22,500 to $24,999 | 12 (4.5%) | 15 (5.3%) |
| $25,000 to $29,999 | 7 (2.6%) | 43 (15.2%) |
| $30,000 to $34,999 | 6 (2.2%) | 19 (6.7%) |
| $35,000 to $39,999 | 15 (5.6%) | 23 (8.2%) |
| $40,000 to $44,999 | 17 (6.3%) | 9 (3.2%) |
| $45,000 to $49,999 | 29 (10.8%) | 8 (2.8%) |
| $50,000 to $54,999 | 11 (4.1%) | 7 (2.5%) |
| $55,000 to $64,999 | 21 (7.8%) | 33 (11.7%) |
| $65,000 to $74,999 | 42 (15.6%) | 18 (6.4%) |
| $75,000 to $99,999 | 53 (19.7%) | 12 (4.3%) |
| $100,000+ | 15 (5.6%) | 3 (1.1%) |
| Total | 269 (100.0%) | 282 (100.0%) |
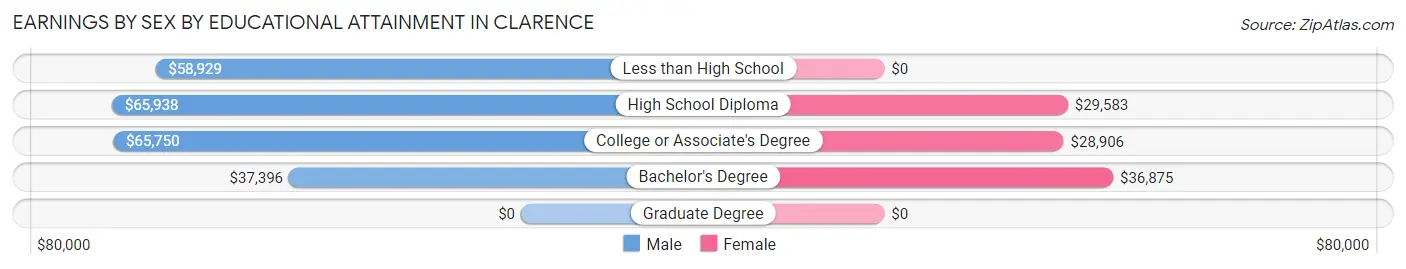
Earnings by Sex by Educational Attainment in Clarence
Average earnings in Clarence are $54,583 for men and $29,786 for women, a difference of 45.4%. Men with an educational attainment of high school diploma enjoy the highest average annual earnings of $65,938, while those with bachelor's degree education earn the least with $37,396. Women with an educational attainment of bachelor's degree earn the most with the average annual earnings of $36,875, while those with college or associate's degree education have the smallest earnings of $28,906.
| Educational Attainment | Male Income | Female Income |
| Less than High School | $58,929 | $0 |
| High School Diploma | $65,938 | $29,583 |
| College or Associate's Degree | $65,750 | $28,906 |
| Bachelor's Degree | $37,396 | $36,875 |
| Graduate Degree | - | - |
| Total | $54,583 | $29,786 |
Family Income in Clarence
Family Income Brackets in Clarence
According to the Clarence family income data, there are 83 families falling into the $100,000 to $149,999 income range, which is the most common income bracket and makes up 27.0% of all families. Conversely, the $15,000 to $24,999 income bracket is the least frequent group with only 4 families (1.3%) belonging to this category.
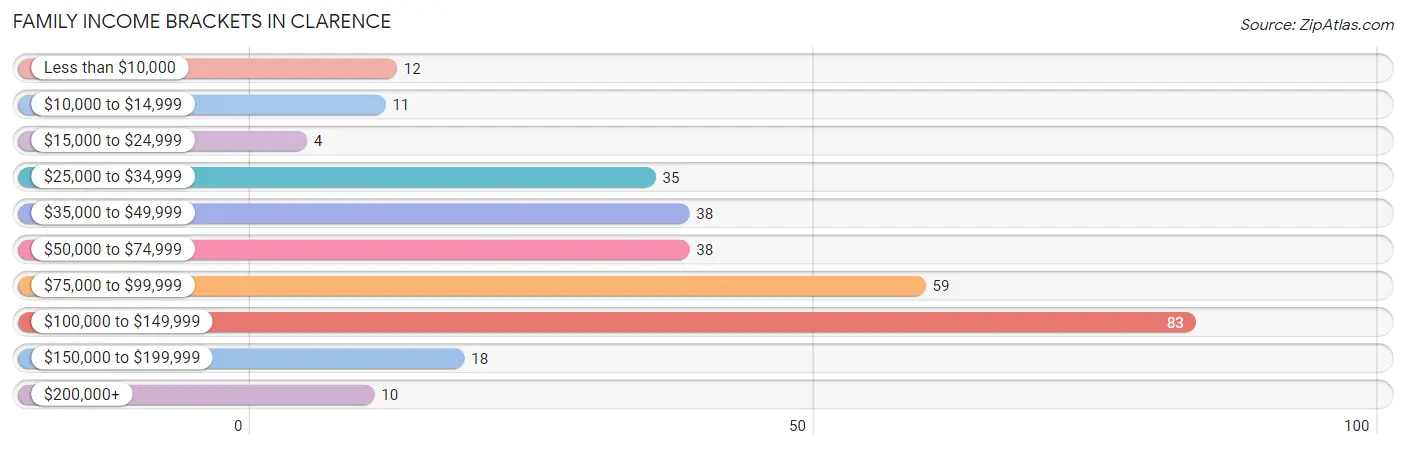
| Income Bracket | # Families | % Families |
| Less than $10,000 | 12 | 3.9% |
| $10,000 to $14,999 | 11 | 3.6% |
| $15,000 to $24,999 | 4 | 1.3% |
| $25,000 to $34,999 | 35 | 11.4% |
| $35,000 to $49,999 | 38 | 12.3% |
| $50,000 to $74,999 | 38 | 12.3% |
| $75,000 to $99,999 | 59 | 19.2% |
| $100,000 to $149,999 | 83 | 26.9% |
| $150,000 to $199,999 | 18 | 5.8% |
| $200,000+ | 10 | 3.2% |
Family Income by Famaliy Size in Clarence
5-person families (45 | 14.6%) account for the highest median family income in Clarence with $126,182 per family, while 2-person families (156 | 50.6%) have the highest median income of $42,678 per family member.
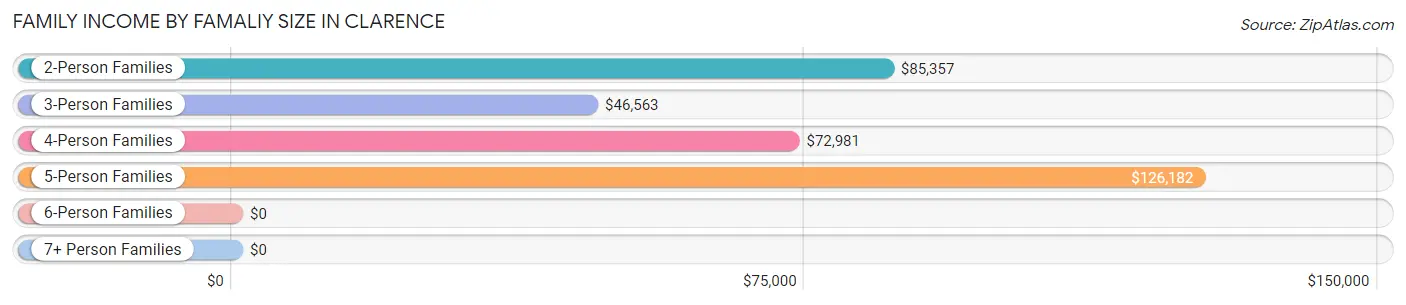
| Income Bracket | # Families | Median Income |
| 2-Person Families | 156 (50.6%) | $85,357 |
| 3-Person Families | 55 (17.9%) | $46,563 |
| 4-Person Families | 49 (15.9%) | $72,981 |
| 5-Person Families | 45 (14.6%) | $126,182 |
| 6-Person Families | 3 (1.0%) | $0 |
| 7+ Person Families | 0 (0.0%) | $0 |
| Total | 308 (100.0%) | $78,929 |
Family Income by Number of Earners in Clarence
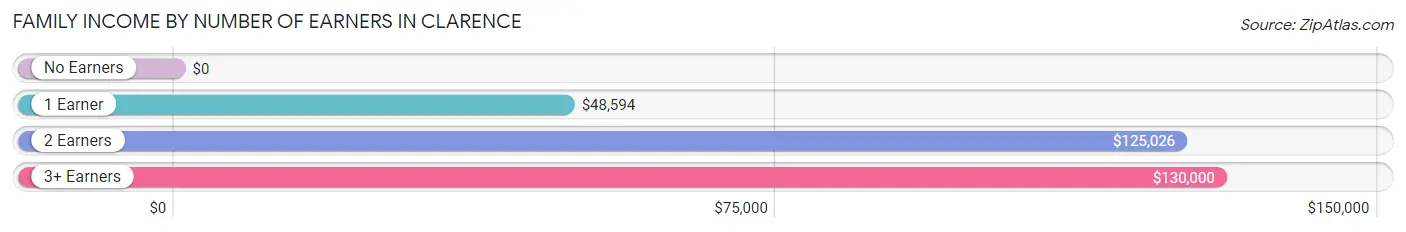
| Number of Earners | # Families | Median Income |
| No Earners | 46 (14.9%) | $0 |
| 1 Earner | 93 (30.2%) | $48,594 |
| 2 Earners | 153 (49.7%) | $125,026 |
| 3+ Earners | 16 (5.2%) | $130,000 |
| Total | 308 (100.0%) | $78,929 |
Household Income in Clarence
Household Income Brackets in Clarence
With 103 households falling in the category, the $100,000 to $149,999 income range is the most frequent in Clarence, accounting for 21.4% of all households. In contrast, only 10 households (2.1%) fall into the $200,000+ income bracket, making it the least populous group.
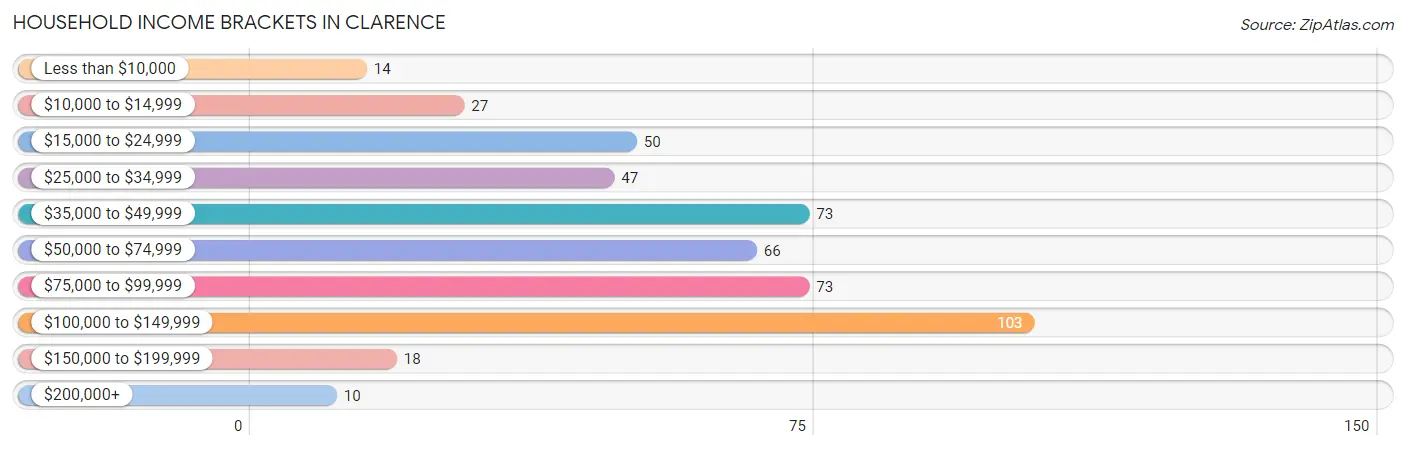
| Income Bracket | # Households | % Households |
| Less than $10,000 | 14 | 2.9% |
| $10,000 to $14,999 | 27 | 5.6% |
| $15,000 to $24,999 | 50 | 10.4% |
| $25,000 to $34,999 | 47 | 9.8% |
| $35,000 to $49,999 | 73 | 15.2% |
| $50,000 to $74,999 | 66 | 13.7% |
| $75,000 to $99,999 | 73 | 15.2% |
| $100,000 to $149,999 | 103 | 21.4% |
| $150,000 to $199,999 | 18 | 3.7% |
| $200,000+ | 10 | 2.1% |
Household Income by Householder Age in Clarence
The median household income in Clarence is $63,594, with the highest median household income of $79,688 found in the 45 to 64 years age bracket for the primary householder. A total of 221 households (46.0%) fall into this category. Meanwhile, the 15 to 24 years age bracket for the primary householder has the lowest median household income of $0, with 4 households (0.8%) in this group.
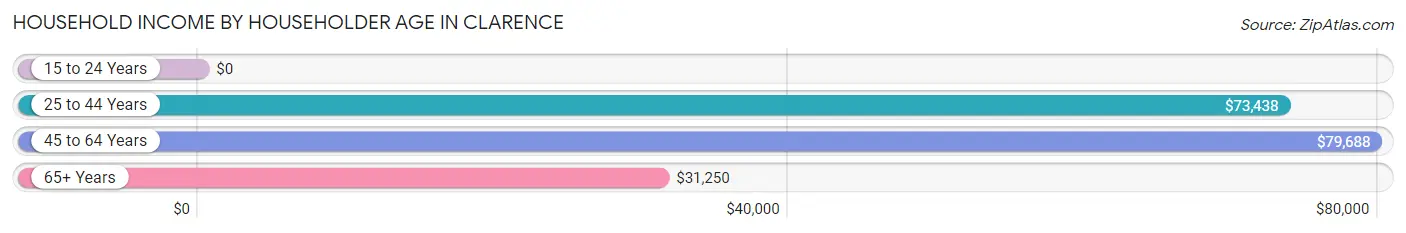
| Income Bracket | # Households | Median Income |
| 15 to 24 Years | 4 (0.8%) | $0 |
| 25 to 44 Years | 126 (26.2%) | $73,438 |
| 45 to 64 Years | 221 (46.0%) | $79,688 |
| 65+ Years | 130 (27.0%) | $31,250 |
| Total | 481 (100.0%) | $63,594 |
Poverty in Clarence
Income Below Poverty by Sex and Age in Clarence
With 16.9% poverty level for males and 9.1% for females among the residents of Clarence, 18 to 24 year old males and 6 to 11 year old females are the most vulnerable to poverty, with 14 males (51.8%) and 15 females (44.1%) in their respective age groups living below the poverty level.
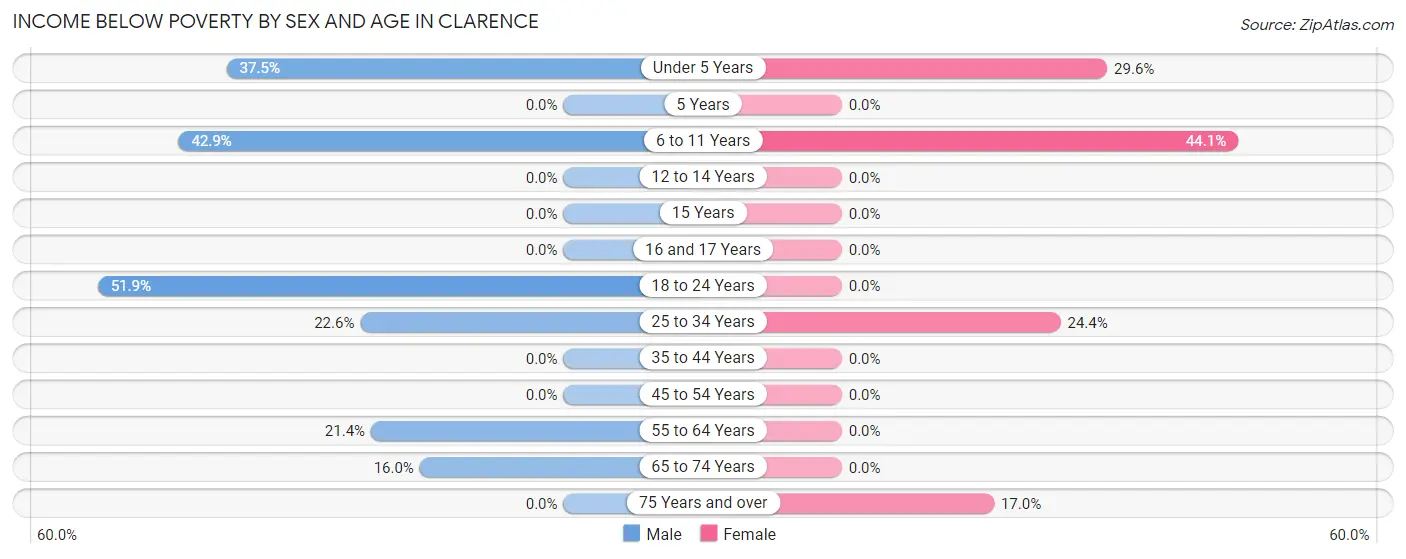
| Age Bracket | Male | Female |
| Under 5 Years | 9 (37.5%) | 13 (29.5%) |
| 5 Years | 0 (0.0%) | 0 (0.0%) |
| 6 to 11 Years | 6 (42.9%) | 15 (44.1%) |
| 12 to 14 Years | 0 (0.0%) | 0 (0.0%) |
| 15 Years | 0 (0.0%) | 0 (0.0%) |
| 16 and 17 Years | 0 (0.0%) | 0 (0.0%) |
| 18 to 24 Years | 14 (51.8%) | 0 (0.0%) |
| 25 to 34 Years | 19 (22.6%) | 19 (24.4%) |
| 35 to 44 Years | 0 (0.0%) | 0 (0.0%) |
| 45 to 54 Years | 0 (0.0%) | 0 (0.0%) |
| 55 to 64 Years | 21 (21.4%) | 0 (0.0%) |
| 65 to 74 Years | 8 (16.0%) | 0 (0.0%) |
| 75 Years and over | 0 (0.0%) | 10 (17.0%) |
| Total | 77 (16.9%) | 57 (9.1%) |
Income Above Poverty by Sex and Age in Clarence
According to the poverty statistics in Clarence, males aged 5 years and females aged 5 years are the age groups that are most secure financially, with 100.0% of males and 100.0% of females in these age groups living above the poverty line.
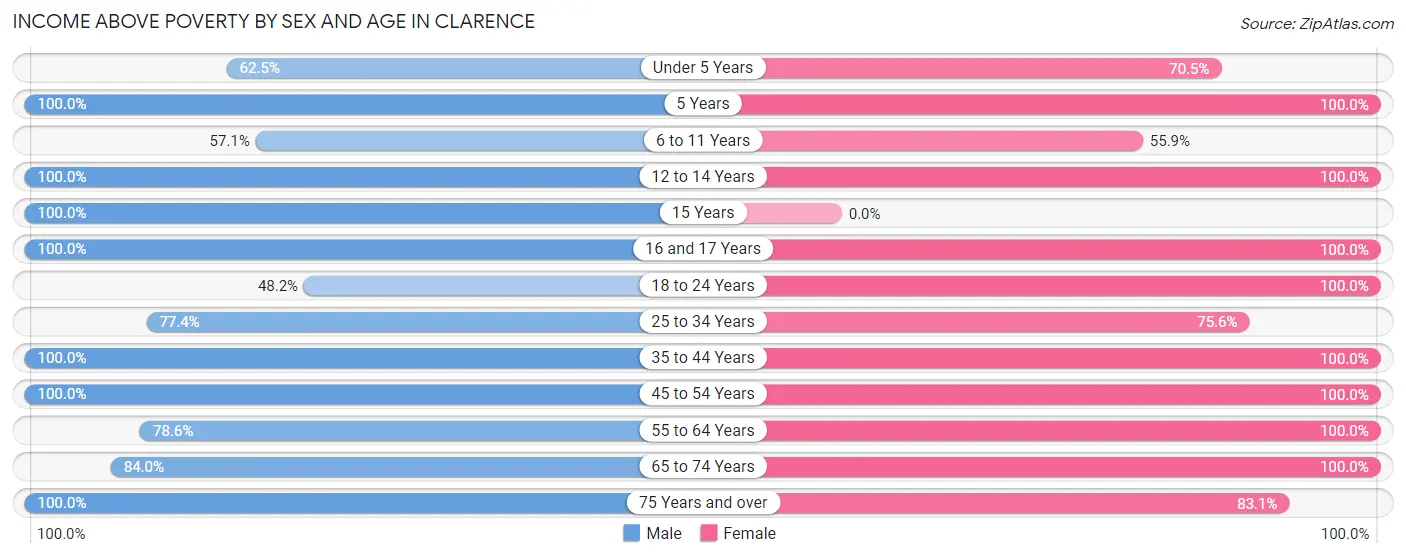
| Age Bracket | Male | Female |
| Under 5 Years | 15 (62.5%) | 31 (70.5%) |
| 5 Years | 5 (100.0%) | 7 (100.0%) |
| 6 to 11 Years | 8 (57.1%) | 19 (55.9%) |
| 12 to 14 Years | 16 (100.0%) | 39 (100.0%) |
| 15 Years | 3 (100.0%) | 0 (0.0%) |
| 16 and 17 Years | 6 (100.0%) | 56 (100.0%) |
| 18 to 24 Years | 13 (48.1%) | 33 (100.0%) |
| 25 to 34 Years | 65 (77.4%) | 59 (75.6%) |
| 35 to 44 Years | 35 (100.0%) | 47 (100.0%) |
| 45 to 54 Years | 70 (100.0%) | 94 (100.0%) |
| 55 to 64 Years | 77 (78.6%) | 79 (100.0%) |
| 65 to 74 Years | 42 (84.0%) | 55 (100.0%) |
| 75 Years and over | 25 (100.0%) | 49 (83.1%) |
| Total | 380 (83.2%) | 568 (90.9%) |
Income Below Poverty Among Married-Couple Families in Clarence
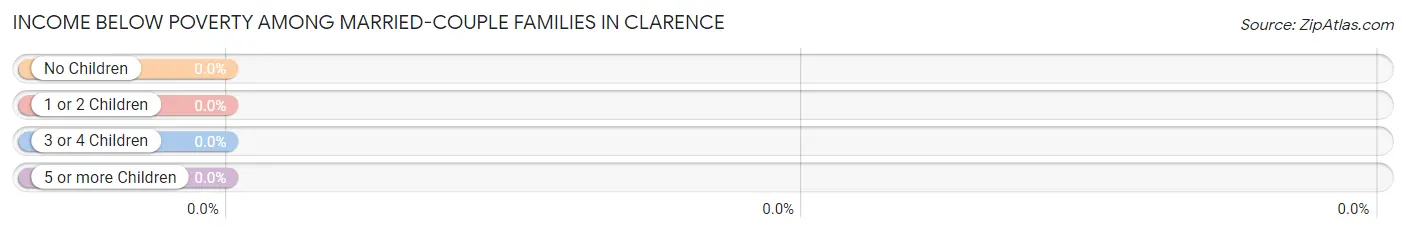
| Children | Above Poverty | Below Poverty |
| No Children | 129 (100.0%) | 0 (0.0%) |
| 1 or 2 Children | 90 (100.0%) | 0 (0.0%) |
| 3 or 4 Children | 3 (100.0%) | 0 (0.0%) |
| 5 or more Children | 0 (0.0%) | 0 (0.0%) |
| Total | 222 (100.0%) | 0 (0.0%) |
Income Below Poverty Among Single-Parent Households in Clarence
According to the poverty data in Clarence, 36.4% or 8 single-father households and 23.4% or 15 single-mother households are living below the poverty line. Among single-father households, those with no children have the highest poverty rate, with 8 households (36.4%) experiencing poverty. Likewise, among single-mother households, those with 3 or 4 children have the highest poverty rate, with 5 households (41.7%) falling below the poverty line.
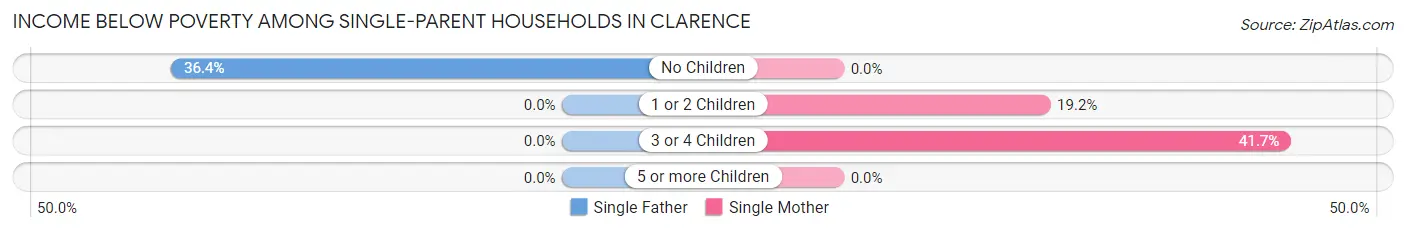
| Children | Single Father | Single Mother |
| No Children | 8 (36.4%) | 0 (0.0%) |
| 1 or 2 Children | 0 (0.0%) | 10 (19.2%) |
| 3 or 4 Children | 0 (0.0%) | 5 (41.7%) |
| 5 or more Children | 0 (0.0%) | 0 (0.0%) |
| Total | 8 (36.4%) | 15 (23.4%) |
Income Below Poverty Among Married-Couple vs Single-Parent Households in Clarence
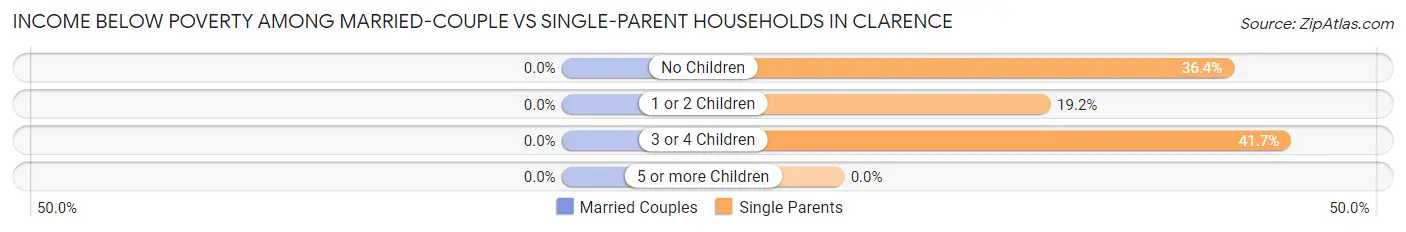
| Children | Married-Couple Families | Single-Parent Households |
| No Children | 0 (0.0%) | 8 (36.4%) |
| 1 or 2 Children | 0 (0.0%) | 10 (19.2%) |
| 3 or 4 Children | 0 (0.0%) | 5 (41.7%) |
| 5 or more Children | 0 (0.0%) | 0 (0.0%) |
| Total | 0 (0.0%) | 23 (26.7%) |
Race in Clarence
The most populous races in Clarence are White / Caucasian (1,133 | 99.7%), Hispanic or Latino (7 | 0.6%), and Two or more Races (3 | 0.3%).
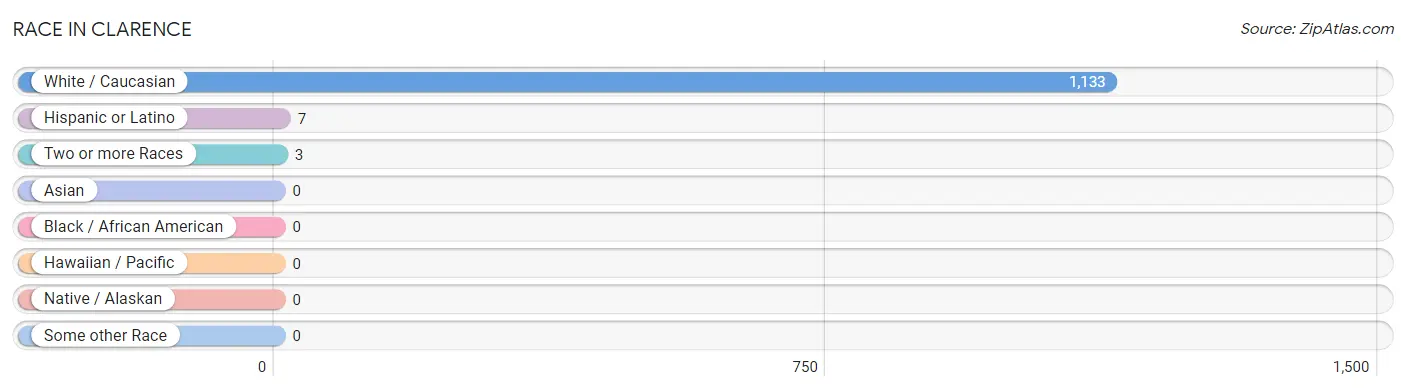
| Race | # Population | % Population |
| Asian | 0 | 0.0% |
| Black / African American | 0 | 0.0% |
| Hawaiian / Pacific | 0 | 0.0% |
| Hispanic or Latino | 7 | 0.6% |
| Native / Alaskan | 0 | 0.0% |
| White / Caucasian | 1,133 | 99.7% |
| Two or more Races | 3 | 0.3% |
| Some other Race | 0 | 0.0% |
| Total | 1,136 | 100.0% |
Ancestry in Clarence
The most populous ancestries reported in Clarence are German (646 | 56.9%), Irish (167 | 14.7%), American (68 | 6.0%), English (45 | 4.0%), and Czech (33 | 2.9%), together accounting for 84.4% of all Clarence residents.
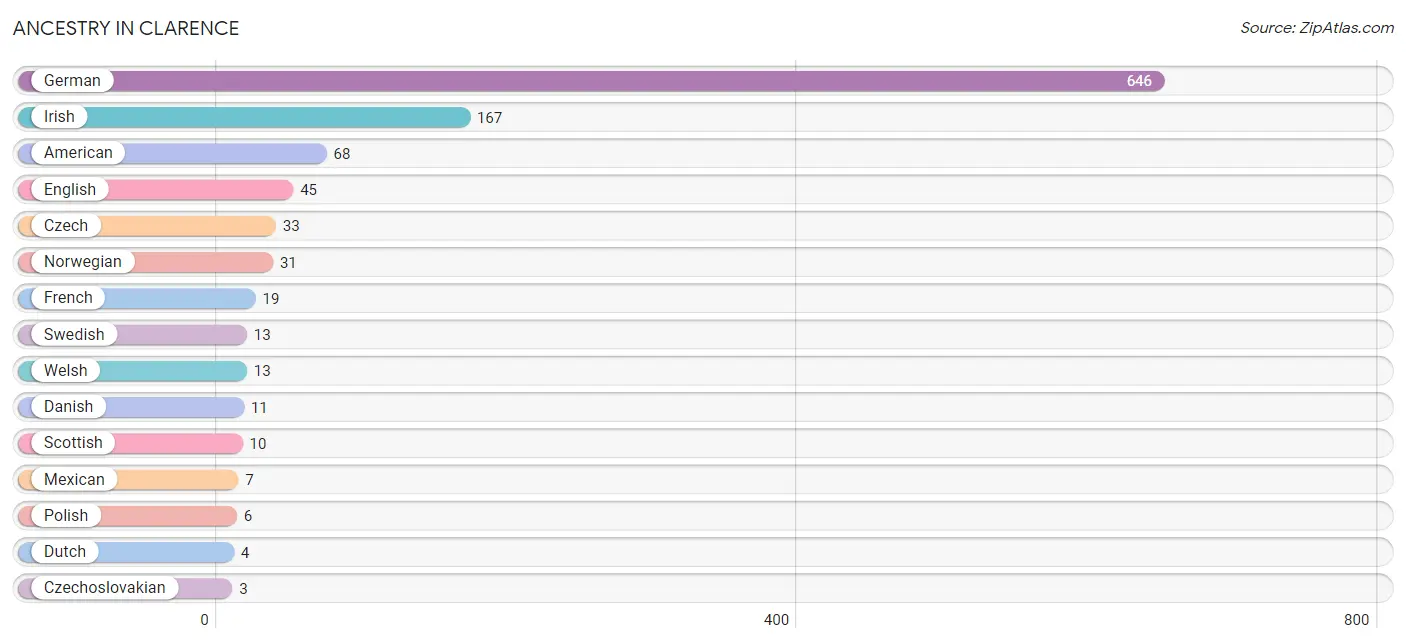
| Ancestry | # Population | % Population |
| American | 68 | 6.0% |
| Czech | 33 | 2.9% |
| Czechoslovakian | 3 | 0.3% |
| Danish | 11 | 1.0% |
| Dutch | 4 | 0.4% |
| Eastern European | 3 | 0.3% |
| English | 45 | 4.0% |
| European | 3 | 0.3% |
| French | 19 | 1.7% |
| German | 646 | 56.9% |
| Irish | 167 | 14.7% |
| Mexican | 7 | 0.6% |
| Norwegian | 31 | 2.7% |
| Polish | 6 | 0.5% |
| Scottish | 10 | 0.9% |
| Swedish | 13 | 1.1% |
| Welsh | 13 | 1.1% | View All 17 Rows |
Immigrants in Clarence

| Immigration Origin | # Population | % Population | View All 0 Rows |
Sex and Age in Clarence
Sex and Age in Clarence
The most populous age groups in Clarence are 30 to 34 Years (53 | 11.1%) for men and 45 to 49 Years (73 | 11.1%) for women.
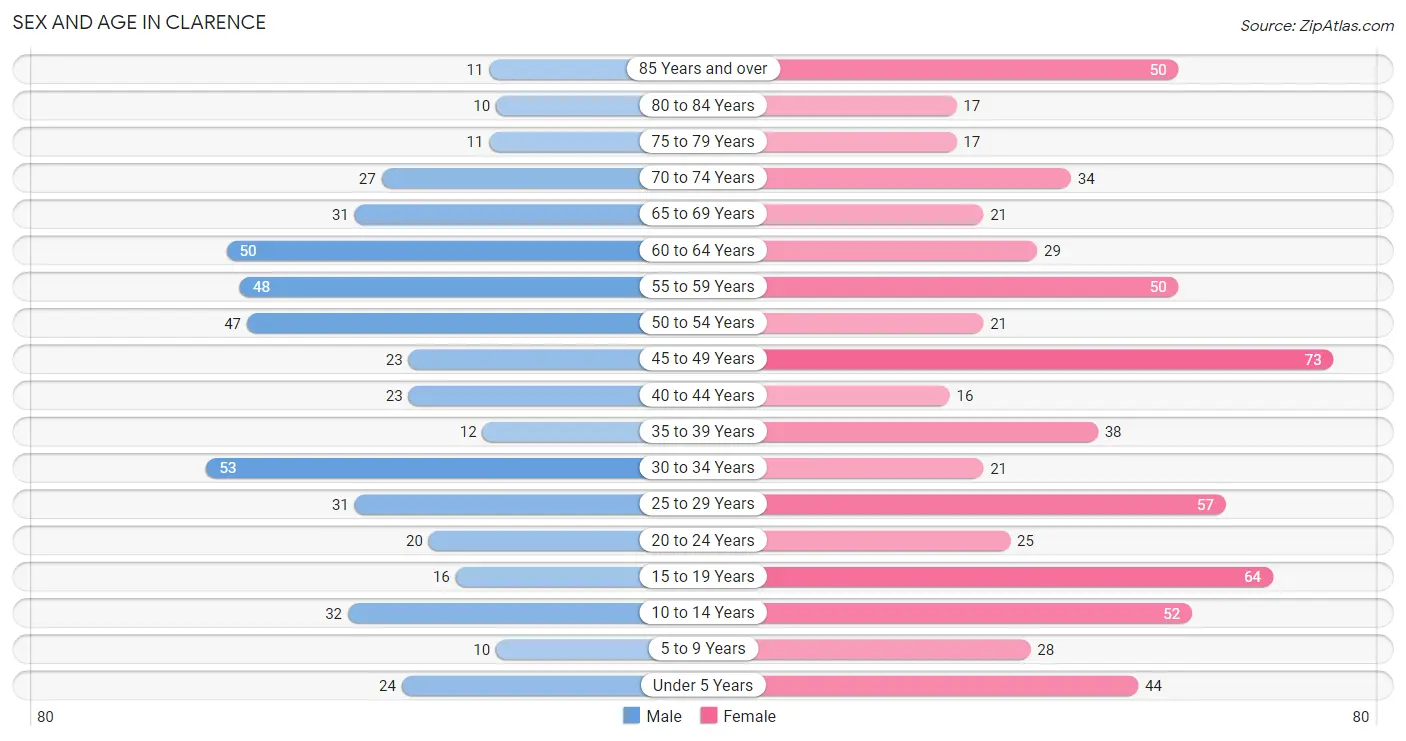
| Age Bracket | Male | Female |
| Under 5 Years | 24 (5.0%) | 44 (6.7%) |
| 5 to 9 Years | 10 (2.1%) | 28 (4.3%) |
| 10 to 14 Years | 32 (6.7%) | 52 (7.9%) |
| 15 to 19 Years | 16 (3.3%) | 64 (9.7%) |
| 20 to 24 Years | 20 (4.2%) | 25 (3.8%) |
| 25 to 29 Years | 31 (6.5%) | 57 (8.7%) |
| 30 to 34 Years | 53 (11.1%) | 21 (3.2%) |
| 35 to 39 Years | 12 (2.5%) | 38 (5.8%) |
| 40 to 44 Years | 23 (4.8%) | 16 (2.4%) |
| 45 to 49 Years | 23 (4.8%) | 73 (11.1%) |
| 50 to 54 Years | 47 (9.8%) | 21 (3.2%) |
| 55 to 59 Years | 48 (10.0%) | 50 (7.6%) |
| 60 to 64 Years | 50 (10.4%) | 29 (4.4%) |
| 65 to 69 Years | 31 (6.5%) | 21 (3.2%) |
| 70 to 74 Years | 27 (5.6%) | 34 (5.2%) |
| 75 to 79 Years | 11 (2.3%) | 17 (2.6%) |
| 80 to 84 Years | 10 (2.1%) | 17 (2.6%) |
| 85 Years and over | 11 (2.3%) | 50 (7.6%) |
| Total | 479 (100.0%) | 657 (100.0%) |
Families and Households in Clarence
Median Family Size in Clarence
The median family size in Clarence is 2.74 persons per family, with single female/mother families (64 | 20.8%) accounting for the largest median family size of 2.77 persons per family. On the other hand, single male/father families (22 | 7.1%) represent the smallest median family size with 2.55 persons per family.
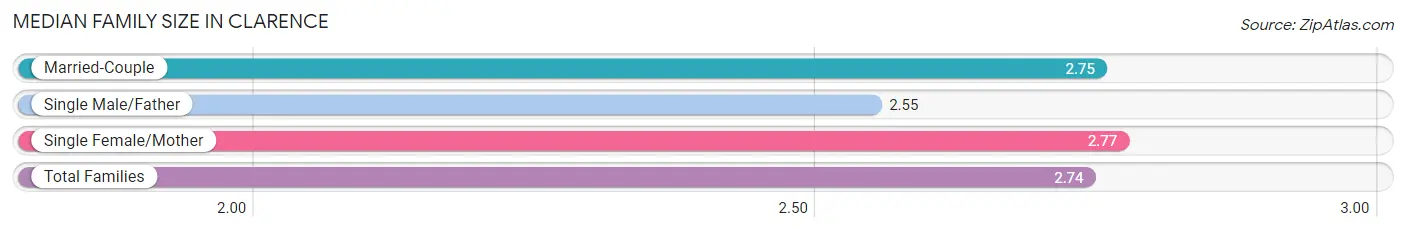
| Family Type | # Families | Family Size |
| Married-Couple | 222 (72.1%) | 2.75 |
| Single Male/Father | 22 (7.1%) | 2.55 |
| Single Female/Mother | 64 (20.8%) | 2.77 |
| Total Families | 308 (100.0%) | 2.74 |
Median Household Size in Clarence
The median household size in Clarence is 2.26 persons per household, with single female/mother households (64 | 13.3%) accounting for the largest median household size of 3.5 persons per household. non-family households (173 | 36.0%) represent the smallest median household size with 1.14 persons per household.
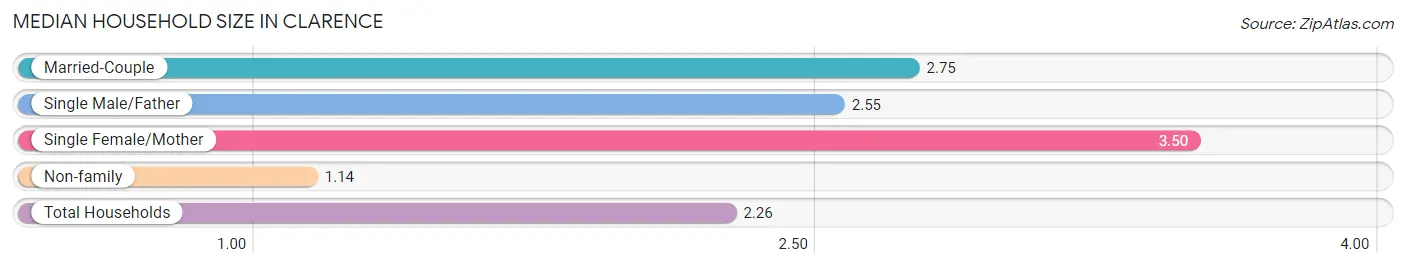
| Household Type | # Households | Household Size |
| Married-Couple | 222 (46.2%) | 2.75 |
| Single Male/Father | 22 (4.6%) | 2.55 |
| Single Female/Mother | 64 (13.3%) | 3.50 |
| Non-family | 173 (36.0%) | 1.14 |
| Total Households | 481 (100.0%) | 2.26 |
Household Size by Marriage Status in Clarence
Out of a total of 481 households in Clarence, 308 (64.0%) are family households, while 173 (36.0%) are nonfamily households. The most numerous type of family households are 2-person households, comprising 146, and the most common type of nonfamily households are 1-person households, comprising 152.
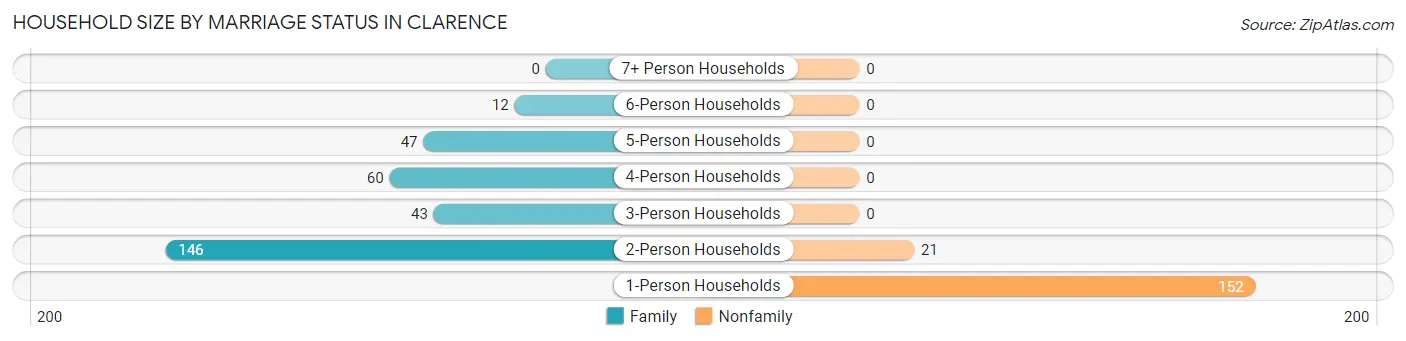
| Household Size | Family Households | Nonfamily Households |
| 1-Person Households | - | 152 (31.6%) |
| 2-Person Households | 146 (30.3%) | 21 (4.4%) |
| 3-Person Households | 43 (8.9%) | 0 (0.0%) |
| 4-Person Households | 60 (12.5%) | 0 (0.0%) |
| 5-Person Households | 47 (9.8%) | 0 (0.0%) |
| 6-Person Households | 12 (2.5%) | 0 (0.0%) |
| 7+ Person Households | 0 (0.0%) | 0 (0.0%) |
| Total | 308 (64.0%) | 173 (36.0%) |
Female Fertility in Clarence
Fertility by Age in Clarence
Average fertility rate in Clarence is 77.0 births per 1,000 women. Women in the age bracket of 20 to 34 years have the highest fertility rate with 223.0 births per 1,000 women. Women in the age bracket of 20 to 34 years acount for 100.0% of all women with births.
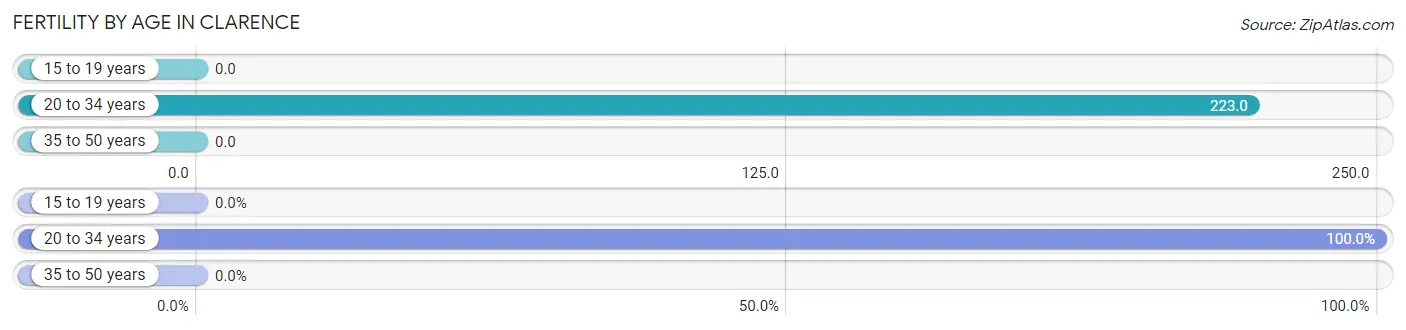
| Age Bracket | Women with Births | Births / 1,000 Women |
| 15 to 19 years | 0 (0.0%) | 0.0 |
| 20 to 34 years | 23 (100.0%) | 223.0 |
| 35 to 50 years | 0 (0.0%) | 0.0 |
| Total | 23 (100.0%) | 77.0 |
Fertility by Age by Marriage Status in Clarence
69.6% of women with births (23) in Clarence are married. The highest percentage of unmarried women with births falls into 20 to 34 years age bracket with 30.4% of them unmarried at the time of birth, while the lowest percentage of unmarried women with births belong to 20 to 34 years age bracket with 30.4% of them unmarried.
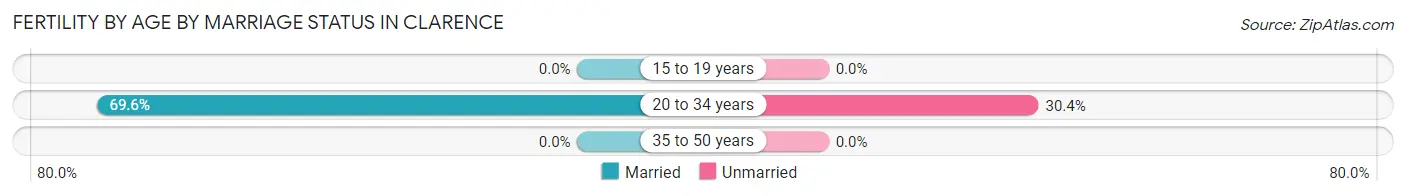
| Age Bracket | Married | Unmarried |
| 15 to 19 years | 0 (0.0%) | 0 (0.0%) |
| 20 to 34 years | 16 (69.6%) | 7 (30.4%) |
| 35 to 50 years | 0 (0.0%) | 0 (0.0%) |
| Total | 16 (69.6%) | 7 (30.4%) |
Fertility by Education in Clarence
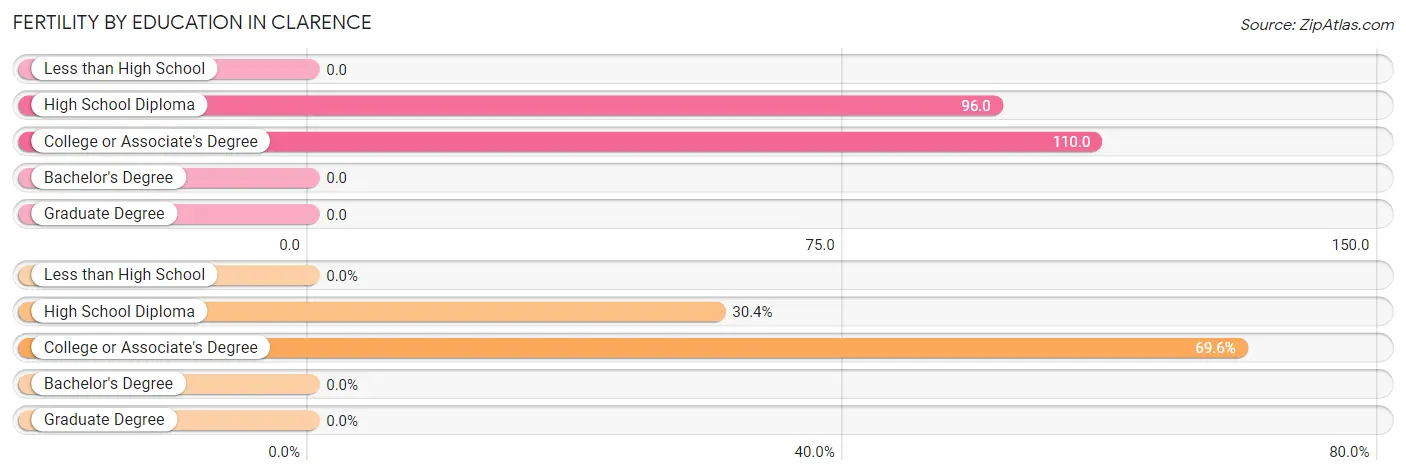
| Educational Attainment | Women with Births | Births / 1,000 Women |
| Less than High School | 0 (0.0%) | 0.0 |
| High School Diploma | 7 (30.4%) | 96.0 |
| College or Associate's Degree | 16 (69.6%) | 110.0 |
| Bachelor's Degree | 0 (0.0%) | 0.0 |
| Graduate Degree | 0 (0.0%) | 0.0 |
| Total | 23 (100.0%) | 77.0 |
Fertility by Education by Marriage Status in Clarence
30.4% of women with births in Clarence are unmarried. Women with the educational attainment of college or associate's degree are most likely to be married with 100.0% of them married at childbirth, while women with the educational attainment of high school diploma are least likely to be married with 100.0% of them unmarried at childbirth.
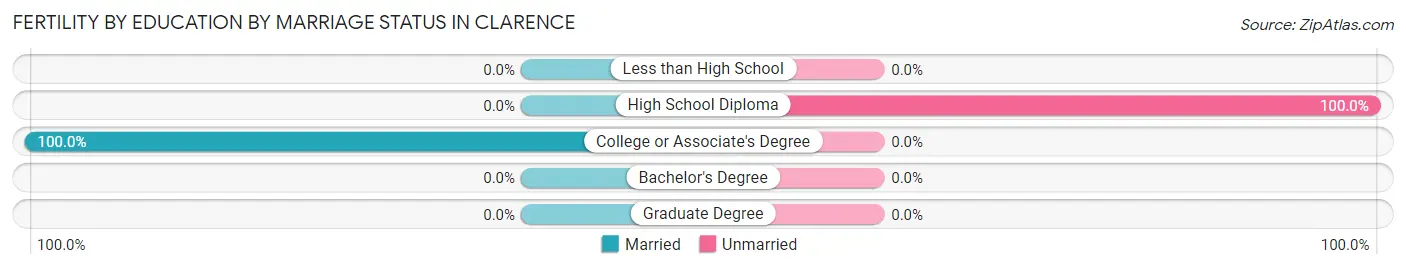
| Educational Attainment | Married | Unmarried |
| Less than High School | 0 (0.0%) | 0 (0.0%) |
| High School Diploma | 0 (0.0%) | 7 (100.0%) |
| College or Associate's Degree | 16 (100.0%) | 0 (0.0%) |
| Bachelor's Degree | 0 (0.0%) | 0 (0.0%) |
| Graduate Degree | 0 (0.0%) | 0 (0.0%) |
| Total | 16 (69.6%) | 7 (30.4%) |
Employment Characteristics in Clarence
Employment by Class of Employer in Clarence
Among the 523 employed individuals in Clarence, private company employees (357 | 68.3%), self-employed (not incorporated) (60 | 11.5%), and local government employees (43 | 8.2%) make up the most common classes of employment.
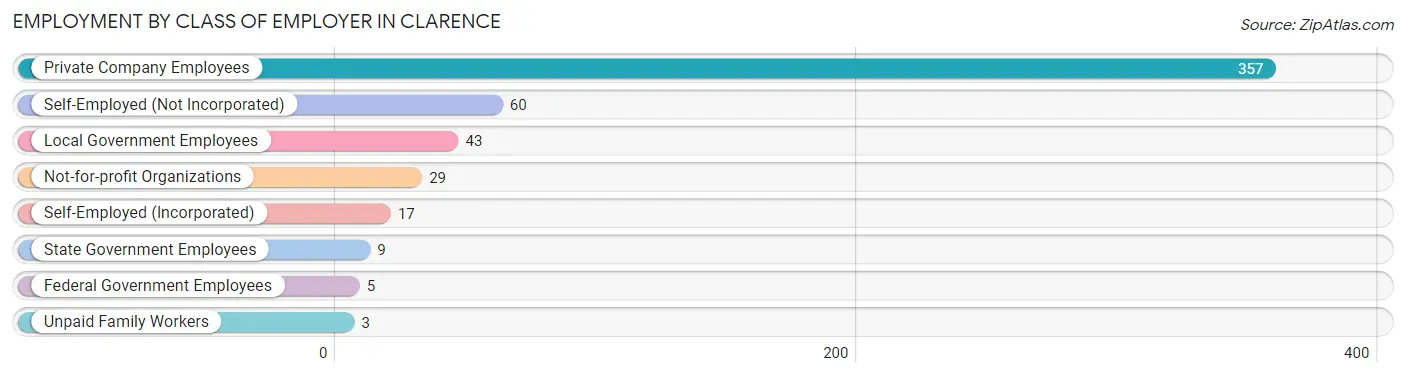
| Employer Class | # Employees | % Employees |
| Private Company Employees | 357 | 68.3% |
| Self-Employed (Incorporated) | 17 | 3.3% |
| Self-Employed (Not Incorporated) | 60 | 11.5% |
| Not-for-profit Organizations | 29 | 5.5% |
| Local Government Employees | 43 | 8.2% |
| State Government Employees | 9 | 1.7% |
| Federal Government Employees | 5 | 1.0% |
| Unpaid Family Workers | 3 | 0.6% |
| Total | 523 | 100.0% |
Employment Status by Age in Clarence
According to the labor force statistics for Clarence, out of the total population over 16 years of age (943), 56.1% or 529 individuals are in the labor force, with 1.1% or 6 of them unemployed. The age group with the highest labor force participation rate is 45 to 54 years, with 100.0% or 164 individuals in the labor force. Within the labor force, the 45 to 54 years age range has the highest percentage of unemployed individuals, with 3.7% or 6 of them being unemployed.
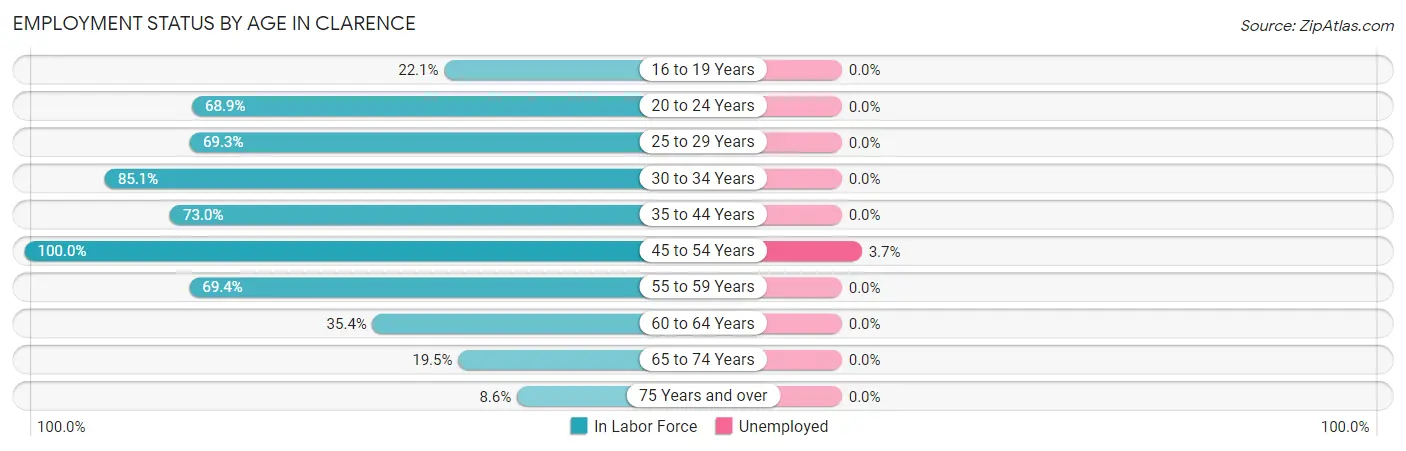
| Age Bracket | In Labor Force | Unemployed |
| 16 to 19 Years | 17 (22.1%) | 0 (0.0%) |
| 20 to 24 Years | 31 (68.9%) | 0 (0.0%) |
| 25 to 29 Years | 61 (69.3%) | 0 (0.0%) |
| 30 to 34 Years | 63 (85.1%) | 0 (0.0%) |
| 35 to 44 Years | 65 (73.0%) | 0 (0.0%) |
| 45 to 54 Years | 164 (100.0%) | 6 (3.7%) |
| 55 to 59 Years | 68 (69.4%) | 0 (0.0%) |
| 60 to 64 Years | 28 (35.4%) | 0 (0.0%) |
| 65 to 74 Years | 22 (19.5%) | 0 (0.0%) |
| 75 Years and over | 10 (8.6%) | 0 (0.0%) |
| Total | 529 (56.1%) | 6 (1.1%) |
Employment Status by Educational Attainment in Clarence
According to labor force statistics for Clarence, 75.8% of individuals (449) out of the total population between 25 and 64 years of age (592) are in the labor force, with 1.3% or 6 of them being unemployed. The group with the highest labor force participation rate are those with the educational attainment of bachelor's degree or higher, with 84.6% or 66 individuals in the labor force. Within the labor force, individuals with high school diploma education have the highest percentage of unemployment, with 4.5% or 6 of them being unemployed.
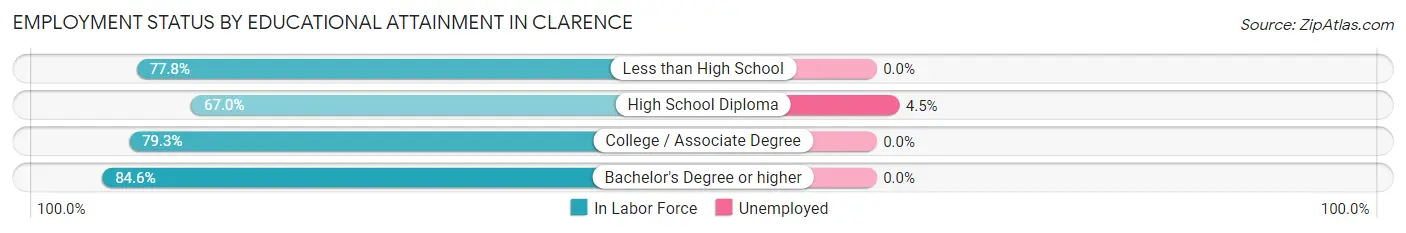
| Educational Attainment | In Labor Force | Unemployed |
| Less than High School | 14 (77.8%) | 0 (0.0%) |
| High School Diploma | 132 (67.0%) | 9 (4.5%) |
| College / Associate Degree | 237 (79.3%) | 0 (0.0%) |
| Bachelor's Degree or higher | 66 (84.6%) | 0 (0.0%) |
| Total | 449 (75.8%) | 8 (1.3%) |
Employment Occupations by Sex in Clarence
Management, Business, Science and Arts Occupations
The most common Management, Business, Science and Arts occupations in Clarence are Management (50 | 9.6%), Computers, Engineering & Science (32 | 6.1%), Architecture & Engineering (18 | 3.4%), Community & Social Service (14 | 2.7%), and Business & Financial (11 | 2.1%).
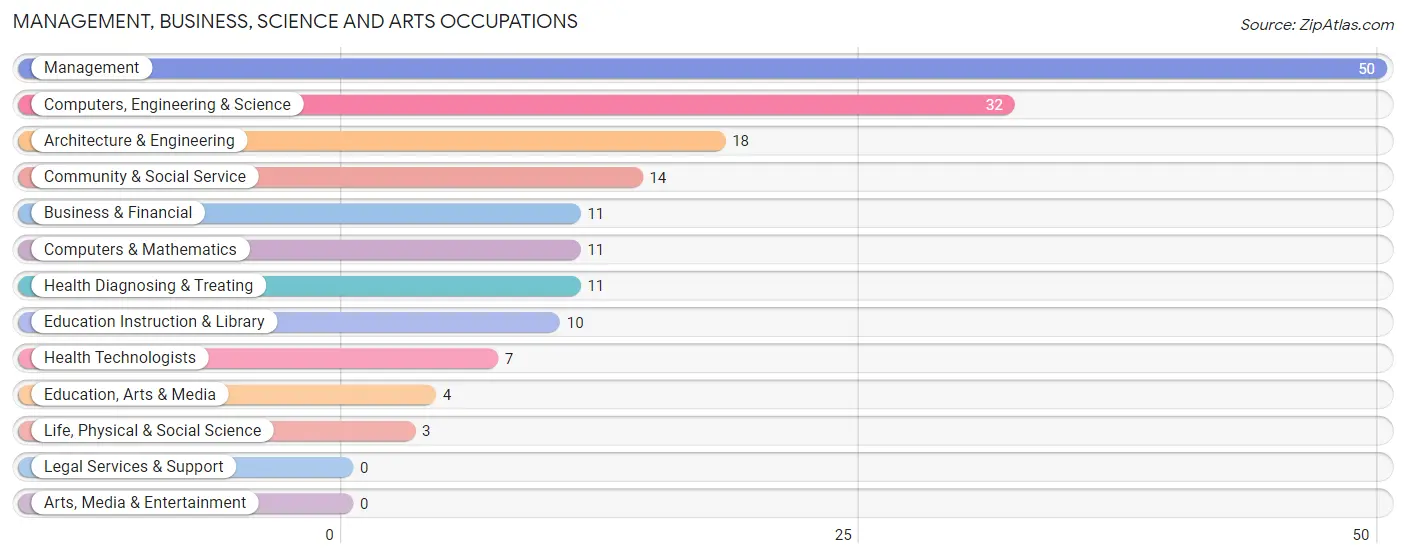
Management, Business, Science and Arts Occupations by Sex
Within the Management, Business, Science and Arts occupations in Clarence, the most male-oriented occupations are Computers & Mathematics (100.0%), Management (64.0%), and Computers, Engineering & Science (62.5%), while the most female-oriented occupations are Business & Financial (100.0%), Life, Physical & Social Science (100.0%), and Education, Arts & Media (100.0%).
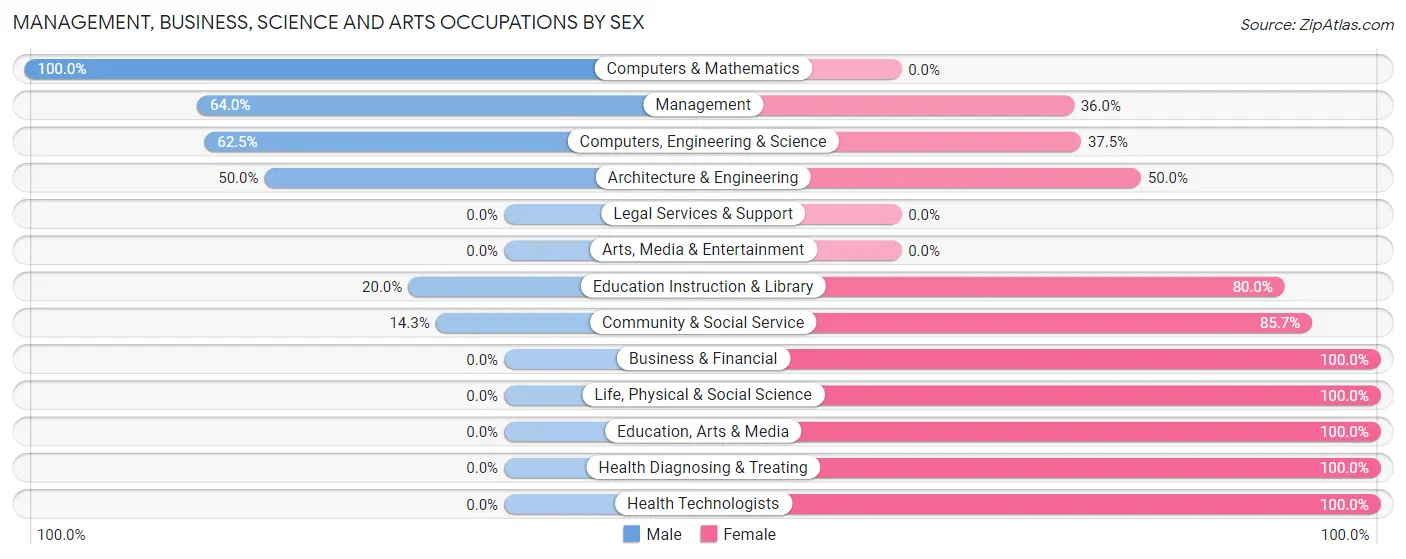
| Occupation | Male | Female |
| Management | 32 (64.0%) | 18 (36.0%) |
| Business & Financial | 0 (0.0%) | 11 (100.0%) |
| Computers, Engineering & Science | 20 (62.5%) | 12 (37.5%) |
| Computers & Mathematics | 11 (100.0%) | 0 (0.0%) |
| Architecture & Engineering | 9 (50.0%) | 9 (50.0%) |
| Life, Physical & Social Science | 0 (0.0%) | 3 (100.0%) |
| Community & Social Service | 2 (14.3%) | 12 (85.7%) |
| Education, Arts & Media | 0 (0.0%) | 4 (100.0%) |
| Legal Services & Support | 0 (0.0%) | 0 (0.0%) |
| Education Instruction & Library | 2 (20.0%) | 8 (80.0%) |
| Arts, Media & Entertainment | 0 (0.0%) | 0 (0.0%) |
| Health Diagnosing & Treating | 0 (0.0%) | 11 (100.0%) |
| Health Technologists | 0 (0.0%) | 7 (100.0%) |
| Total (Category) | 54 (45.8%) | 64 (54.2%) |
| Total (Overall) | 248 (47.4%) | 275 (52.6%) |
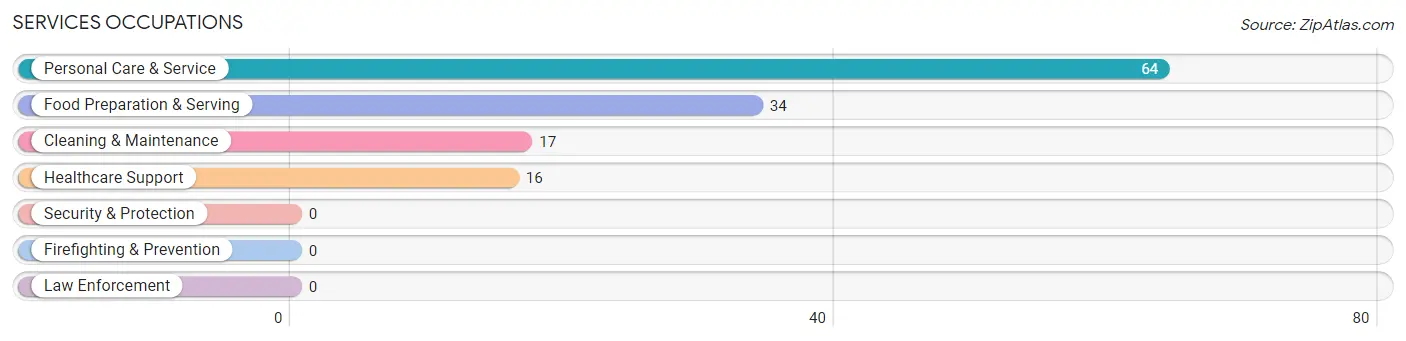
Services Occupations
The most common Services occupations in Clarence are Personal Care & Service (64 | 12.2%), Food Preparation & Serving (34 | 6.5%), Cleaning & Maintenance (17 | 3.3%), and Healthcare Support (16 | 3.1%).
Services Occupations by Sex
Within the Services occupations in Clarence, the most male-oriented occupations are Cleaning & Maintenance (82.4%), Food Preparation & Serving (17.6%), and Personal Care & Service (7.8%), while the most female-oriented occupations are Healthcare Support (100.0%), Personal Care & Service (92.2%), and Food Preparation & Serving (82.4%).
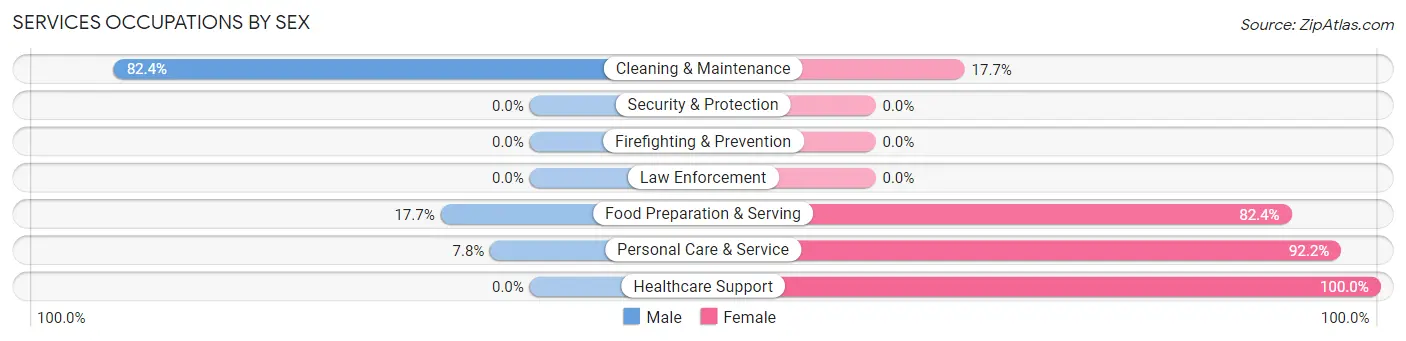
| Occupation | Male | Female |
| Healthcare Support | 0 (0.0%) | 16 (100.0%) |
| Security & Protection | 0 (0.0%) | 0 (0.0%) |
| Firefighting & Prevention | 0 (0.0%) | 0 (0.0%) |
| Law Enforcement | 0 (0.0%) | 0 (0.0%) |
| Food Preparation & Serving | 6 (17.6%) | 28 (82.4%) |
| Cleaning & Maintenance | 14 (82.4%) | 3 (17.6%) |
| Personal Care & Service | 5 (7.8%) | 59 (92.2%) |
| Total (Category) | 25 (19.1%) | 106 (80.9%) |
| Total (Overall) | 248 (47.4%) | 275 (52.6%) |
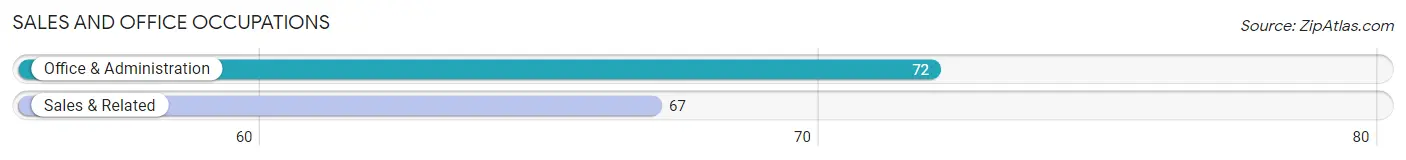
Sales and Office Occupations
The most common Sales and Office occupations in Clarence are Office & Administration (72 | 13.8%), and Sales & Related (67 | 12.8%).
Sales and Office Occupations by Sex
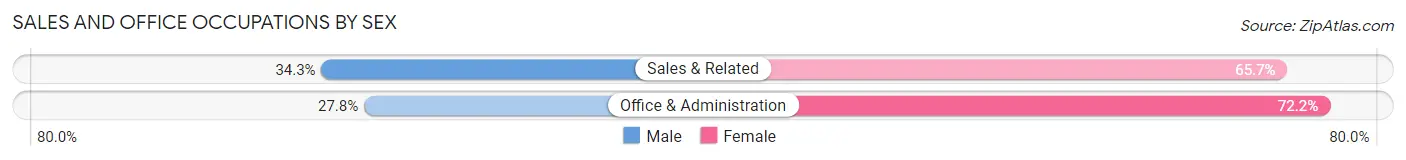
| Occupation | Male | Female |
| Sales & Related | 23 (34.3%) | 44 (65.7%) |
| Office & Administration | 20 (27.8%) | 52 (72.2%) |
| Total (Category) | 43 (30.9%) | 96 (69.1%) |
| Total (Overall) | 248 (47.4%) | 275 (52.6%) |
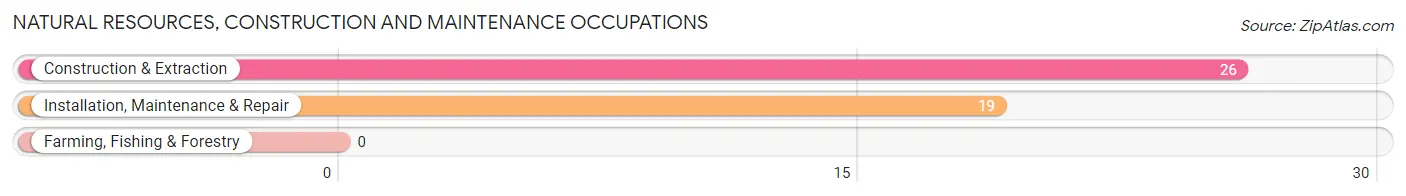
Natural Resources, Construction and Maintenance Occupations
The most common Natural Resources, Construction and Maintenance occupations in Clarence are Construction & Extraction (26 | 5.0%), and Installation, Maintenance & Repair (19 | 3.6%).
Natural Resources, Construction and Maintenance Occupations by Sex
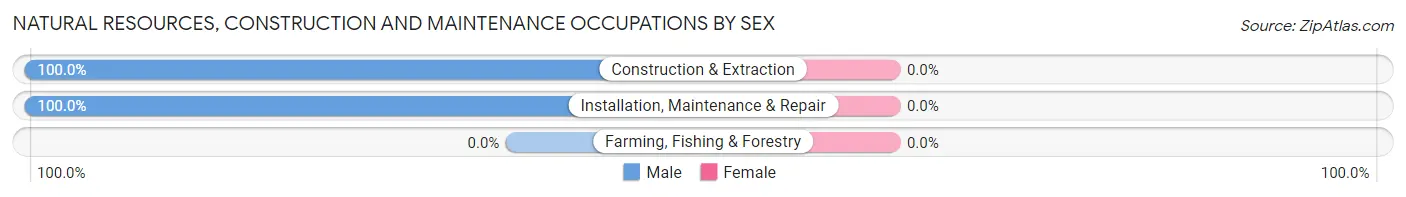
| Occupation | Male | Female |
| Farming, Fishing & Forestry | 0 (0.0%) | 0 (0.0%) |
| Construction & Extraction | 26 (100.0%) | 0 (0.0%) |
| Installation, Maintenance & Repair | 19 (100.0%) | 0 (0.0%) |
| Total (Category) | 45 (100.0%) | 0 (0.0%) |
| Total (Overall) | 248 (47.4%) | 275 (52.6%) |
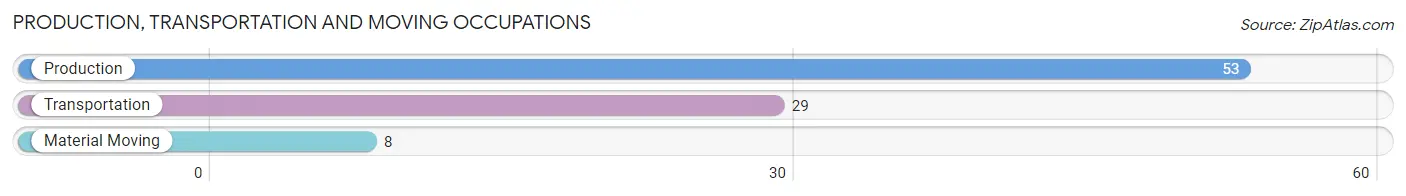
Production, Transportation and Moving Occupations
The most common Production, Transportation and Moving occupations in Clarence are Production (53 | 10.1%), Transportation (29 | 5.5%), and Material Moving (8 | 1.5%).
Production, Transportation and Moving Occupations by Sex
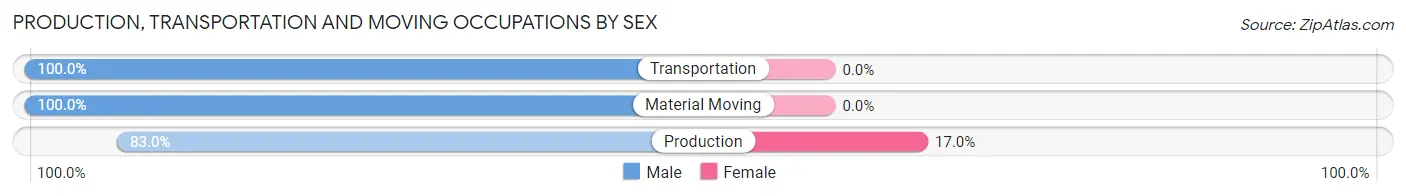
| Occupation | Male | Female |
| Production | 44 (83.0%) | 9 (17.0%) |
| Transportation | 29 (100.0%) | 0 (0.0%) |
| Material Moving | 8 (100.0%) | 0 (0.0%) |
| Total (Category) | 81 (90.0%) | 9 (10.0%) |
| Total (Overall) | 248 (47.4%) | 275 (52.6%) |
Employment Industries by Sex in Clarence
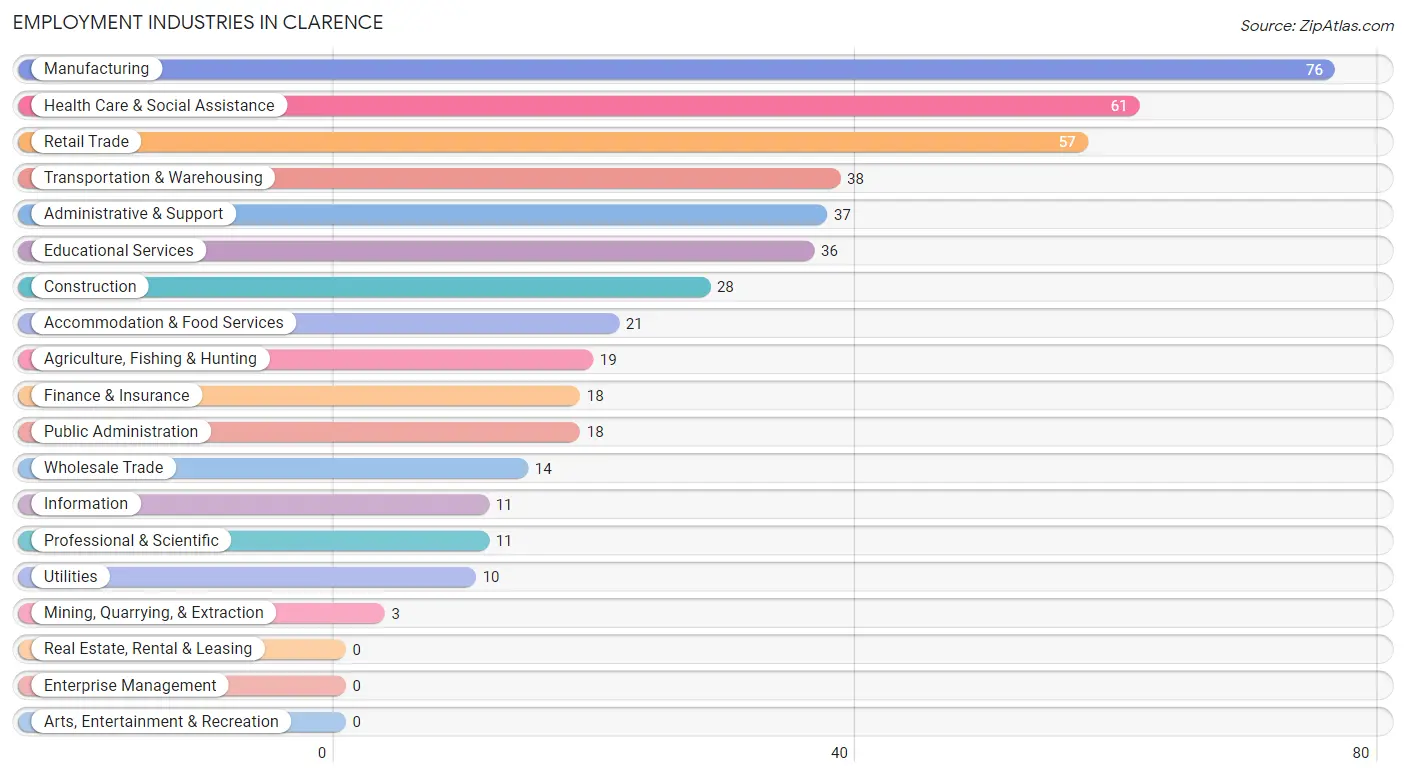
Employment Industries in Clarence
The major employment industries in Clarence include Manufacturing (76 | 14.5%), Health Care & Social Assistance (61 | 11.7%), Retail Trade (57 | 10.9%), Transportation & Warehousing (38 | 7.3%), and Administrative & Support (37 | 7.1%).
Employment Industries by Sex in Clarence
The Clarence industries that see more men than women are Mining, Quarrying, & Extraction (100.0%), Utilities (100.0%), and Information (100.0%), whereas the industries that tend to have a higher number of women are Wholesale Trade (100.0%), Finance & Insurance (100.0%), and Educational Services (86.1%).
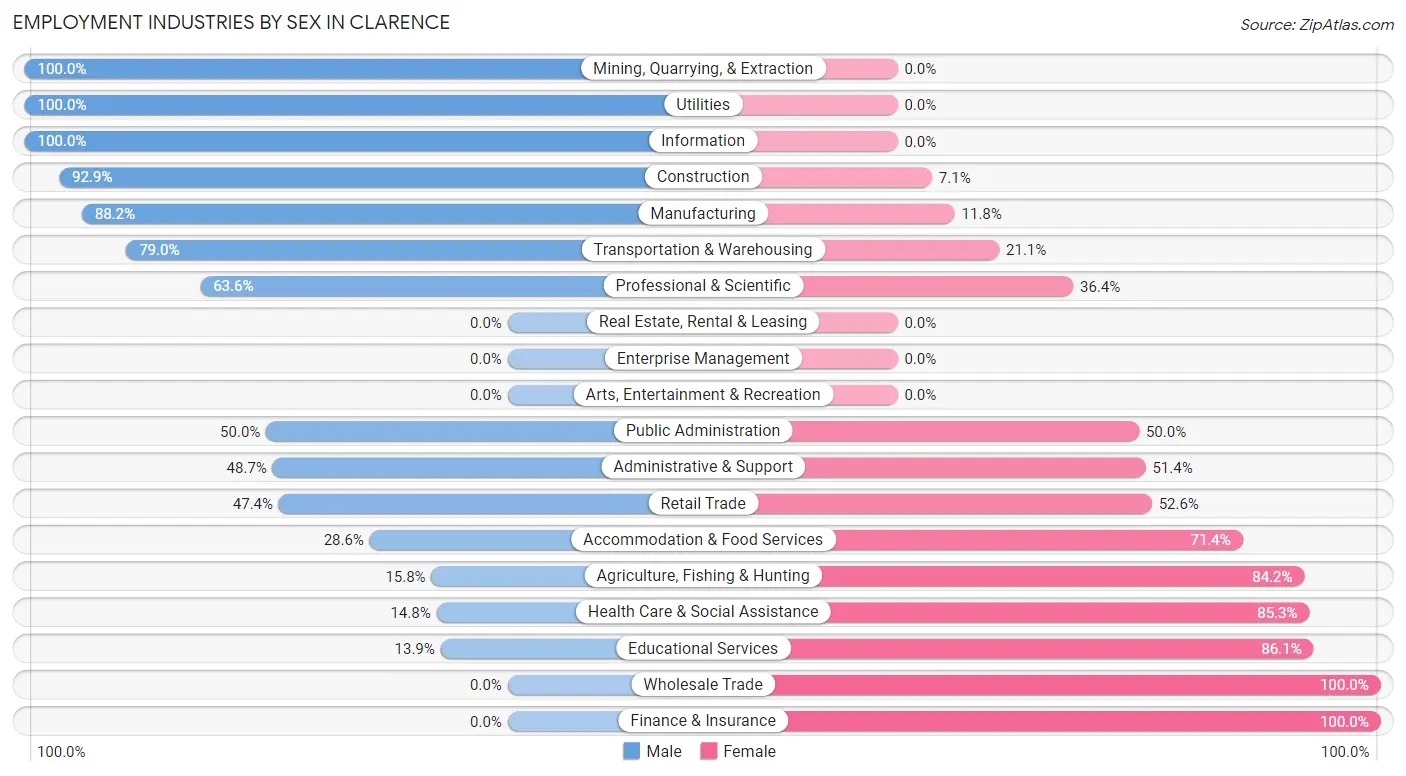
| Industry | Male | Female |
| Agriculture, Fishing & Hunting | 3 (15.8%) | 16 (84.2%) |
| Mining, Quarrying, & Extraction | 3 (100.0%) | 0 (0.0%) |
| Construction | 26 (92.9%) | 2 (7.1%) |
| Manufacturing | 67 (88.2%) | 9 (11.8%) |
| Wholesale Trade | 0 (0.0%) | 14 (100.0%) |
| Retail Trade | 27 (47.4%) | 30 (52.6%) |
| Transportation & Warehousing | 30 (78.9%) | 8 (21.0%) |
| Utilities | 10 (100.0%) | 0 (0.0%) |
| Information | 11 (100.0%) | 0 (0.0%) |
| Finance & Insurance | 0 (0.0%) | 18 (100.0%) |
| Real Estate, Rental & Leasing | 0 (0.0%) | 0 (0.0%) |
| Professional & Scientific | 7 (63.6%) | 4 (36.4%) |
| Enterprise Management | 0 (0.0%) | 0 (0.0%) |
| Administrative & Support | 18 (48.6%) | 19 (51.3%) |
| Educational Services | 5 (13.9%) | 31 (86.1%) |
| Health Care & Social Assistance | 9 (14.7%) | 52 (85.3%) |
| Arts, Entertainment & Recreation | 0 (0.0%) | 0 (0.0%) |
| Accommodation & Food Services | 6 (28.6%) | 15 (71.4%) |
| Public Administration | 9 (50.0%) | 9 (50.0%) |
| Total | 248 (47.4%) | 275 (52.6%) |
Education in Clarence
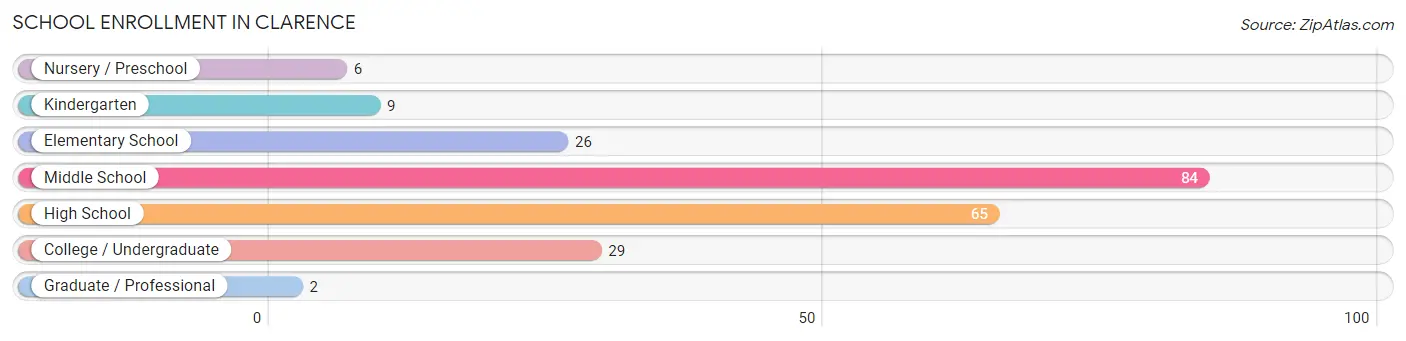
School Enrollment in Clarence
The most common levels of schooling among the 221 students in Clarence are middle school (84 | 38.0%), high school (65 | 29.4%), and college / undergraduate (29 | 13.1%).
| School Level | # Students | % Students |
| Nursery / Preschool | 6 | 2.7% |
| Kindergarten | 9 | 4.1% |
| Elementary School | 26 | 11.8% |
| Middle School | 84 | 38.0% |
| High School | 65 | 29.4% |
| College / Undergraduate | 29 | 13.1% |
| Graduate / Professional | 2 | 0.9% |
| Total | 221 | 100.0% |
School Enrollment by Age by Funding Source in Clarence
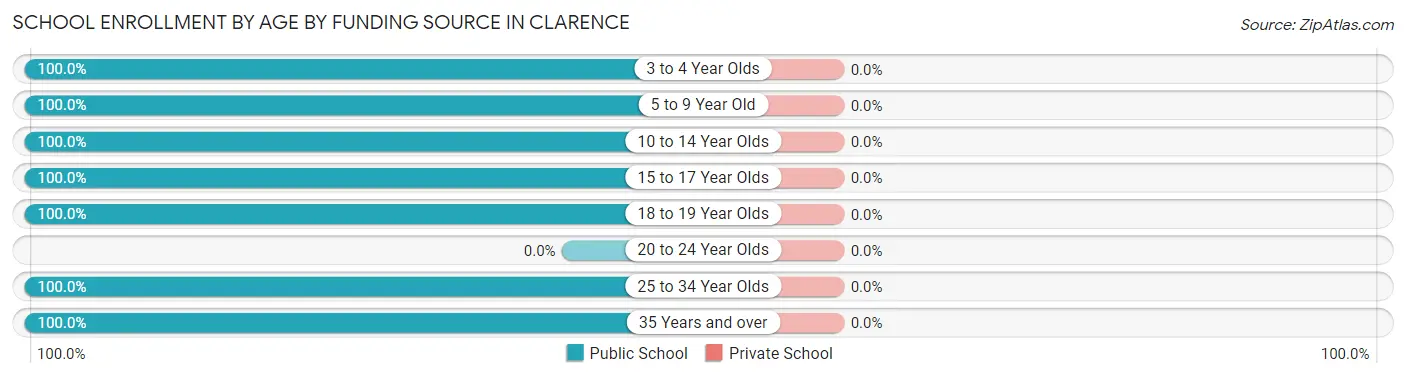
| Age Bracket | Public School | Private School |
| 3 to 4 Year Olds | 3 (100.0%) | 0 (0.0%) |
| 5 to 9 Year Old | 38 (100.0%) | 0 (0.0%) |
| 10 to 14 Year Olds | 84 (100.0%) | 0 (0.0%) |
| 15 to 17 Year Olds | 65 (100.0%) | 0 (0.0%) |
| 18 to 19 Year Olds | 7 (100.0%) | 0 (0.0%) |
| 20 to 24 Year Olds | 0 (0.0%) | 0 (0.0%) |
| 25 to 34 Year Olds | 12 (100.0%) | 0 (0.0%) |
| 35 Years and over | 12 (100.0%) | 0 (0.0%) |
| Total | 221 (100.0%) | 0 (0.0%) |
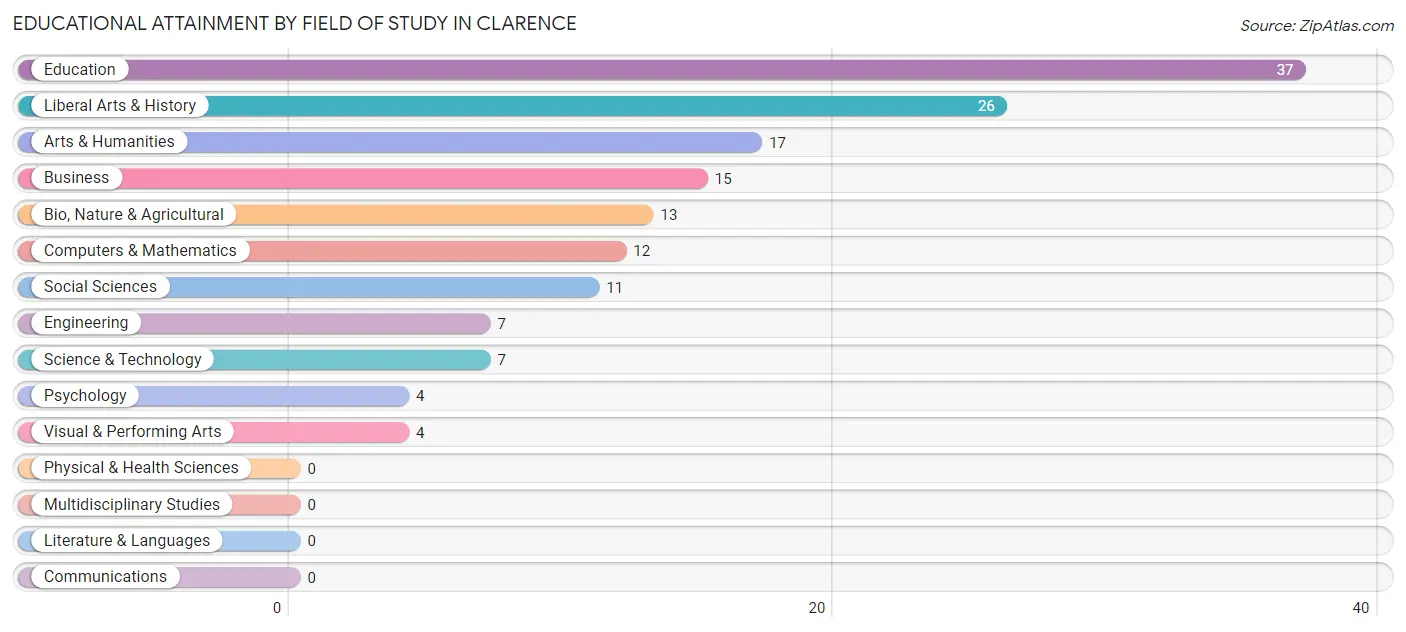
Educational Attainment by Field of Study in Clarence
Education (37 | 24.2%), liberal arts & history (26 | 17.0%), arts & humanities (17 | 11.1%), business (15 | 9.8%), and bio, nature & agricultural (13 | 8.5%) are the most common fields of study among 153 individuals in Clarence who have obtained a bachelor's degree or higher.
| Field of Study | # Graduates | % Graduates |
| Computers & Mathematics | 12 | 7.8% |
| Bio, Nature & Agricultural | 13 | 8.5% |
| Physical & Health Sciences | 0 | 0.0% |
| Psychology | 4 | 2.6% |
| Social Sciences | 11 | 7.2% |
| Engineering | 7 | 4.6% |
| Multidisciplinary Studies | 0 | 0.0% |
| Science & Technology | 7 | 4.6% |
| Business | 15 | 9.8% |
| Education | 37 | 24.2% |
| Literature & Languages | 0 | 0.0% |
| Liberal Arts & History | 26 | 17.0% |
| Visual & Performing Arts | 4 | 2.6% |
| Communications | 0 | 0.0% |
| Arts & Humanities | 17 | 11.1% |
| Total | 153 | 100.0% |
Transportation & Commute in Clarence
Vehicle Availability by Sex in Clarence
The most prevalent vehicle ownership categories in Clarence are males with 2 vehicles (128, accounting for 51.6%) and females with 2 vehicles (87, making up 46.6%).
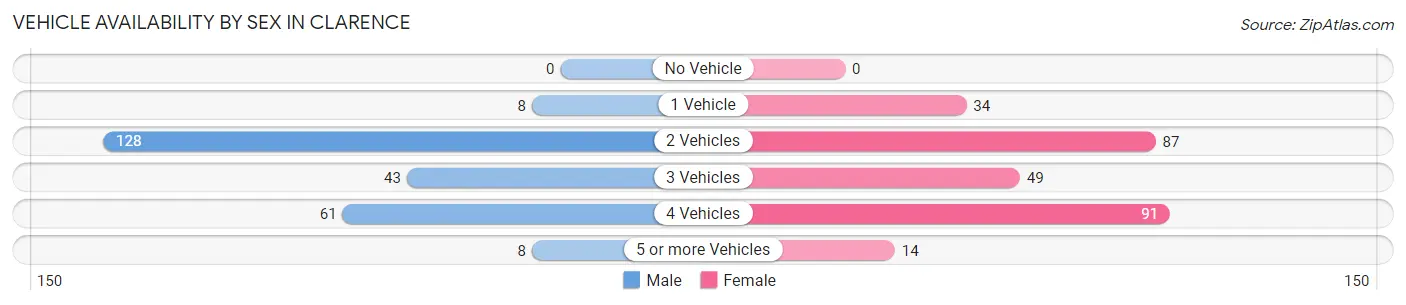
| Vehicles Available | Male | Female |
| No Vehicle | 0 (0.0%) | 0 (0.0%) |
| 1 Vehicle | 8 (3.2%) | 34 (12.4%) |
| 2 Vehicles | 128 (51.6%) | 87 (31.6%) |
| 3 Vehicles | 43 (17.3%) | 49 (17.8%) |
| 4 Vehicles | 61 (24.6%) | 91 (33.1%) |
| 5 or more Vehicles | 8 (3.2%) | 14 (5.1%) |
| Total | 248 (100.0%) | 275 (100.0%) |
Commute Time in Clarence
The most frequently occuring commute durations in Clarence are less than 5 minutes (91 commuters, 17.9%), 45 to 59 minutes (90 commuters, 17.7%), and 5 to 9 minutes (89 commuters, 17.5%).
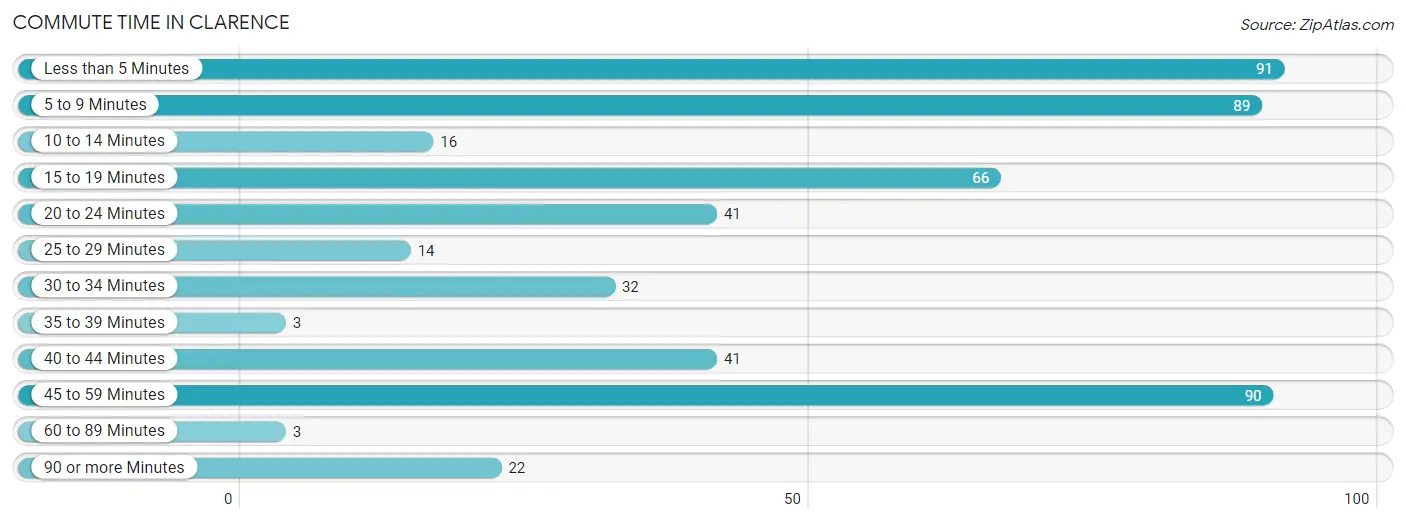
| Commute Time | # Commuters | % Commuters |
| Less than 5 Minutes | 91 | 17.9% |
| 5 to 9 Minutes | 89 | 17.5% |
| 10 to 14 Minutes | 16 | 3.2% |
| 15 to 19 Minutes | 66 | 13.0% |
| 20 to 24 Minutes | 41 | 8.1% |
| 25 to 29 Minutes | 14 | 2.8% |
| 30 to 34 Minutes | 32 | 6.3% |
| 35 to 39 Minutes | 3 | 0.6% |
| 40 to 44 Minutes | 41 | 8.1% |
| 45 to 59 Minutes | 90 | 17.7% |
| 60 to 89 Minutes | 3 | 0.6% |
| 90 or more Minutes | 22 | 4.3% |
Commute Time by Sex in Clarence
The most common commute times in Clarence are 5 to 9 minutes (56 commuters, 23.1%) for males and less than 5 minutes (72 commuters, 27.1%) for females.
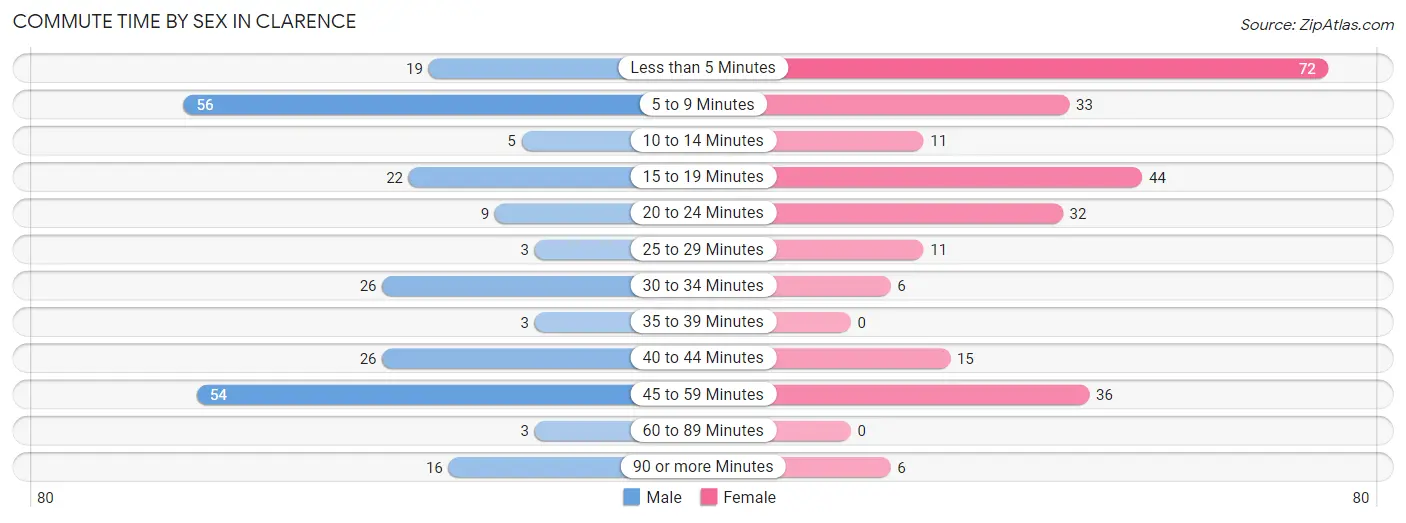
| Commute Time | Male | Female |
| Less than 5 Minutes | 19 (7.9%) | 72 (27.1%) |
| 5 to 9 Minutes | 56 (23.1%) | 33 (12.4%) |
| 10 to 14 Minutes | 5 (2.1%) | 11 (4.1%) |
| 15 to 19 Minutes | 22 (9.1%) | 44 (16.5%) |
| 20 to 24 Minutes | 9 (3.7%) | 32 (12.0%) |
| 25 to 29 Minutes | 3 (1.2%) | 11 (4.1%) |
| 30 to 34 Minutes | 26 (10.7%) | 6 (2.3%) |
| 35 to 39 Minutes | 3 (1.2%) | 0 (0.0%) |
| 40 to 44 Minutes | 26 (10.7%) | 15 (5.6%) |
| 45 to 59 Minutes | 54 (22.3%) | 36 (13.5%) |
| 60 to 89 Minutes | 3 (1.2%) | 0 (0.0%) |
| 90 or more Minutes | 16 (6.6%) | 6 (2.3%) |
Time of Departure to Work by Sex in Clarence
The most frequent times of departure to work in Clarence are 6:30 AM to 6:59 AM (36, 14.9%) for males and 9:00 AM to 9:59 AM (40, 15.0%) for females.
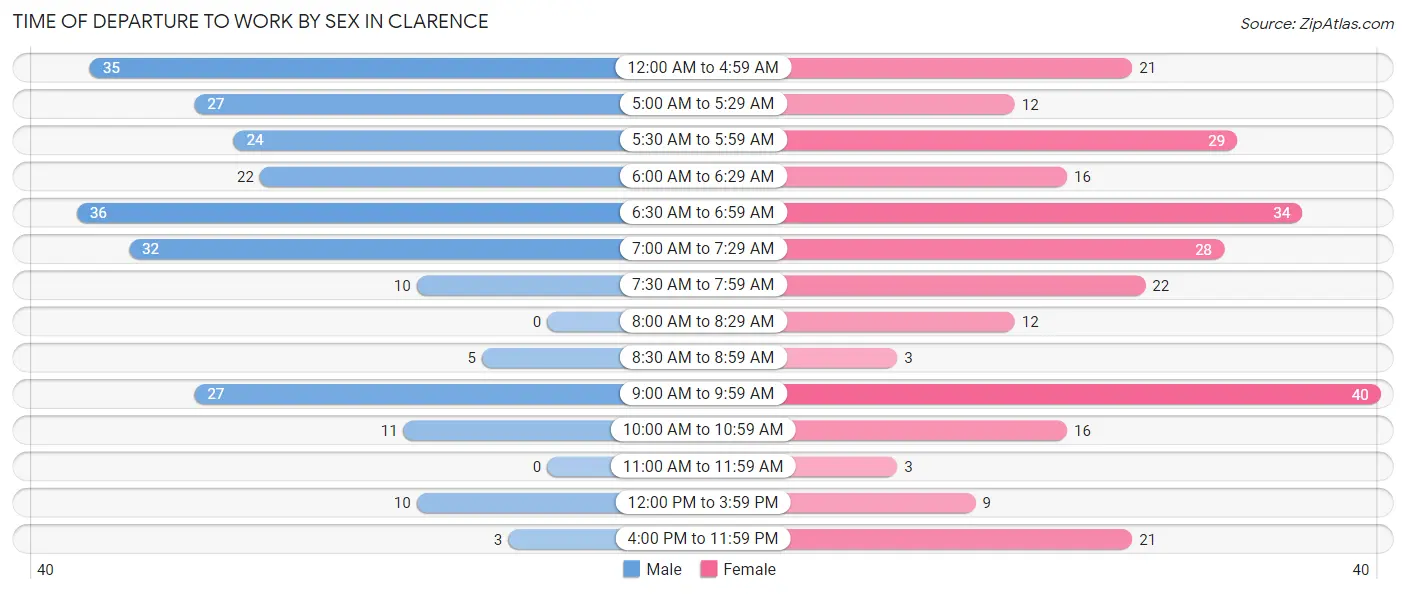
| Time of Departure | Male | Female |
| 12:00 AM to 4:59 AM | 35 (14.5%) | 21 (7.9%) |
| 5:00 AM to 5:29 AM | 27 (11.2%) | 12 (4.5%) |
| 5:30 AM to 5:59 AM | 24 (9.9%) | 29 (10.9%) |
| 6:00 AM to 6:29 AM | 22 (9.1%) | 16 (6.0%) |
| 6:30 AM to 6:59 AM | 36 (14.9%) | 34 (12.8%) |
| 7:00 AM to 7:29 AM | 32 (13.2%) | 28 (10.5%) |
| 7:30 AM to 7:59 AM | 10 (4.1%) | 22 (8.3%) |
| 8:00 AM to 8:29 AM | 0 (0.0%) | 12 (4.5%) |
| 8:30 AM to 8:59 AM | 5 (2.1%) | 3 (1.1%) |
| 9:00 AM to 9:59 AM | 27 (11.2%) | 40 (15.0%) |
| 10:00 AM to 10:59 AM | 11 (4.5%) | 16 (6.0%) |
| 11:00 AM to 11:59 AM | 0 (0.0%) | 3 (1.1%) |
| 12:00 PM to 3:59 PM | 10 (4.1%) | 9 (3.4%) |
| 4:00 PM to 11:59 PM | 3 (1.2%) | 21 (7.9%) |
| Total | 242 (100.0%) | 266 (100.0%) |
Housing Occupancy in Clarence
Occupancy by Ownership in Clarence
Of the total 481 dwellings in Clarence, owner-occupied units account for 326 (67.8%), while renter-occupied units make up 155 (32.2%).
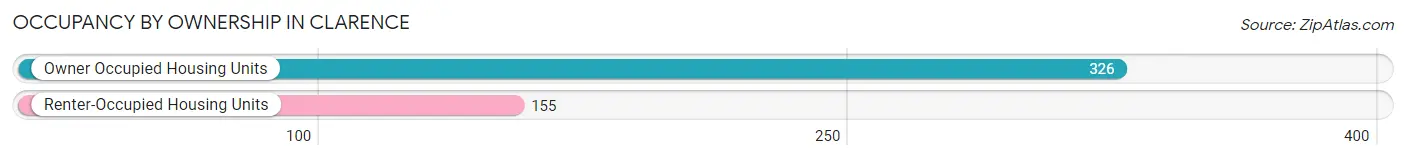
| Occupancy | # Housing Units | % Housing Units |
| Owner Occupied Housing Units | 326 | 67.8% |
| Renter-Occupied Housing Units | 155 | 32.2% |
| Total Occupied Housing Units | 481 | 100.0% |
Occupancy by Household Size in Clarence
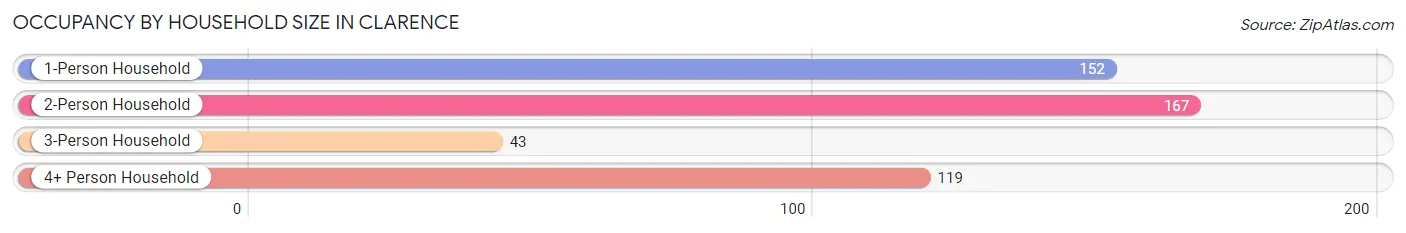
| Household Size | # Housing Units | % Housing Units |
| 1-Person Household | 152 | 31.6% |
| 2-Person Household | 167 | 34.7% |
| 3-Person Household | 43 | 8.9% |
| 4+ Person Household | 119 | 24.7% |
| Total Housing Units | 481 | 100.0% |
Occupancy by Ownership by Household Size in Clarence
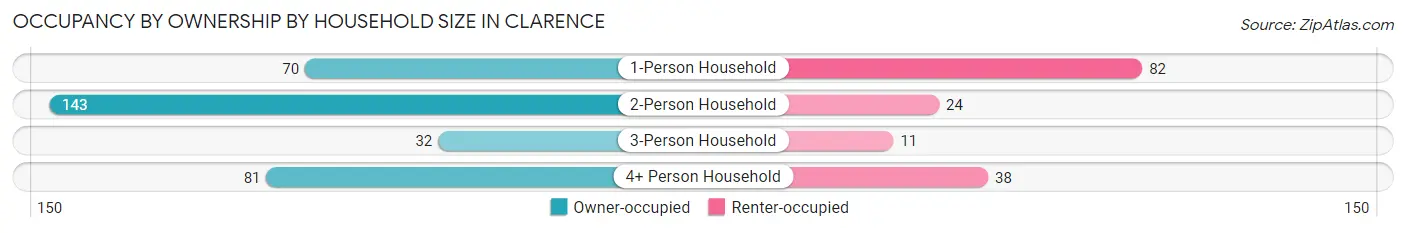
| Household Size | Owner-occupied | Renter-occupied |
| 1-Person Household | 70 (46.1%) | 82 (53.9%) |
| 2-Person Household | 143 (85.6%) | 24 (14.4%) |
| 3-Person Household | 32 (74.4%) | 11 (25.6%) |
| 4+ Person Household | 81 (68.1%) | 38 (31.9%) |
| Total Housing Units | 326 (67.8%) | 155 (32.2%) |
Occupancy by Educational Attainment in Clarence
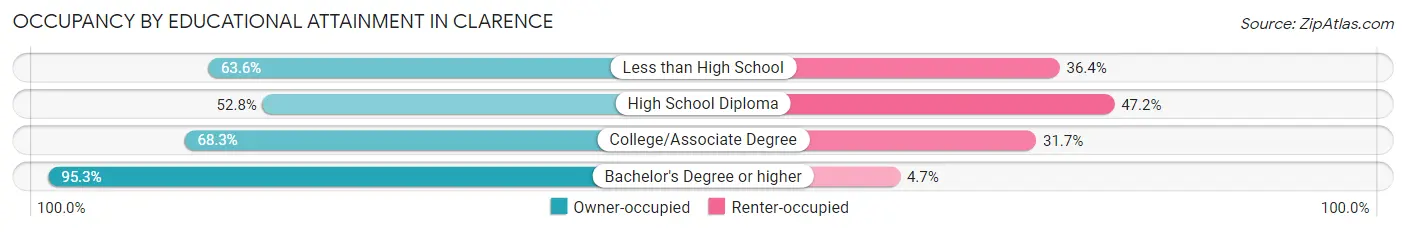
| Household Size | Owner-occupied | Renter-occupied |
| Less than High School | 7 (63.6%) | 4 (36.4%) |
| High School Diploma | 85 (52.8%) | 76 (47.2%) |
| College/Associate Degree | 153 (68.3%) | 71 (31.7%) |
| Bachelor's Degree or higher | 81 (95.3%) | 4 (4.7%) |
Occupancy by Age of Householder in Clarence
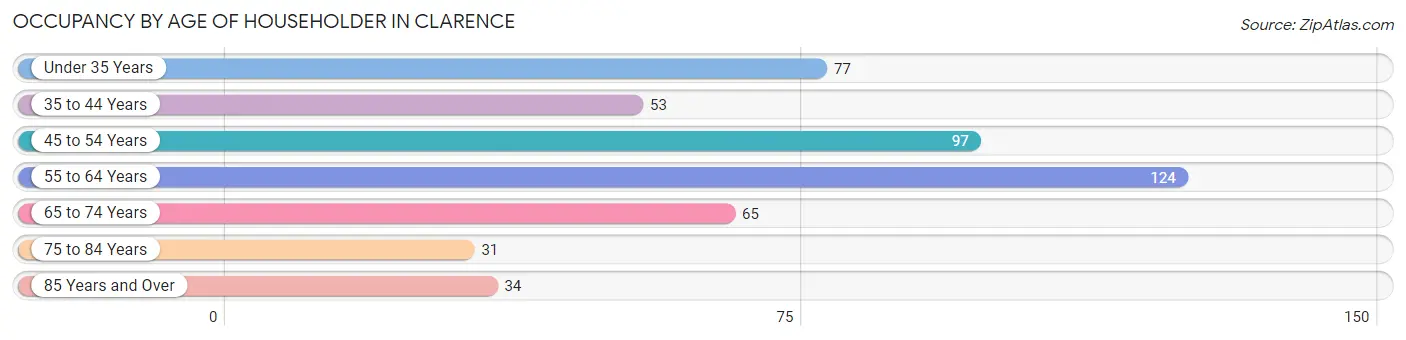
| Age Bracket | # Households | % Households |
| Under 35 Years | 77 | 16.0% |
| 35 to 44 Years | 53 | 11.0% |
| 45 to 54 Years | 97 | 20.2% |
| 55 to 64 Years | 124 | 25.8% |
| 65 to 74 Years | 65 | 13.5% |
| 75 to 84 Years | 31 | 6.4% |
| 85 Years and Over | 34 | 7.1% |
| Total | 481 | 100.0% |
Housing Finances in Clarence
Median Income by Occupancy in Clarence
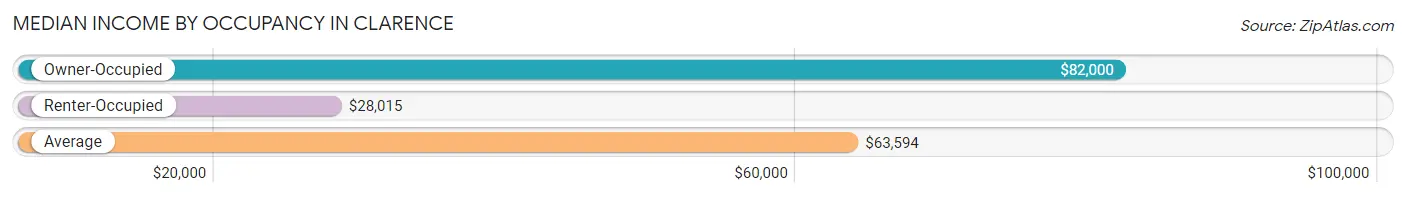
| Occupancy Type | # Households | Median Income |
| Owner-Occupied | 326 (67.8%) | $82,000 |
| Renter-Occupied | 155 (32.2%) | $28,015 |
| Average | 481 (100.0%) | $63,594 |
Occupancy by Householder Income Bracket in Clarence
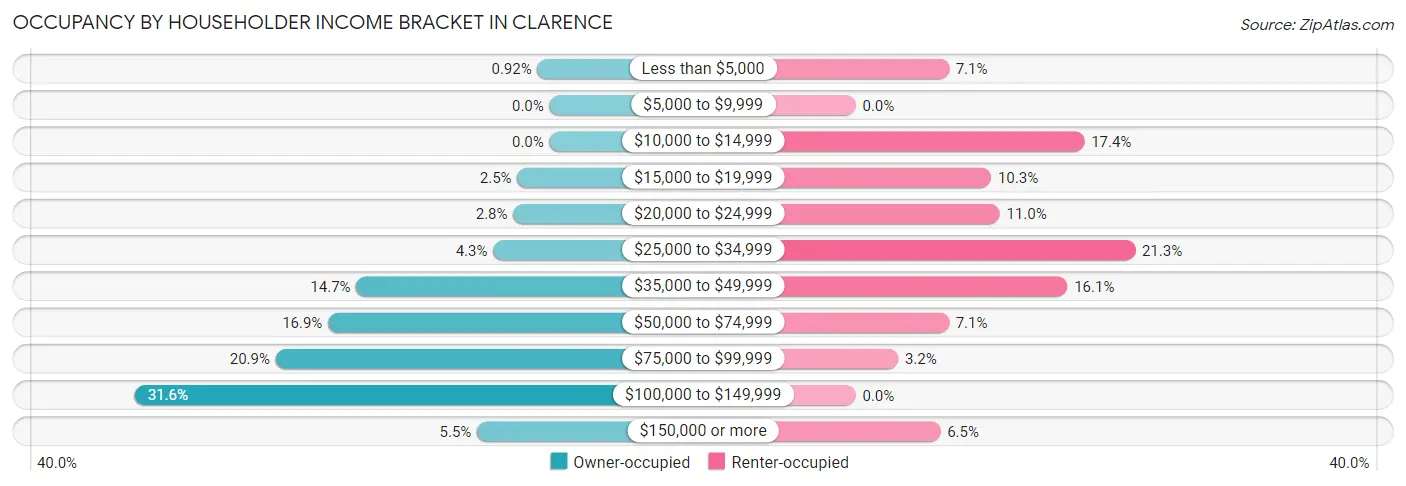
| Income Bracket | Owner-occupied | Renter-occupied |
| Less than $5,000 | 3 (0.9%) | 11 (7.1%) |
| $5,000 to $9,999 | 0 (0.0%) | 0 (0.0%) |
| $10,000 to $14,999 | 0 (0.0%) | 27 (17.4%) |
| $15,000 to $19,999 | 8 (2.5%) | 16 (10.3%) |
| $20,000 to $24,999 | 9 (2.8%) | 17 (11.0%) |
| $25,000 to $34,999 | 14 (4.3%) | 33 (21.3%) |
| $35,000 to $49,999 | 48 (14.7%) | 25 (16.1%) |
| $50,000 to $74,999 | 55 (16.9%) | 11 (7.1%) |
| $75,000 to $99,999 | 68 (20.9%) | 5 (3.2%) |
| $100,000 to $149,999 | 103 (31.6%) | 0 (0.0%) |
| $150,000 or more | 18 (5.5%) | 10 (6.5%) |
| Total | 326 (100.0%) | 155 (100.0%) |
Monthly Housing Cost Tiers in Clarence
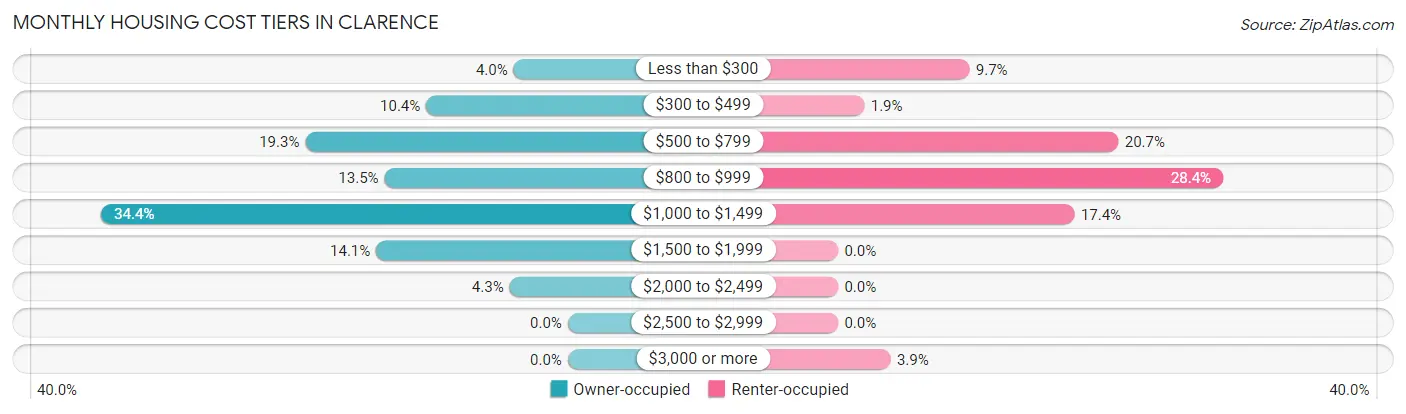
| Monthly Cost | Owner-occupied | Renter-occupied |
| Less than $300 | 13 (4.0%) | 15 (9.7%) |
| $300 to $499 | 34 (10.4%) | 3 (1.9%) |
| $500 to $799 | 63 (19.3%) | 32 (20.6%) |
| $800 to $999 | 44 (13.5%) | 44 (28.4%) |
| $1,000 to $1,499 | 112 (34.4%) | 27 (17.4%) |
| $1,500 to $1,999 | 46 (14.1%) | 0 (0.0%) |
| $2,000 to $2,499 | 14 (4.3%) | 0 (0.0%) |
| $2,500 to $2,999 | 0 (0.0%) | 0 (0.0%) |
| $3,000 or more | 0 (0.0%) | 6 (3.9%) |
| Total | 326 (100.0%) | 155 (100.0%) |
Physical Housing Characteristics in Clarence
Housing Structures in Clarence
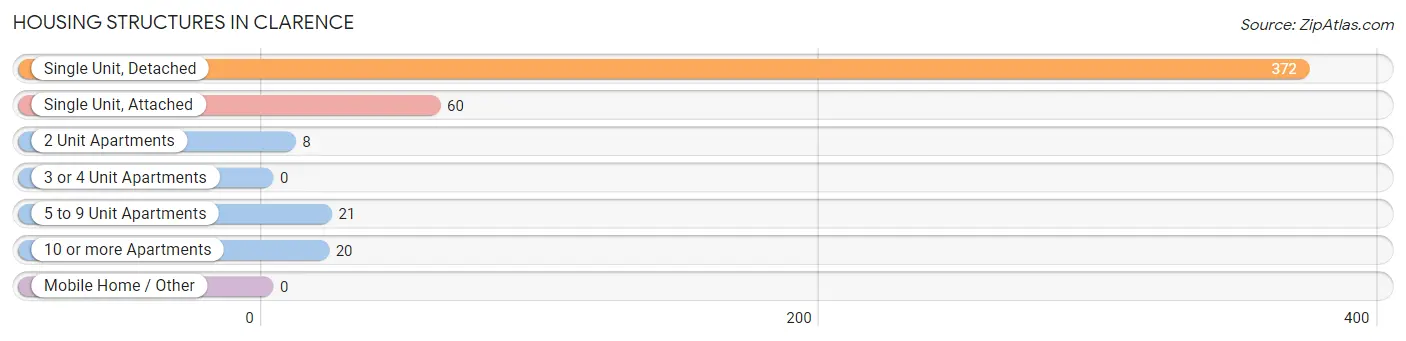
| Structure Type | # Housing Units | % Housing Units |
| Single Unit, Detached | 372 | 77.3% |
| Single Unit, Attached | 60 | 12.5% |
| 2 Unit Apartments | 8 | 1.7% |
| 3 or 4 Unit Apartments | 0 | 0.0% |
| 5 to 9 Unit Apartments | 21 | 4.4% |
| 10 or more Apartments | 20 | 4.2% |
| Mobile Home / Other | 0 | 0.0% |
| Total | 481 | 100.0% |
Housing Structures by Occupancy in Clarence
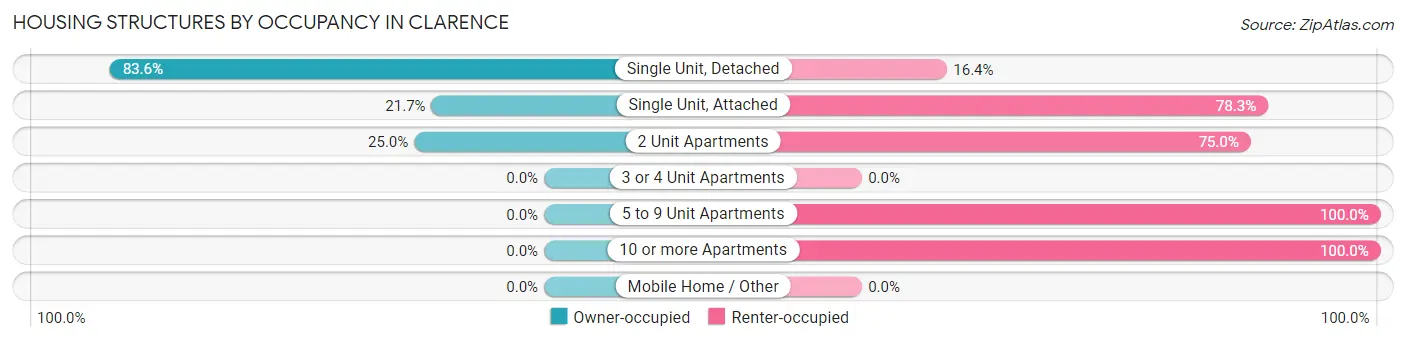
| Structure Type | Owner-occupied | Renter-occupied |
| Single Unit, Detached | 311 (83.6%) | 61 (16.4%) |
| Single Unit, Attached | 13 (21.7%) | 47 (78.3%) |
| 2 Unit Apartments | 2 (25.0%) | 6 (75.0%) |
| 3 or 4 Unit Apartments | 0 (0.0%) | 0 (0.0%) |
| 5 to 9 Unit Apartments | 0 (0.0%) | 21 (100.0%) |
| 10 or more Apartments | 0 (0.0%) | 20 (100.0%) |
| Mobile Home / Other | 0 (0.0%) | 0 (0.0%) |
| Total | 326 (67.8%) | 155 (32.2%) |
Housing Structures by Number of Rooms in Clarence
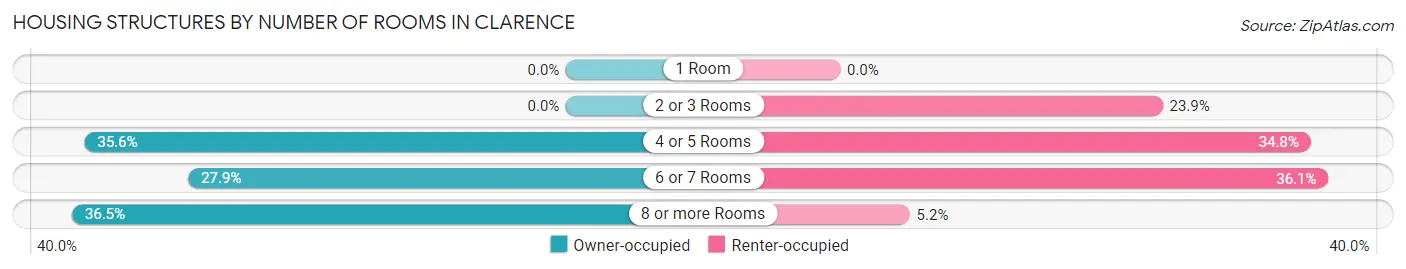
| Number of Rooms | Owner-occupied | Renter-occupied |
| 1 Room | 0 (0.0%) | 0 (0.0%) |
| 2 or 3 Rooms | 0 (0.0%) | 37 (23.9%) |
| 4 or 5 Rooms | 116 (35.6%) | 54 (34.8%) |
| 6 or 7 Rooms | 91 (27.9%) | 56 (36.1%) |
| 8 or more Rooms | 119 (36.5%) | 8 (5.2%) |
| Total | 326 (100.0%) | 155 (100.0%) |
Housing Structure by Heating Type in Clarence
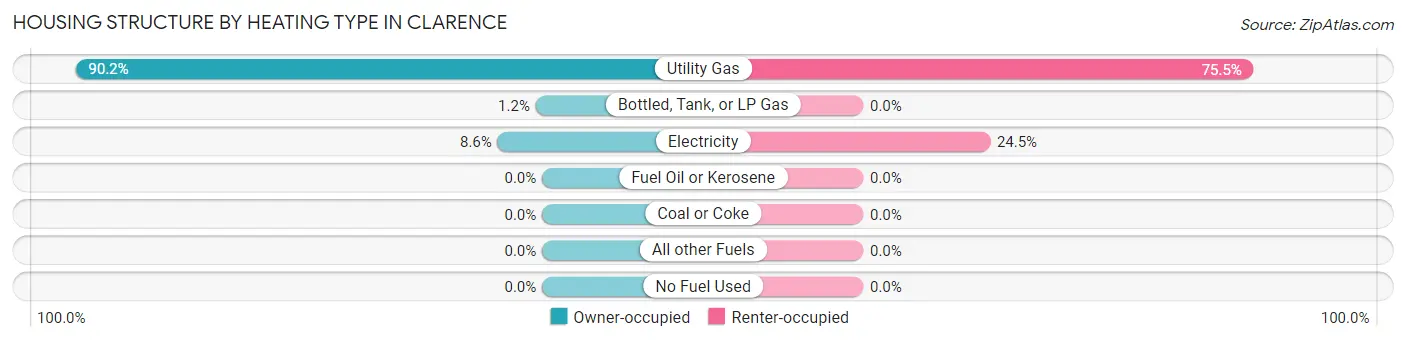
| Heating Type | Owner-occupied | Renter-occupied |
| Utility Gas | 294 (90.2%) | 117 (75.5%) |
| Bottled, Tank, or LP Gas | 4 (1.2%) | 0 (0.0%) |
| Electricity | 28 (8.6%) | 38 (24.5%) |
| Fuel Oil or Kerosene | 0 (0.0%) | 0 (0.0%) |
| Coal or Coke | 0 (0.0%) | 0 (0.0%) |
| All other Fuels | 0 (0.0%) | 0 (0.0%) |
| No Fuel Used | 0 (0.0%) | 0 (0.0%) |
| Total | 326 (100.0%) | 155 (100.0%) |
Household Vehicle Usage in Clarence
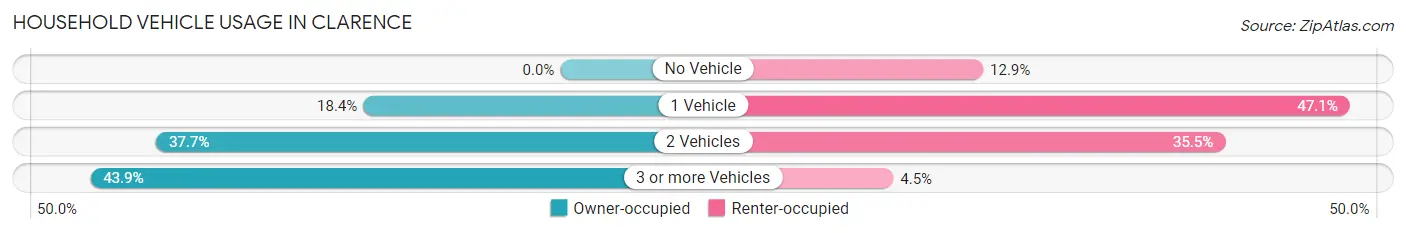
| Vehicles per Household | Owner-occupied | Renter-occupied |
| No Vehicle | 0 (0.0%) | 20 (12.9%) |
| 1 Vehicle | 60 (18.4%) | 73 (47.1%) |
| 2 Vehicles | 123 (37.7%) | 55 (35.5%) |
| 3 or more Vehicles | 143 (43.9%) | 7 (4.5%) |
| Total | 326 (100.0%) | 155 (100.0%) |
Real Estate & Mortgages in Clarence
Real Estate and Mortgage Overview in Clarence
| Characteristic | Without Mortgage | With Mortgage |
| Housing Units | 103 | 223 |
| Median Property Value | $151,700 | $128,000 |
| Median Household Income | $65,625 | $14 |
| Monthly Housing Costs | $550 | $0 |
| Real Estate Taxes | $1,815 | $9 |
Property Value by Mortgage Status in Clarence
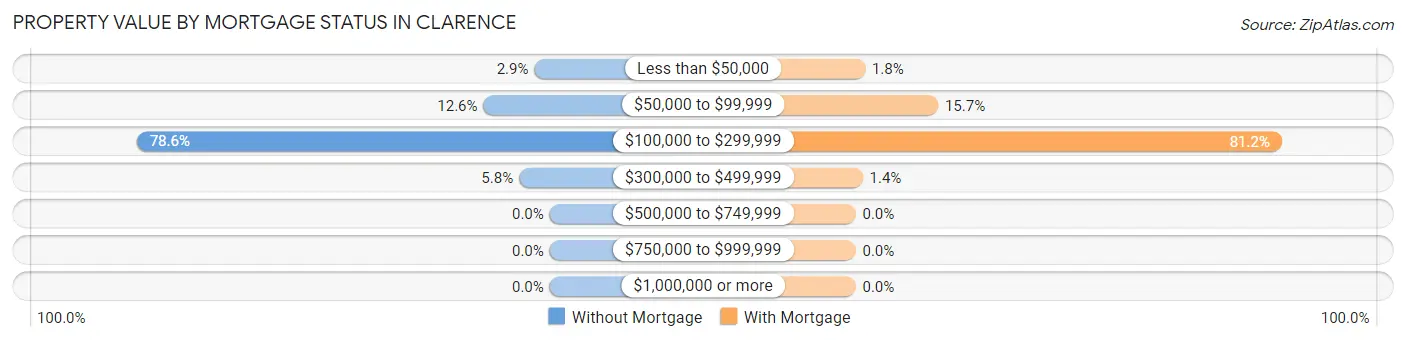
| Property Value | Without Mortgage | With Mortgage |
| Less than $50,000 | 3 (2.9%) | 4 (1.8%) |
| $50,000 to $99,999 | 13 (12.6%) | 35 (15.7%) |
| $100,000 to $299,999 | 81 (78.6%) | 181 (81.2%) |
| $300,000 to $499,999 | 6 (5.8%) | 3 (1.3%) |
| $500,000 to $749,999 | 0 (0.0%) | 0 (0.0%) |
| $750,000 to $999,999 | 0 (0.0%) | 0 (0.0%) |
| $1,000,000 or more | 0 (0.0%) | 0 (0.0%) |
| Total | 103 (100.0%) | 223 (100.0%) |
Household Income by Mortgage Status in Clarence
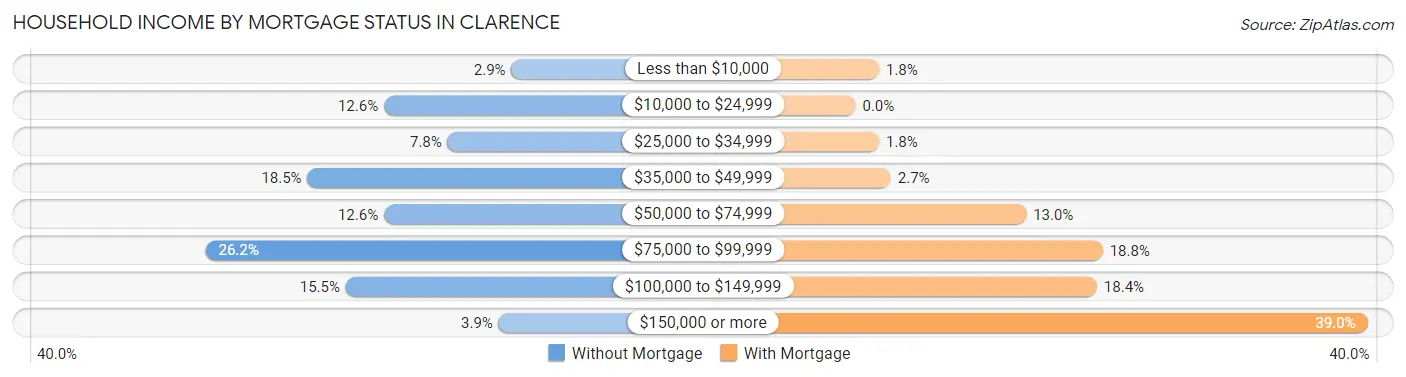
| Household Income | Without Mortgage | With Mortgage |
| Less than $10,000 | 3 (2.9%) | 4 (1.8%) |
| $10,000 to $24,999 | 13 (12.6%) | 0 (0.0%) |
| $25,000 to $34,999 | 8 (7.8%) | 4 (1.8%) |
| $35,000 to $49,999 | 19 (18.4%) | 6 (2.7%) |
| $50,000 to $74,999 | 13 (12.6%) | 29 (13.0%) |
| $75,000 to $99,999 | 27 (26.2%) | 42 (18.8%) |
| $100,000 to $149,999 | 16 (15.5%) | 41 (18.4%) |
| $150,000 or more | 4 (3.9%) | 87 (39.0%) |
| Total | 103 (100.0%) | 223 (100.0%) |
Property Value to Household Income Ratio in Clarence
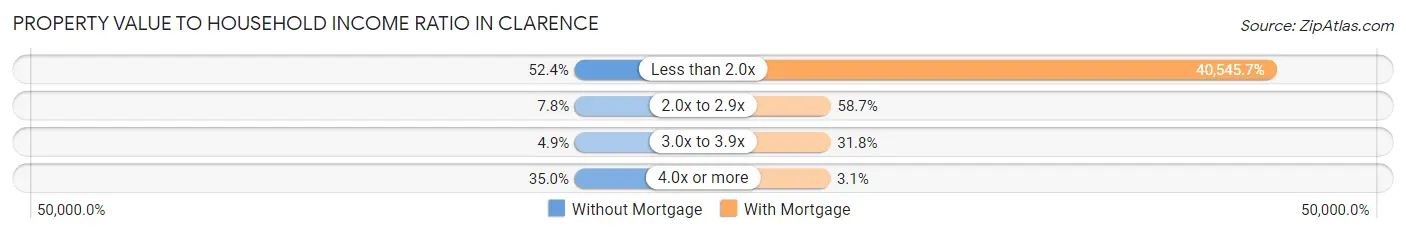
| Value-to-Income Ratio | Without Mortgage | With Mortgage |
| Less than 2.0x | 54 (52.4%) | 90,417 (40,545.7%) |
| 2.0x to 2.9x | 8 (7.8%) | 131 (58.7%) |
| 3.0x to 3.9x | 5 (4.9%) | 71 (31.8%) |
| 4.0x or more | 36 (34.9%) | 7 (3.1%) |
| Total | 103 (100.0%) | 223 (100.0%) |
Real Estate Taxes by Mortgage Status in Clarence
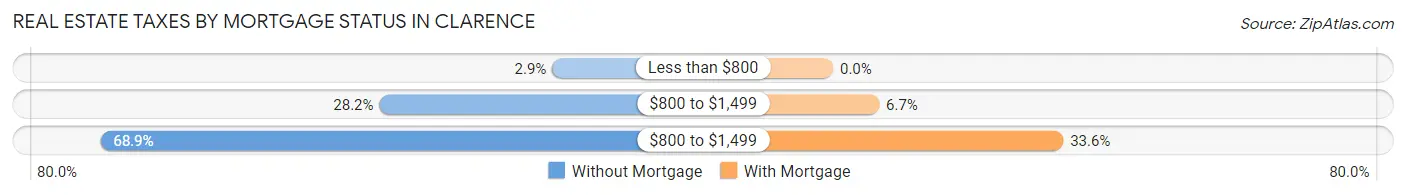
| Property Taxes | Without Mortgage | With Mortgage |
| Less than $800 | 3 (2.9%) | 0 (0.0%) |
| $800 to $1,499 | 29 (28.2%) | 15 (6.7%) |
| $800 to $1,499 | 71 (68.9%) | 75 (33.6%) |
| Total | 103 (100.0%) | 223 (100.0%) |
Health & Disability in Clarence
Health Insurance Coverage by Age in Clarence
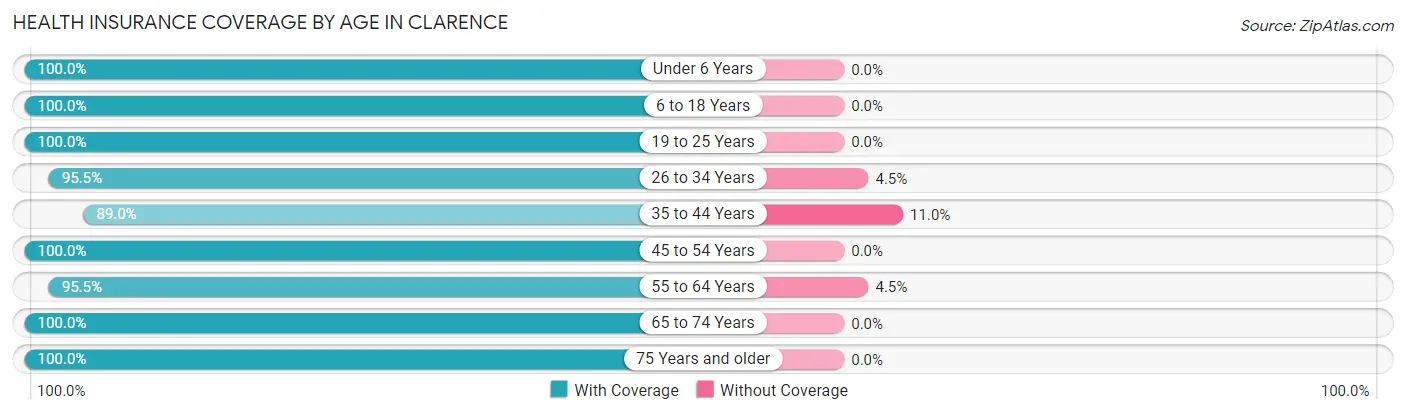
| Age Bracket | With Coverage | Without Coverage |
| Under 6 Years | 80 (100.0%) | 0 (0.0%) |
| 6 to 18 Years | 175 (100.0%) | 0 (0.0%) |
| 19 to 25 Years | 67 (100.0%) | 0 (0.0%) |
| 26 to 34 Years | 148 (95.5%) | 7 (4.5%) |
| 35 to 44 Years | 73 (89.0%) | 9 (11.0%) |
| 45 to 54 Years | 164 (100.0%) | 0 (0.0%) |
| 55 to 64 Years | 169 (95.5%) | 8 (4.5%) |
| 65 to 74 Years | 105 (100.0%) | 0 (0.0%) |
| 75 Years and older | 84 (100.0%) | 0 (0.0%) |
| Total | 1,065 (97.8%) | 24 (2.2%) |
Health Insurance Coverage by Citizenship Status in Clarence
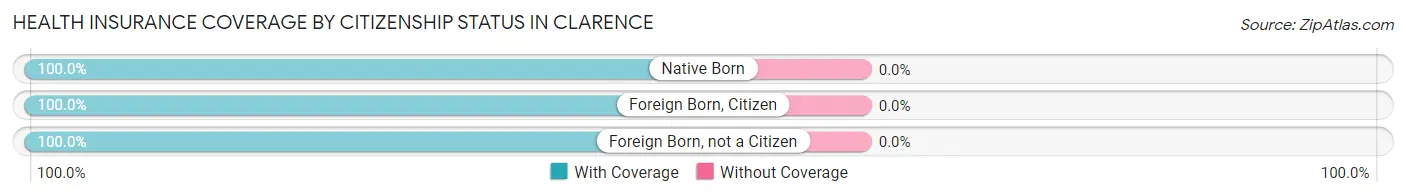
| Citizenship Status | With Coverage | Without Coverage |
| Native Born | 80 (100.0%) | 0 (0.0%) |
| Foreign Born, Citizen | 175 (100.0%) | 0 (0.0%) |
| Foreign Born, not a Citizen | 67 (100.0%) | 0 (0.0%) |
Health Insurance Coverage by Household Income in Clarence
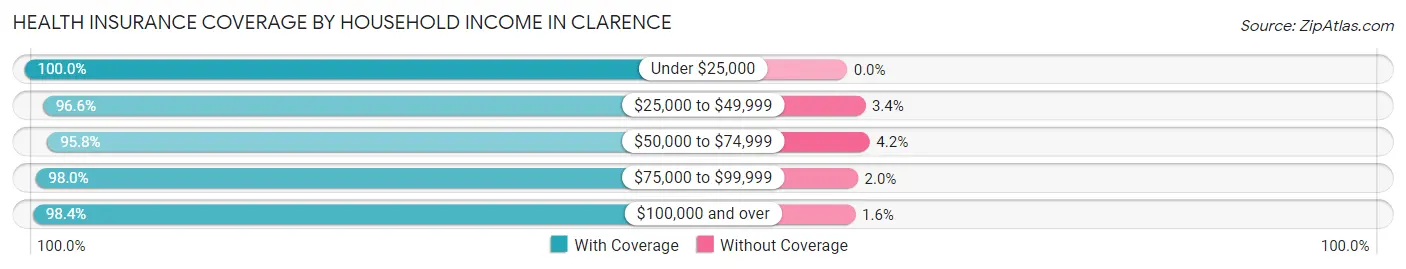
| Household Income | With Coverage | Without Coverage |
| Under $25,000 | 124 (100.0%) | 0 (0.0%) |
| $25,000 to $49,999 | 256 (96.6%) | 9 (3.4%) |
| $50,000 to $74,999 | 113 (95.8%) | 5 (4.2%) |
| $75,000 to $99,999 | 194 (98.0%) | 4 (2.0%) |
| $100,000 and over | 378 (98.4%) | 6 (1.6%) |
Public vs Private Health Insurance Coverage by Age in Clarence
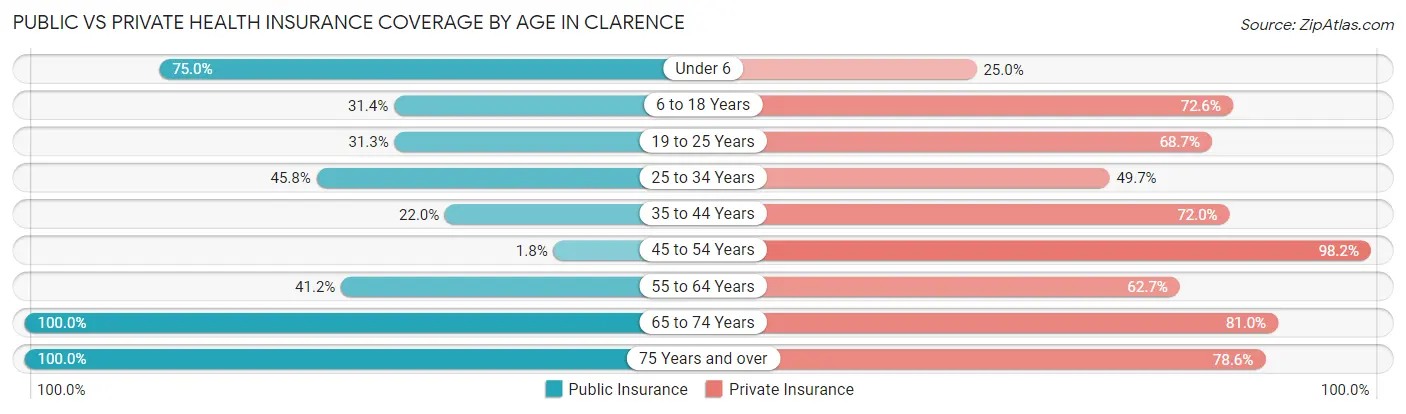
| Age Bracket | Public Insurance | Private Insurance |
| Under 6 | 60 (75.0%) | 20 (25.0%) |
| 6 to 18 Years | 55 (31.4%) | 127 (72.6%) |
| 19 to 25 Years | 21 (31.3%) | 46 (68.7%) |
| 25 to 34 Years | 71 (45.8%) | 77 (49.7%) |
| 35 to 44 Years | 18 (22.0%) | 59 (72.0%) |
| 45 to 54 Years | 3 (1.8%) | 161 (98.2%) |
| 55 to 64 Years | 73 (41.2%) | 111 (62.7%) |
| 65 to 74 Years | 105 (100.0%) | 85 (80.9%) |
| 75 Years and over | 84 (100.0%) | 66 (78.6%) |
| Total | 490 (45.0%) | 752 (69.1%) |
Disability Status by Sex by Age in Clarence
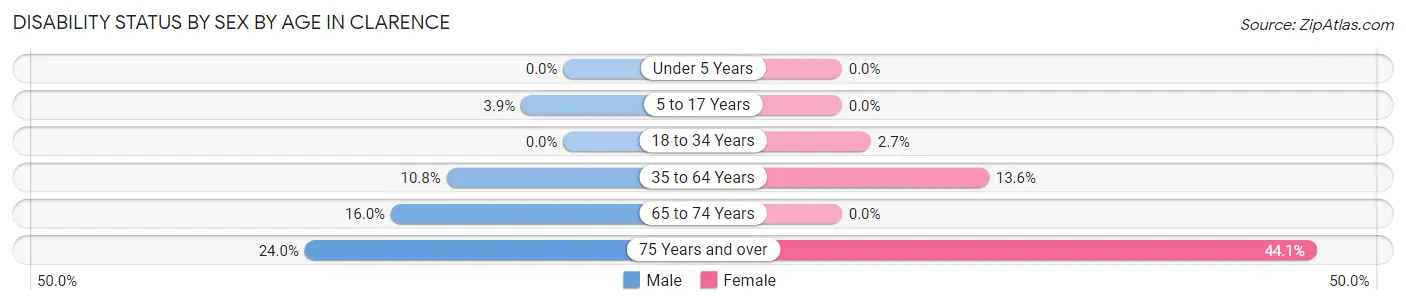
| Age Bracket | Male | Female |
| Under 5 Years | 0 (0.0%) | 0 (0.0%) |
| 5 to 17 Years | 2 (3.9%) | 0 (0.0%) |
| 18 to 34 Years | 0 (0.0%) | 3 (2.7%) |
| 35 to 64 Years | 22 (10.8%) | 30 (13.6%) |
| 65 to 74 Years | 8 (16.0%) | 0 (0.0%) |
| 75 Years and over | 6 (24.0%) | 26 (44.1%) |
Disability Class by Sex by Age in Clarence
Disability Class: Hearing Difficulty
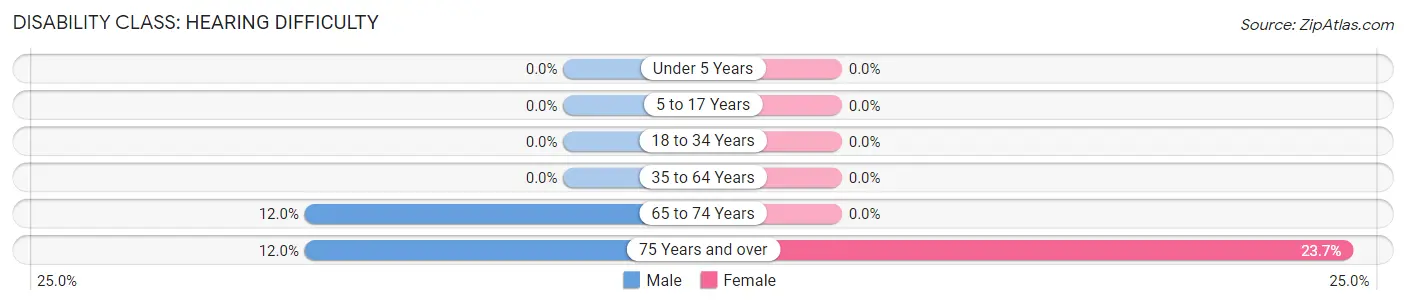
| Age Bracket | Male | Female |
| Under 5 Years | 0 (0.0%) | 0 (0.0%) |
| 5 to 17 Years | 0 (0.0%) | 0 (0.0%) |
| 18 to 34 Years | 0 (0.0%) | 0 (0.0%) |
| 35 to 64 Years | 0 (0.0%) | 0 (0.0%) |
| 65 to 74 Years | 6 (12.0%) | 0 (0.0%) |
| 75 Years and over | 3 (12.0%) | 14 (23.7%) |
Disability Class: Vision Difficulty
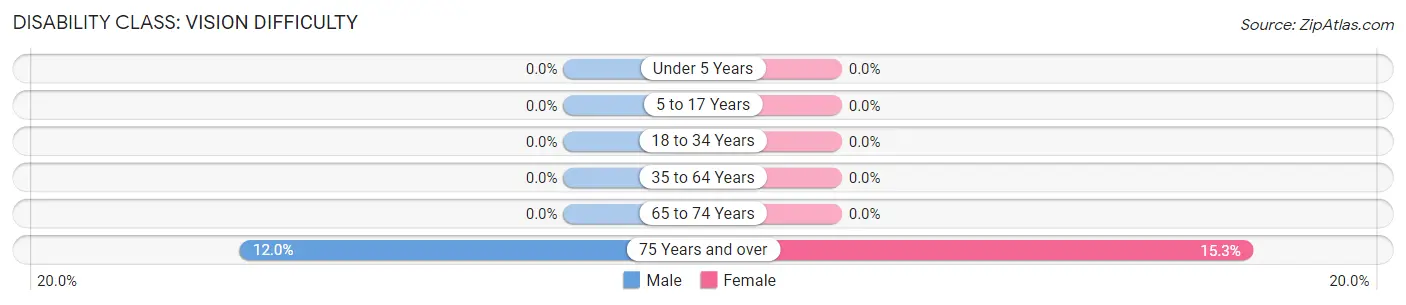
| Age Bracket | Male | Female |
| Under 5 Years | 0 (0.0%) | 0 (0.0%) |
| 5 to 17 Years | 0 (0.0%) | 0 (0.0%) |
| 18 to 34 Years | 0 (0.0%) | 0 (0.0%) |
| 35 to 64 Years | 0 (0.0%) | 0 (0.0%) |
| 65 to 74 Years | 0 (0.0%) | 0 (0.0%) |
| 75 Years and over | 3 (12.0%) | 9 (15.2%) |
Disability Class: Cognitive Difficulty
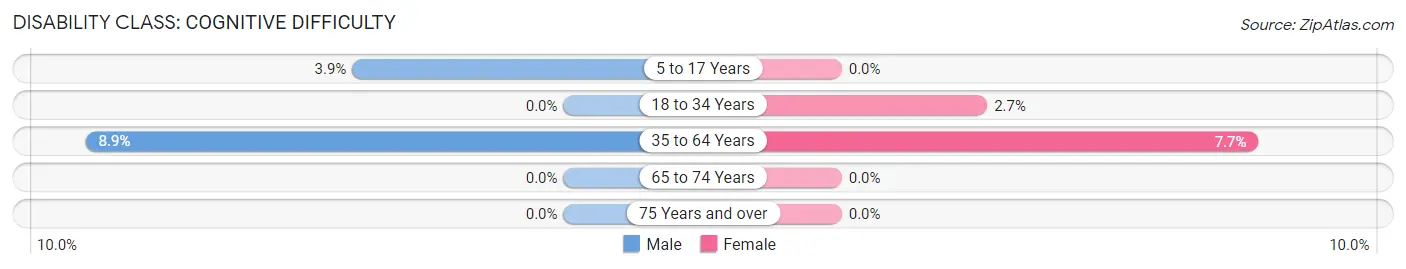
| Age Bracket | Male | Female |
| 5 to 17 Years | 2 (3.9%) | 0 (0.0%) |
| 18 to 34 Years | 0 (0.0%) | 3 (2.7%) |
| 35 to 64 Years | 18 (8.9%) | 17 (7.7%) |
| 65 to 74 Years | 0 (0.0%) | 0 (0.0%) |
| 75 Years and over | 0 (0.0%) | 0 (0.0%) |
Disability Class: Ambulatory Difficulty
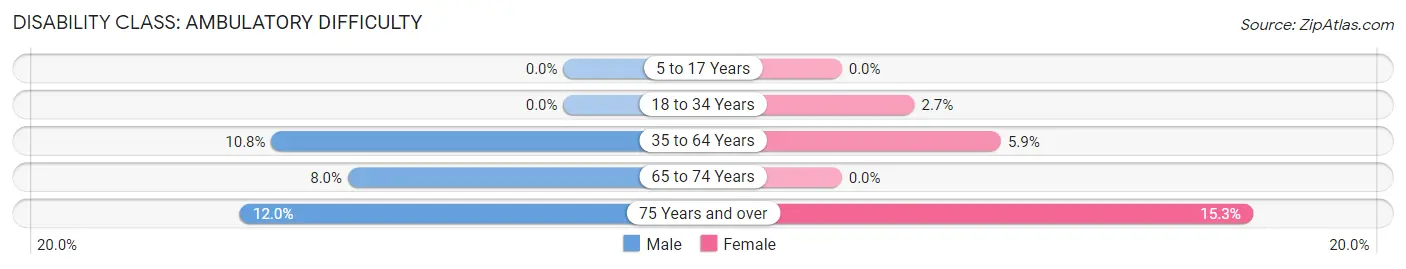
| Age Bracket | Male | Female |
| 5 to 17 Years | 0 (0.0%) | 0 (0.0%) |
| 18 to 34 Years | 0 (0.0%) | 3 (2.7%) |
| 35 to 64 Years | 22 (10.8%) | 13 (5.9%) |
| 65 to 74 Years | 4 (8.0%) | 0 (0.0%) |
| 75 Years and over | 3 (12.0%) | 9 (15.2%) |
Disability Class: Self-Care Difficulty
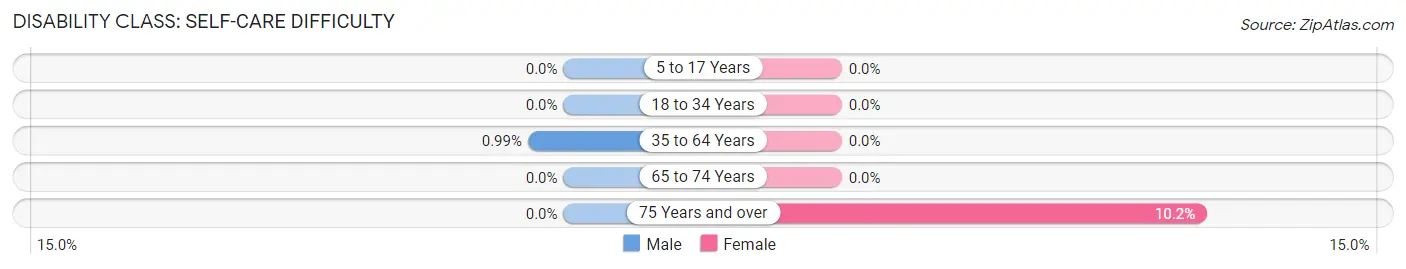
| Age Bracket | Male | Female |
| 5 to 17 Years | 0 (0.0%) | 0 (0.0%) |
| 18 to 34 Years | 0 (0.0%) | 0 (0.0%) |
| 35 to 64 Years | 2 (1.0%) | 0 (0.0%) |
| 65 to 74 Years | 0 (0.0%) | 0 (0.0%) |
| 75 Years and over | 0 (0.0%) | 6 (10.2%) |
Technology Access in Clarence
Computing Device Access in Clarence
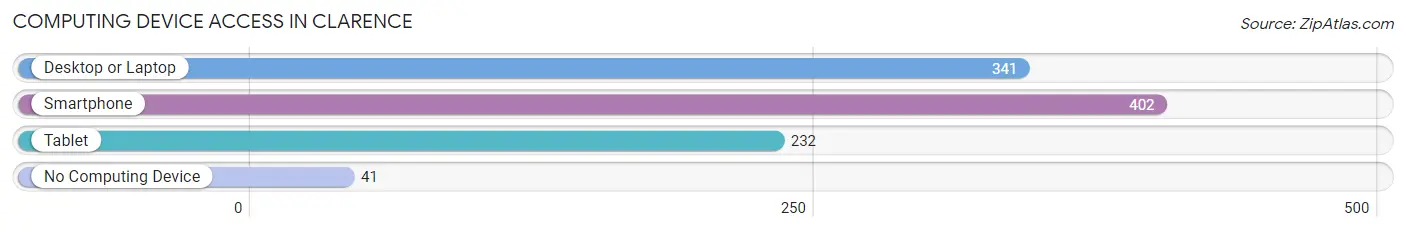
| Device Type | # Households | % Households |
| Desktop or Laptop | 341 | 70.9% |
| Smartphone | 402 | 83.6% |
| Tablet | 232 | 48.2% |
| No Computing Device | 41 | 8.5% |
| Total | 481 | 100.0% |
Internet Access in Clarence
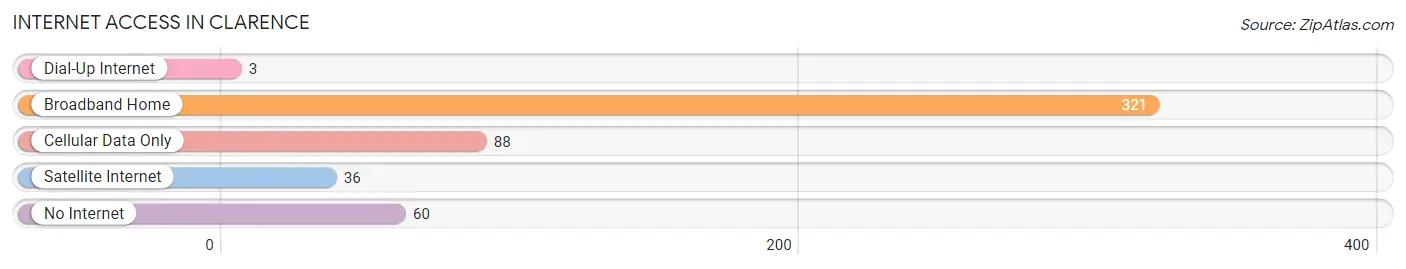
| Internet Type | # Households | % Households |
| Dial-Up Internet | 3 | 0.6% |
| Broadband Home | 321 | 66.7% |
| Cellular Data Only | 88 | 18.3% |
| Satellite Internet | 36 | 7.5% |
| No Internet | 60 | 12.5% |
| Total | 481 | 100.0% |
Clarence Summary
Clarence, Iowa is a small town located in the eastern part of the state, in the county of Cedar. It is situated on the banks of the Cedar River, and is home to a population of just over 500 people. The town was founded in 1854, and has a rich history of farming and industry.
Geography
Clarence is located in the eastern part of Cedar County, Iowa, and is situated on the banks of the Cedar River. The town is located at the intersection of two major highways, US Highway 30 and Iowa Highway 13. The town is surrounded by rolling hills and farmland, and is located about 25 miles from the larger city of Cedar Rapids.
The climate in Clarence is typical of the Midwest, with hot summers and cold winters. The average temperature in the summer is around 75 degrees Fahrenheit, and the average temperature in the winter is around 25 degrees Fahrenheit. The town receives an average of 36 inches of precipitation per year, with most of it falling in the spring and summer months.
Economy
The economy of Clarence is largely based on agriculture and manufacturing. The town is home to several large farms, which produce corn, soybeans, and other crops. The town also has several small businesses, including a grocery store, a hardware store, and a few restaurants.
The town is also home to several manufacturing companies, including a plastics factory and a metal fabrication plant. These companies provide jobs for many of the town's residents.
Demographics
As of the 2010 census, the population of Clarence was 514 people. The racial makeup of the town was 97.3% White, 0.6% African American, 0.2% Native American, 0.4% Asian, 0.2% from other races, and 1.3% from two or more races. Hispanic or Latino of any race were 0.8% of the population.
The median household income in Clarence was $45,000, and the median family income was $50,000. The per capita income for the town was $20,000. About 8.3% of families and 10.2% of the population were below the poverty line, including 11.3% of those under age 18 and 8.3% of those age 65 or over.
Conclusion
Clarence, Iowa is a small town with a rich history and a strong economy. The town is home to several large farms and manufacturing companies, which provide jobs for many of the town's residents. The town has a population of just over 500 people, and the racial makeup is predominantly White. The median household income in Clarence is $45,000, and the per capita income is $20,000.
Common Questions
What is Per Capita Income in Clarence?
Per Capita income in Clarence is $30,079.
What is the Median Family Income in Clarence?
Median Family Income in Clarence is $78,929.
What is the Median Household income in Clarence?
Median Household Income in Clarence is $63,594.
What is Income or Wage Gap in Clarence?
Income or Wage Gap in Clarence is 45.7%.
Women in Clarence earn 54.3 cents for every dollar earned by a man.
What is Inequality or Gini Index in Clarence?
Inequality or Gini Index in Clarence is 0.38.
What is the Total Population of Clarence?
Total Population of Clarence is 1,136.
What is the Total Male Population of Clarence?
Total Male Population of Clarence is 479.
What is the Total Female Population of Clarence?
Total Female Population of Clarence is 657.
What is the Ratio of Males per 100 Females in Clarence?
There are 72.91 Males per 100 Females in Clarence.
What is the Ratio of Females per 100 Males in Clarence?
There are 137.16 Females per 100 Males in Clarence.
What is the Median Population Age in Clarence?
Median Population Age in Clarence is 45.1 Years.
What is the Average Family Size in Clarence
Average Family Size in Clarence is 2.7 People.
What is the Average Household Size in Clarence
Average Household Size in Clarence is 2.3 People.
How Large is the Labor Force in Clarence?
There are 529 People in the Labor Forcein in Clarence.
What is the Percentage of People in the Labor Force in Clarence?
56.1% of People are in the Labor Force in Clarence.
What is the Unemployment Rate in Clarence?
Unemployment Rate in Clarence is 1.1%.