Talbotton, GA Map & Demographics
Talbotton Map
Talbotton Overview
$50,413
PER CAPITA INCOME
$26,023
AVG FAMILY INCOME
$25,114
AVG HOUSEHOLD INCOME
0.65
INEQUALITY / GINI INDEX
728
TOTAL POPULATION
348
MALE POPULATION
380
FEMALE POPULATION
91.58
MALES / 100 FEMALES
109.20
FEMALES / 100 MALES
46.9
MEDIAN AGE
2.8
AVG FAMILY SIZE
1.9
AVG HOUSEHOLD SIZE
294
LABOR FORCE [ PEOPLE ]
47.7%
PERCENT IN LABOR FORCE
7.5%
UNEMPLOYMENT RATE
Talbotton Zip Codes
Talbotton Area Codes
Income in Talbotton
Income Overview in Talbotton
Per Capita Income in Talbotton is $50,413, while median incomes of families and households are $26,023 and $25,114 respectively.
| Characteristic | Number | Measure |
| Per Capita Income | 728 | $50,413 |
| Median Family Income | 169 | $26,023 |
| Mean Family Income | 169 | $42,076 |
| Median Household Income | 379 | $25,114 |
| Mean Household Income | 379 | $96,350 |
| Income Deficit | 169 | $0 |
| Wage / Income Gap (%) | 728 | 0.00% |
| Wage / Income Gap ($) | 728 | 100.00¢ per $1 |
| Gini / Inequality Index | 728 | 0.65 |
Earnings by Sex in Talbotton
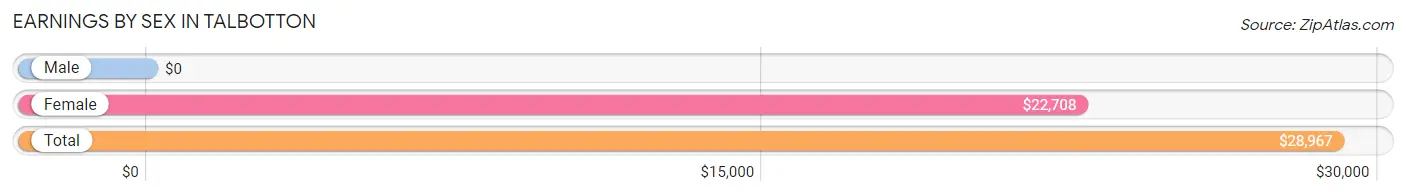
| Sex | Number | Average Earnings |
| Male | 186 (59.8%) | $0 |
| Female | 125 (40.2%) | $22,708 |
| Total | 311 (100.0%) | $28,967 |
Earnings by Sex by Income Bracket in Talbotton
The most common earnings brackets in Talbotton are $100,000+ for men (79 | 42.5%) and $10,000 to $12,499 for women (24 | 19.2%).
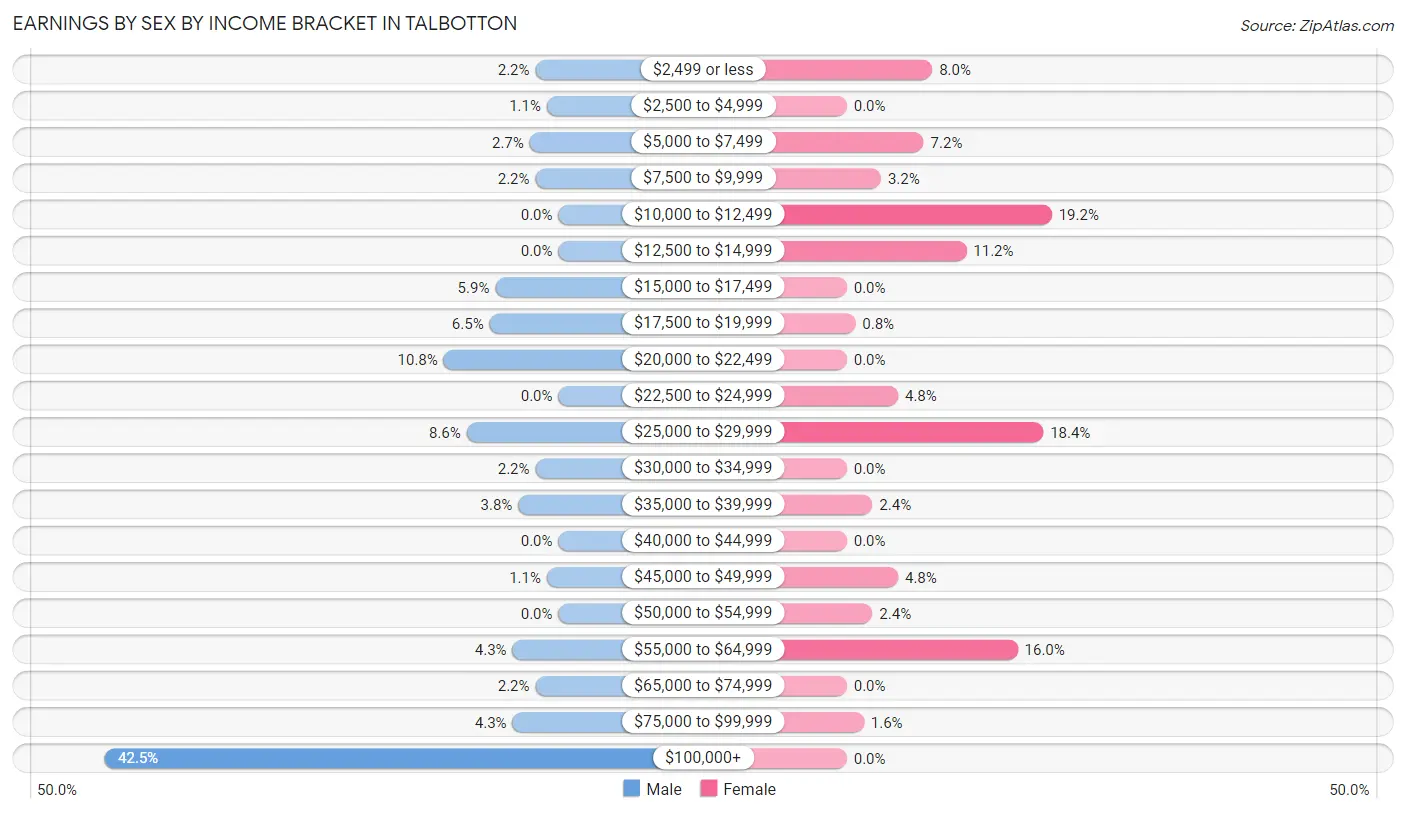
| Income | Male | Female |
| $2,499 or less | 4 (2.1%) | 10 (8.0%) |
| $2,500 to $4,999 | 2 (1.1%) | 0 (0.0%) |
| $5,000 to $7,499 | 5 (2.7%) | 9 (7.2%) |
| $7,500 to $9,999 | 4 (2.1%) | 4 (3.2%) |
| $10,000 to $12,499 | 0 (0.0%) | 24 (19.2%) |
| $12,500 to $14,999 | 0 (0.0%) | 14 (11.2%) |
| $15,000 to $17,499 | 11 (5.9%) | 0 (0.0%) |
| $17,500 to $19,999 | 12 (6.5%) | 1 (0.8%) |
| $20,000 to $22,499 | 20 (10.7%) | 0 (0.0%) |
| $22,500 to $24,999 | 0 (0.0%) | 6 (4.8%) |
| $25,000 to $29,999 | 16 (8.6%) | 23 (18.4%) |
| $30,000 to $34,999 | 4 (2.1%) | 0 (0.0%) |
| $35,000 to $39,999 | 7 (3.8%) | 3 (2.4%) |
| $40,000 to $44,999 | 0 (0.0%) | 0 (0.0%) |
| $45,000 to $49,999 | 2 (1.1%) | 6 (4.8%) |
| $50,000 to $54,999 | 0 (0.0%) | 3 (2.4%) |
| $55,000 to $64,999 | 8 (4.3%) | 20 (16.0%) |
| $65,000 to $74,999 | 4 (2.1%) | 0 (0.0%) |
| $75,000 to $99,999 | 8 (4.3%) | 2 (1.6%) |
| $100,000+ | 79 (42.5%) | 0 (0.0%) |
| Total | 186 (100.0%) | 125 (100.0%) |
Earnings by Sex by Educational Attainment in Talbotton
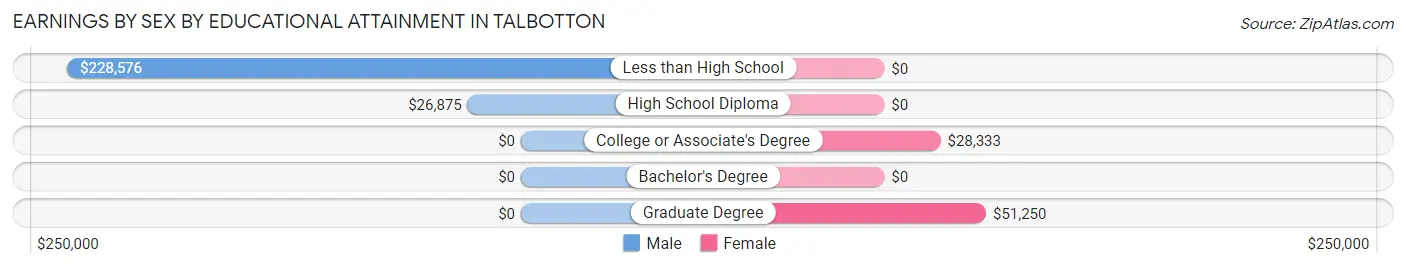
| Educational Attainment | Male Income | Female Income |
| Less than High School | $228,576 | $0 |
| High School Diploma | $26,875 | $0 |
| College or Associate's Degree | - | - |
| Bachelor's Degree | - | - |
| Graduate Degree | - | - |
| Total | - | - |
Family Income in Talbotton
Family Income Brackets in Talbotton
According to the Talbotton family income data, there are 41 families falling into the $15,000 to $24,999 income range, which is the most common income bracket and makes up 24.3% of all families.
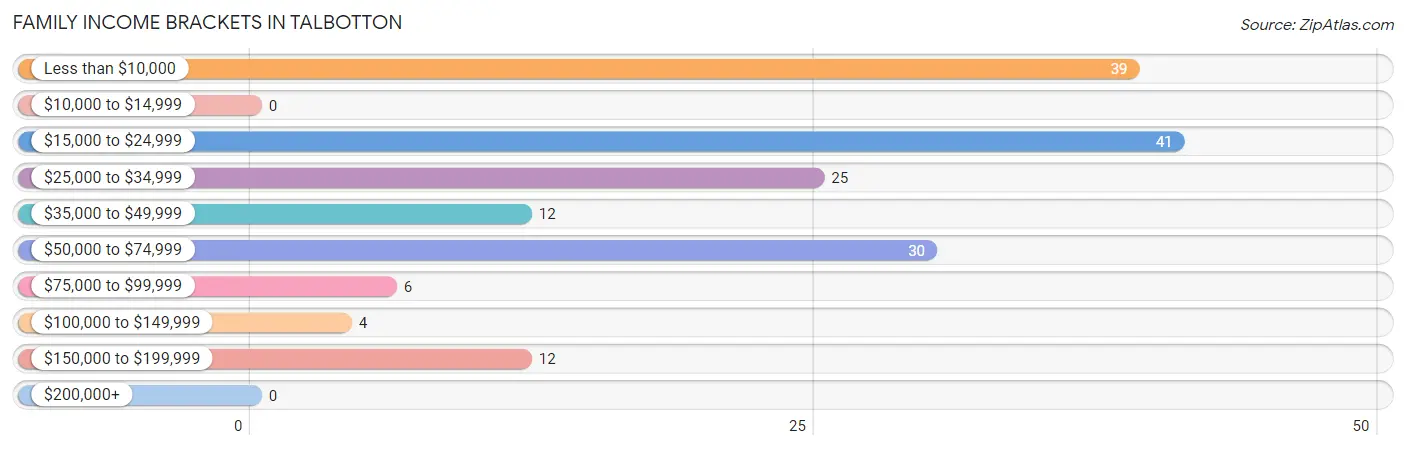
| Income Bracket | # Families | % Families |
| Less than $10,000 | 39 | 23.1% |
| $10,000 to $14,999 | 0 | 0.0% |
| $15,000 to $24,999 | 41 | 24.3% |
| $25,000 to $34,999 | 25 | 14.8% |
| $35,000 to $49,999 | 12 | 7.1% |
| $50,000 to $74,999 | 30 | 17.8% |
| $75,000 to $99,999 | 6 | 3.6% |
| $100,000 to $149,999 | 4 | 2.4% |
| $150,000 to $199,999 | 12 | 7.1% |
| $200,000+ | 0 | 0.0% |
Family Income by Famaliy Size in Talbotton
| Income Bracket | # Families | Median Income |
| 2-Person Families | 81 (47.9%) | $0 |
| 3-Person Families | 41 (24.3%) | $0 |
| 4-Person Families | 37 (21.9%) | $0 |
| 5-Person Families | 10 (5.9%) | $0 |
| 6-Person Families | 0 (0.0%) | $0 |
| 7+ Person Families | 0 (0.0%) | $0 |
| Total | 169 (100.0%) | $26,023 |
Family Income by Number of Earners in Talbotton
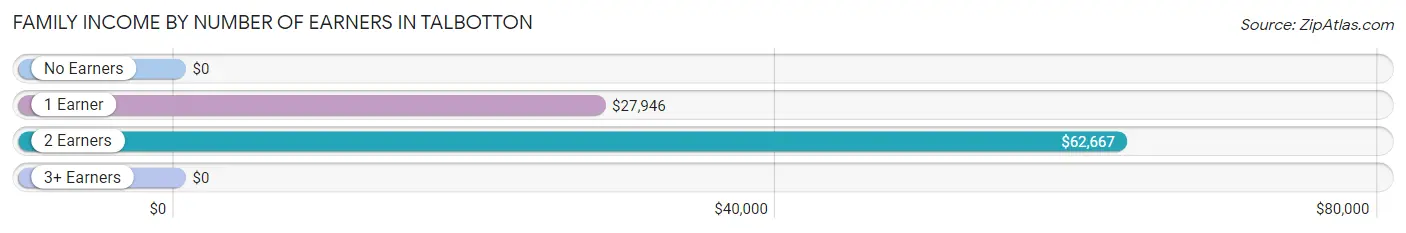
| Number of Earners | # Families | Median Income |
| No Earners | 58 (34.3%) | $0 |
| 1 Earner | 63 (37.3%) | $27,946 |
| 2 Earners | 34 (20.1%) | $62,667 |
| 3+ Earners | 14 (8.3%) | $0 |
| Total | 169 (100.0%) | $26,023 |
Household Income in Talbotton
Household Income Brackets in Talbotton
With 79 households falling in the category, the $200,000+ income range is the most frequent in Talbotton, accounting for 20.8% of all households. In contrast, only 4 households (1.1%) fall into the $100,000 to $149,999 income bracket, making it the least populous group.
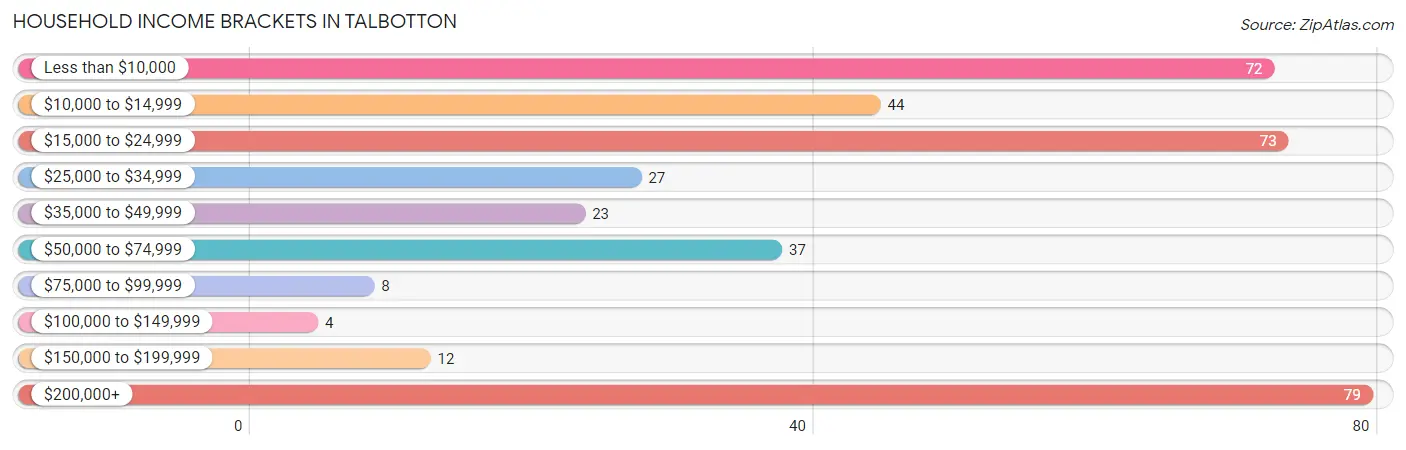
| Income Bracket | # Households | % Households |
| Less than $10,000 | 72 | 19.0% |
| $10,000 to $14,999 | 44 | 11.6% |
| $15,000 to $24,999 | 73 | 19.3% |
| $25,000 to $34,999 | 27 | 7.1% |
| $35,000 to $49,999 | 23 | 6.1% |
| $50,000 to $74,999 | 37 | 9.8% |
| $75,000 to $99,999 | 8 | 2.1% |
| $100,000 to $149,999 | 4 | 1.1% |
| $150,000 to $199,999 | 12 | 3.2% |
| $200,000+ | 79 | 20.8% |
Household Income by Householder Age in Talbotton
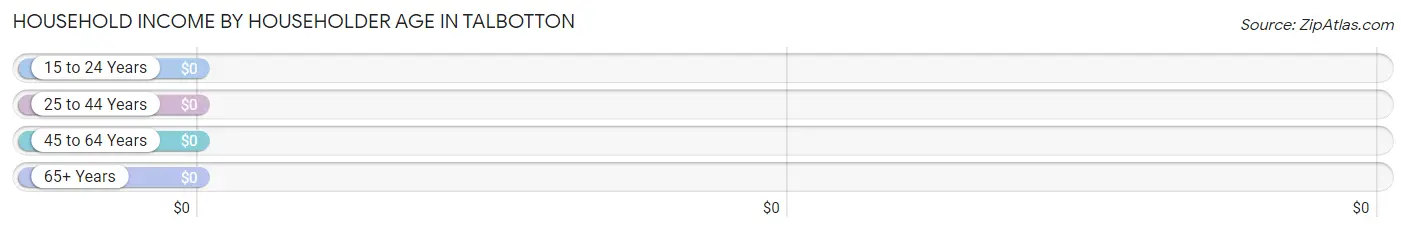
| Income Bracket | # Households | Median Income |
| 15 to 24 Years | 0 (0.0%) | $0 |
| 25 to 44 Years | 73 (19.3%) | $0 |
| 45 to 64 Years | 104 (27.4%) | $0 |
| 65+ Years | 202 (53.3%) | $0 |
| Total | 379 (100.0%) | $25,114 |
Poverty in Talbotton
Income Below Poverty by Sex and Age in Talbotton
With 24.4% poverty level for males and 57.9% for females among the residents of Talbotton, 6 to 11 year old males and under 5 year old females are the most vulnerable to poverty, with 12 males (100.0%) and 24 females (100.0%) in their respective age groups living below the poverty level.
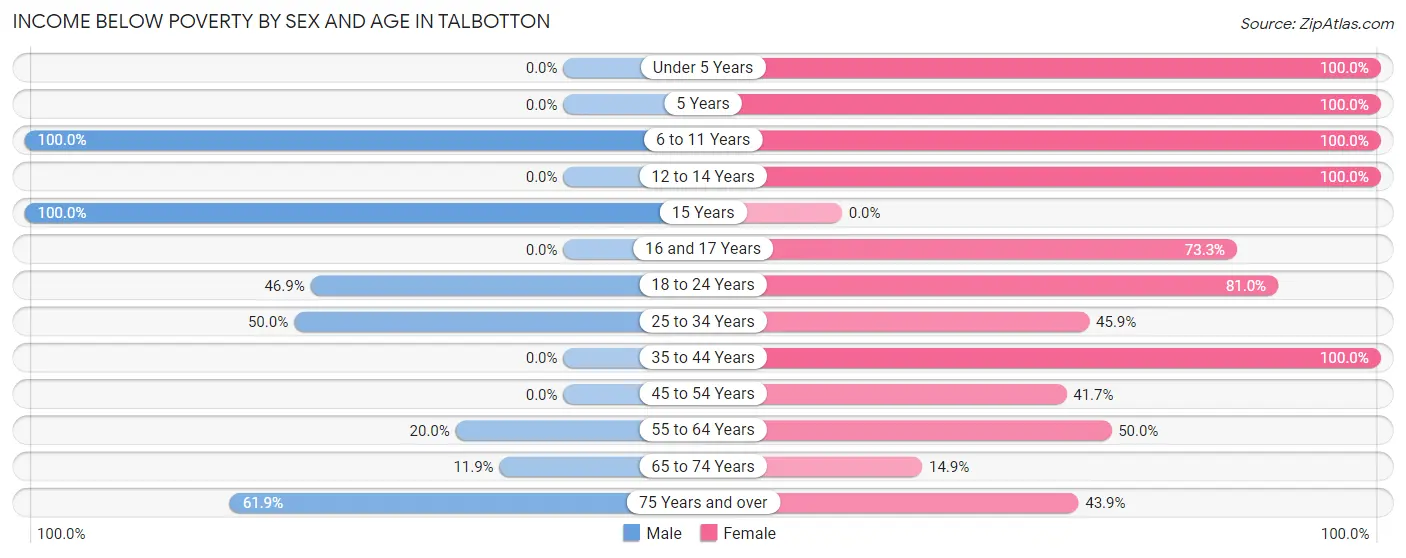
| Age Bracket | Male | Female |
| Under 5 Years | 0 (0.0%) | 24 (100.0%) |
| 5 Years | 0 (0.0%) | 3 (100.0%) |
| 6 to 11 Years | 12 (100.0%) | 13 (100.0%) |
| 12 to 14 Years | 0 (0.0%) | 26 (100.0%) |
| 15 Years | 4 (100.0%) | 0 (0.0%) |
| 16 and 17 Years | 0 (0.0%) | 11 (73.3%) |
| 18 to 24 Years | 23 (46.9%) | 17 (80.9%) |
| 25 to 34 Years | 5 (50.0%) | 28 (45.9%) |
| 35 to 44 Years | 0 (0.0%) | 27 (100.0%) |
| 45 to 54 Years | 0 (0.0%) | 25 (41.7%) |
| 55 to 64 Years | 7 (20.0%) | 21 (50.0%) |
| 65 to 74 Years | 14 (11.9%) | 7 (14.9%) |
| 75 Years and over | 13 (61.9%) | 18 (43.9%) |
| Total | 78 (24.4%) | 220 (57.9%) |
Income Above Poverty by Sex and Age in Talbotton
According to the poverty statistics in Talbotton, males aged under 5 years and females aged 65 to 74 years are the age groups that are most secure financially, with 100.0% of males and 85.1% of females in these age groups living above the poverty line.
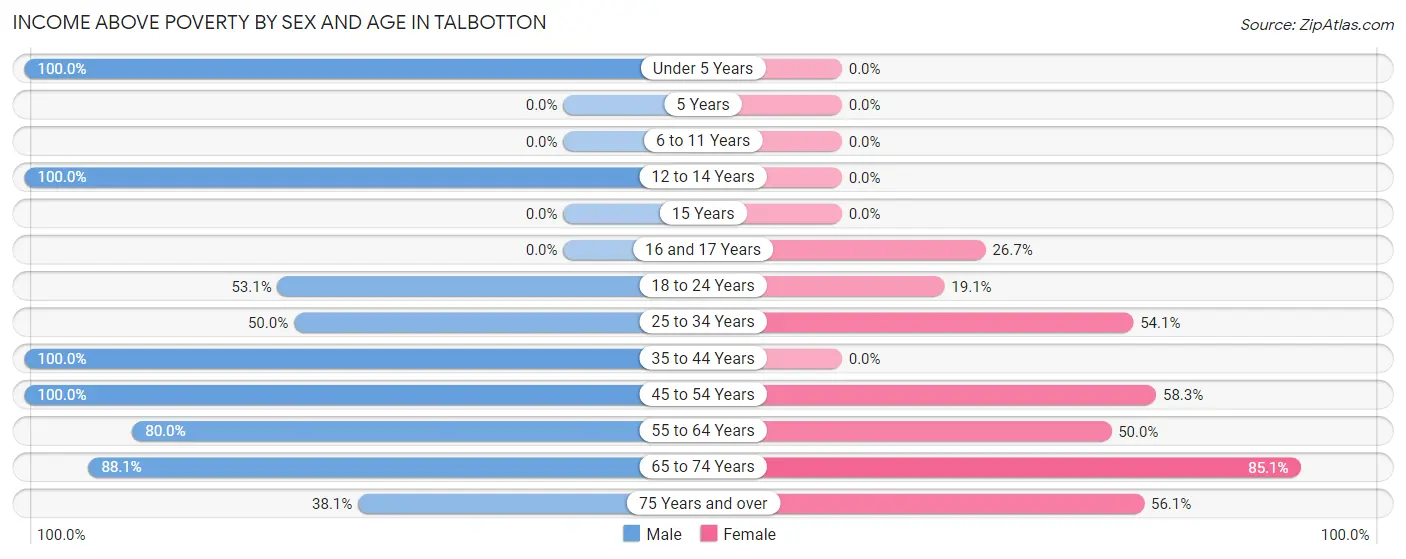
| Age Bracket | Male | Female |
| Under 5 Years | 28 (100.0%) | 0 (0.0%) |
| 5 Years | 0 (0.0%) | 0 (0.0%) |
| 6 to 11 Years | 0 (0.0%) | 0 (0.0%) |
| 12 to 14 Years | 2 (100.0%) | 0 (0.0%) |
| 15 Years | 0 (0.0%) | 0 (0.0%) |
| 16 and 17 Years | 0 (0.0%) | 4 (26.7%) |
| 18 to 24 Years | 26 (53.1%) | 4 (19.1%) |
| 25 to 34 Years | 5 (50.0%) | 33 (54.1%) |
| 35 to 44 Years | 26 (100.0%) | 0 (0.0%) |
| 45 to 54 Years | 15 (100.0%) | 35 (58.3%) |
| 55 to 64 Years | 28 (80.0%) | 21 (50.0%) |
| 65 to 74 Years | 104 (88.1%) | 40 (85.1%) |
| 75 Years and over | 8 (38.1%) | 23 (56.1%) |
| Total | 242 (75.6%) | 160 (42.1%) |
Income Below Poverty Among Married-Couple Families in Talbotton
The poverty statistics for married-couple families in Talbotton show that 24.4% or 11 of the total 45 families live below the poverty line. Families with no children have the highest poverty rate of 25.6%, comprising of 11 families. On the other hand, families with 1 or 2 children have the lowest poverty rate of 0.0%, which includes 0 families.
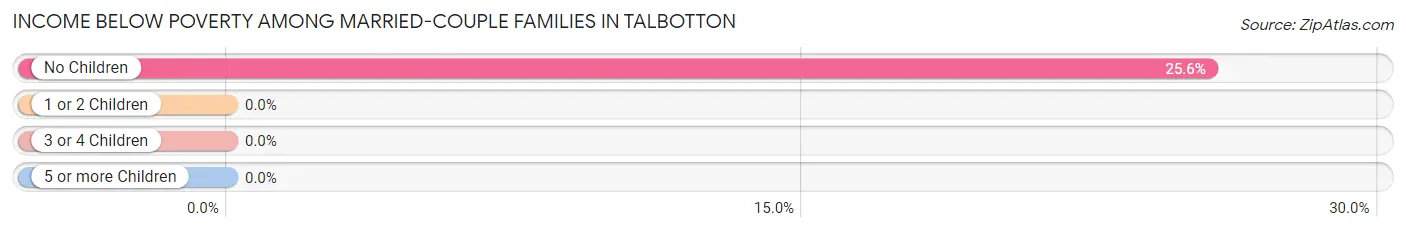
| Children | Above Poverty | Below Poverty |
| No Children | 32 (74.4%) | 11 (25.6%) |
| 1 or 2 Children | 2 (100.0%) | 0 (0.0%) |
| 3 or 4 Children | 0 (0.0%) | 0 (0.0%) |
| 5 or more Children | 0 (0.0%) | 0 (0.0%) |
| Total | 34 (75.6%) | 11 (24.4%) |
Income Below Poverty Among Single-Parent Households in Talbotton
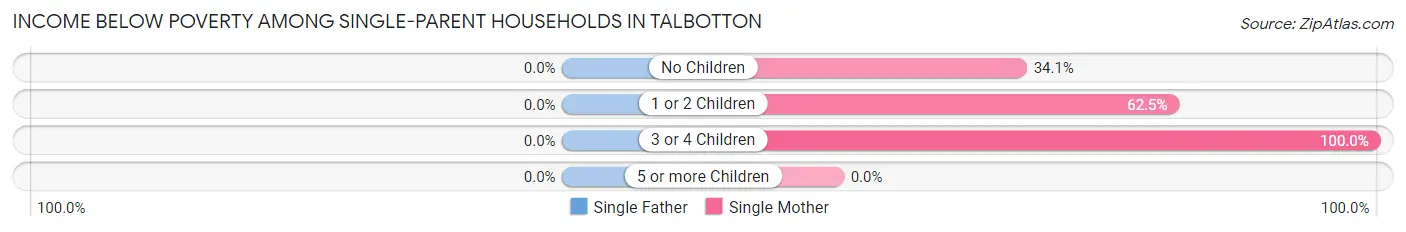
| Children | Single Father | Single Mother |
| No Children | 0 (0.0%) | 15 (34.1%) |
| 1 or 2 Children | 0 (0.0%) | 30 (62.5%) |
| 3 or 4 Children | 0 (0.0%) | 16 (100.0%) |
| 5 or more Children | 0 (0.0%) | 0 (0.0%) |
| Total | 0 (0.0%) | 61 (56.5%) |
Income Below Poverty Among Married-Couple vs Single-Parent Households in Talbotton
The poverty data for Talbotton shows that 11 of the married-couple family households (24.4%) and 61 of the single-parent households (49.2%) are living below the poverty level. Within the married-couple family households, those with no children have the highest poverty rate, with 11 households (25.6%) falling below the poverty line. Among the single-parent households, those with 3 or 4 children have the highest poverty rate, with 16 household (100.0%) living below poverty.
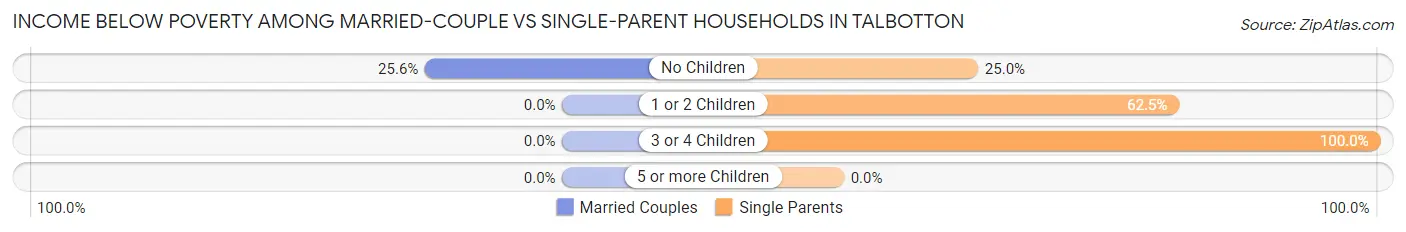
| Children | Married-Couple Families | Single-Parent Households |
| No Children | 11 (25.6%) | 15 (25.0%) |
| 1 or 2 Children | 0 (0.0%) | 30 (62.5%) |
| 3 or 4 Children | 0 (0.0%) | 16 (100.0%) |
| 5 or more Children | 0 (0.0%) | 0 (0.0%) |
| Total | 11 (24.4%) | 61 (49.2%) |
Race in Talbotton
The most populous races in Talbotton are Black / African American (587 | 80.6%), White / Caucasian (118 | 16.2%), and Some other Race (19 | 2.6%).
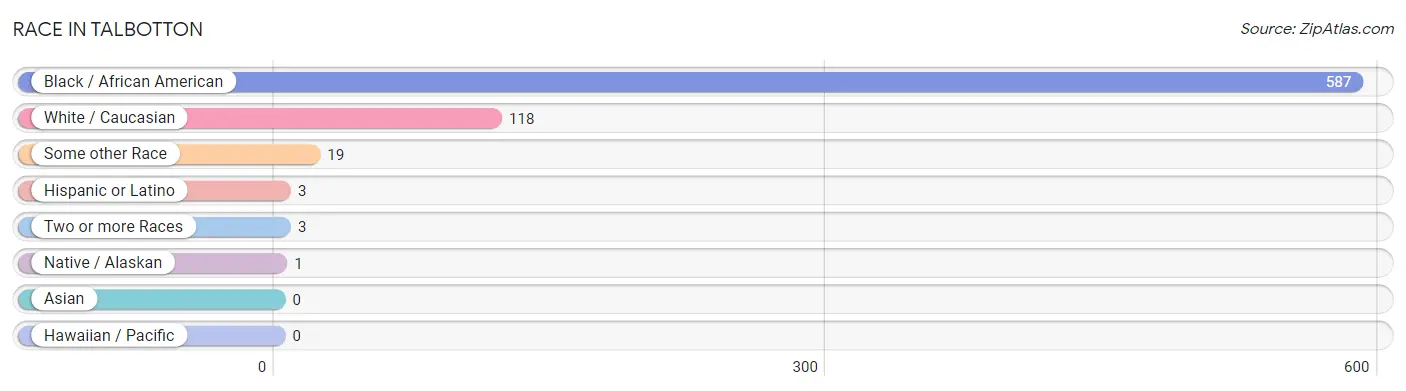
| Race | # Population | % Population |
| Asian | 0 | 0.0% |
| Black / African American | 587 | 80.6% |
| Hawaiian / Pacific | 0 | 0.0% |
| Hispanic or Latino | 3 | 0.4% |
| Native / Alaskan | 1 | 0.1% |
| White / Caucasian | 118 | 16.2% |
| Two or more Races | 3 | 0.4% |
| Some other Race | 19 | 2.6% |
| Total | 728 | 100.0% |
Ancestry in Talbotton
The most populous ancestries reported in Talbotton are American (33 | 4.5%), French (18 | 2.5%), German (18 | 2.5%), African (14 | 1.9%), and English (14 | 1.9%), together accounting for 13.3% of all Talbotton residents.
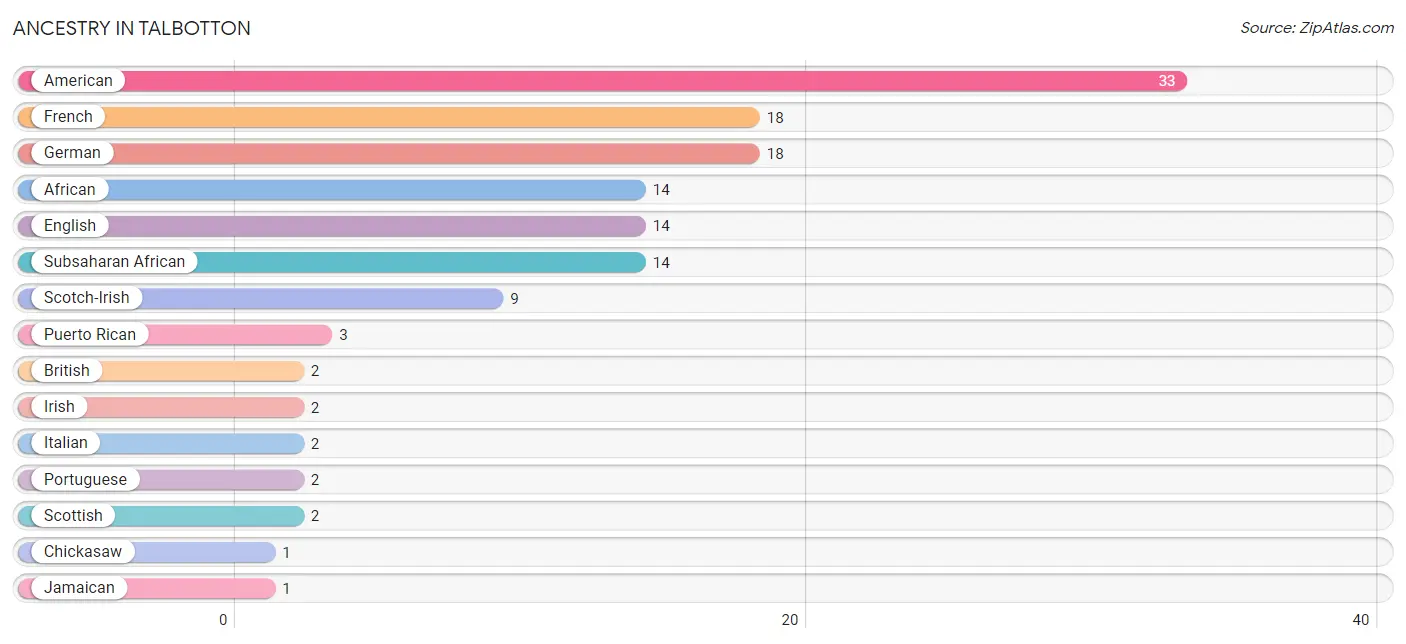
| Ancestry | # Population | % Population |
| African | 14 | 1.9% |
| American | 33 | 4.5% |
| British | 2 | 0.3% |
| Chickasaw | 1 | 0.1% |
| English | 14 | 1.9% |
| French | 18 | 2.5% |
| German | 18 | 2.5% |
| Irish | 2 | 0.3% |
| Italian | 2 | 0.3% |
| Jamaican | 1 | 0.1% |
| Portuguese | 2 | 0.3% |
| Puerto Rican | 3 | 0.4% |
| Scotch-Irish | 9 | 1.2% |
| Scottish | 2 | 0.3% |
| Subsaharan African | 14 | 1.9% | View All 15 Rows |
Immigrants in Talbotton
The most numerous immigrant groups reported in Talbotton came from Europe (2 | 0.3%), France (2 | 0.3%), and Western Europe (2 | 0.3%), together accounting for 0.8% of all Talbotton residents.
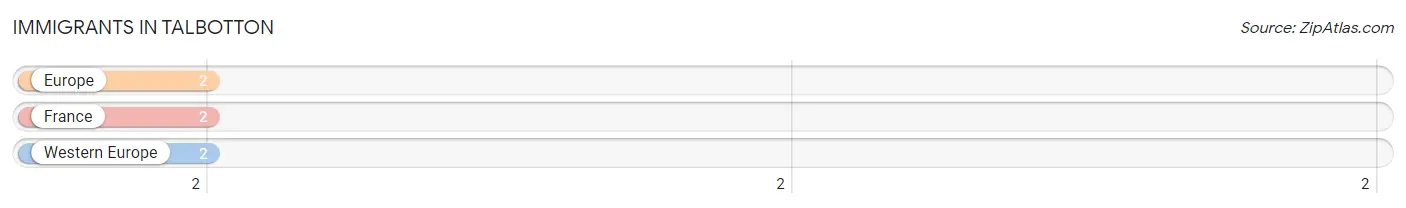
| Immigration Origin | # Population | % Population |
| Europe | 2 | 0.3% |
| France | 2 | 0.3% |
| Western Europe | 2 | 0.3% | View All 3 Rows |
Sex and Age in Talbotton
Sex and Age in Talbotton
The most populous age groups in Talbotton are 65 to 69 Years (102 | 29.3%) for men and 45 to 49 Years (38 | 10.0%) for women.
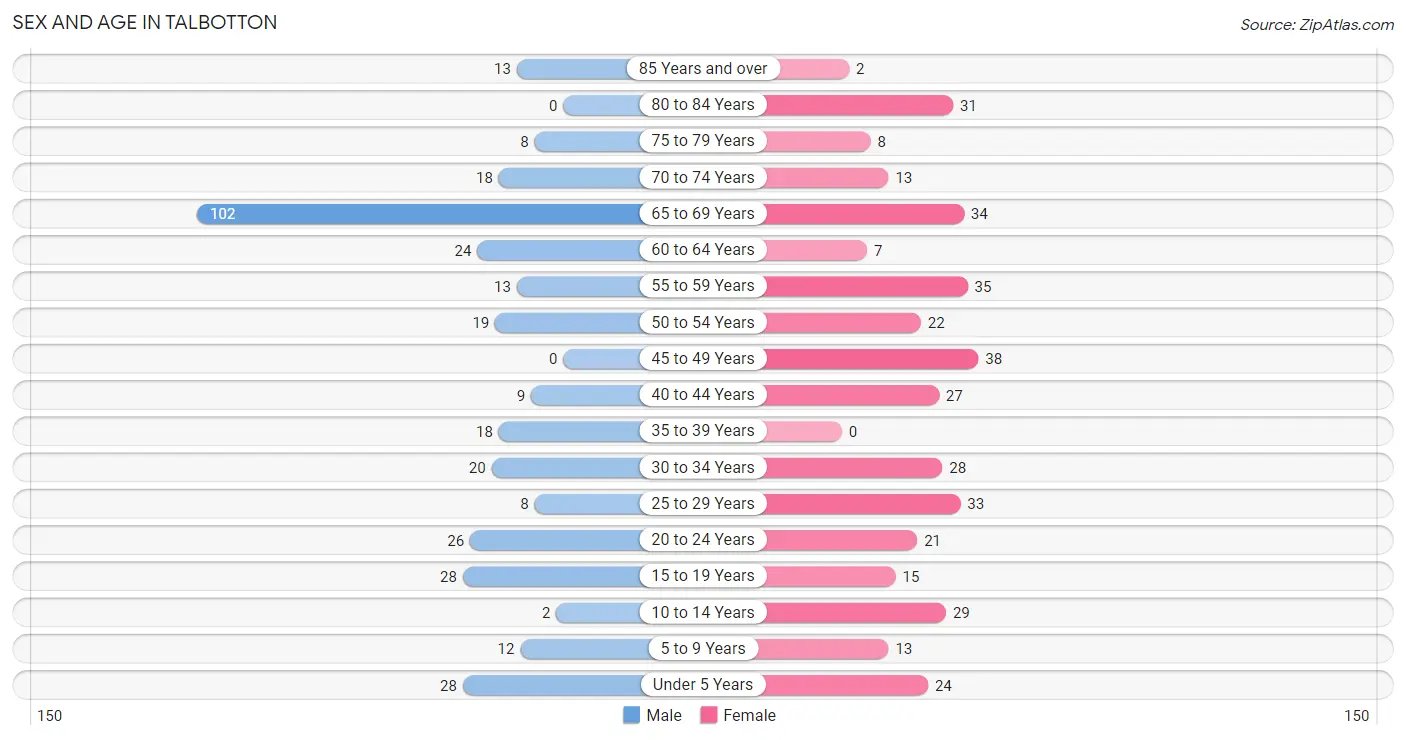
| Age Bracket | Male | Female |
| Under 5 Years | 28 (8.1%) | 24 (6.3%) |
| 5 to 9 Years | 12 (3.5%) | 13 (3.4%) |
| 10 to 14 Years | 2 (0.6%) | 29 (7.6%) |
| 15 to 19 Years | 28 (8.1%) | 15 (4.0%) |
| 20 to 24 Years | 26 (7.5%) | 21 (5.5%) |
| 25 to 29 Years | 8 (2.3%) | 33 (8.7%) |
| 30 to 34 Years | 20 (5.8%) | 28 (7.4%) |
| 35 to 39 Years | 18 (5.2%) | 0 (0.0%) |
| 40 to 44 Years | 9 (2.6%) | 27 (7.1%) |
| 45 to 49 Years | 0 (0.0%) | 38 (10.0%) |
| 50 to 54 Years | 19 (5.5%) | 22 (5.8%) |
| 55 to 59 Years | 13 (3.7%) | 35 (9.2%) |
| 60 to 64 Years | 24 (6.9%) | 7 (1.8%) |
| 65 to 69 Years | 102 (29.3%) | 34 (8.9%) |
| 70 to 74 Years | 18 (5.2%) | 13 (3.4%) |
| 75 to 79 Years | 8 (2.3%) | 8 (2.1%) |
| 80 to 84 Years | 0 (0.0%) | 31 (8.2%) |
| 85 Years and over | 13 (3.7%) | 2 (0.5%) |
| Total | 348 (100.0%) | 380 (100.0%) |
Families and Households in Talbotton
Median Family Size in Talbotton
The median family size in Talbotton is 2.80 persons per family, with single female/mother families (108 | 63.9%) accounting for the largest median family size of 2.9 persons per family. On the other hand, single male/father families (16 | 9.5%) represent the smallest median family size with 2.13 persons per family.
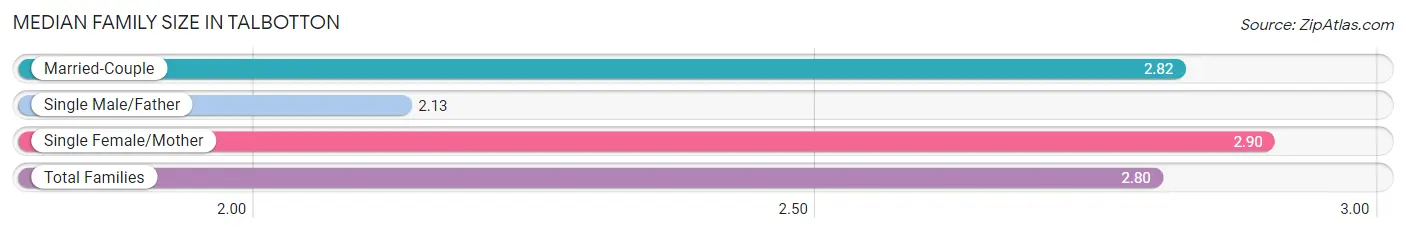
| Family Type | # Families | Family Size |
| Married-Couple | 45 (26.6%) | 2.82 |
| Single Male/Father | 16 (9.5%) | 2.13 |
| Single Female/Mother | 108 (63.9%) | 2.90 |
| Total Families | 169 (100.0%) | 2.80 |
Median Household Size in Talbotton
The median household size in Talbotton is 1.85 persons per household, with single female/mother households (108 | 28.5%) accounting for the largest median household size of 2.93 persons per household. non-family households (210 | 55.4%) represent the smallest median household size with 1.06 persons per household.
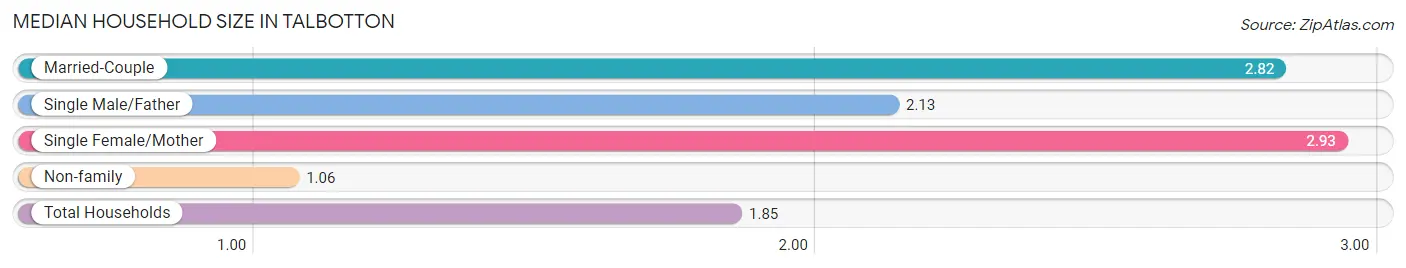
| Household Type | # Households | Household Size |
| Married-Couple | 45 (11.9%) | 2.82 |
| Single Male/Father | 16 (4.2%) | 2.13 |
| Single Female/Mother | 108 (28.5%) | 2.93 |
| Non-family | 210 (55.4%) | 1.06 |
| Total Households | 379 (100.0%) | 1.85 |
Household Size by Marriage Status in Talbotton
Out of a total of 379 households in Talbotton, 169 (44.6%) are family households, while 210 (55.4%) are nonfamily households. The most numerous type of family households are 2-person households, comprising 81, and the most common type of nonfamily households are 1-person households, comprising 199.
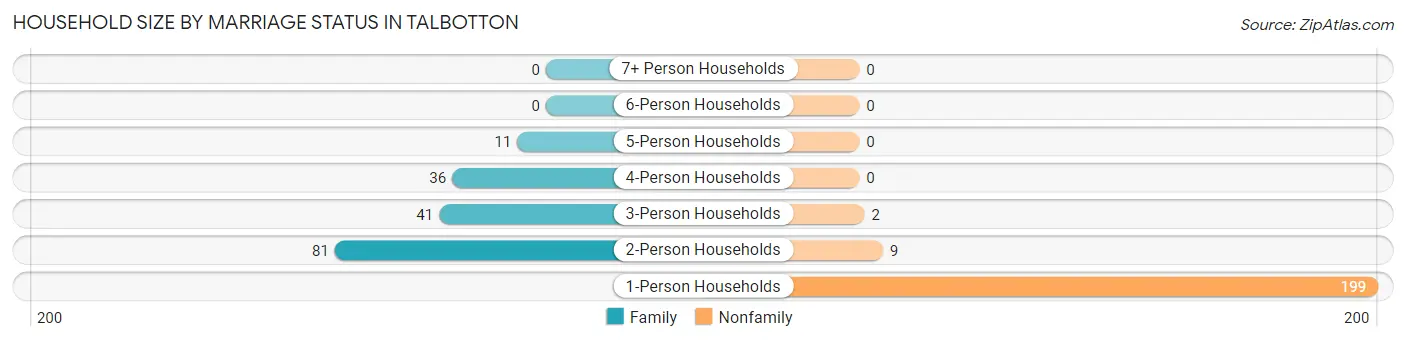
| Household Size | Family Households | Nonfamily Households |
| 1-Person Households | - | 199 (52.5%) |
| 2-Person Households | 81 (21.4%) | 9 (2.4%) |
| 3-Person Households | 41 (10.8%) | 2 (0.5%) |
| 4-Person Households | 36 (9.5%) | 0 (0.0%) |
| 5-Person Households | 11 (2.9%) | 0 (0.0%) |
| 6-Person Households | 0 (0.0%) | 0 (0.0%) |
| 7+ Person Households | 0 (0.0%) | 0 (0.0%) |
| Total | 169 (44.6%) | 210 (55.4%) |
Female Fertility in Talbotton
Fertility by Age in Talbotton
| Age Bracket | Women with Births | Births / 1,000 Women |
| 15 to 19 years | 0 (0.0%) | 0.0 |
| 20 to 34 years | 0 (0.0%) | 0.0 |
| 35 to 50 years | 0 (0.0%) | 0.0 |
| Total | 0 (0.0%) | 0.0 |
Fertility by Age by Marriage Status in Talbotton
| Age Bracket | Married | Unmarried |
| 15 to 19 years | 0 (0.0%) | 0 (0.0%) |
| 20 to 34 years | 0 (0.0%) | 0 (0.0%) |
| 35 to 50 years | 0 (0.0%) | 0 (0.0%) |
| Total | 0 (0.0%) | 0 (0.0%) |
Fertility by Education in Talbotton
| Educational Attainment | Women with Births | Births / 1,000 Women |
| Less than High School | 0 (0.0%) | 0.0 |
| High School Diploma | 0 (0.0%) | 0.0 |
| College or Associate's Degree | 0 (0.0%) | 0.0 |
| Bachelor's Degree | 0 (0.0%) | 0.0 |
| Graduate Degree | 0 (0.0%) | 0.0 |
| Total | 0 (0.0%) | 0.0 |
Fertility by Education by Marriage Status in Talbotton
| Educational Attainment | Married | Unmarried |
| Less than High School | 0 (0.0%) | 0 (0.0%) |
| High School Diploma | 0 (0.0%) | 0 (0.0%) |
| College or Associate's Degree | 0 (0.0%) | 0 (0.0%) |
| Bachelor's Degree | 0 (0.0%) | 0 (0.0%) |
| Graduate Degree | 0 (0.0%) | 0 (0.0%) |
| Total | 0 (0.0%) | 0 (0.0%) |
Employment Characteristics in Talbotton
Employment by Class of Employer in Talbotton
Among the 272 employed individuals in Talbotton, private company employees (216 | 79.4%), state government employees (28 | 10.3%), and federal government employees (12 | 4.4%) make up the most common classes of employment.
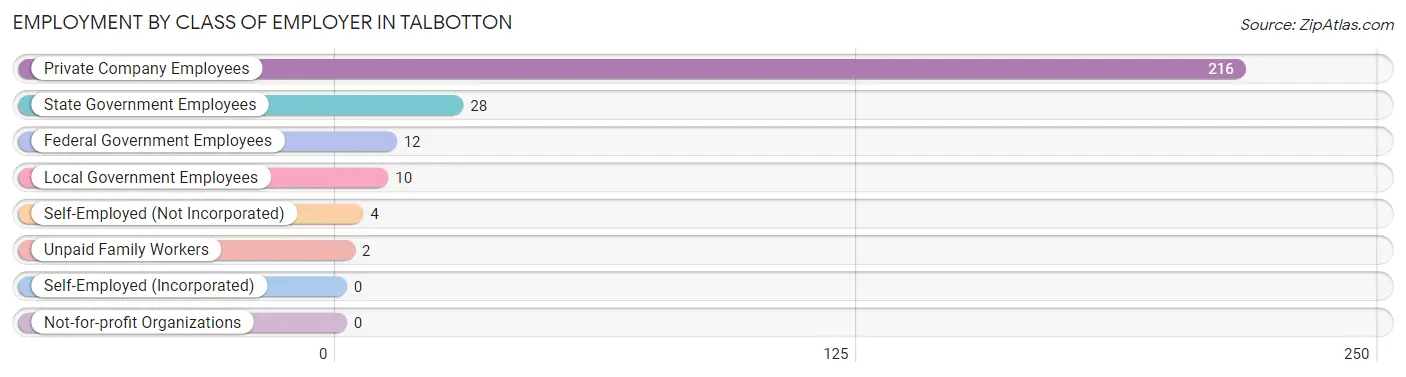
| Employer Class | # Employees | % Employees |
| Private Company Employees | 216 | 79.4% |
| Self-Employed (Incorporated) | 0 | 0.0% |
| Self-Employed (Not Incorporated) | 4 | 1.5% |
| Not-for-profit Organizations | 0 | 0.0% |
| Local Government Employees | 10 | 3.7% |
| State Government Employees | 28 | 10.3% |
| Federal Government Employees | 12 | 4.4% |
| Unpaid Family Workers | 2 | 0.7% |
| Total | 272 | 100.0% |
Employment Status by Age in Talbotton
According to the labor force statistics for Talbotton, out of the total population over 16 years of age (616), 47.7% or 294 individuals are in the labor force, with 7.5% or 22 of them unemployed. The age group with the highest labor force participation rate is 20 to 24 years, with 93.6% or 44 individuals in the labor force. Within the labor force, the 30 to 34 years age range has the highest percentage of unemployed individuals, with 60.0% or 18 of them being unemployed.
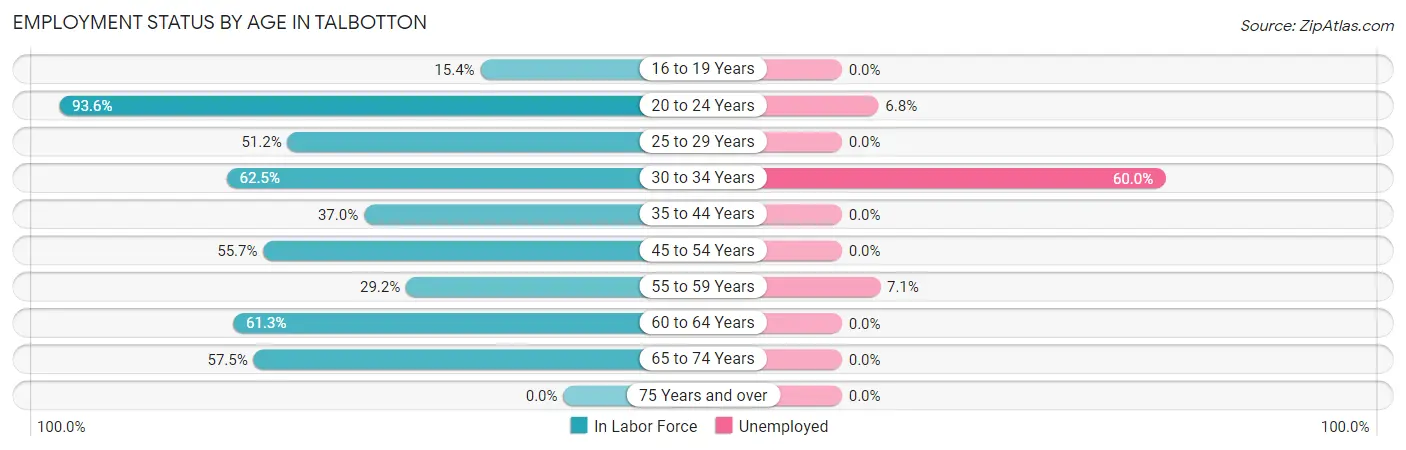
| Age Bracket | In Labor Force | Unemployed |
| 16 to 19 Years | 6 (15.4%) | 0 (0.0%) |
| 20 to 24 Years | 44 (93.6%) | 3 (6.8%) |
| 25 to 29 Years | 21 (51.2%) | 0 (0.0%) |
| 30 to 34 Years | 30 (62.5%) | 18 (60.0%) |
| 35 to 44 Years | 20 (37.0%) | 0 (0.0%) |
| 45 to 54 Years | 44 (55.7%) | 0 (0.0%) |
| 55 to 59 Years | 14 (29.2%) | 1 (7.1%) |
| 60 to 64 Years | 19 (61.3%) | 0 (0.0%) |
| 65 to 74 Years | 96 (57.5%) | 0 (0.0%) |
| 75 Years and over | 0 (0.0%) | 0 (0.0%) |
| Total | 294 (47.7%) | 22 (7.5%) |
Employment Status by Educational Attainment in Talbotton
According to labor force statistics for Talbotton, 49.2% of individuals (148) out of the total population between 25 and 64 years of age (301) are in the labor force, with 12.8% or 19 of them being unemployed. The group with the highest labor force participation rate are those with the educational attainment of high school diploma, with 61.8% or 105 individuals in the labor force. Within the labor force, individuals with less than high school education have the highest percentage of unemployment, with 75.0% or 6 of them being unemployed.
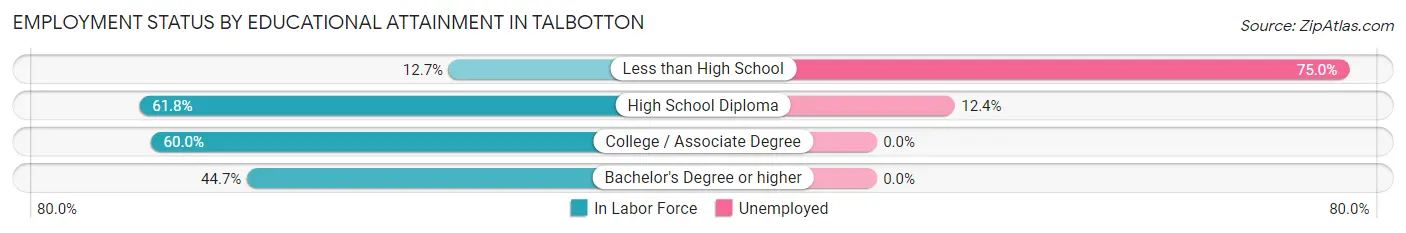
| Educational Attainment | In Labor Force | Unemployed |
| Less than High School | 8 (12.7%) | 47 (75.0%) |
| High School Diploma | 105 (61.8%) | 21 (12.4%) |
| College / Associate Degree | 18 (60.0%) | 0 (0.0%) |
| Bachelor's Degree or higher | 17 (44.7%) | 0 (0.0%) |
| Total | 148 (49.2%) | 39 (12.8%) |
Employment Occupations by Sex in Talbotton
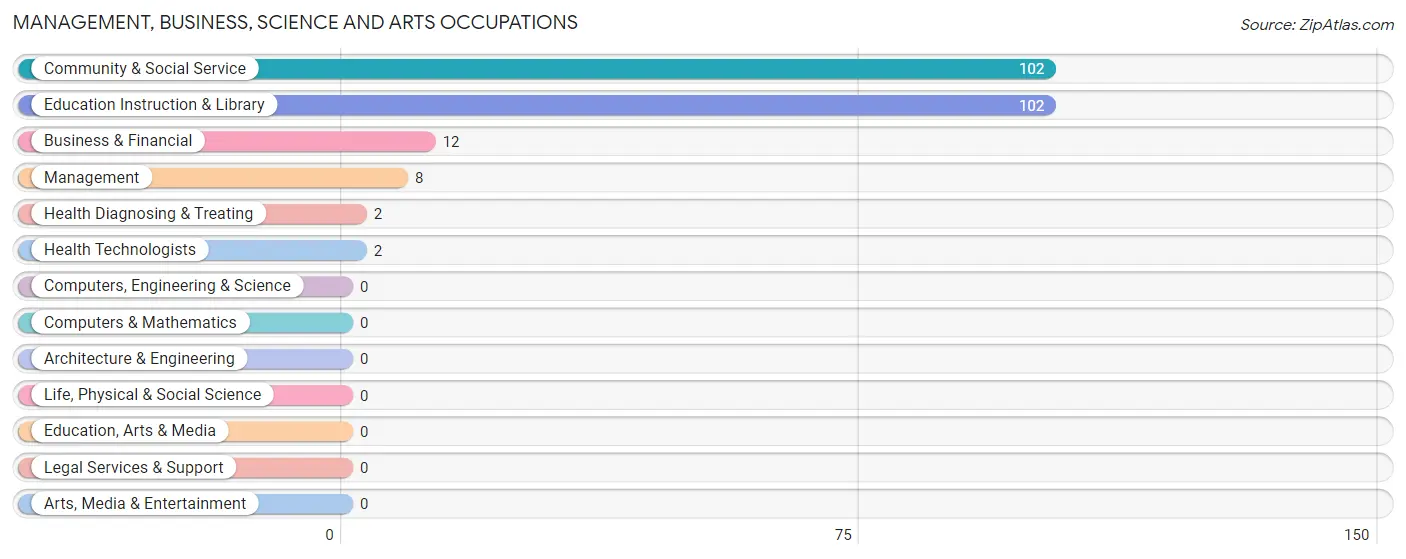
Management, Business, Science and Arts Occupations
The most common Management, Business, Science and Arts occupations in Talbotton are Community & Social Service (102 | 37.5%), Education Instruction & Library (102 | 37.5%), Business & Financial (12 | 4.4%), Management (8 | 2.9%), and Health Diagnosing & Treating (2 | 0.7%).
Management, Business, Science and Arts Occupations by Sex
Within the Management, Business, Science and Arts occupations in Talbotton, the most male-oriented occupations are Health Diagnosing & Treating (100.0%), Health Technologists (100.0%), and Community & Social Service (77.4%), while the most female-oriented occupations are Management (100.0%), Business & Financial (100.0%), and Community & Social Service (22.6%).
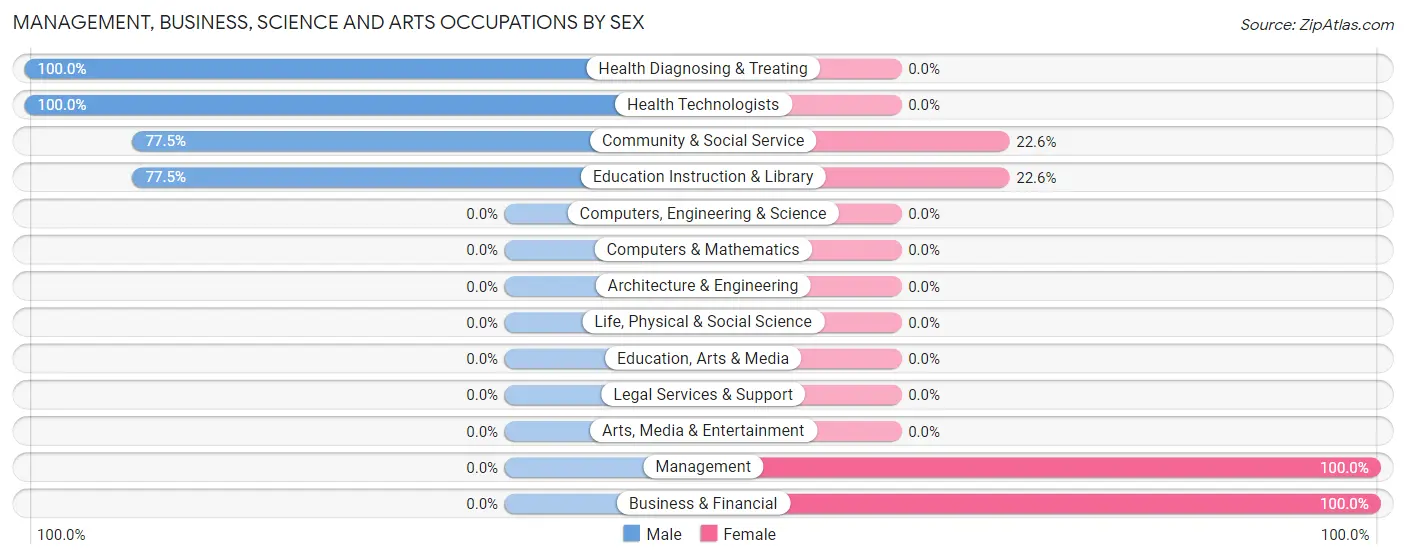
| Occupation | Male | Female |
| Management | 0 (0.0%) | 8 (100.0%) |
| Business & Financial | 0 (0.0%) | 12 (100.0%) |
| Computers, Engineering & Science | 0 (0.0%) | 0 (0.0%) |
| Computers & Mathematics | 0 (0.0%) | 0 (0.0%) |
| Architecture & Engineering | 0 (0.0%) | 0 (0.0%) |
| Life, Physical & Social Science | 0 (0.0%) | 0 (0.0%) |
| Community & Social Service | 79 (77.4%) | 23 (22.6%) |
| Education, Arts & Media | 0 (0.0%) | 0 (0.0%) |
| Legal Services & Support | 0 (0.0%) | 0 (0.0%) |
| Education Instruction & Library | 79 (77.4%) | 23 (22.6%) |
| Arts, Media & Entertainment | 0 (0.0%) | 0 (0.0%) |
| Health Diagnosing & Treating | 2 (100.0%) | 0 (0.0%) |
| Health Technologists | 2 (100.0%) | 0 (0.0%) |
| Total (Category) | 81 (65.3%) | 43 (34.7%) |
| Total (Overall) | 161 (59.2%) | 111 (40.8%) |
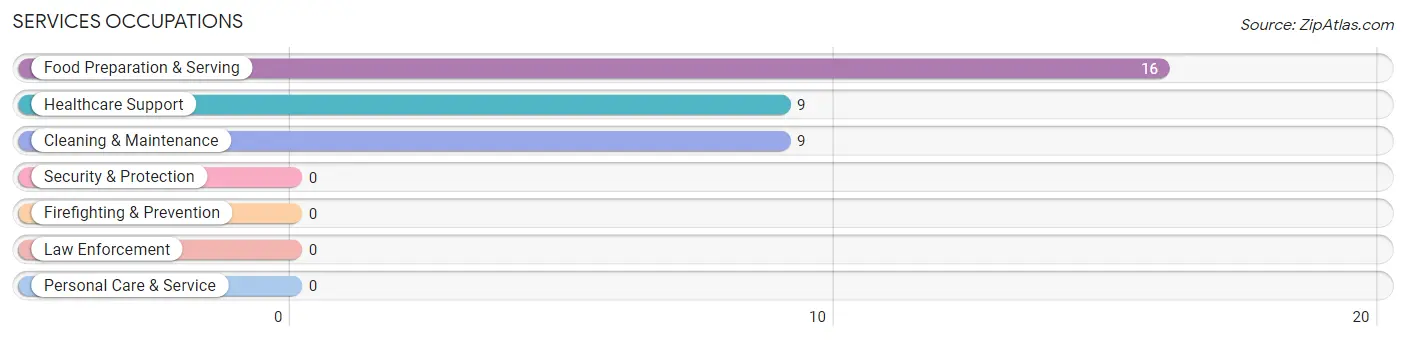
Services Occupations
The most common Services occupations in Talbotton are Food Preparation & Serving (16 | 5.9%), Healthcare Support (9 | 3.3%), and Cleaning & Maintenance (9 | 3.3%).
Services Occupations by Sex
Within the Services occupations in Talbotton, the most male-oriented occupations are Cleaning & Maintenance (100.0%), and Food Preparation & Serving (31.2%), while the most female-oriented occupations are Healthcare Support (100.0%), and Food Preparation & Serving (68.8%).
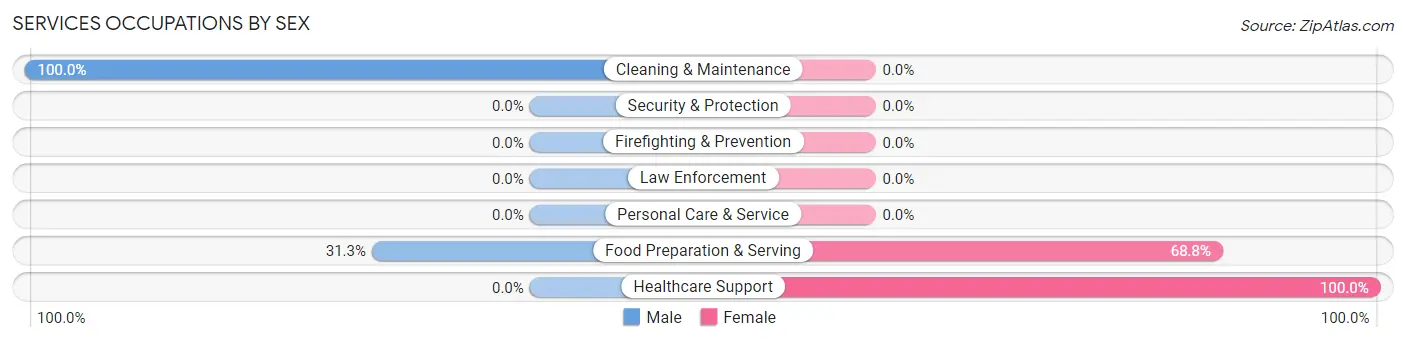
| Occupation | Male | Female |
| Healthcare Support | 0 (0.0%) | 9 (100.0%) |
| Security & Protection | 0 (0.0%) | 0 (0.0%) |
| Firefighting & Prevention | 0 (0.0%) | 0 (0.0%) |
| Law Enforcement | 0 (0.0%) | 0 (0.0%) |
| Food Preparation & Serving | 5 (31.2%) | 11 (68.8%) |
| Cleaning & Maintenance | 9 (100.0%) | 0 (0.0%) |
| Personal Care & Service | 0 (0.0%) | 0 (0.0%) |
| Total (Category) | 14 (41.2%) | 20 (58.8%) |
| Total (Overall) | 161 (59.2%) | 111 (40.8%) |
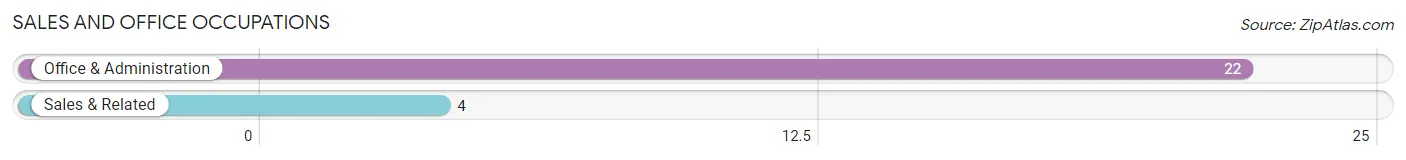
Sales and Office Occupations
The most common Sales and Office occupations in Talbotton are Office & Administration (22 | 8.1%), and Sales & Related (4 | 1.5%).
Sales and Office Occupations by Sex
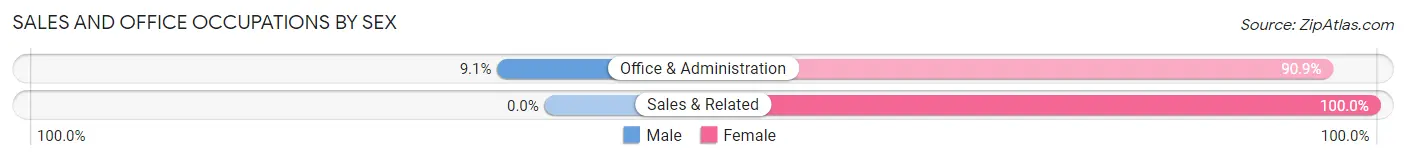
| Occupation | Male | Female |
| Sales & Related | 0 (0.0%) | 4 (100.0%) |
| Office & Administration | 2 (9.1%) | 20 (90.9%) |
| Total (Category) | 2 (7.7%) | 24 (92.3%) |
| Total (Overall) | 161 (59.2%) | 111 (40.8%) |
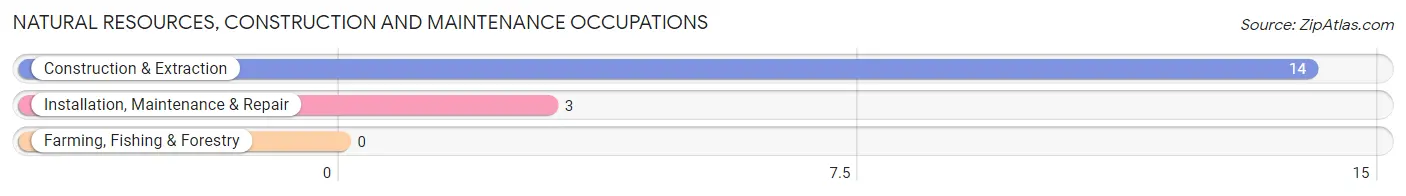
Natural Resources, Construction and Maintenance Occupations
The most common Natural Resources, Construction and Maintenance occupations in Talbotton are Construction & Extraction (14 | 5.1%), and Installation, Maintenance & Repair (3 | 1.1%).
Natural Resources, Construction and Maintenance Occupations by Sex
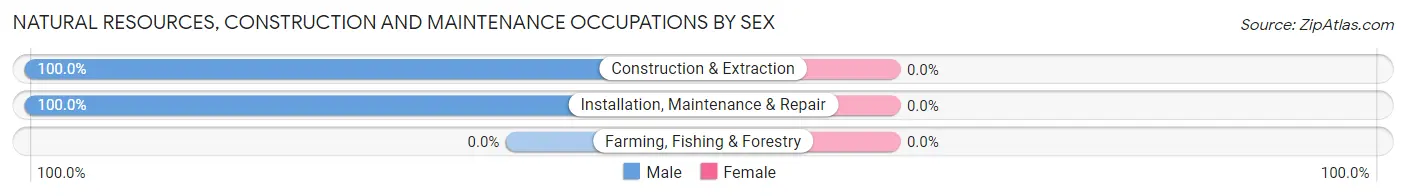
| Occupation | Male | Female |
| Farming, Fishing & Forestry | 0 (0.0%) | 0 (0.0%) |
| Construction & Extraction | 14 (100.0%) | 0 (0.0%) |
| Installation, Maintenance & Repair | 3 (100.0%) | 0 (0.0%) |
| Total (Category) | 17 (100.0%) | 0 (0.0%) |
| Total (Overall) | 161 (59.2%) | 111 (40.8%) |
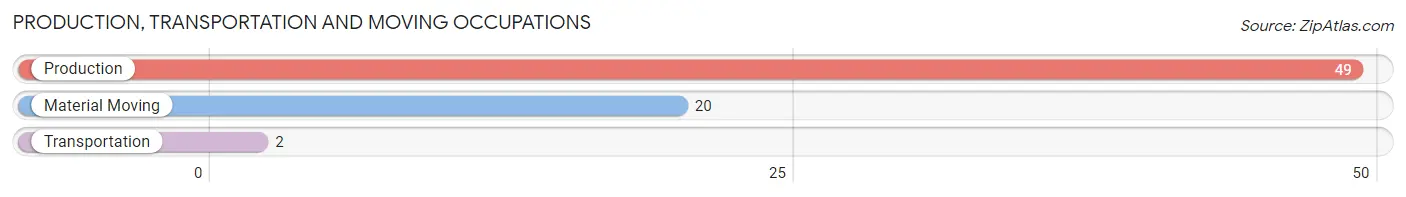
Production, Transportation and Moving Occupations
The most common Production, Transportation and Moving occupations in Talbotton are Production (49 | 18.0%), Material Moving (20 | 7.3%), and Transportation (2 | 0.7%).
Production, Transportation and Moving Occupations by Sex
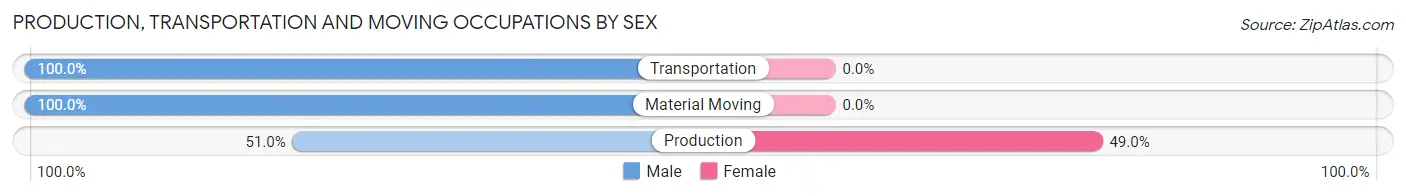
| Occupation | Male | Female |
| Production | 25 (51.0%) | 24 (49.0%) |
| Transportation | 2 (100.0%) | 0 (0.0%) |
| Material Moving | 20 (100.0%) | 0 (0.0%) |
| Total (Category) | 47 (66.2%) | 24 (33.8%) |
| Total (Overall) | 161 (59.2%) | 111 (40.8%) |
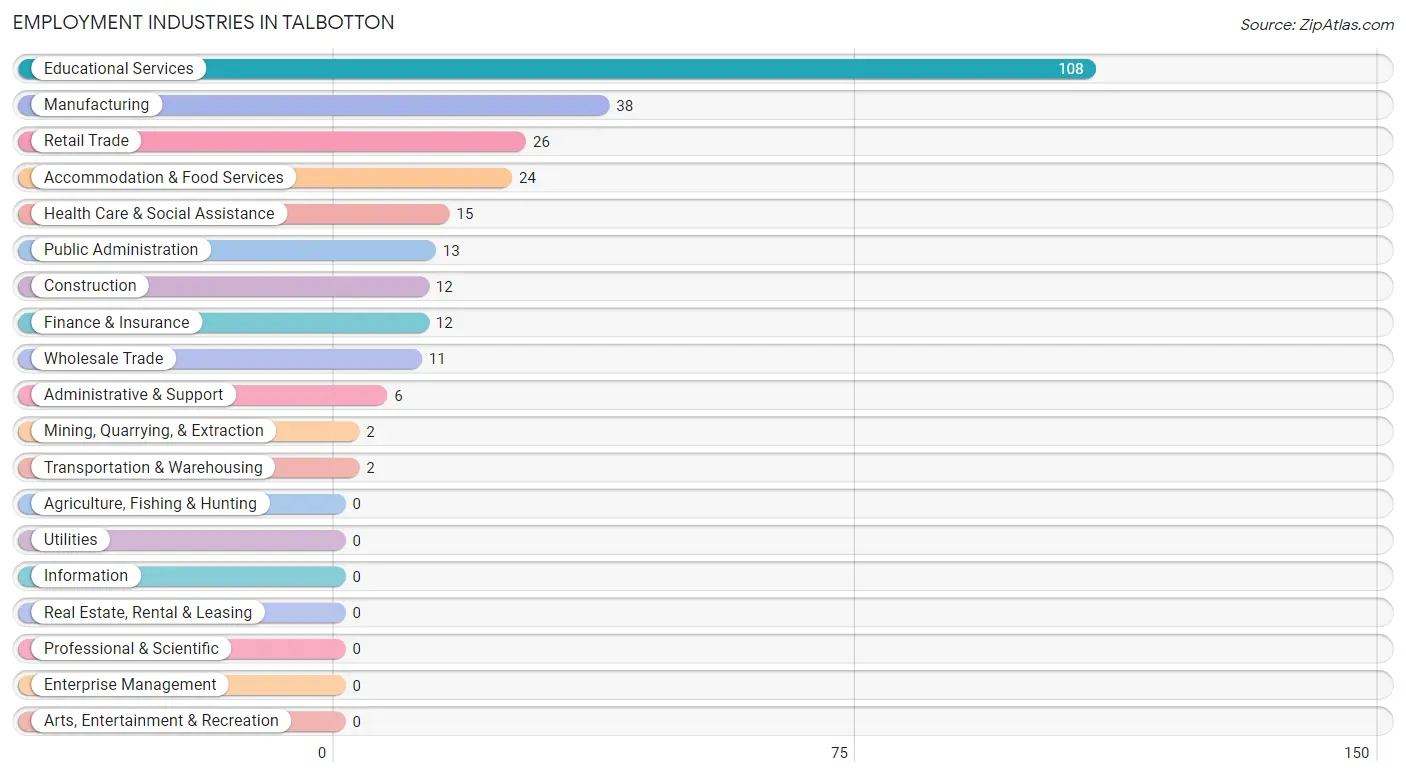
Employment Industries by Sex in Talbotton
Employment Industries in Talbotton
The major employment industries in Talbotton include Educational Services (108 | 39.7%), Manufacturing (38 | 14.0%), Retail Trade (26 | 9.6%), Accommodation & Food Services (24 | 8.8%), and Health Care & Social Assistance (15 | 5.5%).
Employment Industries by Sex in Talbotton
The Talbotton industries that see more men than women are Mining, Quarrying, & Extraction (100.0%), Construction (100.0%), and Wholesale Trade (100.0%), whereas the industries that tend to have a higher number of women are Finance & Insurance (100.0%), Public Administration (92.3%), and Health Care & Social Assistance (86.7%).
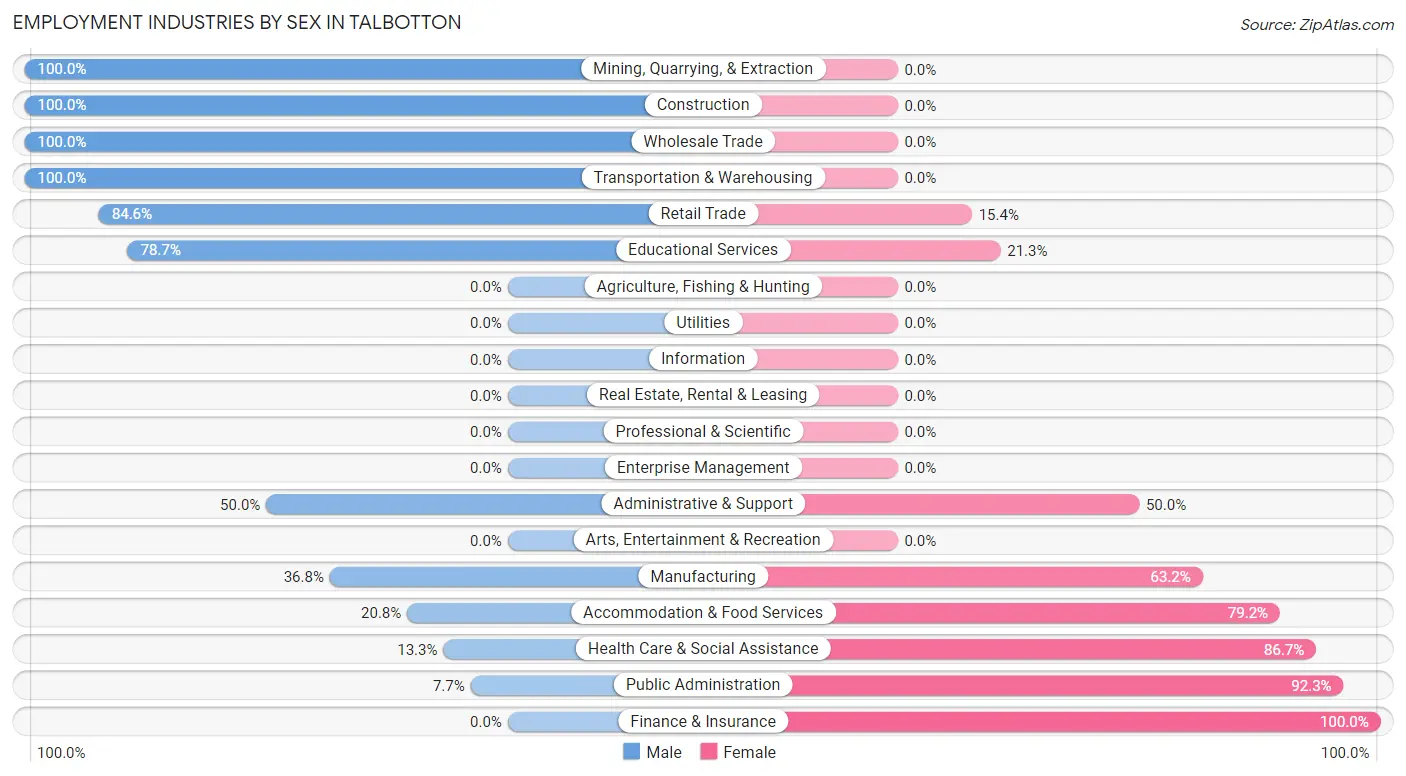
| Industry | Male | Female |
| Agriculture, Fishing & Hunting | 0 (0.0%) | 0 (0.0%) |
| Mining, Quarrying, & Extraction | 2 (100.0%) | 0 (0.0%) |
| Construction | 12 (100.0%) | 0 (0.0%) |
| Manufacturing | 14 (36.8%) | 24 (63.2%) |
| Wholesale Trade | 11 (100.0%) | 0 (0.0%) |
| Retail Trade | 22 (84.6%) | 4 (15.4%) |
| Transportation & Warehousing | 2 (100.0%) | 0 (0.0%) |
| Utilities | 0 (0.0%) | 0 (0.0%) |
| Information | 0 (0.0%) | 0 (0.0%) |
| Finance & Insurance | 0 (0.0%) | 12 (100.0%) |
| Real Estate, Rental & Leasing | 0 (0.0%) | 0 (0.0%) |
| Professional & Scientific | 0 (0.0%) | 0 (0.0%) |
| Enterprise Management | 0 (0.0%) | 0 (0.0%) |
| Administrative & Support | 3 (50.0%) | 3 (50.0%) |
| Educational Services | 85 (78.7%) | 23 (21.3%) |
| Health Care & Social Assistance | 2 (13.3%) | 13 (86.7%) |
| Arts, Entertainment & Recreation | 0 (0.0%) | 0 (0.0%) |
| Accommodation & Food Services | 5 (20.8%) | 19 (79.2%) |
| Public Administration | 1 (7.7%) | 12 (92.3%) |
| Total | 161 (59.2%) | 111 (40.8%) |
Education in Talbotton
School Enrollment in Talbotton
The most common levels of schooling among the 115 students in Talbotton are nursery / preschool (25 | 21.7%), middle school (24 | 20.9%), and high school (23 | 20.0%).
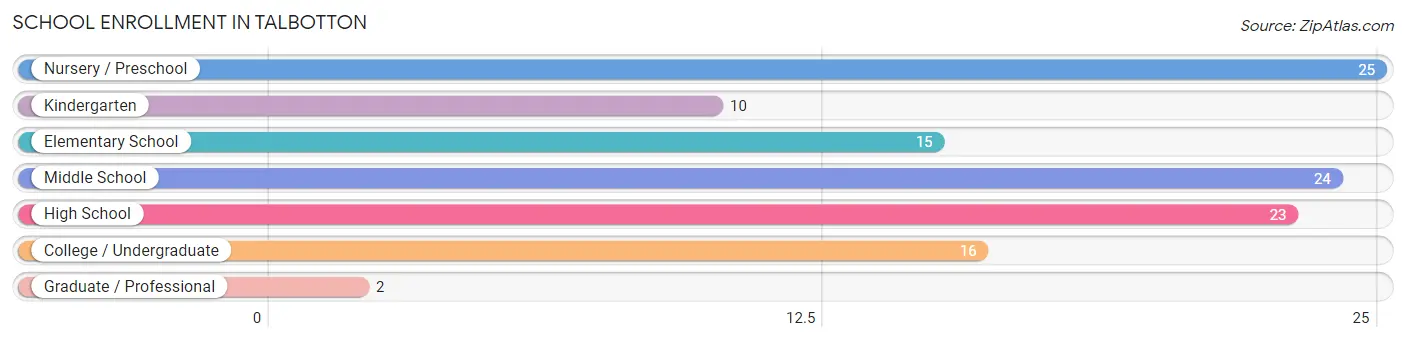
| School Level | # Students | % Students |
| Nursery / Preschool | 25 | 21.7% |
| Kindergarten | 10 | 8.7% |
| Elementary School | 15 | 13.0% |
| Middle School | 24 | 20.9% |
| High School | 23 | 20.0% |
| College / Undergraduate | 16 | 13.9% |
| Graduate / Professional | 2 | 1.7% |
| Total | 115 | 100.0% |
School Enrollment by Age by Funding Source in Talbotton
Out of a total of 115 students who are enrolled in schools in Talbotton, 3 (2.6%) attend a private institution, while the remaining 112 (97.4%) are enrolled in public schools. The age group of 5 to 9 year old has the highest likelihood of being enrolled in private schools, with 3 (12.0% in the age bracket) enrolled. Conversely, the age group of 3 to 4 year olds has the lowest likelihood of being enrolled in a private school, with 22 (100.0% in the age bracket) attending a public institution.
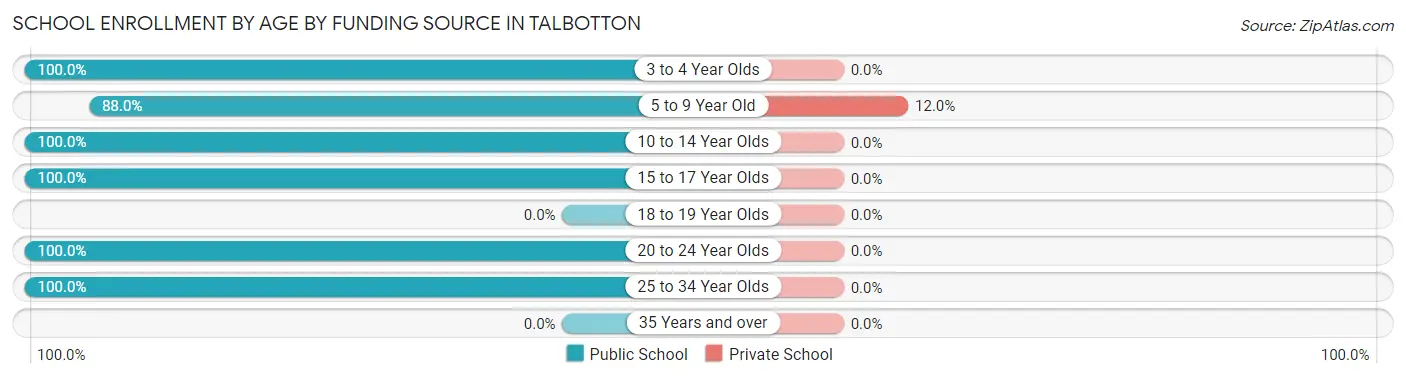
| Age Bracket | Public School | Private School |
| 3 to 4 Year Olds | 22 (100.0%) | 0 (0.0%) |
| 5 to 9 Year Old | 22 (88.0%) | 3 (12.0%) |
| 10 to 14 Year Olds | 31 (100.0%) | 0 (0.0%) |
| 15 to 17 Year Olds | 19 (100.0%) | 0 (0.0%) |
| 18 to 19 Year Olds | 0 (0.0%) | 0 (0.0%) |
| 20 to 24 Year Olds | 16 (100.0%) | 0 (0.0%) |
| 25 to 34 Year Olds | 2 (100.0%) | 0 (0.0%) |
| 35 Years and over | 0 (0.0%) | 0 (0.0%) |
| Total | 112 (97.4%) | 3 (2.6%) |
Educational Attainment by Field of Study in Talbotton
Education (18 | 39.1%), business (11 | 23.9%), arts & humanities (10 | 21.7%), computers & mathematics (2 | 4.3%), and social sciences (2 | 4.3%) are the most common fields of study among 46 individuals in Talbotton who have obtained a bachelor's degree or higher.
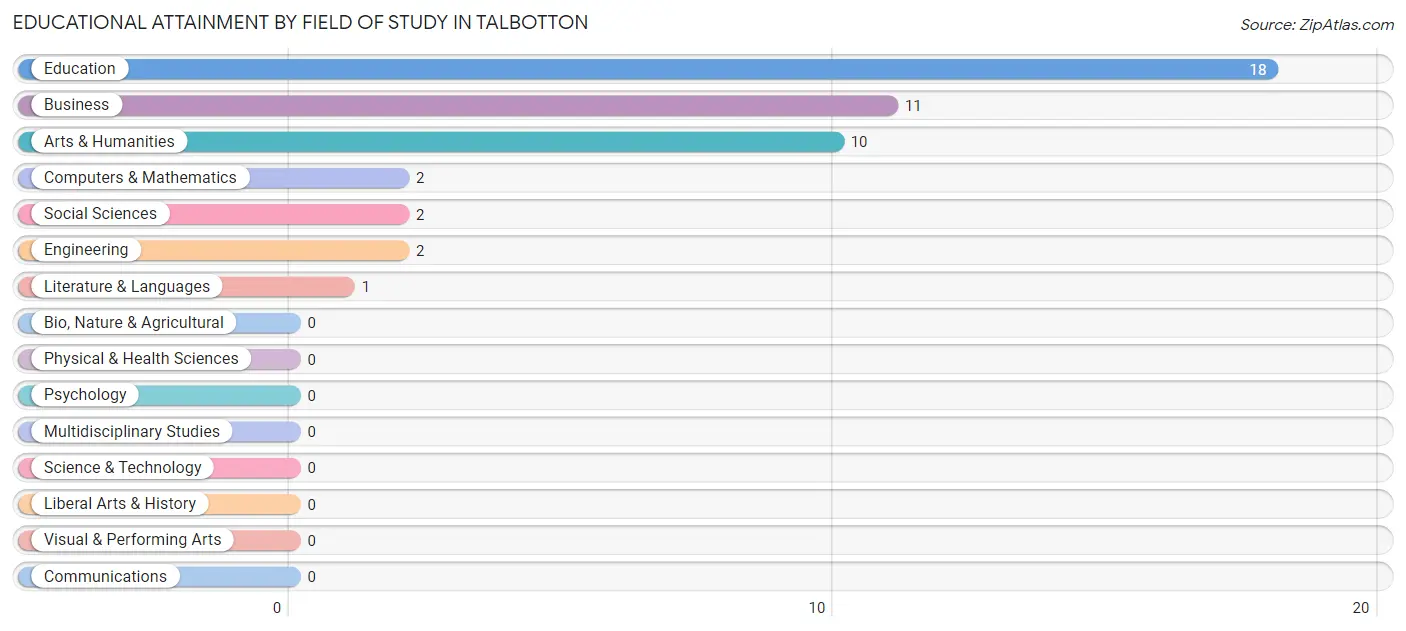
| Field of Study | # Graduates | % Graduates |
| Computers & Mathematics | 2 | 4.3% |
| Bio, Nature & Agricultural | 0 | 0.0% |
| Physical & Health Sciences | 0 | 0.0% |
| Psychology | 0 | 0.0% |
| Social Sciences | 2 | 4.3% |
| Engineering | 2 | 4.3% |
| Multidisciplinary Studies | 0 | 0.0% |
| Science & Technology | 0 | 0.0% |
| Business | 11 | 23.9% |
| Education | 18 | 39.1% |
| Literature & Languages | 1 | 2.2% |
| Liberal Arts & History | 0 | 0.0% |
| Visual & Performing Arts | 0 | 0.0% |
| Communications | 0 | 0.0% |
| Arts & Humanities | 10 | 21.7% |
| Total | 46 | 100.0% |
Transportation & Commute in Talbotton
Vehicle Availability by Sex in Talbotton
The most prevalent vehicle ownership categories in Talbotton are males with 1 vehicle (96, accounting for 59.6%) and females with 1 vehicle (29, making up 86.5%).
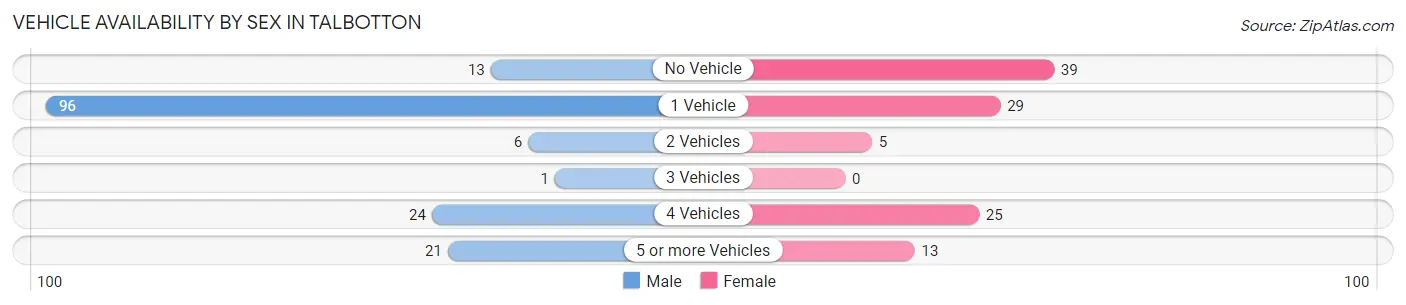
| Vehicles Available | Male | Female |
| No Vehicle | 13 (8.1%) | 39 (35.1%) |
| 1 Vehicle | 96 (59.6%) | 29 (26.1%) |
| 2 Vehicles | 6 (3.7%) | 5 (4.5%) |
| 3 Vehicles | 1 (0.6%) | 0 (0.0%) |
| 4 Vehicles | 24 (14.9%) | 25 (22.5%) |
| 5 or more Vehicles | 21 (13.0%) | 13 (11.7%) |
| Total | 161 (100.0%) | 111 (100.0%) |
Commute Time in Talbotton
The most frequently occuring commute durations in Talbotton are 90 or more minutes (83 commuters, 30.5%), 40 to 44 minutes (51 commuters, 18.8%), and 30 to 34 minutes (35 commuters, 12.9%).
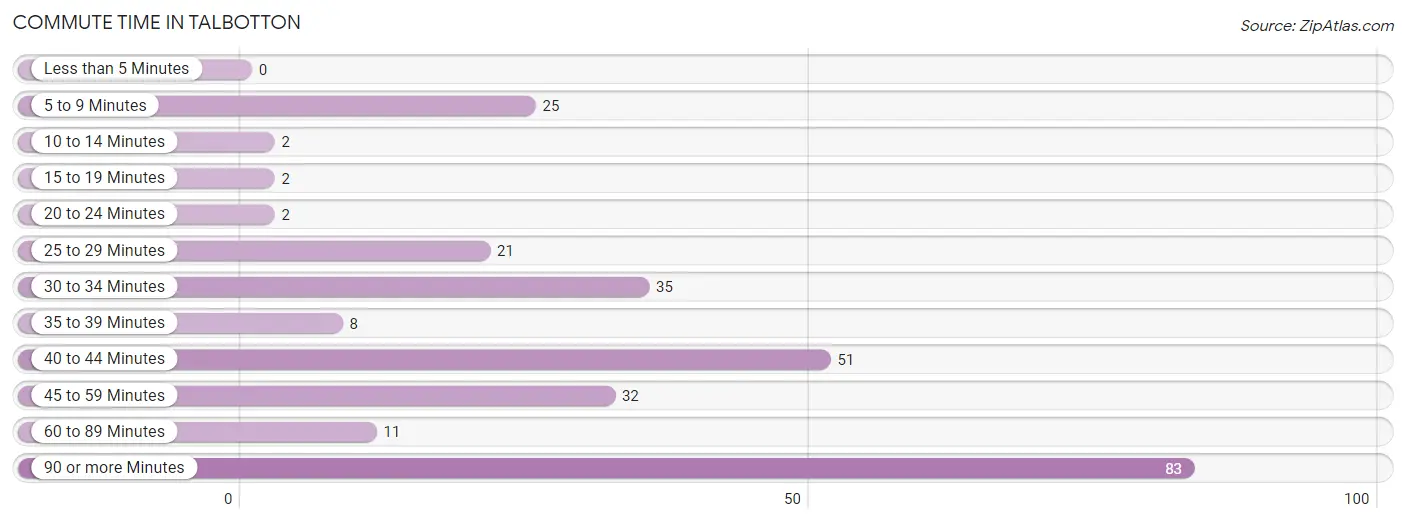
| Commute Time | # Commuters | % Commuters |
| Less than 5 Minutes | 0 | 0.0% |
| 5 to 9 Minutes | 25 | 9.2% |
| 10 to 14 Minutes | 2 | 0.7% |
| 15 to 19 Minutes | 2 | 0.7% |
| 20 to 24 Minutes | 2 | 0.7% |
| 25 to 29 Minutes | 21 | 7.7% |
| 30 to 34 Minutes | 35 | 12.9% |
| 35 to 39 Minutes | 8 | 2.9% |
| 40 to 44 Minutes | 51 | 18.8% |
| 45 to 59 Minutes | 32 | 11.8% |
| 60 to 89 Minutes | 11 | 4.0% |
| 90 or more Minutes | 83 | 30.5% |
Commute Time by Sex in Talbotton
The most common commute times in Talbotton are 90 or more minutes (83 commuters, 51.5%) for males and 30 to 34 minutes (31 commuters, 27.9%) for females.
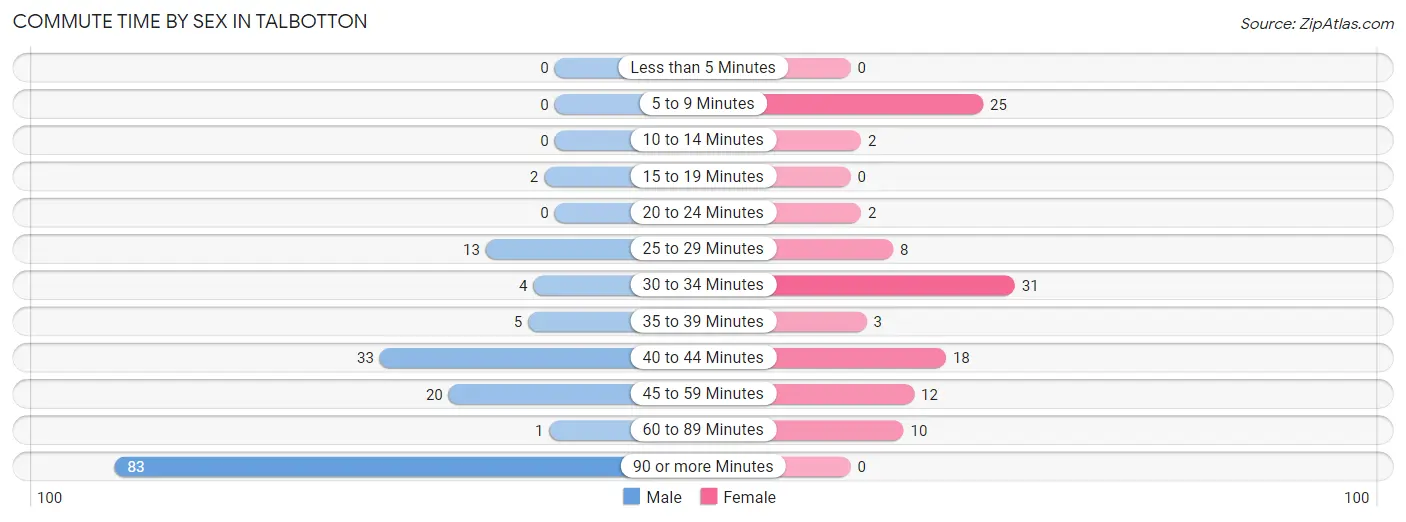
| Commute Time | Male | Female |
| Less than 5 Minutes | 0 (0.0%) | 0 (0.0%) |
| 5 to 9 Minutes | 0 (0.0%) | 25 (22.5%) |
| 10 to 14 Minutes | 0 (0.0%) | 2 (1.8%) |
| 15 to 19 Minutes | 2 (1.2%) | 0 (0.0%) |
| 20 to 24 Minutes | 0 (0.0%) | 2 (1.8%) |
| 25 to 29 Minutes | 13 (8.1%) | 8 (7.2%) |
| 30 to 34 Minutes | 4 (2.5%) | 31 (27.9%) |
| 35 to 39 Minutes | 5 (3.1%) | 3 (2.7%) |
| 40 to 44 Minutes | 33 (20.5%) | 18 (16.2%) |
| 45 to 59 Minutes | 20 (12.4%) | 12 (10.8%) |
| 60 to 89 Minutes | 1 (0.6%) | 10 (9.0%) |
| 90 or more Minutes | 83 (51.5%) | 0 (0.0%) |
Time of Departure to Work by Sex in Talbotton
The most frequent times of departure to work in Talbotton are 6:00 AM to 6:29 AM (102, 63.3%) for males and 8:00 AM to 8:29 AM (37, 33.3%) for females.
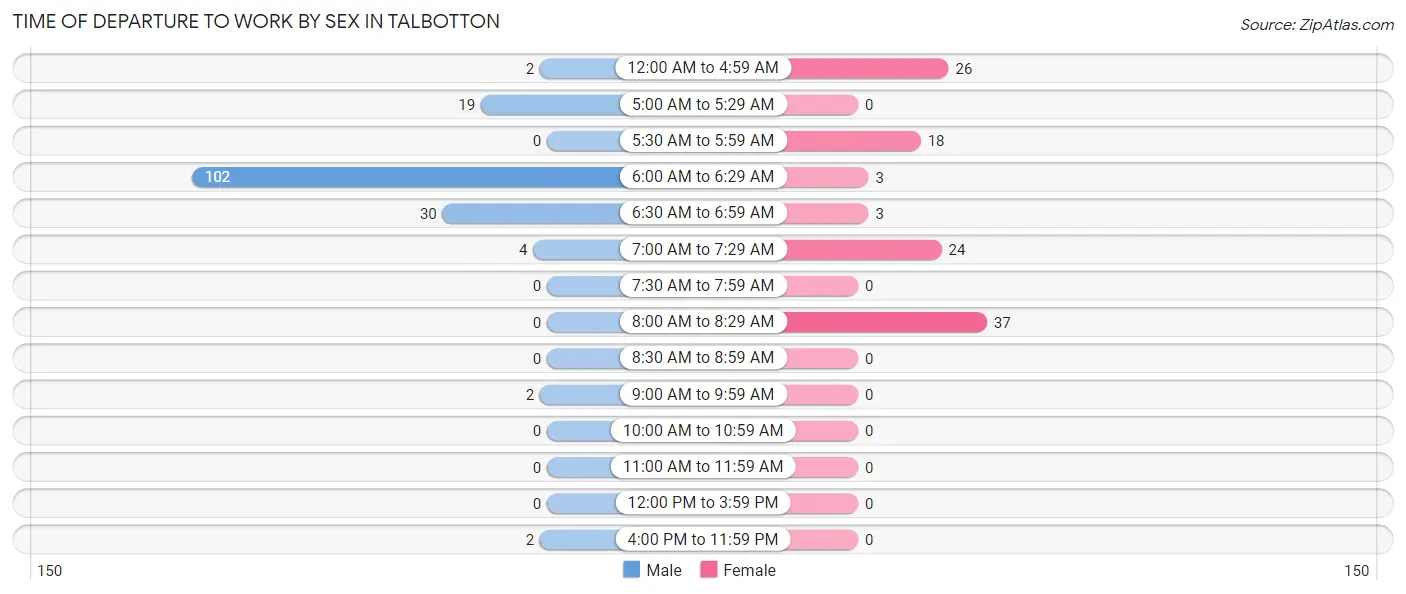
| Time of Departure | Male | Female |
| 12:00 AM to 4:59 AM | 2 (1.2%) | 26 (23.4%) |
| 5:00 AM to 5:29 AM | 19 (11.8%) | 0 (0.0%) |
| 5:30 AM to 5:59 AM | 0 (0.0%) | 18 (16.2%) |
| 6:00 AM to 6:29 AM | 102 (63.3%) | 3 (2.7%) |
| 6:30 AM to 6:59 AM | 30 (18.6%) | 3 (2.7%) |
| 7:00 AM to 7:29 AM | 4 (2.5%) | 24 (21.6%) |
| 7:30 AM to 7:59 AM | 0 (0.0%) | 0 (0.0%) |
| 8:00 AM to 8:29 AM | 0 (0.0%) | 37 (33.3%) |
| 8:30 AM to 8:59 AM | 0 (0.0%) | 0 (0.0%) |
| 9:00 AM to 9:59 AM | 2 (1.2%) | 0 (0.0%) |
| 10:00 AM to 10:59 AM | 0 (0.0%) | 0 (0.0%) |
| 11:00 AM to 11:59 AM | 0 (0.0%) | 0 (0.0%) |
| 12:00 PM to 3:59 PM | 0 (0.0%) | 0 (0.0%) |
| 4:00 PM to 11:59 PM | 2 (1.2%) | 0 (0.0%) |
| Total | 161 (100.0%) | 111 (100.0%) |
Housing Occupancy in Talbotton
Occupancy by Ownership in Talbotton
Of the total 379 dwellings in Talbotton, owner-occupied units account for 247 (65.2%), while renter-occupied units make up 132 (34.8%).
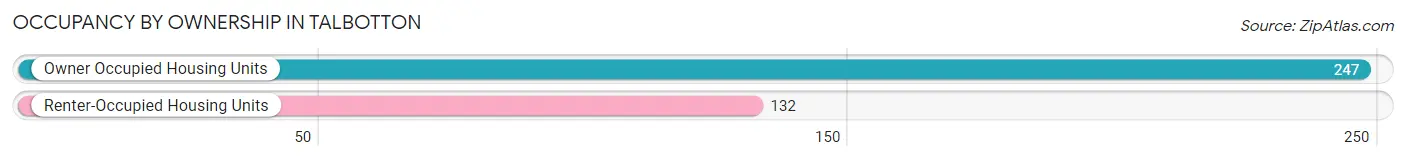
| Occupancy | # Housing Units | % Housing Units |
| Owner Occupied Housing Units | 247 | 65.2% |
| Renter-Occupied Housing Units | 132 | 34.8% |
| Total Occupied Housing Units | 379 | 100.0% |
Occupancy by Household Size in Talbotton
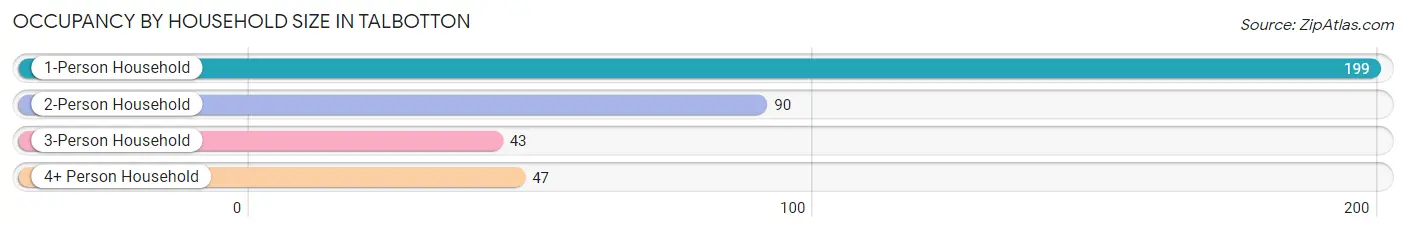
| Household Size | # Housing Units | % Housing Units |
| 1-Person Household | 199 | 52.5% |
| 2-Person Household | 90 | 23.7% |
| 3-Person Household | 43 | 11.4% |
| 4+ Person Household | 47 | 12.4% |
| Total Housing Units | 379 | 100.0% |
Occupancy by Ownership by Household Size in Talbotton
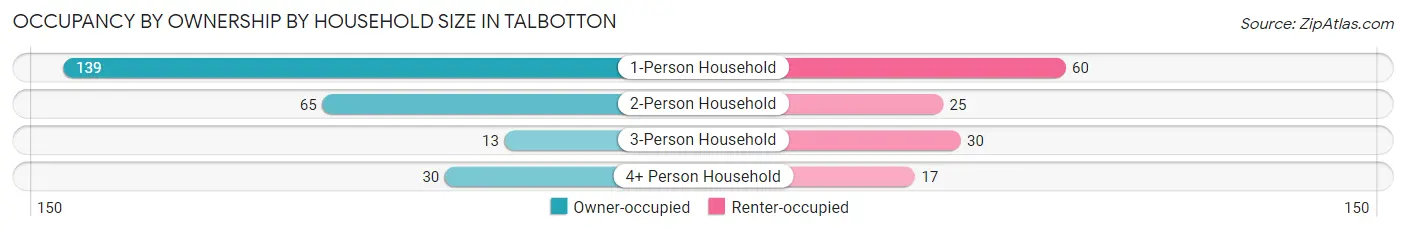
| Household Size | Owner-occupied | Renter-occupied |
| 1-Person Household | 139 (69.9%) | 60 (30.1%) |
| 2-Person Household | 65 (72.2%) | 25 (27.8%) |
| 3-Person Household | 13 (30.2%) | 30 (69.8%) |
| 4+ Person Household | 30 (63.8%) | 17 (36.2%) |
| Total Housing Units | 247 (65.2%) | 132 (34.8%) |
Occupancy by Educational Attainment in Talbotton
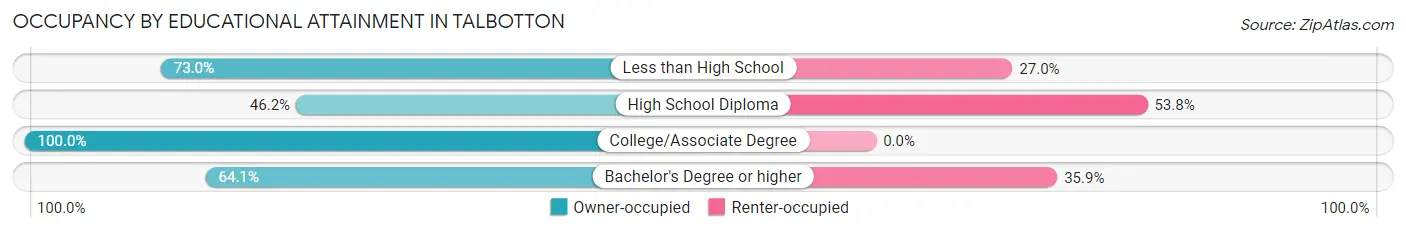
| Household Size | Owner-occupied | Renter-occupied |
| Less than High School | 127 (73.0%) | 47 (27.0%) |
| High School Diploma | 61 (46.2%) | 71 (53.8%) |
| College/Associate Degree | 34 (100.0%) | 0 (0.0%) |
| Bachelor's Degree or higher | 25 (64.1%) | 14 (35.9%) |
Occupancy by Age of Householder in Talbotton
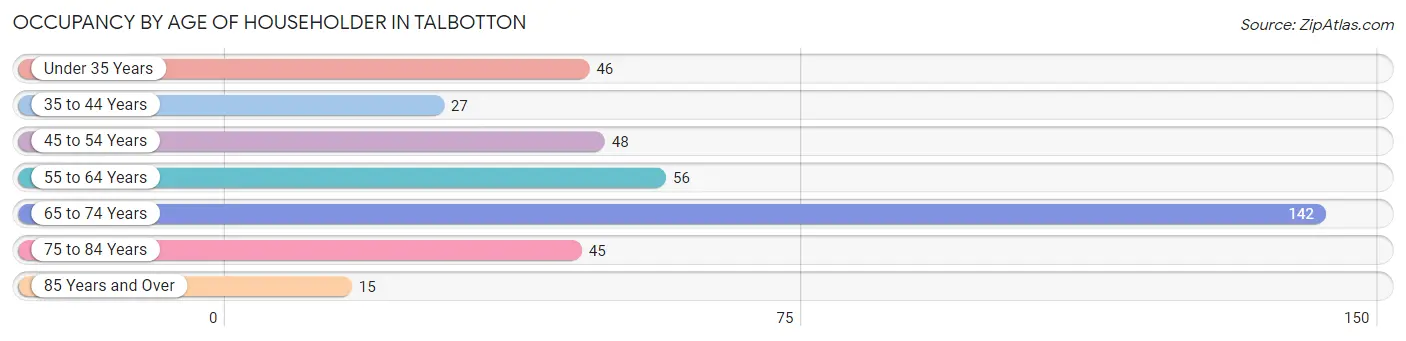
| Age Bracket | # Households | % Households |
| Under 35 Years | 46 | 12.1% |
| 35 to 44 Years | 27 | 7.1% |
| 45 to 54 Years | 48 | 12.7% |
| 55 to 64 Years | 56 | 14.8% |
| 65 to 74 Years | 142 | 37.5% |
| 75 to 84 Years | 45 | 11.9% |
| 85 Years and Over | 15 | 4.0% |
| Total | 379 | 100.0% |
Housing Finances in Talbotton
Median Income by Occupancy in Talbotton
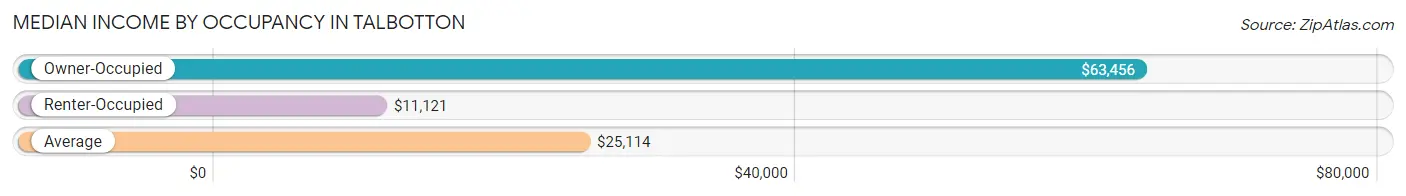
| Occupancy Type | # Households | Median Income |
| Owner-Occupied | 247 (65.2%) | $63,456 |
| Renter-Occupied | 132 (34.8%) | $11,121 |
| Average | 379 (100.0%) | $25,114 |
Occupancy by Householder Income Bracket in Talbotton
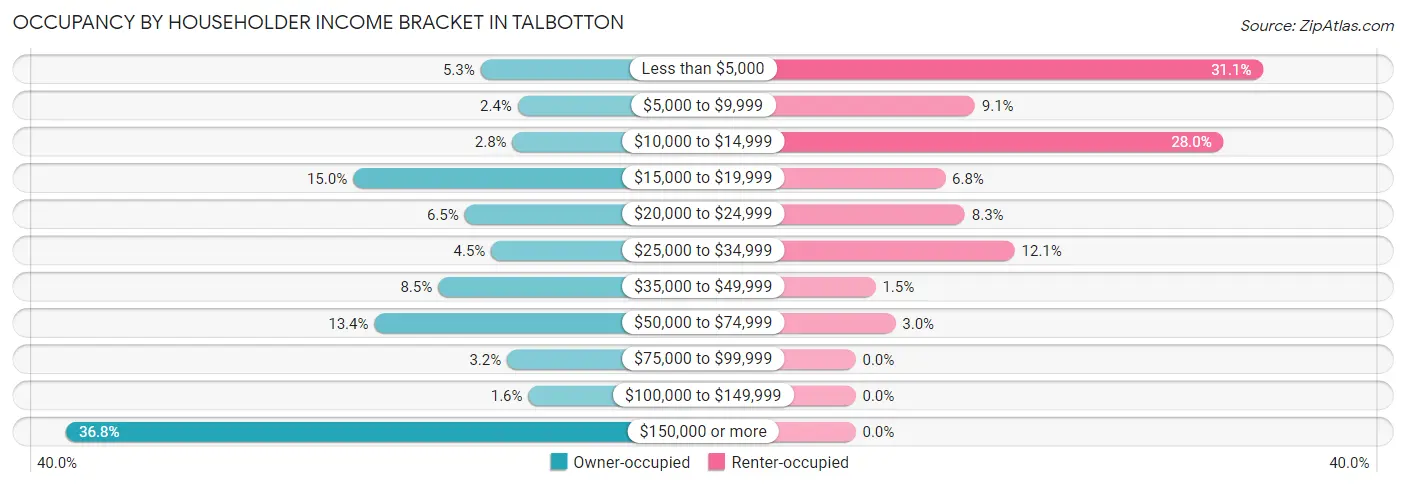
| Income Bracket | Owner-occupied | Renter-occupied |
| Less than $5,000 | 13 (5.3%) | 41 (31.1%) |
| $5,000 to $9,999 | 6 (2.4%) | 12 (9.1%) |
| $10,000 to $14,999 | 7 (2.8%) | 37 (28.0%) |
| $15,000 to $19,999 | 37 (15.0%) | 9 (6.8%) |
| $20,000 to $24,999 | 16 (6.5%) | 11 (8.3%) |
| $25,000 to $34,999 | 11 (4.4%) | 16 (12.1%) |
| $35,000 to $49,999 | 21 (8.5%) | 2 (1.5%) |
| $50,000 to $74,999 | 33 (13.4%) | 4 (3.0%) |
| $75,000 to $99,999 | 8 (3.2%) | 0 (0.0%) |
| $100,000 to $149,999 | 4 (1.6%) | 0 (0.0%) |
| $150,000 or more | 91 (36.8%) | 0 (0.0%) |
| Total | 247 (100.0%) | 132 (100.0%) |
Monthly Housing Cost Tiers in Talbotton
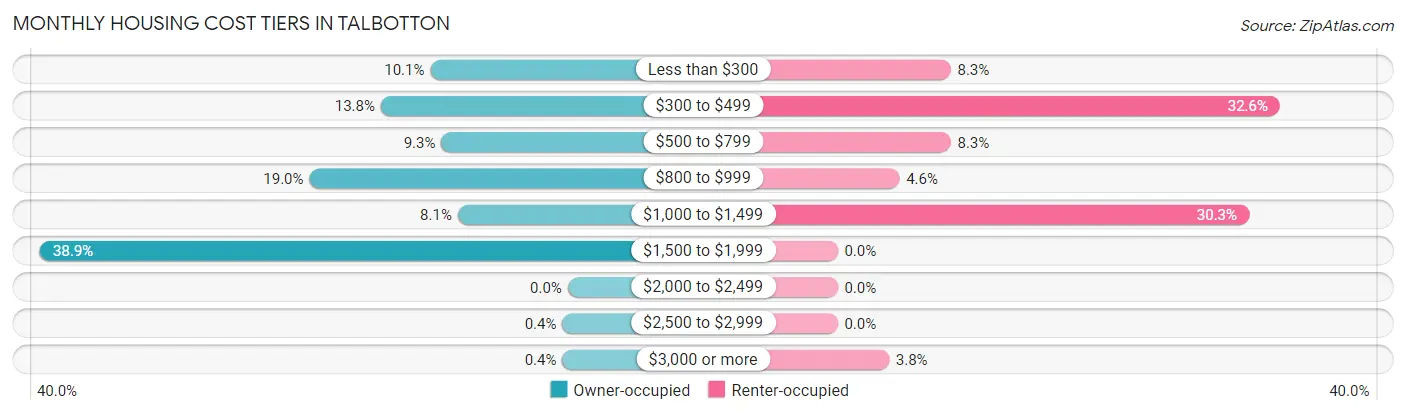
| Monthly Cost | Owner-occupied | Renter-occupied |
| Less than $300 | 25 (10.1%) | 11 (8.3%) |
| $300 to $499 | 34 (13.8%) | 43 (32.6%) |
| $500 to $799 | 23 (9.3%) | 11 (8.3%) |
| $800 to $999 | 47 (19.0%) | 6 (4.5%) |
| $1,000 to $1,499 | 20 (8.1%) | 40 (30.3%) |
| $1,500 to $1,999 | 96 (38.9%) | 0 (0.0%) |
| $2,000 to $2,499 | 0 (0.0%) | 0 (0.0%) |
| $2,500 to $2,999 | 1 (0.4%) | 0 (0.0%) |
| $3,000 or more | 1 (0.4%) | 5 (3.8%) |
| Total | 247 (100.0%) | 132 (100.0%) |
Physical Housing Characteristics in Talbotton
Housing Structures in Talbotton
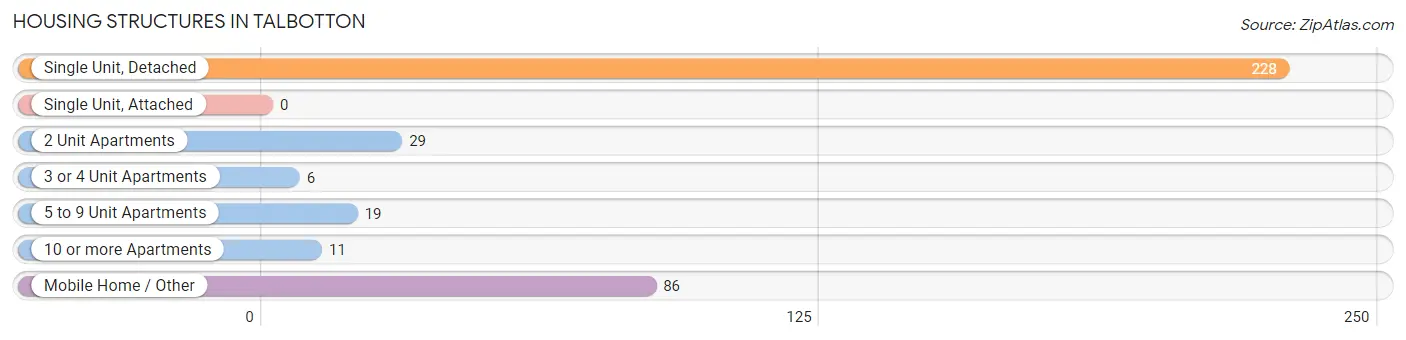
| Structure Type | # Housing Units | % Housing Units |
| Single Unit, Detached | 228 | 60.2% |
| Single Unit, Attached | 0 | 0.0% |
| 2 Unit Apartments | 29 | 7.6% |
| 3 or 4 Unit Apartments | 6 | 1.6% |
| 5 to 9 Unit Apartments | 19 | 5.0% |
| 10 or more Apartments | 11 | 2.9% |
| Mobile Home / Other | 86 | 22.7% |
| Total | 379 | 100.0% |
Housing Structures by Occupancy in Talbotton
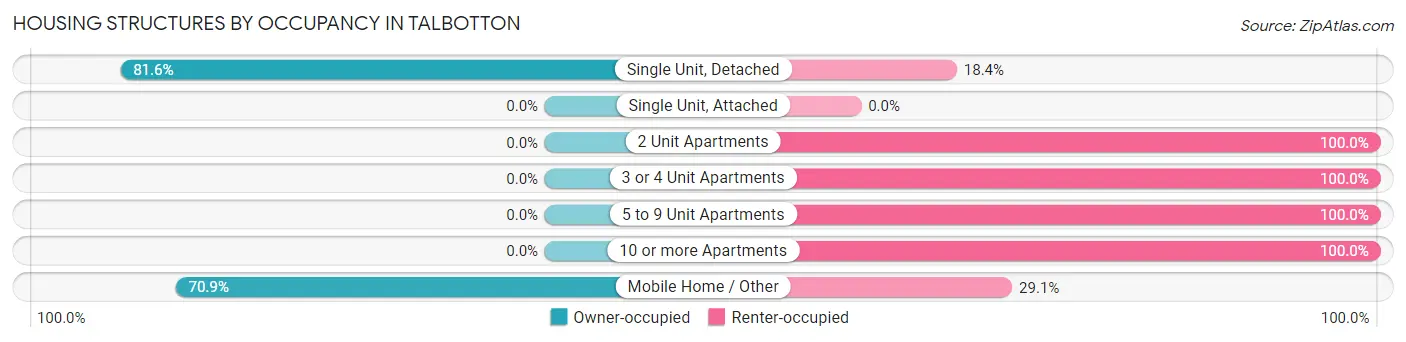
| Structure Type | Owner-occupied | Renter-occupied |
| Single Unit, Detached | 186 (81.6%) | 42 (18.4%) |
| Single Unit, Attached | 0 (0.0%) | 0 (0.0%) |
| 2 Unit Apartments | 0 (0.0%) | 29 (100.0%) |
| 3 or 4 Unit Apartments | 0 (0.0%) | 6 (100.0%) |
| 5 to 9 Unit Apartments | 0 (0.0%) | 19 (100.0%) |
| 10 or more Apartments | 0 (0.0%) | 11 (100.0%) |
| Mobile Home / Other | 61 (70.9%) | 25 (29.1%) |
| Total | 247 (65.2%) | 132 (34.8%) |
Housing Structures by Number of Rooms in Talbotton
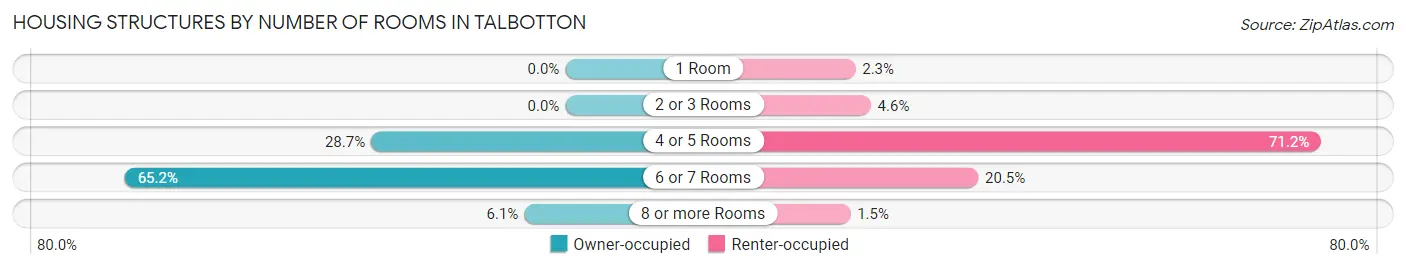
| Number of Rooms | Owner-occupied | Renter-occupied |
| 1 Room | 0 (0.0%) | 3 (2.3%) |
| 2 or 3 Rooms | 0 (0.0%) | 6 (4.5%) |
| 4 or 5 Rooms | 71 (28.7%) | 94 (71.2%) |
| 6 or 7 Rooms | 161 (65.2%) | 27 (20.4%) |
| 8 or more Rooms | 15 (6.1%) | 2 (1.5%) |
| Total | 247 (100.0%) | 132 (100.0%) |
Housing Structure by Heating Type in Talbotton
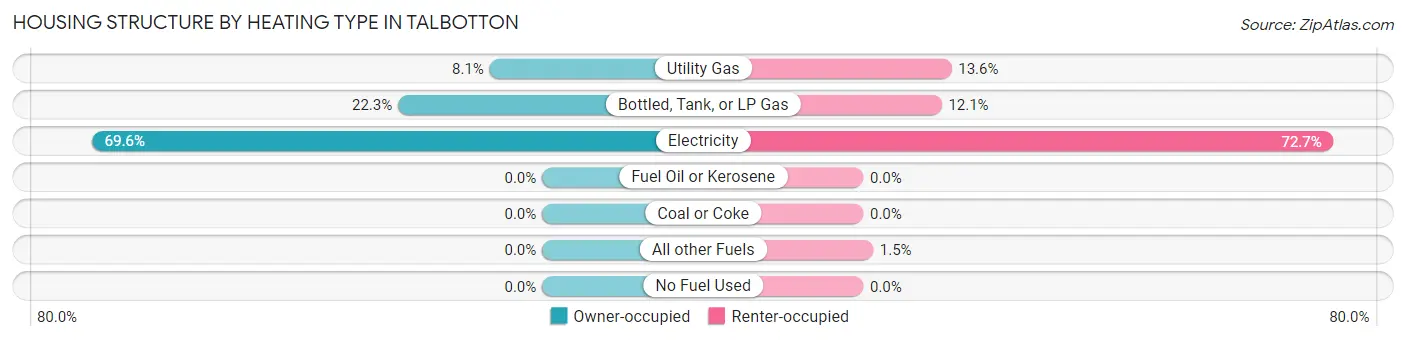
| Heating Type | Owner-occupied | Renter-occupied |
| Utility Gas | 20 (8.1%) | 18 (13.6%) |
| Bottled, Tank, or LP Gas | 55 (22.3%) | 16 (12.1%) |
| Electricity | 172 (69.6%) | 96 (72.7%) |
| Fuel Oil or Kerosene | 0 (0.0%) | 0 (0.0%) |
| Coal or Coke | 0 (0.0%) | 0 (0.0%) |
| All other Fuels | 0 (0.0%) | 2 (1.5%) |
| No Fuel Used | 0 (0.0%) | 0 (0.0%) |
| Total | 247 (100.0%) | 132 (100.0%) |
Household Vehicle Usage in Talbotton
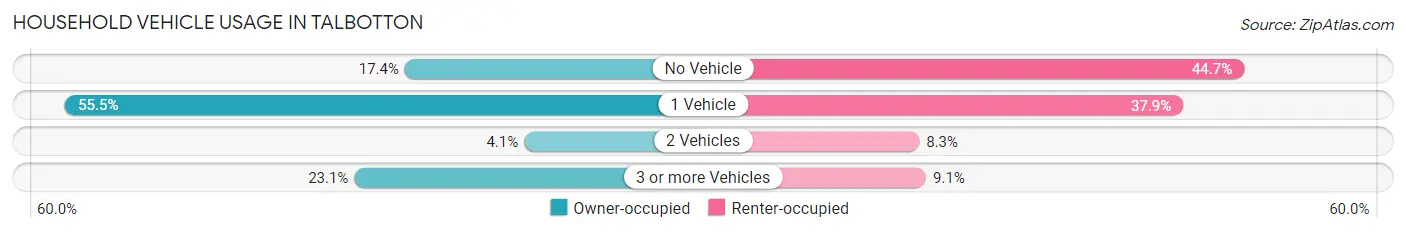
| Vehicles per Household | Owner-occupied | Renter-occupied |
| No Vehicle | 43 (17.4%) | 59 (44.7%) |
| 1 Vehicle | 137 (55.5%) | 50 (37.9%) |
| 2 Vehicles | 10 (4.1%) | 11 (8.3%) |
| 3 or more Vehicles | 57 (23.1%) | 12 (9.1%) |
| Total | 247 (100.0%) | 132 (100.0%) |
Real Estate & Mortgages in Talbotton
Real Estate and Mortgage Overview in Talbotton
| Characteristic | Without Mortgage | With Mortgage |
| Housing Units | 81 | 166 |
| Median Property Value | $63,800 | $257,700 |
| Median Household Income | $17,431 | $91 |
| Monthly Housing Costs | $366 | $1 |
| Real Estate Taxes | - | - |
Property Value by Mortgage Status in Talbotton
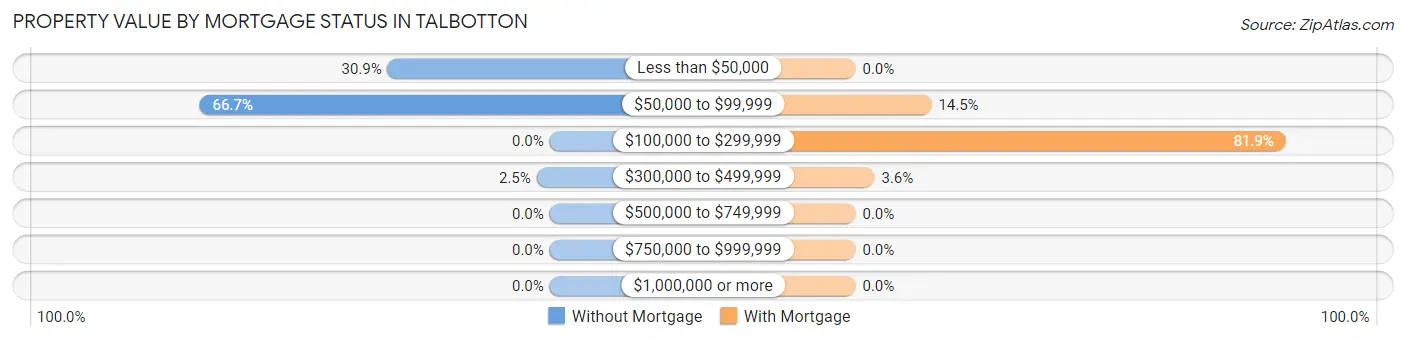
| Property Value | Without Mortgage | With Mortgage |
| Less than $50,000 | 25 (30.9%) | 0 (0.0%) |
| $50,000 to $99,999 | 54 (66.7%) | 24 (14.5%) |
| $100,000 to $299,999 | 0 (0.0%) | 136 (81.9%) |
| $300,000 to $499,999 | 2 (2.5%) | 6 (3.6%) |
| $500,000 to $749,999 | 0 (0.0%) | 0 (0.0%) |
| $750,000 to $999,999 | 0 (0.0%) | 0 (0.0%) |
| $1,000,000 or more | 0 (0.0%) | 0 (0.0%) |
| Total | 81 (100.0%) | 166 (100.0%) |
Household Income by Mortgage Status in Talbotton
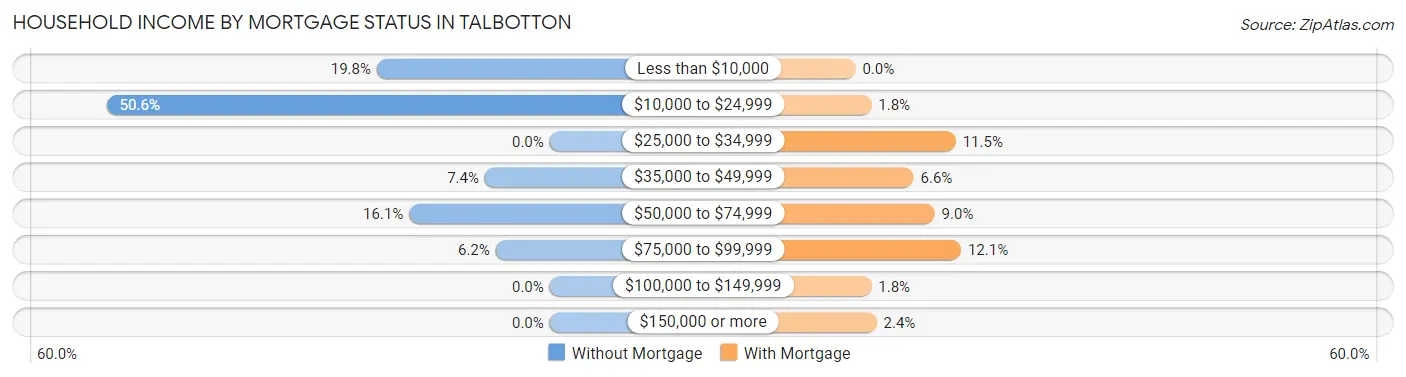
| Household Income | Without Mortgage | With Mortgage |
| Less than $10,000 | 16 (19.8%) | 0 (0.0%) |
| $10,000 to $24,999 | 41 (50.6%) | 3 (1.8%) |
| $25,000 to $34,999 | 0 (0.0%) | 19 (11.5%) |
| $35,000 to $49,999 | 6 (7.4%) | 11 (6.6%) |
| $50,000 to $74,999 | 13 (16.1%) | 15 (9.0%) |
| $75,000 to $99,999 | 5 (6.2%) | 20 (12.0%) |
| $100,000 to $149,999 | 0 (0.0%) | 3 (1.8%) |
| $150,000 or more | 0 (0.0%) | 4 (2.4%) |
| Total | 81 (100.0%) | 166 (100.0%) |
Property Value to Household Income Ratio in Talbotton
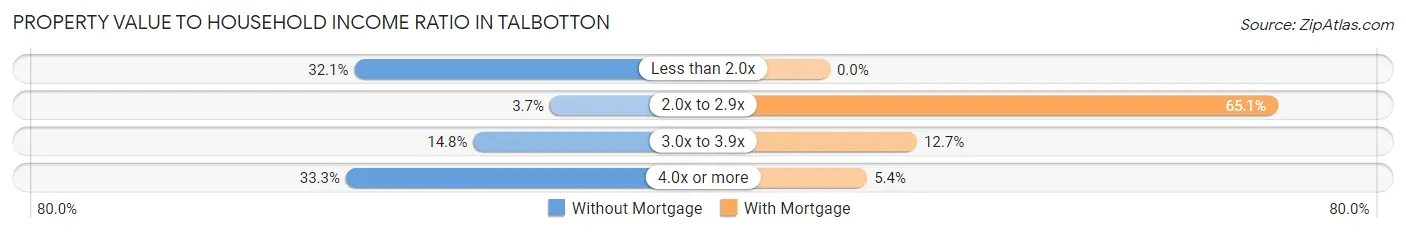
| Value-to-Income Ratio | Without Mortgage | With Mortgage |
| Less than 2.0x | 26 (32.1%) | 0 (0.0%) |
| 2.0x to 2.9x | 3 (3.7%) | 108 (65.1%) |
| 3.0x to 3.9x | 12 (14.8%) | 21 (12.7%) |
| 4.0x or more | 27 (33.3%) | 9 (5.4%) |
| Total | 81 (100.0%) | 166 (100.0%) |
Real Estate Taxes by Mortgage Status in Talbotton
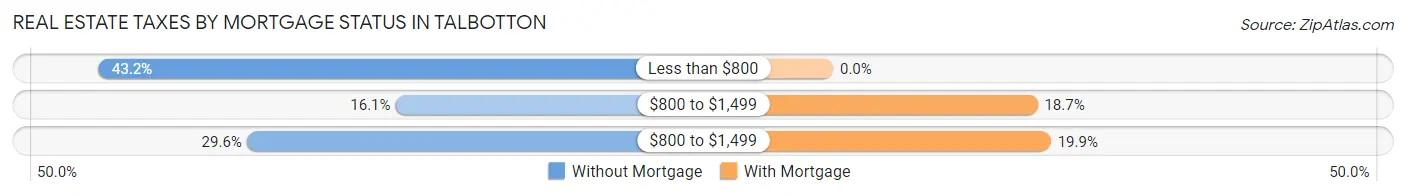
| Property Taxes | Without Mortgage | With Mortgage |
| Less than $800 | 35 (43.2%) | 0 (0.0%) |
| $800 to $1,499 | 13 (16.1%) | 31 (18.7%) |
| $800 to $1,499 | 24 (29.6%) | 33 (19.9%) |
| Total | 81 (100.0%) | 166 (100.0%) |
Health & Disability in Talbotton
Health Insurance Coverage by Age in Talbotton
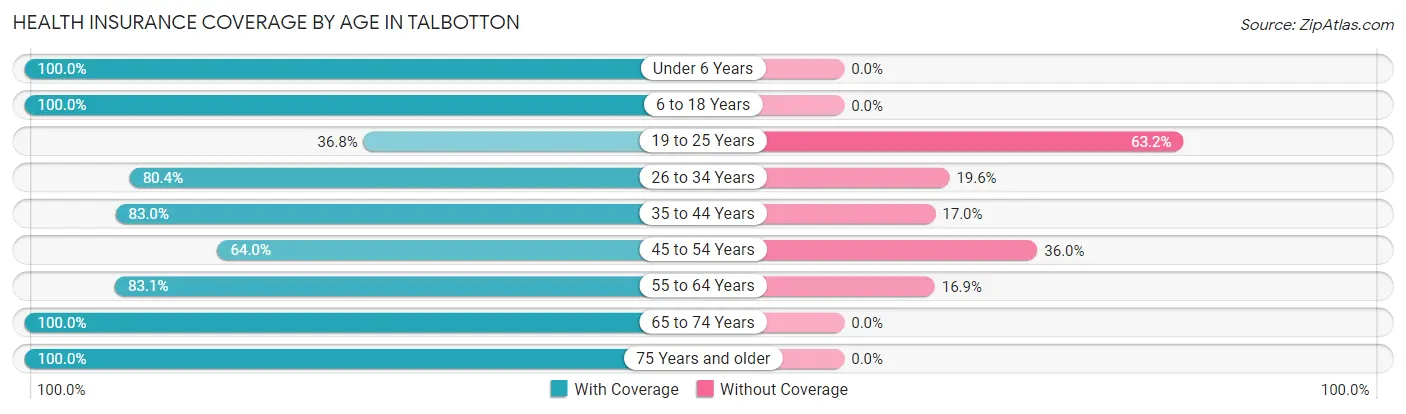
| Age Bracket | With Coverage | Without Coverage |
| Under 6 Years | 55 (100.0%) | 0 (0.0%) |
| 6 to 18 Years | 75 (100.0%) | 0 (0.0%) |
| 19 to 25 Years | 32 (36.8%) | 55 (63.2%) |
| 26 to 34 Years | 41 (80.4%) | 10 (19.6%) |
| 35 to 44 Years | 44 (83.0%) | 9 (17.0%) |
| 45 to 54 Years | 48 (64.0%) | 27 (36.0%) |
| 55 to 64 Years | 64 (83.1%) | 13 (16.9%) |
| 65 to 74 Years | 165 (100.0%) | 0 (0.0%) |
| 75 Years and older | 62 (100.0%) | 0 (0.0%) |
| Total | 586 (83.7%) | 114 (16.3%) |
Health Insurance Coverage by Citizenship Status in Talbotton
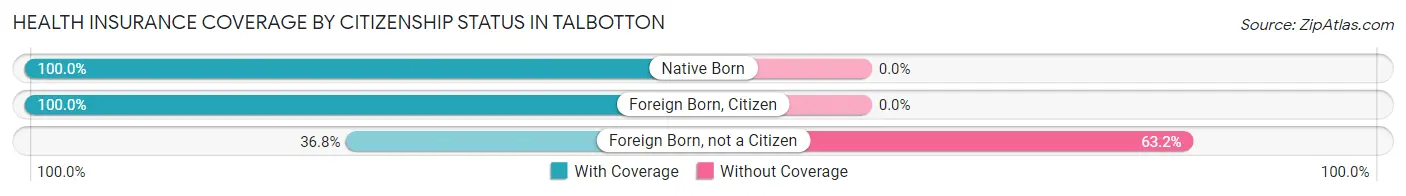
| Citizenship Status | With Coverage | Without Coverage |
| Native Born | 55 (100.0%) | 0 (0.0%) |
| Foreign Born, Citizen | 75 (100.0%) | 0 (0.0%) |
| Foreign Born, not a Citizen | 32 (36.8%) | 55 (63.2%) |
Health Insurance Coverage by Household Income in Talbotton
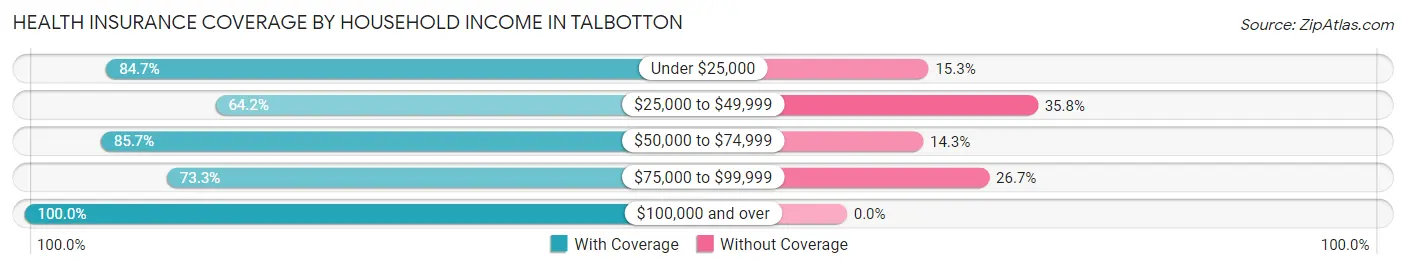
| Household Income | With Coverage | Without Coverage |
| Under $25,000 | 271 (84.7%) | 49 (15.3%) |
| $25,000 to $49,999 | 88 (64.2%) | 49 (35.8%) |
| $50,000 to $74,999 | 72 (85.7%) | 12 (14.3%) |
| $75,000 to $99,999 | 11 (73.3%) | 4 (26.7%) |
| $100,000 and over | 144 (100.0%) | 0 (0.0%) |
Public vs Private Health Insurance Coverage by Age in Talbotton
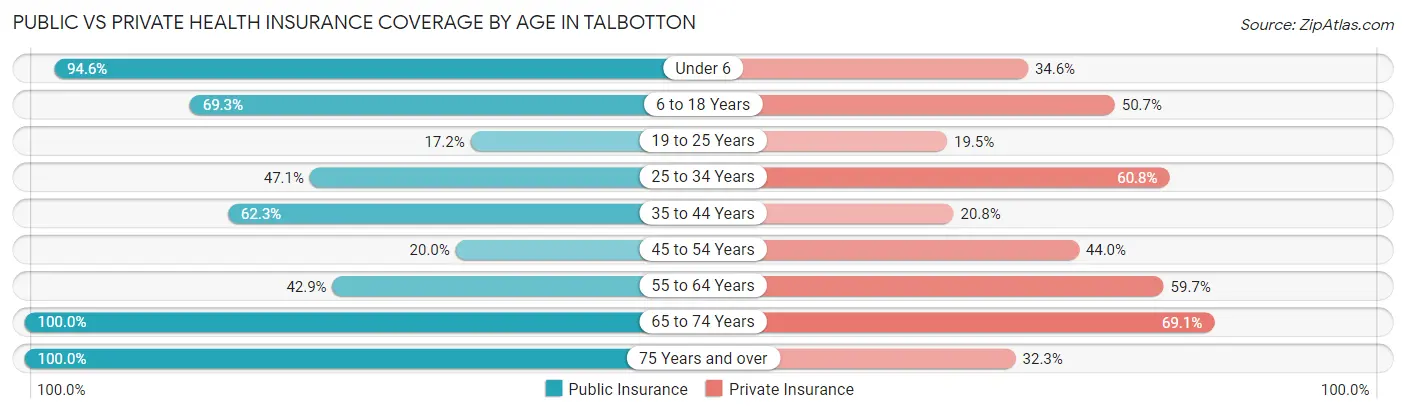
| Age Bracket | Public Insurance | Private Insurance |
| Under 6 | 52 (94.6%) | 19 (34.5%) |
| 6 to 18 Years | 52 (69.3%) | 38 (50.7%) |
| 19 to 25 Years | 15 (17.2%) | 17 (19.5%) |
| 25 to 34 Years | 24 (47.1%) | 31 (60.8%) |
| 35 to 44 Years | 33 (62.3%) | 11 (20.7%) |
| 45 to 54 Years | 15 (20.0%) | 33 (44.0%) |
| 55 to 64 Years | 33 (42.9%) | 46 (59.7%) |
| 65 to 74 Years | 165 (100.0%) | 114 (69.1%) |
| 75 Years and over | 62 (100.0%) | 20 (32.3%) |
| Total | 451 (64.4%) | 329 (47.0%) |
Disability Status by Sex by Age in Talbotton
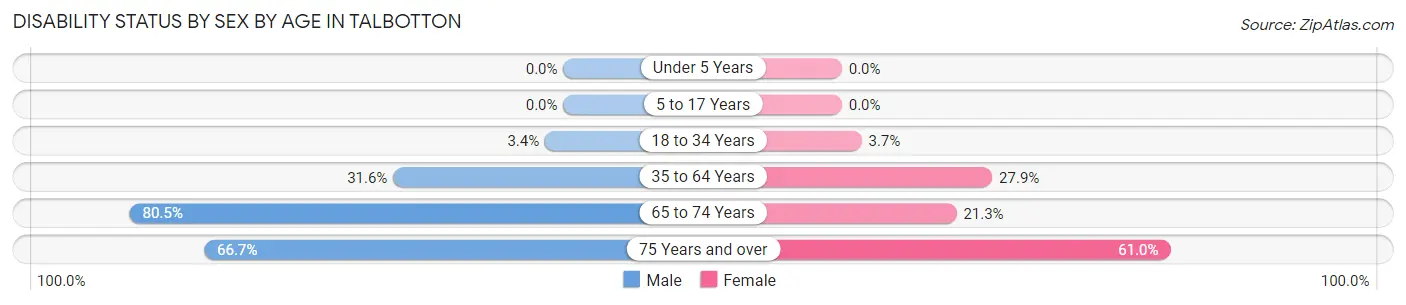
| Age Bracket | Male | Female |
| Under 5 Years | 0 (0.0%) | 0 (0.0%) |
| 5 to 17 Years | 0 (0.0%) | 0 (0.0%) |
| 18 to 34 Years | 2 (3.4%) | 3 (3.7%) |
| 35 to 64 Years | 24 (31.6%) | 36 (27.9%) |
| 65 to 74 Years | 95 (80.5%) | 10 (21.3%) |
| 75 Years and over | 14 (66.7%) | 25 (61.0%) |
Disability Class by Sex by Age in Talbotton
Disability Class: Hearing Difficulty
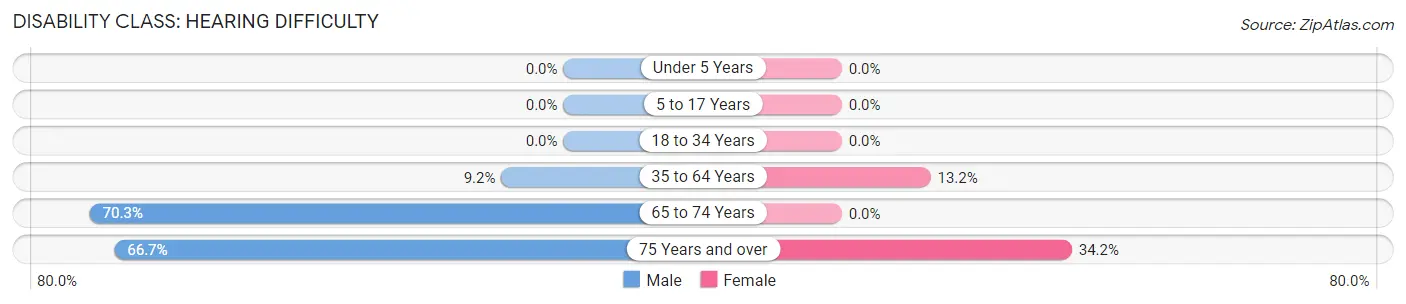
| Age Bracket | Male | Female |
| Under 5 Years | 0 (0.0%) | 0 (0.0%) |
| 5 to 17 Years | 0 (0.0%) | 0 (0.0%) |
| 18 to 34 Years | 0 (0.0%) | 0 (0.0%) |
| 35 to 64 Years | 7 (9.2%) | 17 (13.2%) |
| 65 to 74 Years | 83 (70.3%) | 0 (0.0%) |
| 75 Years and over | 14 (66.7%) | 14 (34.2%) |
Disability Class: Vision Difficulty
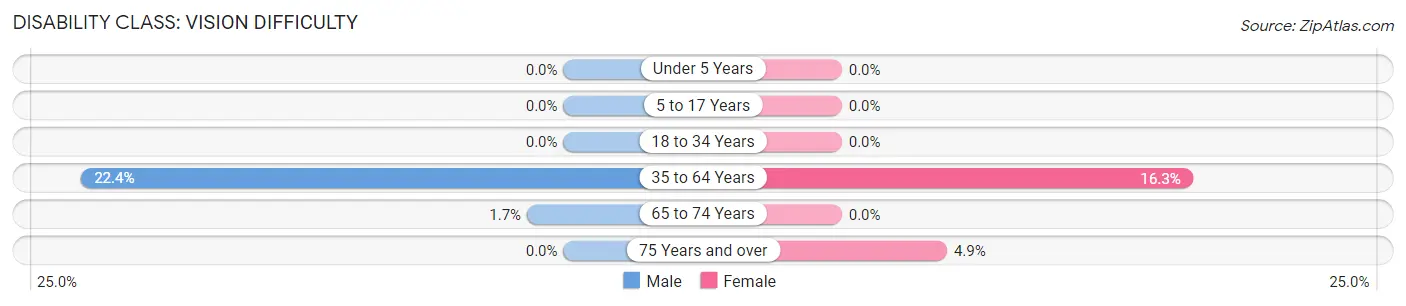
| Age Bracket | Male | Female |
| Under 5 Years | 0 (0.0%) | 0 (0.0%) |
| 5 to 17 Years | 0 (0.0%) | 0 (0.0%) |
| 18 to 34 Years | 0 (0.0%) | 0 (0.0%) |
| 35 to 64 Years | 17 (22.4%) | 21 (16.3%) |
| 65 to 74 Years | 2 (1.7%) | 0 (0.0%) |
| 75 Years and over | 0 (0.0%) | 2 (4.9%) |
Disability Class: Cognitive Difficulty
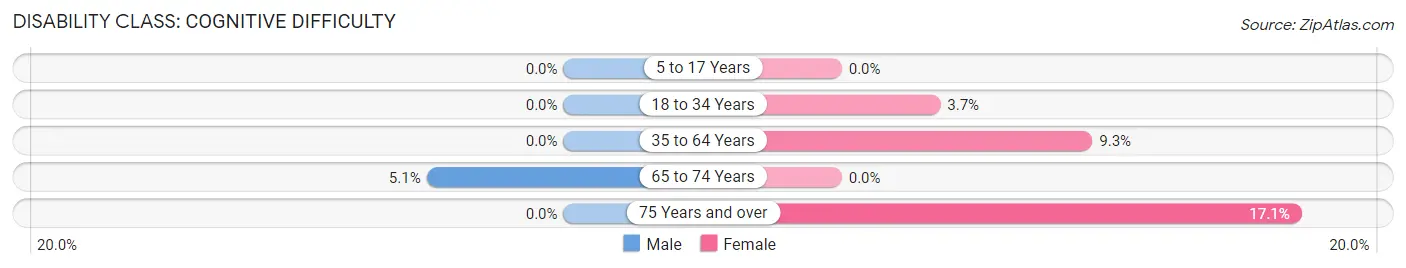
| Age Bracket | Male | Female |
| 5 to 17 Years | 0 (0.0%) | 0 (0.0%) |
| 18 to 34 Years | 0 (0.0%) | 3 (3.7%) |
| 35 to 64 Years | 0 (0.0%) | 12 (9.3%) |
| 65 to 74 Years | 6 (5.1%) | 0 (0.0%) |
| 75 Years and over | 0 (0.0%) | 7 (17.1%) |
Disability Class: Ambulatory Difficulty
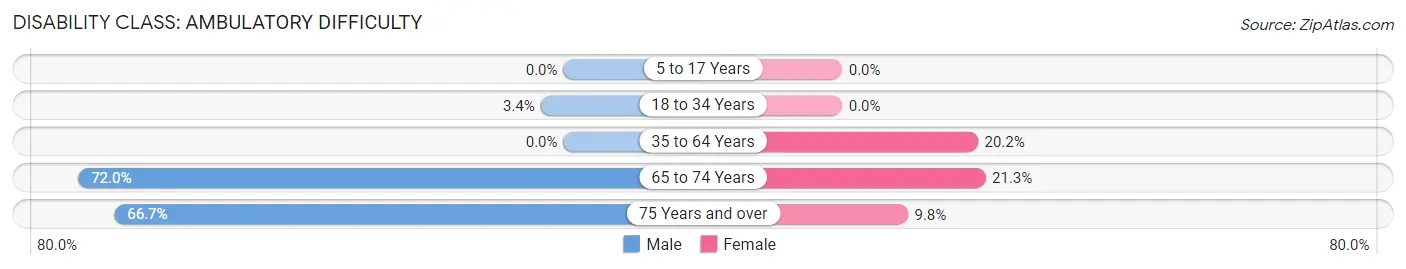
| Age Bracket | Male | Female |
| 5 to 17 Years | 0 (0.0%) | 0 (0.0%) |
| 18 to 34 Years | 2 (3.4%) | 0 (0.0%) |
| 35 to 64 Years | 0 (0.0%) | 26 (20.2%) |
| 65 to 74 Years | 85 (72.0%) | 10 (21.3%) |
| 75 Years and over | 14 (66.7%) | 4 (9.8%) |
Disability Class: Self-Care Difficulty
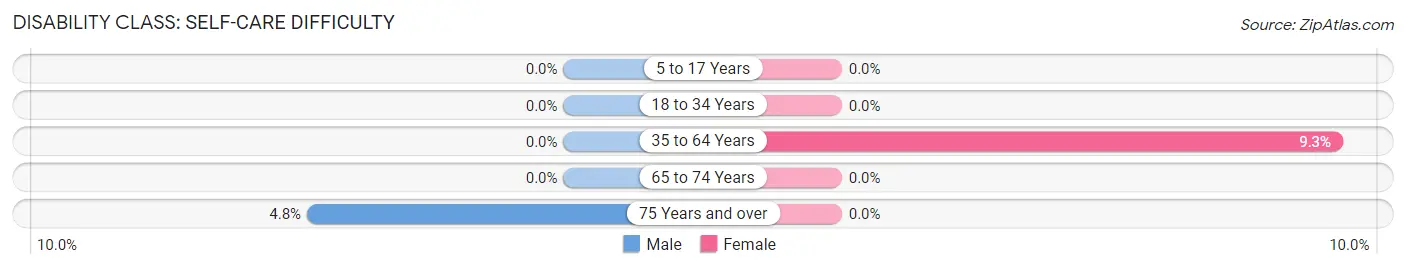
| Age Bracket | Male | Female |
| 5 to 17 Years | 0 (0.0%) | 0 (0.0%) |
| 18 to 34 Years | 0 (0.0%) | 0 (0.0%) |
| 35 to 64 Years | 0 (0.0%) | 12 (9.3%) |
| 65 to 74 Years | 0 (0.0%) | 0 (0.0%) |
| 75 Years and over | 1 (4.8%) | 0 (0.0%) |
Technology Access in Talbotton
Computing Device Access in Talbotton
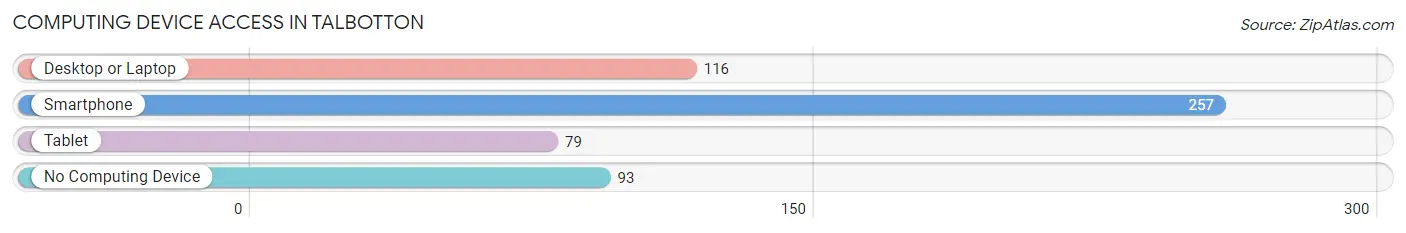
| Device Type | # Households | % Households |
| Desktop or Laptop | 116 | 30.6% |
| Smartphone | 257 | 67.8% |
| Tablet | 79 | 20.8% |
| No Computing Device | 93 | 24.5% |
| Total | 379 | 100.0% |
Internet Access in Talbotton
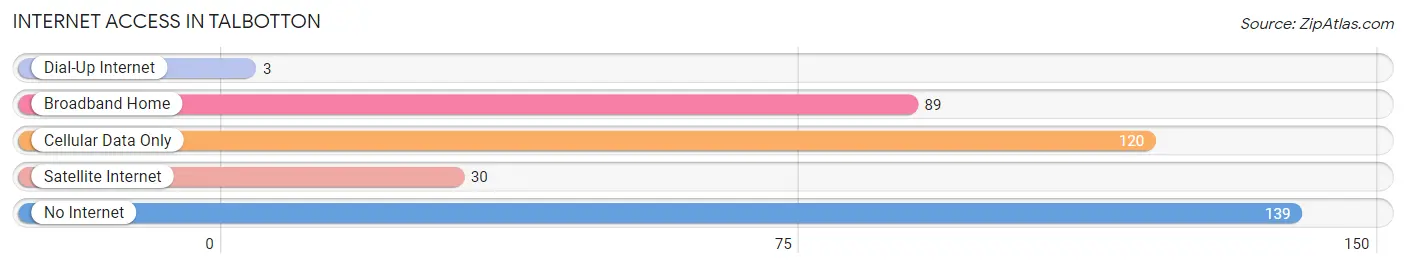
| Internet Type | # Households | % Households |
| Dial-Up Internet | 3 | 0.8% |
| Broadband Home | 89 | 23.5% |
| Cellular Data Only | 120 | 31.7% |
| Satellite Internet | 30 | 7.9% |
| No Internet | 139 | 36.7% |
| Total | 379 | 100.0% |
Talbotton Summary
Talbotton is a small town located in Talbot County, Georgia, United States. It is situated along the banks of the Chattahoochee River, approximately 50 miles south of Columbus, Georgia. The town was founded in 1825 and is the county seat of Talbot County. As of the 2010 census, the population of Talbotton was 1,717.
History
The area that is now Talbotton was originally inhabited by the Creek Indians. The Creek Indians were forced to cede their land to the United States in the 1825 Treaty of Indian Springs. The town of Talbotton was founded shortly after the treaty was signed. The town was named after Colonel Benjamin Talbot, a prominent figure in the Creek War of 1813-1814.
Talbotton was an important trading center in the early 19th century. The town was located at the intersection of two major roads, the Federal Road and the Columbus-Macon Road. This made it an ideal location for merchants to set up shop and sell their goods. The town also served as a stopover for travelers heading to and from the port of Columbus.
In 1832, Talbotton was designated as the county seat of Talbot County. The town was incorporated in 1837 and the first courthouse was built in 1838. The courthouse was destroyed by fire in 1864 during the Civil War. It was rebuilt in 1866 and is still in use today.
Geography
Talbotton is located in Talbot County, Georgia, approximately 50 miles south of Columbus, Georgia. The town is situated along the banks of the Chattahoochee River. The town has a total area of 2.2 square miles, all of which is land.
The climate in Talbotton is classified as humid subtropical. The average temperature in the summer is around 90 degrees Fahrenheit and the average temperature in the winter is around 40 degrees Fahrenheit. The town receives an average of 48 inches of precipitation per year.
Economy
The economy of Talbotton is largely based on agriculture. The town is home to several farms that produce cotton, corn, soybeans, and other crops. The town is also home to several manufacturing companies that produce furniture, textiles, and other products.
The town is also home to several small businesses, including restaurants, retail stores, and service providers. The town is also home to several government offices, including the Talbot County Courthouse and the Talbot County Sheriff's Office.
Demographics
As of the 2010 census, the population of Talbotton was 1,717. The racial makeup of the town was 63.3% White, 34.2% African American, 0.2% Native American, 0.3% Asian, 0.1% Pacific Islander, 0.7% from other races, and 1.4% from two or more races. Hispanic or Latino of any race were 1.7% of the population.
The median income for a household in Talbotton was $25,938 and the median income for a family was $31,250. The per capita income for the town was $14,945. About 22.2% of the population was below the poverty line.
Conclusion
Talbotton is a small town located in Talbot County, Georgia. It was founded in 1825 and is the county seat of Talbot County. The town has a population of 1,717 and is largely based on agriculture. The town is home to several small businesses, government offices, and manufacturing companies. The town has a humid subtropical climate and receives an average of 48 inches of precipitation per year. The median income for a household in Talbotton is $25,938 and the median income for a family is $31,250.
Common Questions
What is Per Capita Income in Talbotton?
Per Capita income in Talbotton is $50,413.
What is the Median Family Income in Talbotton?
Median Family Income in Talbotton is $26,023.
What is the Median Household income in Talbotton?
Median Household Income in Talbotton is $25,114.
What is Inequality or Gini Index in Talbotton?
Inequality or Gini Index in Talbotton is 0.65.
What is the Total Population of Talbotton?
Total Population of Talbotton is 728.
What is the Total Male Population of Talbotton?
Total Male Population of Talbotton is 348.
What is the Total Female Population of Talbotton?
Total Female Population of Talbotton is 380.
What is the Ratio of Males per 100 Females in Talbotton?
There are 91.58 Males per 100 Females in Talbotton.
What is the Ratio of Females per 100 Males in Talbotton?
There are 109.20 Females per 100 Males in Talbotton.
What is the Median Population Age in Talbotton?
Median Population Age in Talbotton is 46.9 Years.
What is the Average Family Size in Talbotton
Average Family Size in Talbotton is 2.8 People.
What is the Average Household Size in Talbotton
Average Household Size in Talbotton is 1.9 People.
How Large is the Labor Force in Talbotton?
There are 294 People in the Labor Forcein in Talbotton.
What is the Percentage of People in the Labor Force in Talbotton?
47.7% of People are in the Labor Force in Talbotton.
What is the Unemployment Rate in Talbotton?
Unemployment Rate in Talbotton is 7.5%.