Zip Codes with the Highest Percentage of Population Employed in Computer & Mathematics in Littleton, CO
RELATED REPORTS & OPTIONS
Computer & Mathematics
Littleton
Compare Zip Codes
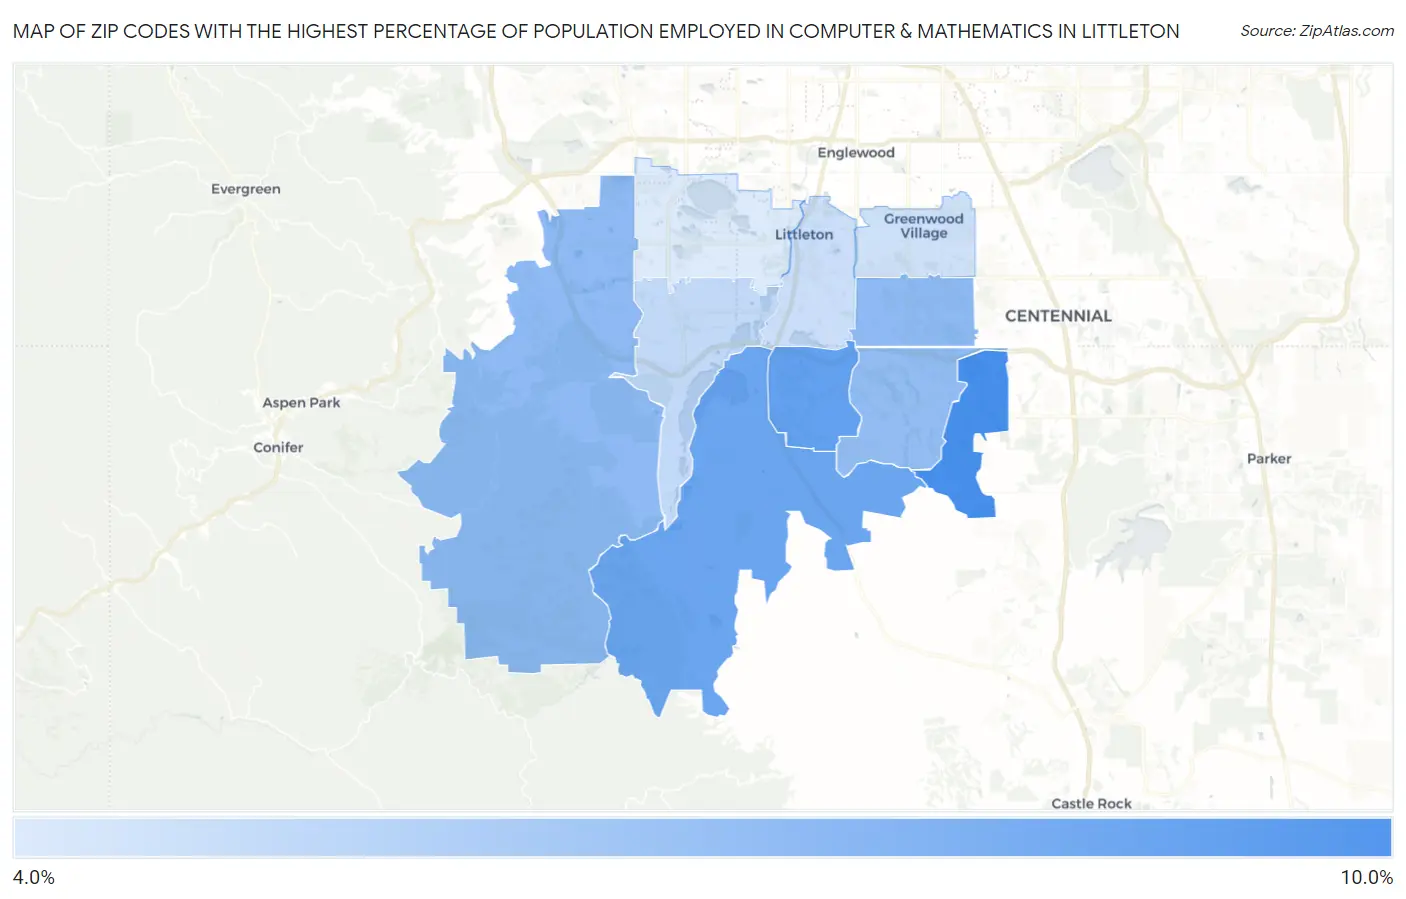
Map of Zip Codes with the Highest Percentage of Population Employed in Computer & Mathematics in Littleton
4.3%
9.1%
Zip Codes with the Highest Percentage of Population Employed in Computer & Mathematics in Littleton, CO
| Zip Code | % Employed | vs State | vs National | |
| 1. | 80130 | 9.1% | 4.8%(+4.36)#33 | 3.5%(+5.59)#881 |
| 2. | 80129 | 8.2% | 4.8%(+3.44)#46 | 3.5%(+4.67)#1,150 |
| 3. | 80125 | 7.9% | 4.8%(+3.17)#48 | 3.5%(+4.41)#1,226 |
| 4. | 80122 | 6.8% | 4.8%(+2.02)#66 | 3.5%(+3.25)#1,749 |
| 5. | 80127 | 6.7% | 4.8%(+1.99)#67 | 3.5%(+3.22)#1,766 |
| 6. | 80126 | 6.6% | 4.8%(+1.89)#72 | 3.5%(+3.12)#1,835 |
| 7. | 80128 | 5.1% | 4.8%(+0.351)#110 | 3.5%(+1.58)#3,224 |
| 8. | 80120 | 4.9% | 4.8%(+0.107)#123 | 3.5%(+1.34)#3,553 |
| 9. | 80121 | 4.7% | 4.8%(-0.067)#128 | 3.5%(+1.16)#3,807 |
| 10. | 80123 | 4.3% | 4.8%(-0.500)#139 | 3.5%(+0.731)#4,502 |
1
Common Questions
What are the Top 5 Zip Codes with the Highest Percentage of Population Employed in Computer & Mathematics in Littleton, CO?
Top 5 Zip Codes with the Highest Percentage of Population Employed in Computer & Mathematics in Littleton, CO are:
What zip code has the Highest Percentage of Population Employed in Computer & Mathematics in Littleton, CO?
80130 has the Highest Percentage of Population Employed in Computer & Mathematics in Littleton, CO with 9.1%.
What is the Percentage of Population Employed in Computer & Mathematics in Littleton, CO?
Percentage of Population Employed in Computer & Mathematics in Littleton is 5.4%.
What is the Percentage of Population Employed in Computer & Mathematics in Colorado?
Percentage of Population Employed in Computer & Mathematics in Colorado is 4.8%.
What is the Percentage of Population Employed in Computer & Mathematics in the United States?
Percentage of Population Employed in Computer & Mathematics in the United States is 3.5%.