Aetna Estates, CO Map & Demographics
Aetna Estates Map
Aetna Estates Overview
$22,287
PER CAPITA INCOME
$61,074
AVG FAMILY INCOME
$60,857
AVG HOUSEHOLD INCOME
30.0%
WAGE / INCOME GAP [ % ]
70.0¢/ $1
WAGE / INCOME GAP [ $ ]
0.38
INEQUALITY / GINI INDEX
1,194
TOTAL POPULATION
500
MALE POPULATION
694
FEMALE POPULATION
72.05
MALES / 100 FEMALES
138.80
FEMALES / 100 MALES
40.1
MEDIAN AGE
2.9
AVG FAMILY SIZE
2.8
AVG HOUSEHOLD SIZE
730
LABOR FORCE [ PEOPLE ]
69.7%
PERCENT IN LABOR FORCE
9.9%
UNEMPLOYMENT RATE
Income in Aetna Estates
Income Overview in Aetna Estates
Per Capita Income in Aetna Estates is $22,287, while median incomes of families and households are $61,074 and $60,857 respectively.
| Characteristic | Number | Measure |
| Per Capita Income | 1,194 | $22,287 |
| Median Family Income | 396 | $61,074 |
| Mean Family Income | 396 | $66,143 |
| Median Household Income | 433 | $60,857 |
| Mean Household Income | 433 | $63,343 |
| Income Deficit | 396 | $0 |
| Wage / Income Gap (%) | 1,194 | 29.99% |
| Wage / Income Gap ($) | 1,194 | 70.01¢ per $1 |
| Gini / Inequality Index | 1,194 | 0.38 |
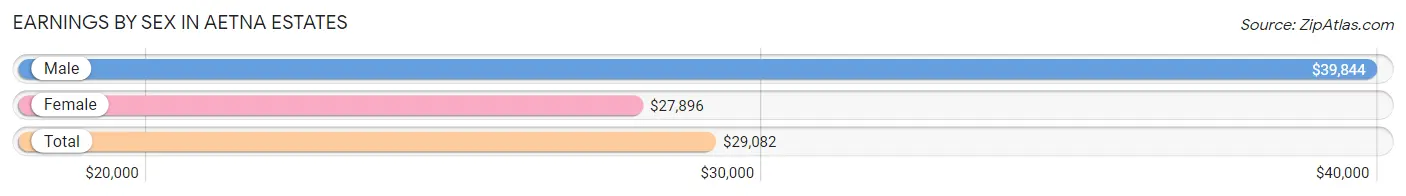
Earnings by Sex in Aetna Estates
Average Earnings in Aetna Estates are $29,082, $39,844 for men and $27,896 for women, a difference of 30.0%.
| Sex | Number | Average Earnings |
| Male | 279 (38.4%) | $39,844 |
| Female | 447 (61.6%) | $27,896 |
| Total | 726 (100.0%) | $29,082 |
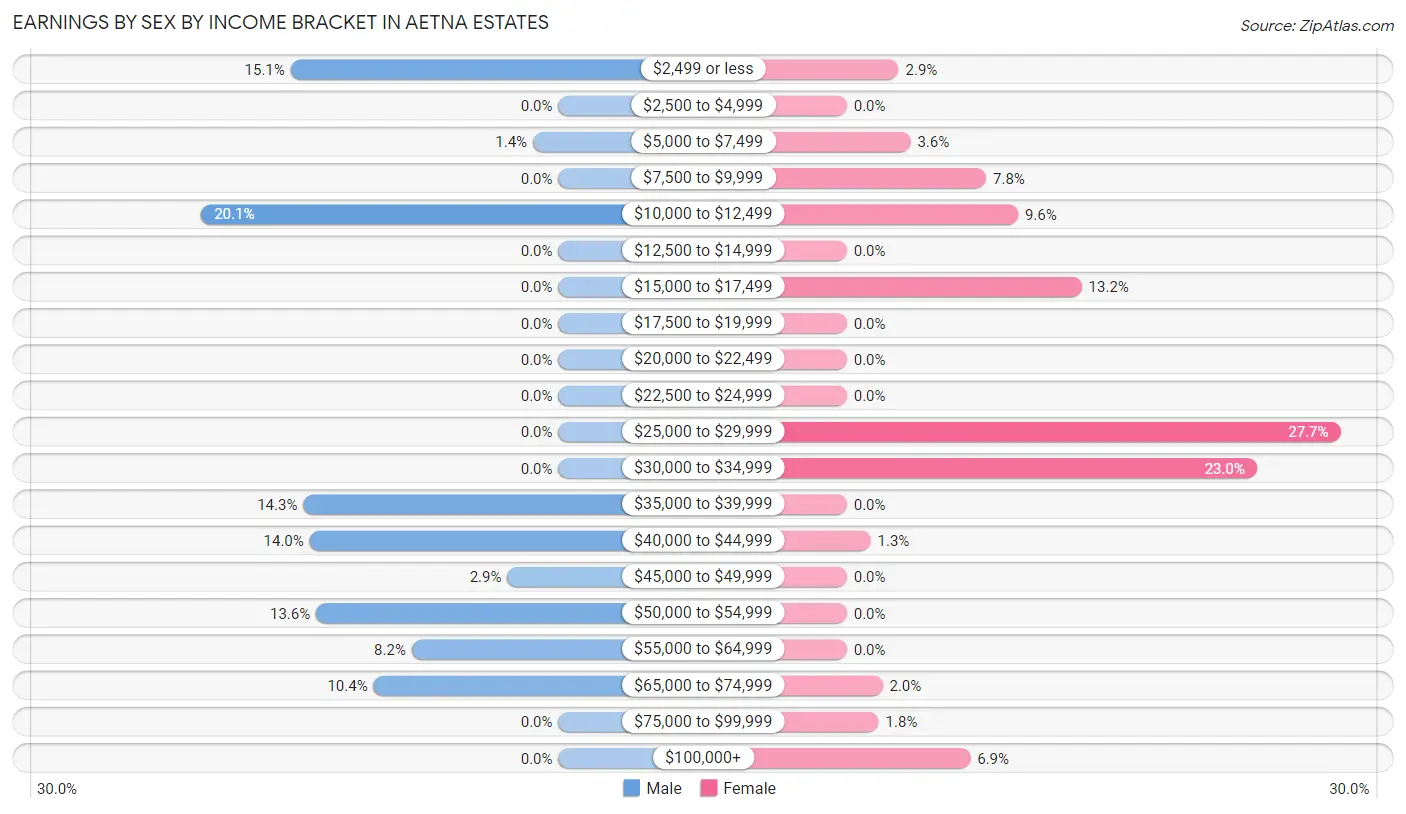
Earnings by Sex by Income Bracket in Aetna Estates
The most common earnings brackets in Aetna Estates are $10,000 to $12,499 for men (56 | 20.1%) and $25,000 to $29,999 for women (124 | 27.7%).
| Income | Male | Female |
| $2,499 or less | 42 (15.0%) | 13 (2.9%) |
| $2,500 to $4,999 | 0 (0.0%) | 0 (0.0%) |
| $5,000 to $7,499 | 4 (1.4%) | 16 (3.6%) |
| $7,500 to $9,999 | 0 (0.0%) | 35 (7.8%) |
| $10,000 to $12,499 | 56 (20.1%) | 43 (9.6%) |
| $12,500 to $14,999 | 0 (0.0%) | 0 (0.0%) |
| $15,000 to $17,499 | 0 (0.0%) | 59 (13.2%) |
| $17,500 to $19,999 | 0 (0.0%) | 0 (0.0%) |
| $20,000 to $22,499 | 0 (0.0%) | 0 (0.0%) |
| $22,500 to $24,999 | 0 (0.0%) | 0 (0.0%) |
| $25,000 to $29,999 | 0 (0.0%) | 124 (27.7%) |
| $30,000 to $34,999 | 0 (0.0%) | 103 (23.0%) |
| $35,000 to $39,999 | 40 (14.3%) | 0 (0.0%) |
| $40,000 to $44,999 | 39 (14.0%) | 6 (1.3%) |
| $45,000 to $49,999 | 8 (2.9%) | 0 (0.0%) |
| $50,000 to $54,999 | 38 (13.6%) | 0 (0.0%) |
| $55,000 to $64,999 | 23 (8.2%) | 0 (0.0%) |
| $65,000 to $74,999 | 29 (10.4%) | 9 (2.0%) |
| $75,000 to $99,999 | 0 (0.0%) | 8 (1.8%) |
| $100,000+ | 0 (0.0%) | 31 (6.9%) |
| Total | 279 (100.0%) | 447 (100.0%) |
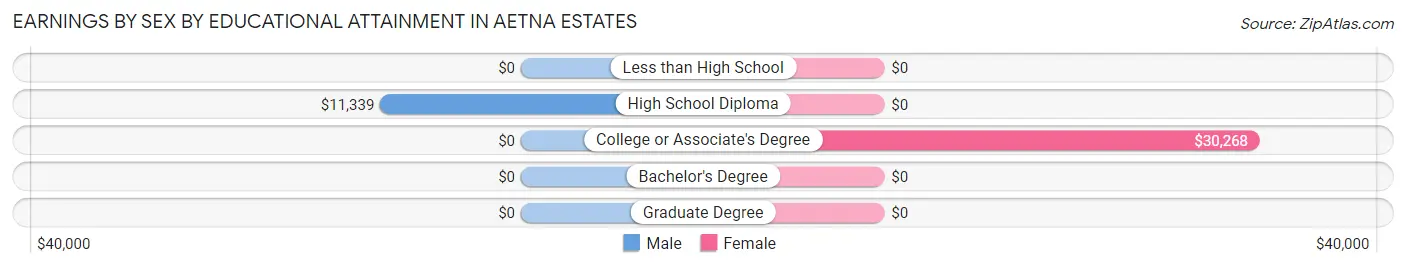
Earnings by Sex by Educational Attainment in Aetna Estates
Average earnings in Aetna Estates are $42,212 for men and $29,842 for women, a difference of 29.3%. Men with an educational attainment of high school diploma enjoy the highest average annual earnings of $11,339, while those with high school diploma education earn the least with $11,339. Women with an educational attainment of college or associate's degree earn the most with the average annual earnings of $30,268, while those with college or associate's degree education have the smallest earnings of $30,268.
| Educational Attainment | Male Income | Female Income |
| Less than High School | - | - |
| High School Diploma | $11,339 | $0 |
| College or Associate's Degree | - | - |
| Bachelor's Degree | - | - |
| Graduate Degree | - | - |
| Total | $42,212 | $29,842 |
Family Income in Aetna Estates
Family Income Brackets in Aetna Estates
According to the Aetna Estates family income data, there are 131 families falling into the $50,000 to $74,999 income range, which is the most common income bracket and makes up 33.1% of all families.
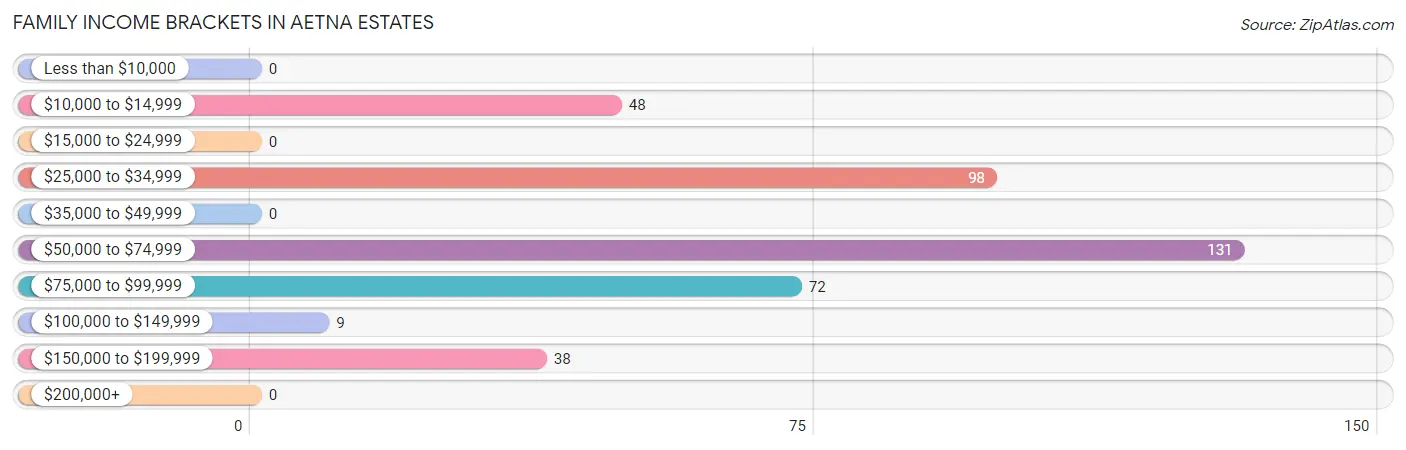
| Income Bracket | # Families | % Families |
| Less than $10,000 | 0 | 0.0% |
| $10,000 to $14,999 | 48 | 12.1% |
| $15,000 to $24,999 | 0 | 0.0% |
| $25,000 to $34,999 | 98 | 24.7% |
| $35,000 to $49,999 | 0 | 0.0% |
| $50,000 to $74,999 | 131 | 33.1% |
| $75,000 to $99,999 | 72 | 18.2% |
| $100,000 to $149,999 | 9 | 2.3% |
| $150,000 to $199,999 | 38 | 9.6% |
| $200,000+ | 0 | 0.0% |
Family Income by Famaliy Size in Aetna Estates
2-person families (219 | 55.3%) account for the highest median family income in Aetna Estates with $60,424 per family, while 2-person families (219 | 55.3%) have the highest median income of $30,212 per family member.
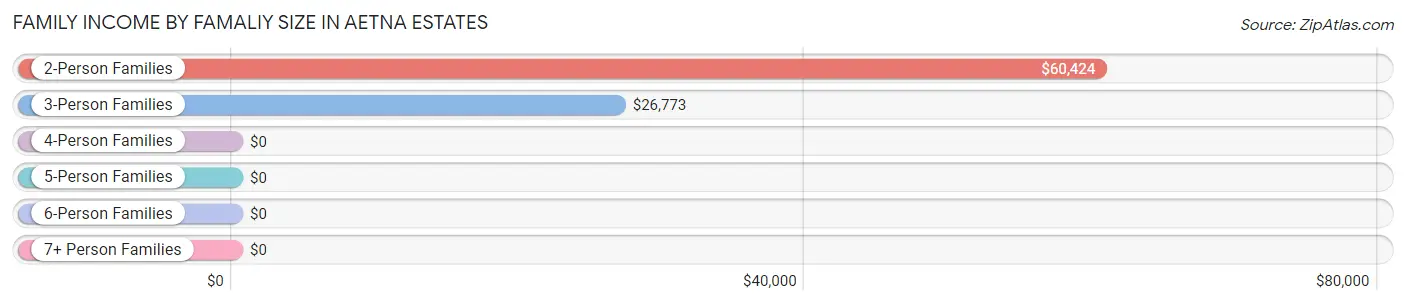
| Income Bracket | # Families | Median Income |
| 2-Person Families | 219 (55.3%) | $60,424 |
| 3-Person Families | 61 (15.4%) | $26,773 |
| 4-Person Families | 78 (19.7%) | $0 |
| 5-Person Families | 38 (9.6%) | $0 |
| 6-Person Families | 0 (0.0%) | $0 |
| 7+ Person Families | 0 (0.0%) | $0 |
| Total | 396 (100.0%) | $61,074 |
Family Income by Number of Earners in Aetna Estates
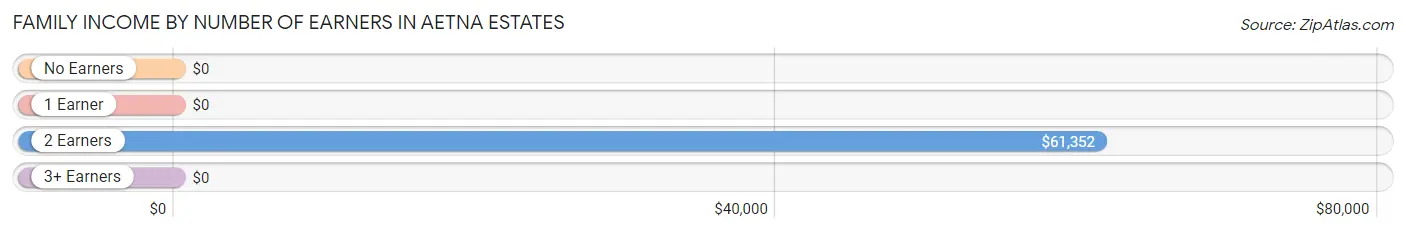
| Number of Earners | # Families | Median Income |
| No Earners | 48 (12.1%) | $0 |
| 1 Earner | 87 (22.0%) | $0 |
| 2 Earners | 192 (48.5%) | $61,352 |
| 3+ Earners | 69 (17.4%) | $0 |
| Total | 396 (100.0%) | $61,074 |
Household Income in Aetna Estates
Household Income Brackets in Aetna Estates
With 131 households falling in the category, the $50,000 to $74,999 income range is the most frequent in Aetna Estates, accounting for 30.2% of all households.
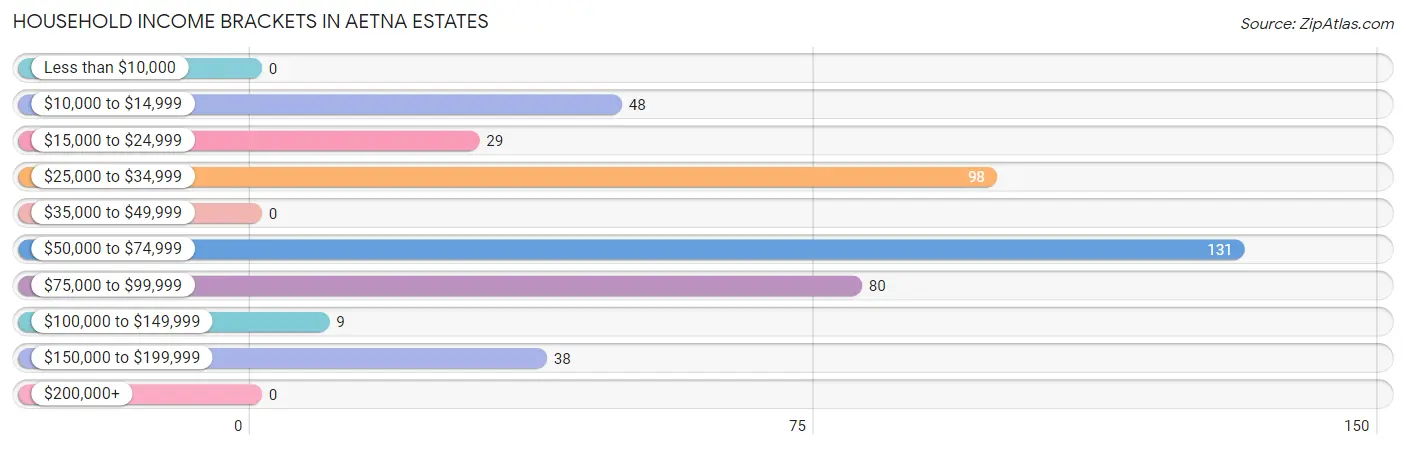
| Income Bracket | # Households | % Households |
| Less than $10,000 | 0 | 0.0% |
| $10,000 to $14,999 | 48 | 11.1% |
| $15,000 to $24,999 | 29 | 6.7% |
| $25,000 to $34,999 | 98 | 22.6% |
| $35,000 to $49,999 | 0 | 0.0% |
| $50,000 to $74,999 | 131 | 30.3% |
| $75,000 to $99,999 | 80 | 18.5% |
| $100,000 to $149,999 | 9 | 2.1% |
| $150,000 to $199,999 | 38 | 8.8% |
| $200,000+ | 0 | 0.0% |
Household Income by Householder Age in Aetna Estates
The median household income in Aetna Estates is $60,857, with the highest median household income of $61,824 found in the 25 to 44 years age bracket for the primary householder. A total of 143 households (33.0%) fall into this category. Meanwhile, the 15 to 24 years age bracket for the primary householder has the lowest median household income of $0, with 43 households (9.9%) in this group.
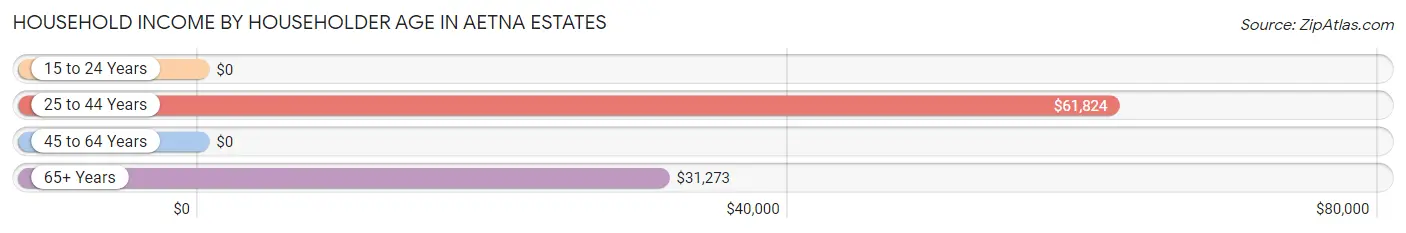
| Income Bracket | # Households | Median Income |
| 15 to 24 Years | 43 (9.9%) | $0 |
| 25 to 44 Years | 143 (33.0%) | $61,824 |
| 45 to 64 Years | 175 (40.4%) | $0 |
| 65+ Years | 72 (16.6%) | $31,273 |
| Total | 433 (100.0%) | $60,857 |
Poverty in Aetna Estates
Income Below Poverty by Sex and Age in Aetna Estates
With 20.2% poverty level for males and 0.6% for females among the residents of Aetna Estates, 12 to 14 year old males and 65 to 74 year old females are the most vulnerable to poverty, with 39 males (100.0%) and 4 females (40.0%) in their respective age groups living below the poverty level.
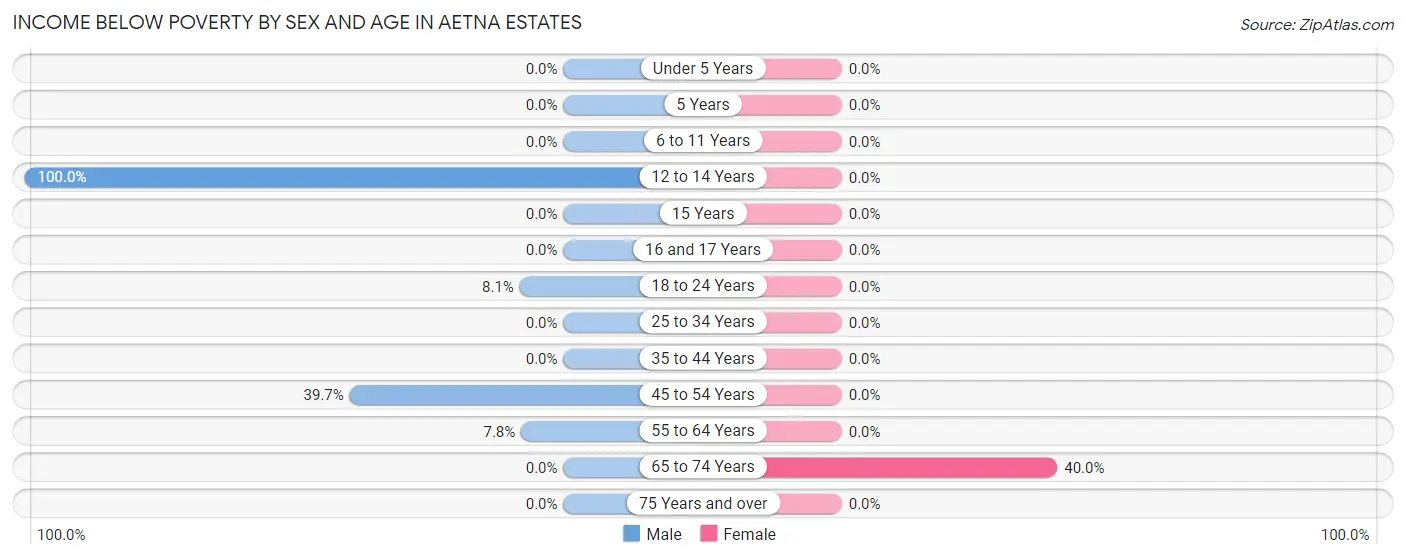
| Age Bracket | Male | Female |
| Under 5 Years | 0 (0.0%) | 0 (0.0%) |
| 5 Years | 0 (0.0%) | 0 (0.0%) |
| 6 to 11 Years | 0 (0.0%) | 0 (0.0%) |
| 12 to 14 Years | 39 (100.0%) | 0 (0.0%) |
| 15 Years | 0 (0.0%) | 0 (0.0%) |
| 16 and 17 Years | 0 (0.0%) | 0 (0.0%) |
| 18 to 24 Years | 6 (8.1%) | 0 (0.0%) |
| 25 to 34 Years | 0 (0.0%) | 0 (0.0%) |
| 35 to 44 Years | 0 (0.0%) | 0 (0.0%) |
| 45 to 54 Years | 48 (39.7%) | 0 (0.0%) |
| 55 to 64 Years | 8 (7.8%) | 0 (0.0%) |
| 65 to 74 Years | 0 (0.0%) | 4 (40.0%) |
| 75 Years and over | 0 (0.0%) | 0 (0.0%) |
| Total | 101 (20.2%) | 4 (0.6%) |
Income Above Poverty by Sex and Age in Aetna Estates
According to the poverty statistics in Aetna Estates, males aged 6 to 11 years and females aged under 5 years are the age groups that are most secure financially, with 100.0% of males and 100.0% of females in these age groups living above the poverty line.
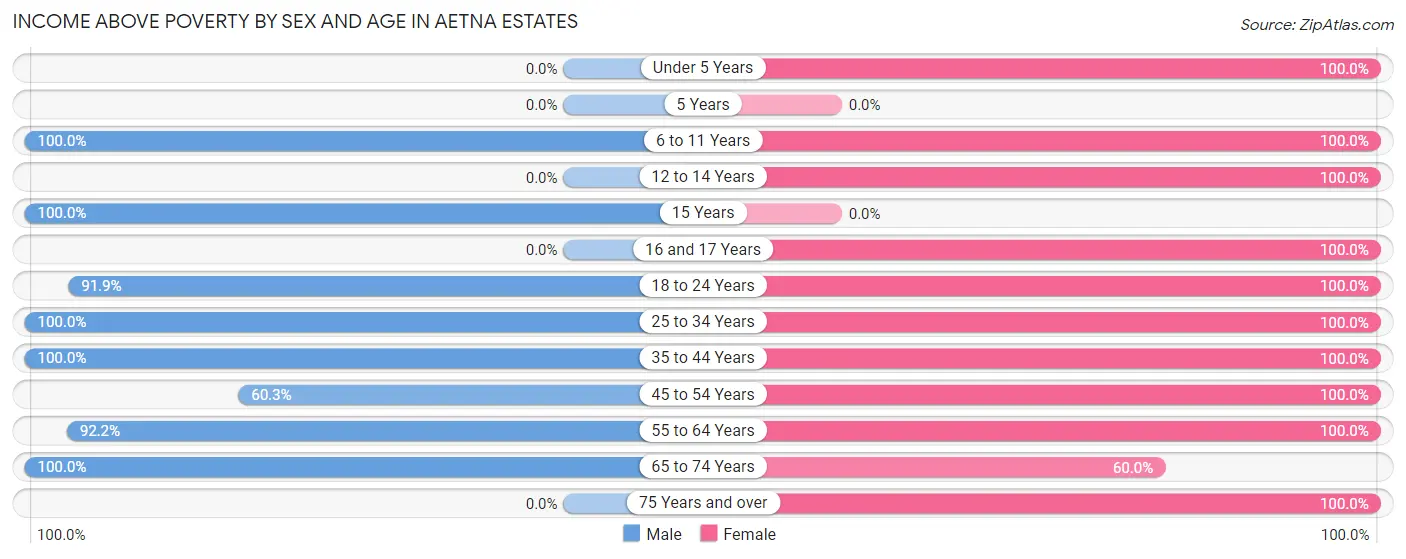
| Age Bracket | Male | Female |
| Under 5 Years | 0 (0.0%) | 6 (100.0%) |
| 5 Years | 0 (0.0%) | 0 (0.0%) |
| 6 to 11 Years | 6 (100.0%) | 20 (100.0%) |
| 12 to 14 Years | 0 (0.0%) | 43 (100.0%) |
| 15 Years | 32 (100.0%) | 0 (0.0%) |
| 16 and 17 Years | 0 (0.0%) | 39 (100.0%) |
| 18 to 24 Years | 68 (91.9%) | 123 (100.0%) |
| 25 to 34 Years | 8 (100.0%) | 183 (100.0%) |
| 35 to 44 Years | 112 (100.0%) | 64 (100.0%) |
| 45 to 54 Years | 73 (60.3%) | 93 (100.0%) |
| 55 to 64 Years | 94 (92.2%) | 50 (100.0%) |
| 65 to 74 Years | 6 (100.0%) | 6 (60.0%) |
| 75 Years and over | 0 (0.0%) | 63 (100.0%) |
| Total | 399 (79.8%) | 690 (99.4%) |
Income Below Poverty Among Married-Couple Families in Aetna Estates
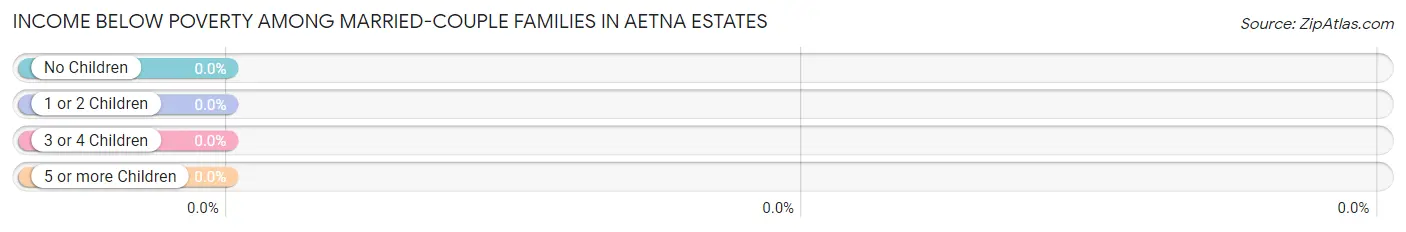
| Children | Above Poverty | Below Poverty |
| No Children | 132 (100.0%) | 0 (0.0%) |
| 1 or 2 Children | 86 (100.0%) | 0 (0.0%) |
| 3 or 4 Children | 0 (0.0%) | 0 (0.0%) |
| 5 or more Children | 0 (0.0%) | 0 (0.0%) |
| Total | 218 (100.0%) | 0 (0.0%) |
Income Below Poverty Among Single-Parent Households in Aetna Estates
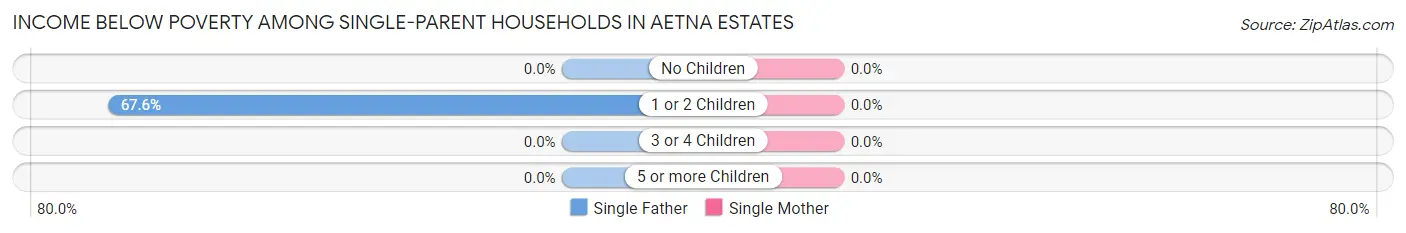
| Children | Single Father | Single Mother |
| No Children | 0 (0.0%) | 0 (0.0%) |
| 1 or 2 Children | 48 (67.6%) | 0 (0.0%) |
| 3 or 4 Children | 0 (0.0%) | 0 (0.0%) |
| 5 or more Children | 0 (0.0%) | 0 (0.0%) |
| Total | 48 (64.9%) | 0 (0.0%) |
Income Below Poverty Among Married-Couple vs Single-Parent Households in Aetna Estates
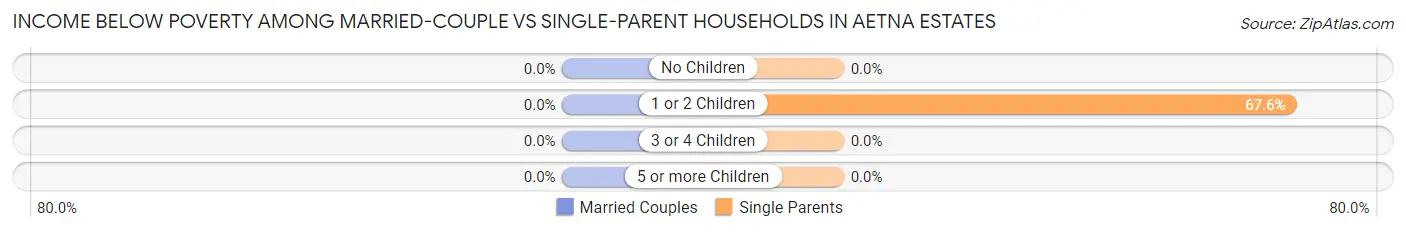
| Children | Married-Couple Families | Single-Parent Households |
| No Children | 0 (0.0%) | 0 (0.0%) |
| 1 or 2 Children | 0 (0.0%) | 48 (67.6%) |
| 3 or 4 Children | 0 (0.0%) | 0 (0.0%) |
| 5 or more Children | 0 (0.0%) | 0 (0.0%) |
| Total | 0 (0.0%) | 48 (27.0%) |
Race in Aetna Estates
The most populous races in Aetna Estates are Hispanic or Latino (720 | 60.3%), White / Caucasian (447 | 37.4%), and Two or more Races (440 | 36.8%).
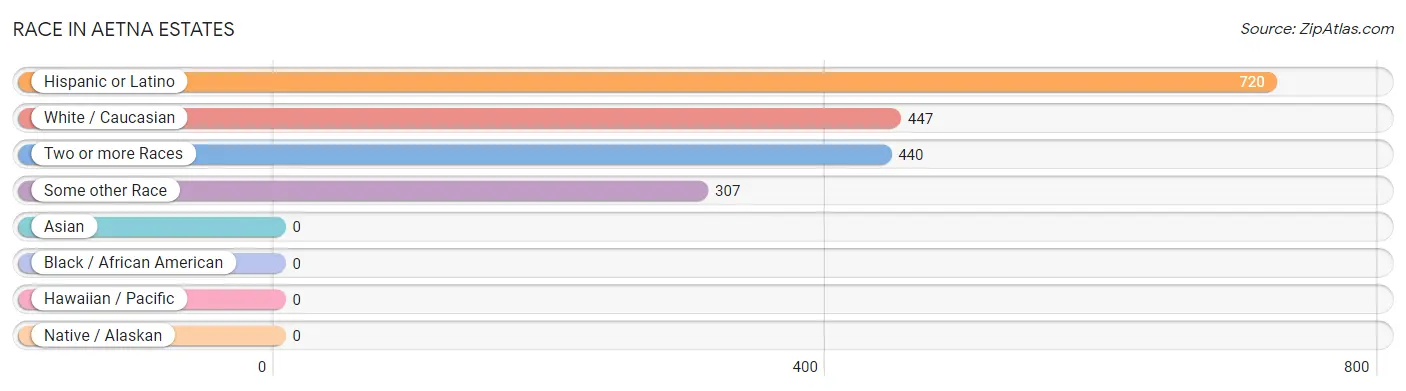
| Race | # Population | % Population |
| Asian | 0 | 0.0% |
| Black / African American | 0 | 0.0% |
| Hawaiian / Pacific | 0 | 0.0% |
| Hispanic or Latino | 720 | 60.3% |
| Native / Alaskan | 0 | 0.0% |
| White / Caucasian | 447 | 37.4% |
| Two or more Races | 440 | 36.8% |
| Some other Race | 307 | 25.7% |
| Total | 1,194 | 100.0% |
Ancestry in Aetna Estates
The most populous ancestries reported in Aetna Estates are Mexican (446 | 37.3%), Dutch (107 | 9.0%), Central American (98 | 8.2%), Nicaraguan (98 | 8.2%), and Spaniard (97 | 8.1%), together accounting for 70.8% of all Aetna Estates residents.
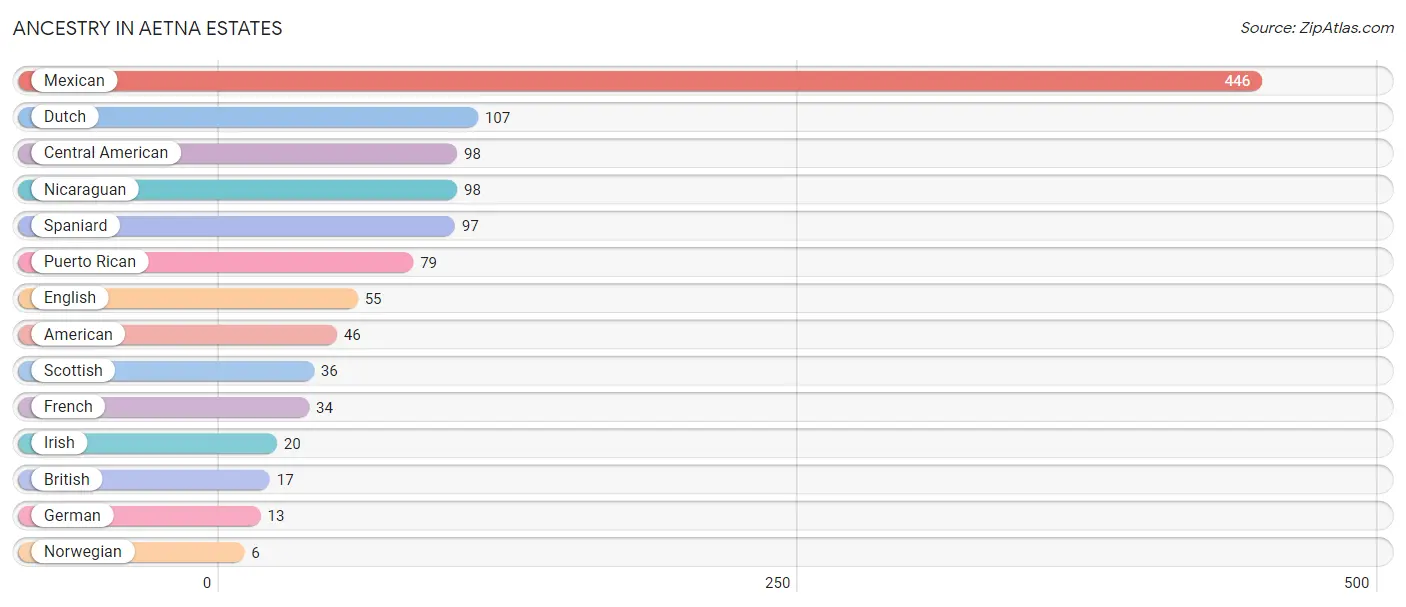
| Ancestry | # Population | % Population |
| American | 46 | 3.8% |
| British | 17 | 1.4% |
| Central American | 98 | 8.2% |
| Dutch | 107 | 9.0% |
| English | 55 | 4.6% |
| French | 34 | 2.9% |
| German | 13 | 1.1% |
| Irish | 20 | 1.7% |
| Mexican | 446 | 37.3% |
| Nicaraguan | 98 | 8.2% |
| Norwegian | 6 | 0.5% |
| Puerto Rican | 79 | 6.6% |
| Scottish | 36 | 3.0% |
| Spaniard | 97 | 8.1% | View All 14 Rows |
Immigrants in Aetna Estates
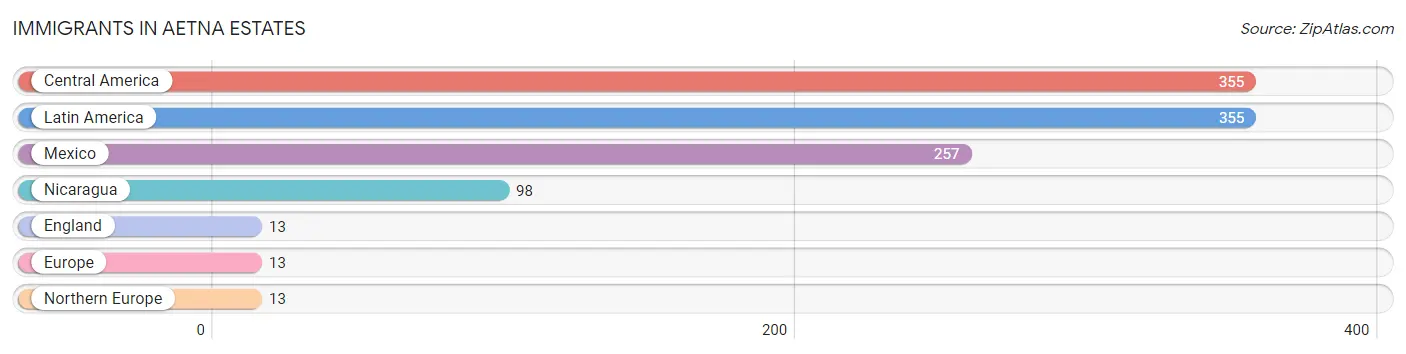
The most numerous immigrant groups reported in Aetna Estates came from Central America (355 | 29.7%), Latin America (355 | 29.7%), Mexico (257 | 21.5%), Nicaragua (98 | 8.2%), and England (13 | 1.1%), together accounting for 90.3% of all Aetna Estates residents.
| Immigration Origin | # Population | % Population |
| Central America | 355 | 29.7% |
| England | 13 | 1.1% |
| Europe | 13 | 1.1% |
| Latin America | 355 | 29.7% |
| Mexico | 257 | 21.5% |
| Nicaragua | 98 | 8.2% |
| Northern Europe | 13 | 1.1% | View All 7 Rows |
Sex and Age in Aetna Estates
Sex and Age in Aetna Estates
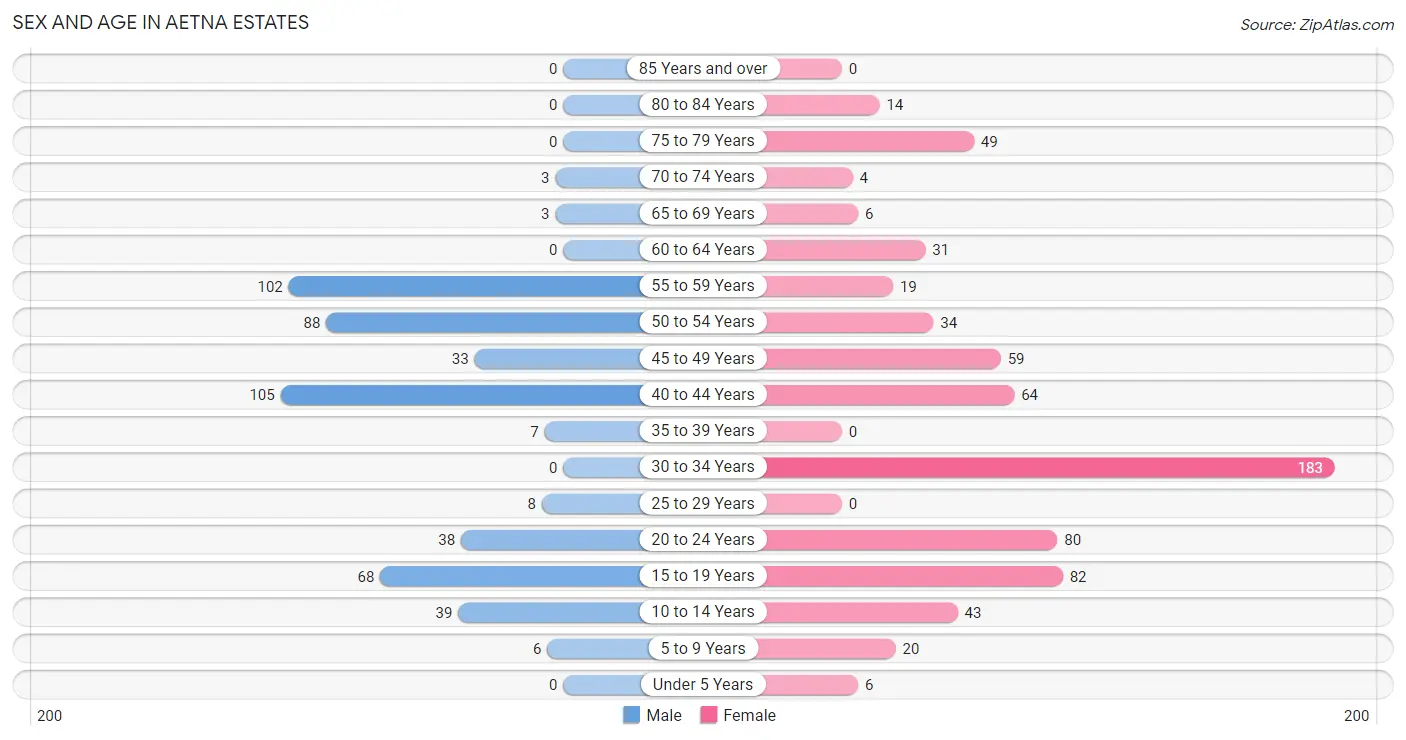
The most populous age groups in Aetna Estates are 40 to 44 Years (105 | 21.0%) for men and 30 to 34 Years (183 | 26.4%) for women.
| Age Bracket | Male | Female |
| Under 5 Years | 0 (0.0%) | 6 (0.9%) |
| 5 to 9 Years | 6 (1.2%) | 20 (2.9%) |
| 10 to 14 Years | 39 (7.8%) | 43 (6.2%) |
| 15 to 19 Years | 68 (13.6%) | 82 (11.8%) |
| 20 to 24 Years | 38 (7.6%) | 80 (11.5%) |
| 25 to 29 Years | 8 (1.6%) | 0 (0.0%) |
| 30 to 34 Years | 0 (0.0%) | 183 (26.4%) |
| 35 to 39 Years | 7 (1.4%) | 0 (0.0%) |
| 40 to 44 Years | 105 (21.0%) | 64 (9.2%) |
| 45 to 49 Years | 33 (6.6%) | 59 (8.5%) |
| 50 to 54 Years | 88 (17.6%) | 34 (4.9%) |
| 55 to 59 Years | 102 (20.4%) | 19 (2.7%) |
| 60 to 64 Years | 0 (0.0%) | 31 (4.5%) |
| 65 to 69 Years | 3 (0.6%) | 6 (0.9%) |
| 70 to 74 Years | 3 (0.6%) | 4 (0.6%) |
| 75 to 79 Years | 0 (0.0%) | 49 (7.1%) |
| 80 to 84 Years | 0 (0.0%) | 14 (2.0%) |
| 85 Years and over | 0 (0.0%) | 0 (0.0%) |
| Total | 500 (100.0%) | 694 (100.0%) |
Families and Households in Aetna Estates
Median Family Size in Aetna Estates
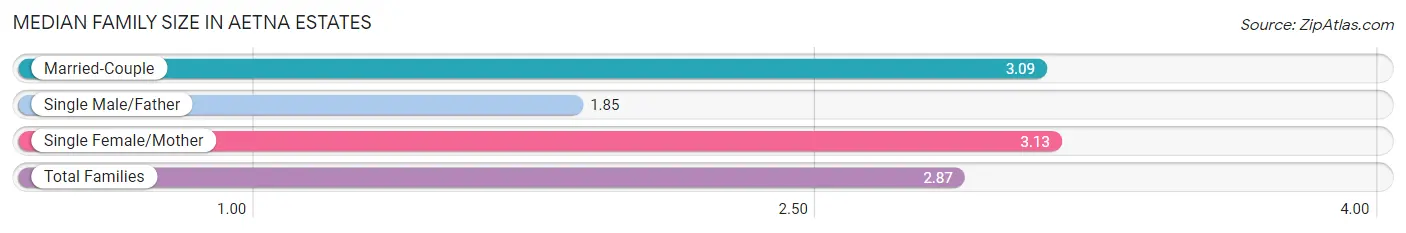
The median family size in Aetna Estates is 2.87 persons per family, with single female/mother families (104 | 26.3%) accounting for the largest median family size of 3.13 persons per family. On the other hand, single male/father families (74 | 18.7%) represent the smallest median family size with 1.85 persons per family.
| Family Type | # Families | Family Size |
| Married-Couple | 218 (55.0%) | 3.09 |
| Single Male/Father | 74 (18.7%) | 1.85 |
| Single Female/Mother | 104 (26.3%) | 3.13 |
| Total Families | 396 (100.0%) | 2.87 |
Median Household Size in Aetna Estates
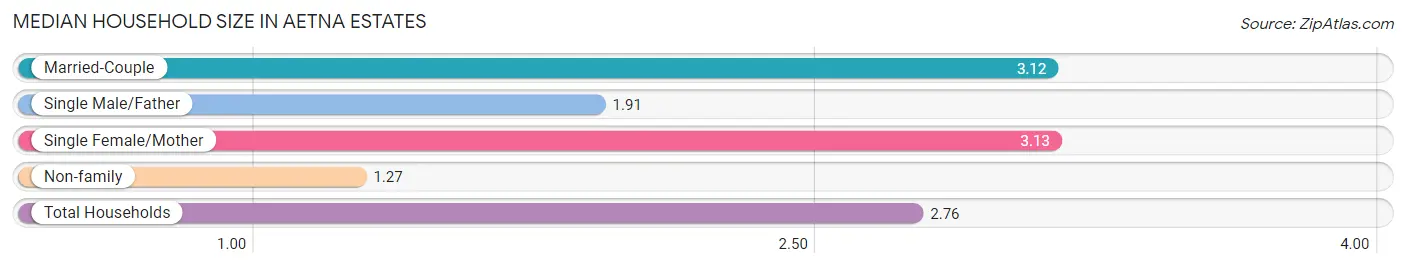
The median household size in Aetna Estates is 2.76 persons per household, with single female/mother households (104 | 24.0%) accounting for the largest median household size of 3.13 persons per household. non-family households (37 | 8.6%) represent the smallest median household size with 1.27 persons per household.
| Household Type | # Households | Household Size |
| Married-Couple | 218 (50.3%) | 3.12 |
| Single Male/Father | 74 (17.1%) | 1.91 |
| Single Female/Mother | 104 (24.0%) | 3.13 |
| Non-family | 37 (8.6%) | 1.27 |
| Total Households | 433 (100.0%) | 2.76 |
Household Size by Marriage Status in Aetna Estates
Out of a total of 433 households in Aetna Estates, 396 (91.4%) are family households, while 37 (8.6%) are nonfamily households. The most numerous type of family households are 2-person households, comprising 216, and the most common type of nonfamily households are 1-person households, comprising 29.
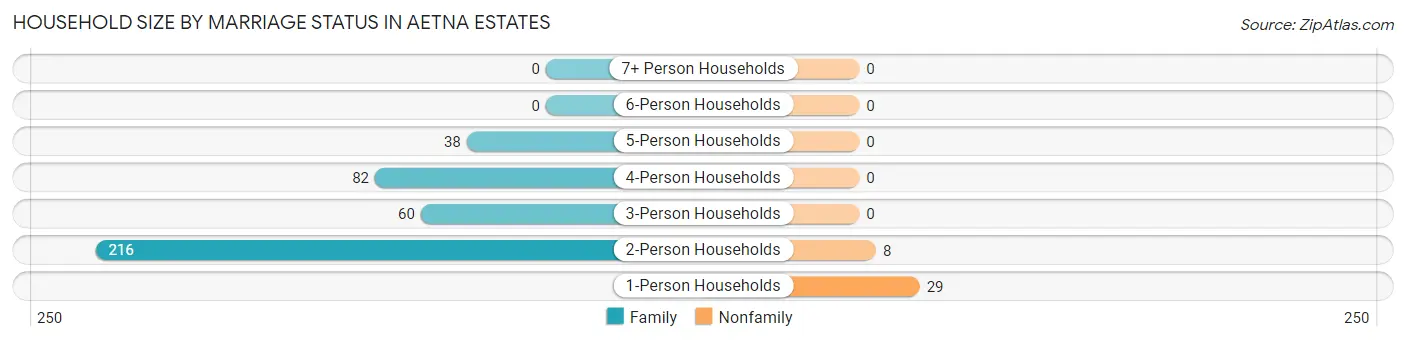
| Household Size | Family Households | Nonfamily Households |
| 1-Person Households | - | 29 (6.7%) |
| 2-Person Households | 216 (49.9%) | 8 (1.8%) |
| 3-Person Households | 60 (13.9%) | 0 (0.0%) |
| 4-Person Households | 82 (18.9%) | 0 (0.0%) |
| 5-Person Households | 38 (8.8%) | 0 (0.0%) |
| 6-Person Households | 0 (0.0%) | 0 (0.0%) |
| 7+ Person Households | 0 (0.0%) | 0 (0.0%) |
| Total | 396 (91.4%) | 37 (8.6%) |
Female Fertility in Aetna Estates
Fertility by Age in Aetna Estates
Average fertility rate in Aetna Estates is 13.0 births per 1,000 women. Women in the age bracket of 20 to 34 years have the highest fertility rate with 23.0 births per 1,000 women. Women in the age bracket of 20 to 34 years acount for 100.0% of all women with births.
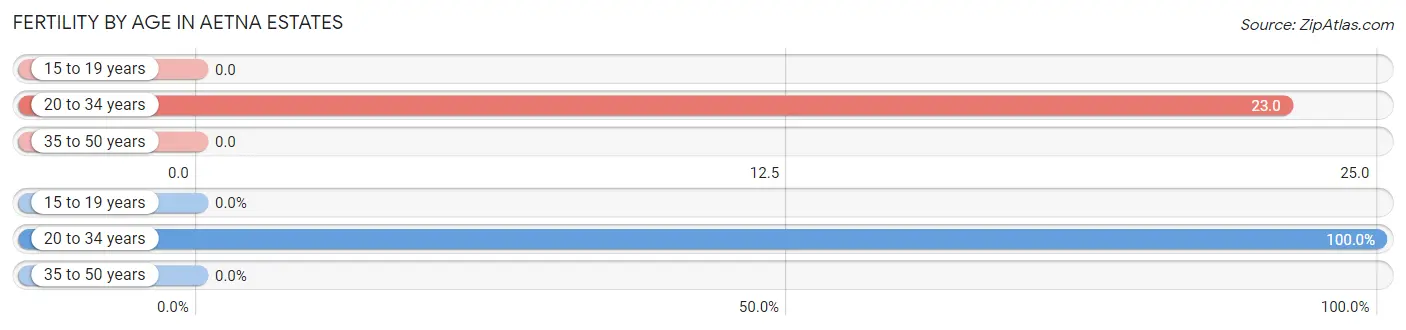
| Age Bracket | Women with Births | Births / 1,000 Women |
| 15 to 19 years | 0 (0.0%) | 0.0 |
| 20 to 34 years | 6 (100.0%) | 23.0 |
| 35 to 50 years | 0 (0.0%) | 0.0 |
| Total | 6 (100.0%) | 13.0 |
Fertility by Age by Marriage Status in Aetna Estates
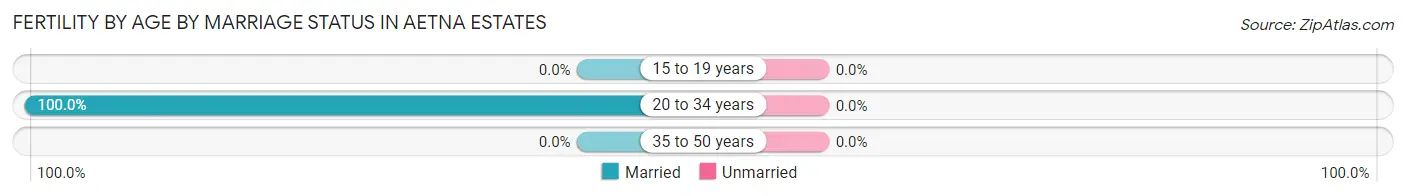
| Age Bracket | Married | Unmarried |
| 15 to 19 years | 0 (0.0%) | 0 (0.0%) |
| 20 to 34 years | 6 (100.0%) | 0 (0.0%) |
| 35 to 50 years | 0 (0.0%) | 0 (0.0%) |
| Total | 6 (100.0%) | 0 (0.0%) |
Fertility by Education in Aetna Estates
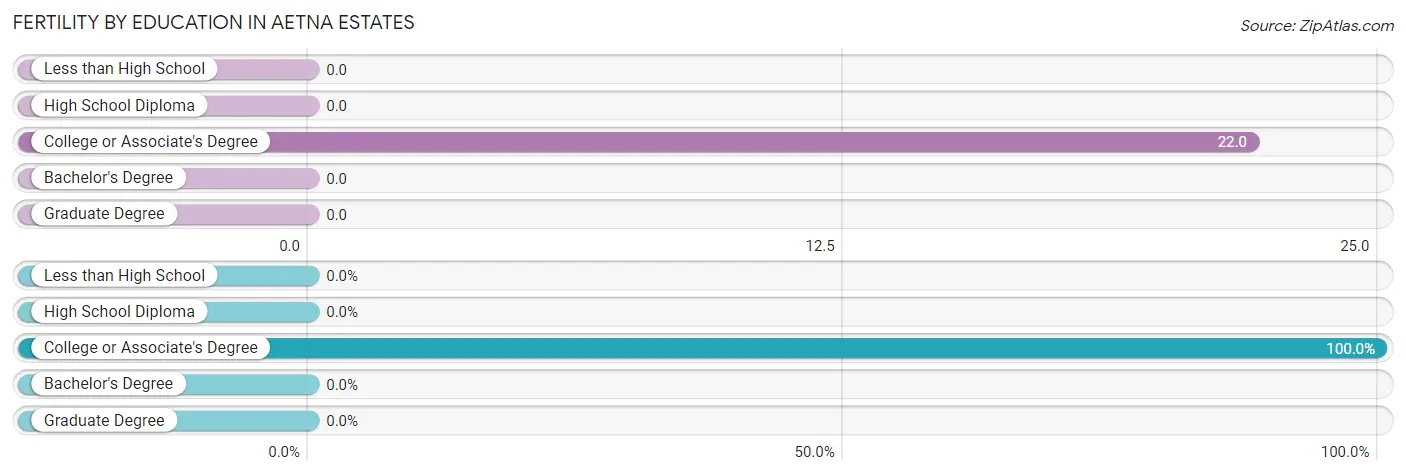
| Educational Attainment | Women with Births | Births / 1,000 Women |
| Less than High School | 0 (0.0%) | 0.0 |
| High School Diploma | 0 (0.0%) | 0.0 |
| College or Associate's Degree | 6 (100.0%) | 22.0 |
| Bachelor's Degree | 0 (0.0%) | 0.0 |
| Graduate Degree | 0 (0.0%) | 0.0 |
| Total | 6 (100.0%) | 13.0 |
Fertility by Education by Marriage Status in Aetna Estates
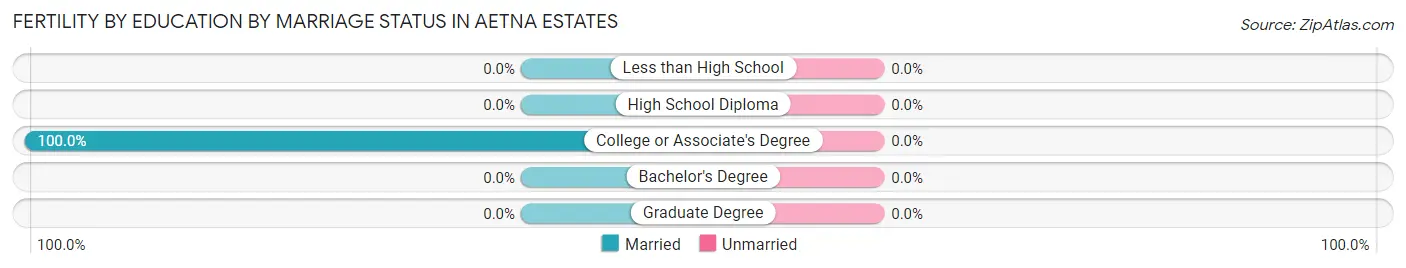
| Educational Attainment | Married | Unmarried |
| Less than High School | 0 (0.0%) | 0 (0.0%) |
| High School Diploma | 0 (0.0%) | 0 (0.0%) |
| College or Associate's Degree | 6 (100.0%) | 0 (0.0%) |
| Bachelor's Degree | 0 (0.0%) | 0 (0.0%) |
| Graduate Degree | 0 (0.0%) | 0 (0.0%) |
| Total | 6 (100.0%) | 0 (0.0%) |
Employment Characteristics in Aetna Estates
Employment by Class of Employer in Aetna Estates
Among the 658 employed individuals in Aetna Estates, private company employees (505 | 76.7%), self-employed (not incorporated) (64 | 9.7%), and federal government employees (31 | 4.7%) make up the most common classes of employment.
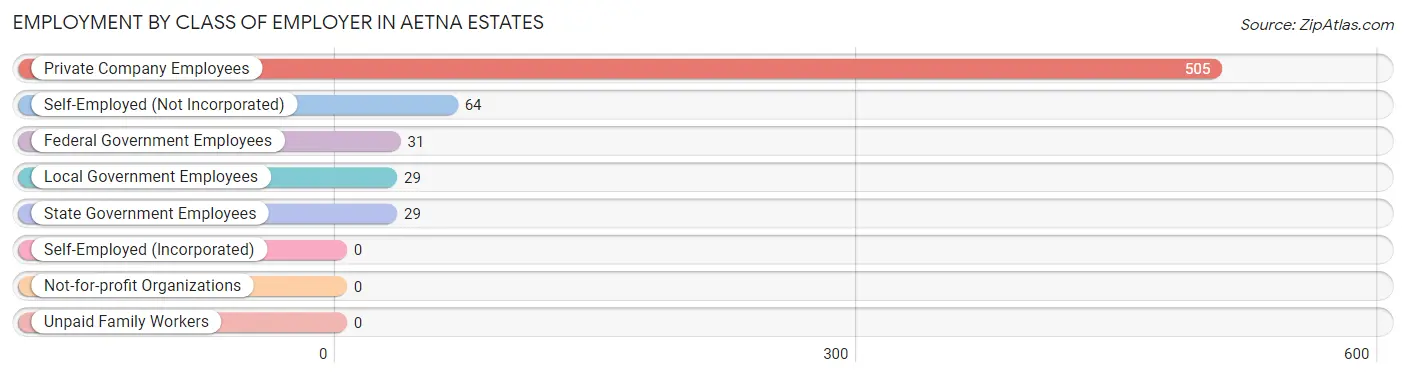
| Employer Class | # Employees | % Employees |
| Private Company Employees | 505 | 76.7% |
| Self-Employed (Incorporated) | 0 | 0.0% |
| Self-Employed (Not Incorporated) | 64 | 9.7% |
| Not-for-profit Organizations | 0 | 0.0% |
| Local Government Employees | 29 | 4.4% |
| State Government Employees | 29 | 4.4% |
| Federal Government Employees | 31 | 4.7% |
| Unpaid Family Workers | 0 | 0.0% |
| Total | 658 | 100.0% |
Employment Status by Age in Aetna Estates
According to the labor force statistics for Aetna Estates, out of the total population over 16 years of age (1,048), 69.7% or 730 individuals are in the labor force, with 9.9% or 72 of them unemployed. The age group with the highest labor force participation rate is 25 to 29 years, with 100.0% or 8 individuals in the labor force. Within the labor force, the 35 to 44 years age range has the highest percentage of unemployed individuals, with 39.1% or 66 of them being unemployed.
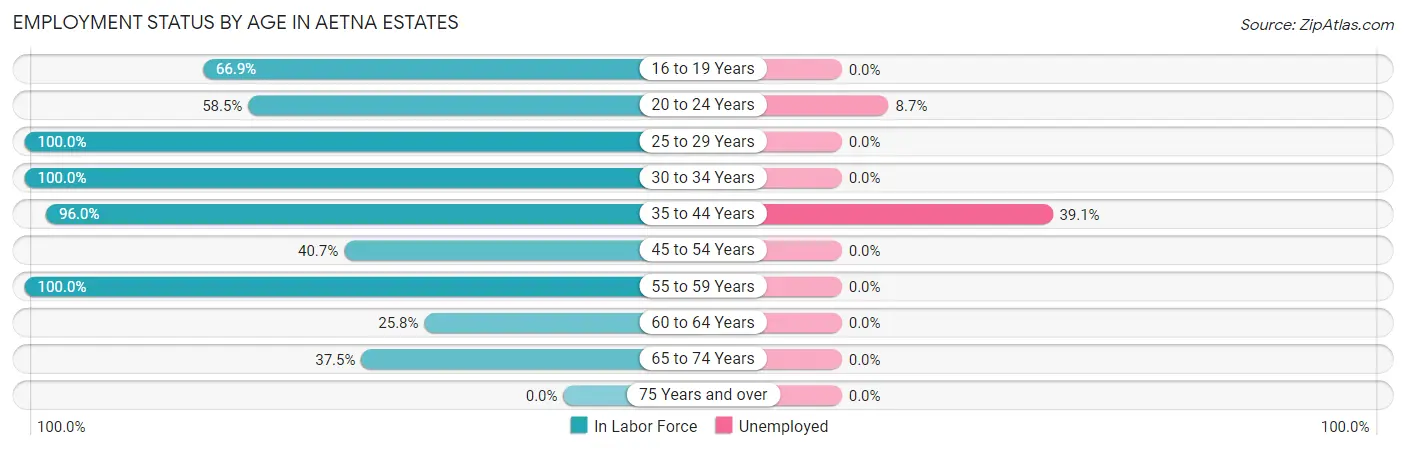
| Age Bracket | In Labor Force | Unemployed |
| 16 to 19 Years | 79 (66.9%) | 0 (0.0%) |
| 20 to 24 Years | 69 (58.5%) | 6 (8.7%) |
| 25 to 29 Years | 8 (100.0%) | 0 (0.0%) |
| 30 to 34 Years | 183 (100.0%) | 0 (0.0%) |
| 35 to 44 Years | 169 (96.0%) | 66 (39.1%) |
| 45 to 54 Years | 87 (40.7%) | 0 (0.0%) |
| 55 to 59 Years | 121 (100.0%) | 0 (0.0%) |
| 60 to 64 Years | 8 (25.8%) | 0 (0.0%) |
| 65 to 74 Years | 6 (37.5%) | 0 (0.0%) |
| 75 Years and over | 0 (0.0%) | 0 (0.0%) |
| Total | 730 (69.7%) | 72 (9.9%) |
Employment Status by Educational Attainment in Aetna Estates
According to labor force statistics for Aetna Estates, 78.6% of individuals (576) out of the total population between 25 and 64 years of age (733) are in the labor force, with 11.5% or 66 of them being unemployed. The group with the highest labor force participation rate are those with the educational attainment of bachelor's degree or higher, with 100.0% or 68 individuals in the labor force. Within the labor force, individuals with less than high school education have the highest percentage of unemployment, with 32.5% or 66 of them being unemployed.
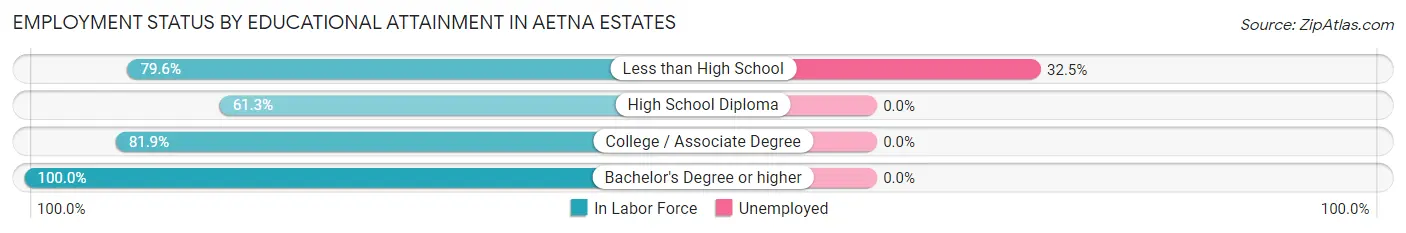
| Educational Attainment | In Labor Force | Unemployed |
| Less than High School | 203 (79.6%) | 83 (32.5%) |
| High School Diploma | 92 (61.3%) | 0 (0.0%) |
| College / Associate Degree | 213 (81.9%) | 0 (0.0%) |
| Bachelor's Degree or higher | 68 (100.0%) | 0 (0.0%) |
| Total | 576 (78.6%) | 84 (11.5%) |
Employment Occupations by Sex in Aetna Estates
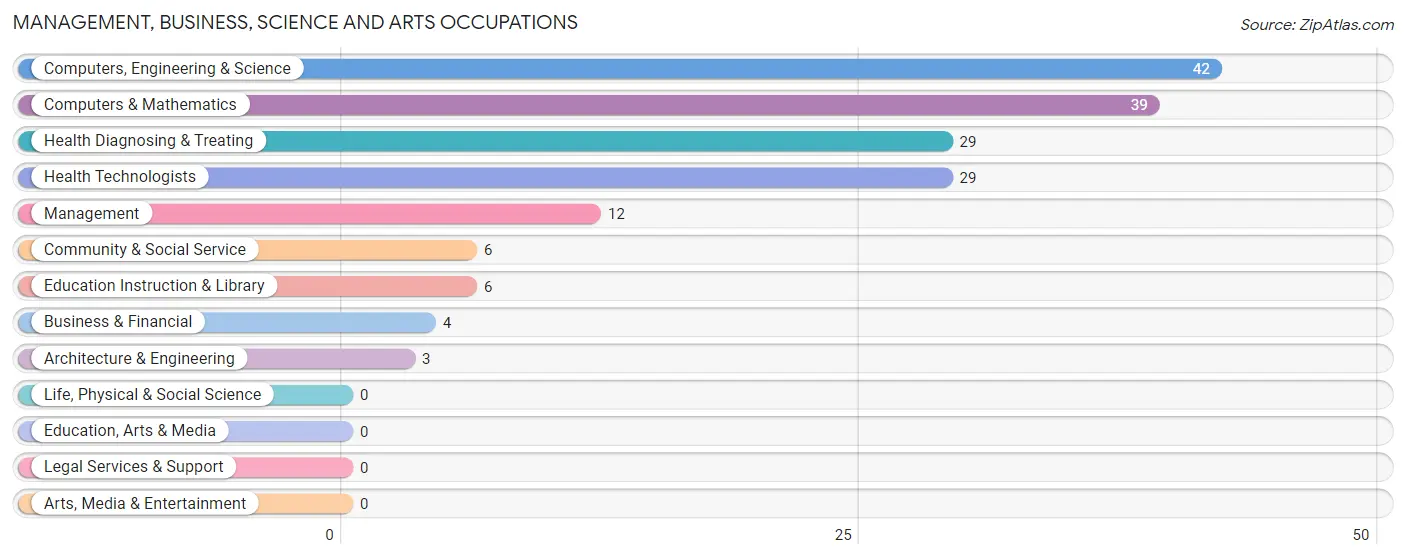
Management, Business, Science and Arts Occupations
The most common Management, Business, Science and Arts occupations in Aetna Estates are Computers, Engineering & Science (42 | 6.4%), Computers & Mathematics (39 | 5.9%), Health Diagnosing & Treating (29 | 4.4%), Health Technologists (29 | 4.4%), and Management (12 | 1.8%).
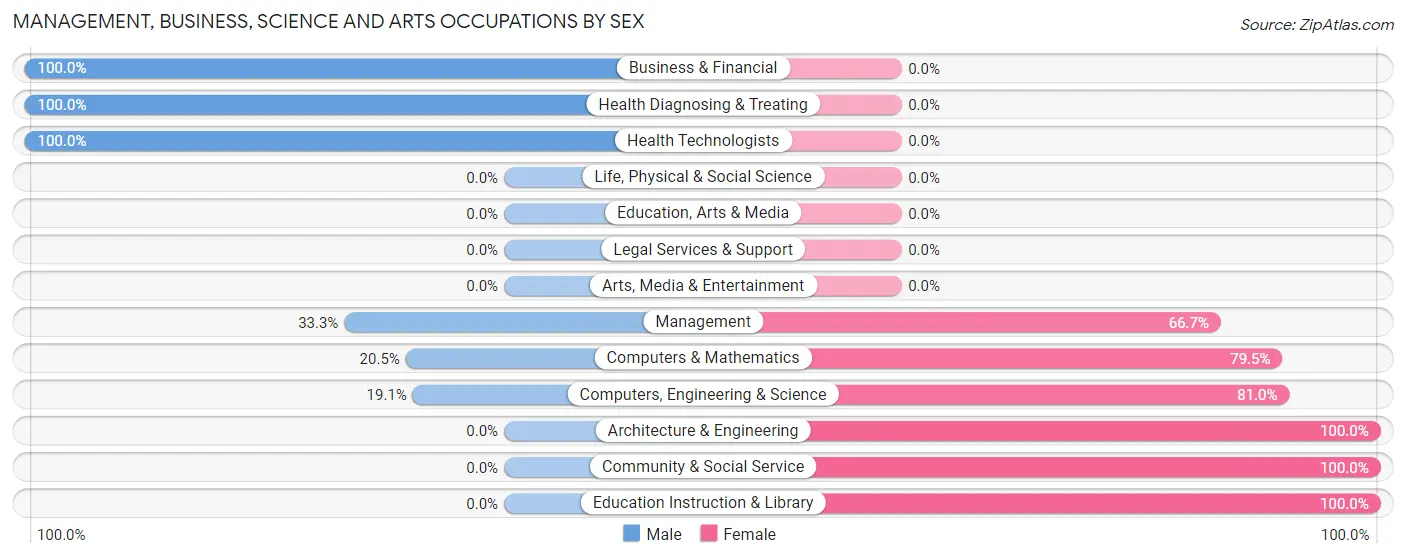
Management, Business, Science and Arts Occupations by Sex
Within the Management, Business, Science and Arts occupations in Aetna Estates, the most male-oriented occupations are Business & Financial (100.0%), Health Diagnosing & Treating (100.0%), and Health Technologists (100.0%), while the most female-oriented occupations are Architecture & Engineering (100.0%), Community & Social Service (100.0%), and Education Instruction & Library (100.0%).
| Occupation | Male | Female |
| Management | 4 (33.3%) | 8 (66.7%) |
| Business & Financial | 4 (100.0%) | 0 (0.0%) |
| Computers, Engineering & Science | 8 (19.1%) | 34 (80.9%) |
| Computers & Mathematics | 8 (20.5%) | 31 (79.5%) |
| Architecture & Engineering | 0 (0.0%) | 3 (100.0%) |
| Life, Physical & Social Science | 0 (0.0%) | 0 (0.0%) |
| Community & Social Service | 0 (0.0%) | 6 (100.0%) |
| Education, Arts & Media | 0 (0.0%) | 0 (0.0%) |
| Legal Services & Support | 0 (0.0%) | 0 (0.0%) |
| Education Instruction & Library | 0 (0.0%) | 6 (100.0%) |
| Arts, Media & Entertainment | 0 (0.0%) | 0 (0.0%) |
| Health Diagnosing & Treating | 29 (100.0%) | 0 (0.0%) |
| Health Technologists | 29 (100.0%) | 0 (0.0%) |
| Total (Category) | 45 (48.4%) | 48 (51.6%) |
| Total (Overall) | 269 (40.9%) | 389 (59.1%) |
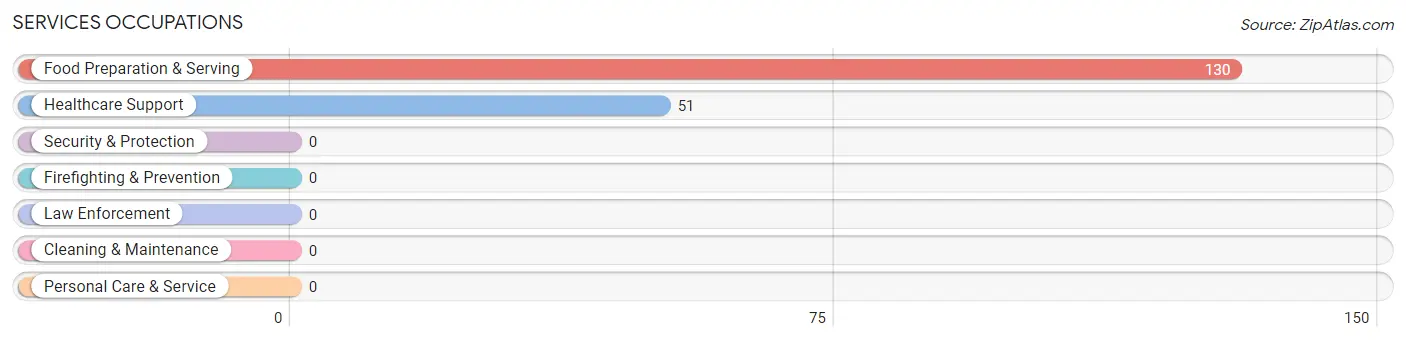
Services Occupations
The most common Services occupations in Aetna Estates are Food Preparation & Serving (130 | 19.8%), and Healthcare Support (51 | 7.7%).
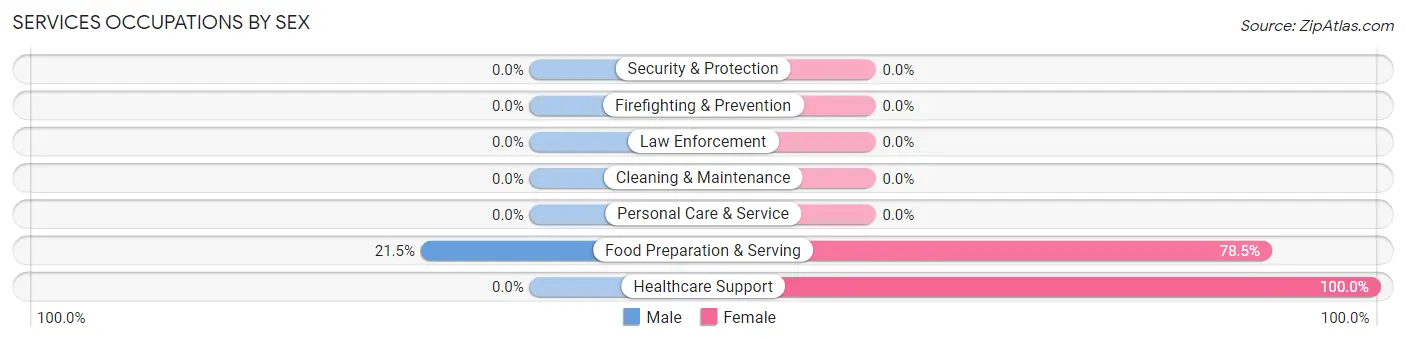
Services Occupations by Sex
| Occupation | Male | Female |
| Healthcare Support | 0 (0.0%) | 51 (100.0%) |
| Security & Protection | 0 (0.0%) | 0 (0.0%) |
| Firefighting & Prevention | 0 (0.0%) | 0 (0.0%) |
| Law Enforcement | 0 (0.0%) | 0 (0.0%) |
| Food Preparation & Serving | 28 (21.5%) | 102 (78.5%) |
| Cleaning & Maintenance | 0 (0.0%) | 0 (0.0%) |
| Personal Care & Service | 0 (0.0%) | 0 (0.0%) |
| Total (Category) | 28 (15.5%) | 153 (84.5%) |
| Total (Overall) | 269 (40.9%) | 389 (59.1%) |
Sales and Office Occupations
The most common Sales and Office occupations in Aetna Estates are Office & Administration (177 | 26.9%), and Sales & Related (11 | 1.7%).
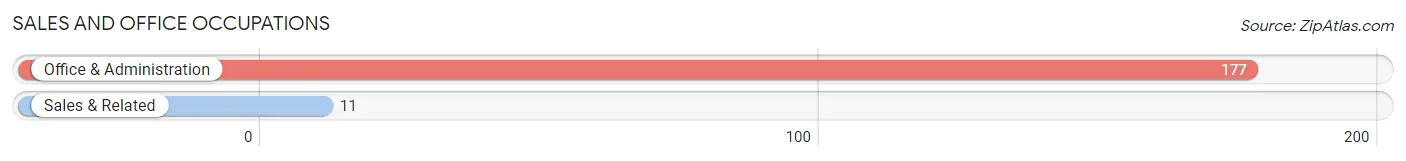
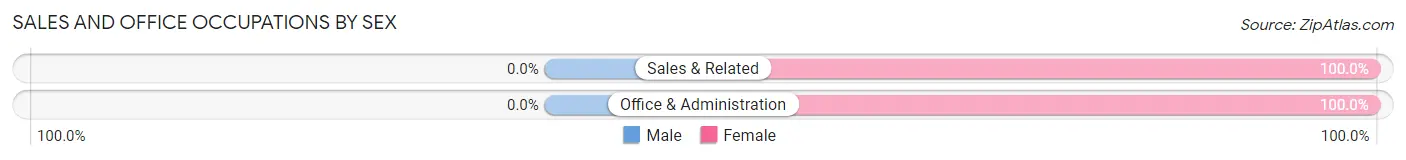
Sales and Office Occupations by Sex
| Occupation | Male | Female |
| Sales & Related | 0 (0.0%) | 11 (100.0%) |
| Office & Administration | 0 (0.0%) | 177 (100.0%) |
| Total (Category) | 0 (0.0%) | 188 (100.0%) |
| Total (Overall) | 269 (40.9%) | 389 (59.1%) |
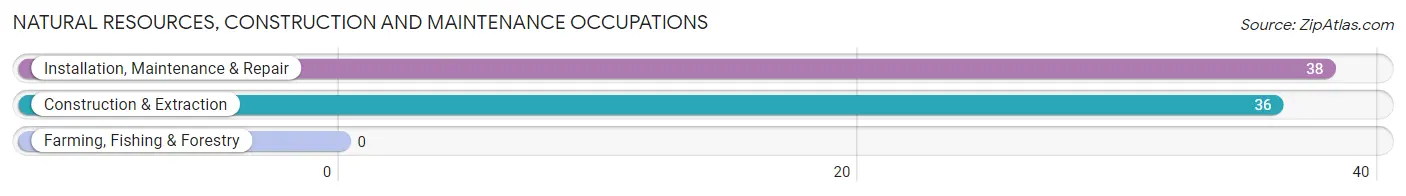
Natural Resources, Construction and Maintenance Occupations
The most common Natural Resources, Construction and Maintenance occupations in Aetna Estates are Installation, Maintenance & Repair (38 | 5.8%), and Construction & Extraction (36 | 5.5%).
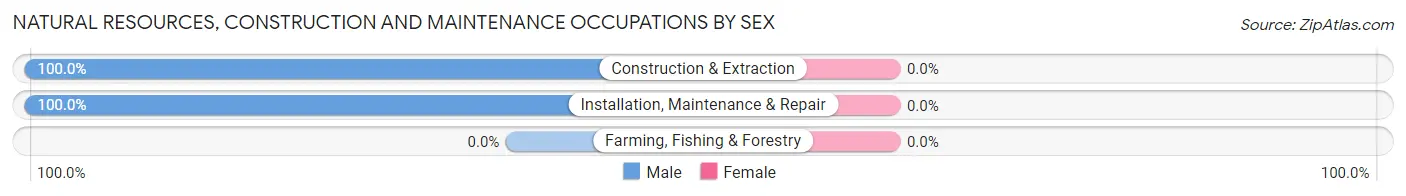
Natural Resources, Construction and Maintenance Occupations by Sex
| Occupation | Male | Female |
| Farming, Fishing & Forestry | 0 (0.0%) | 0 (0.0%) |
| Construction & Extraction | 36 (100.0%) | 0 (0.0%) |
| Installation, Maintenance & Repair | 38 (100.0%) | 0 (0.0%) |
| Total (Category) | 74 (100.0%) | 0 (0.0%) |
| Total (Overall) | 269 (40.9%) | 389 (59.1%) |
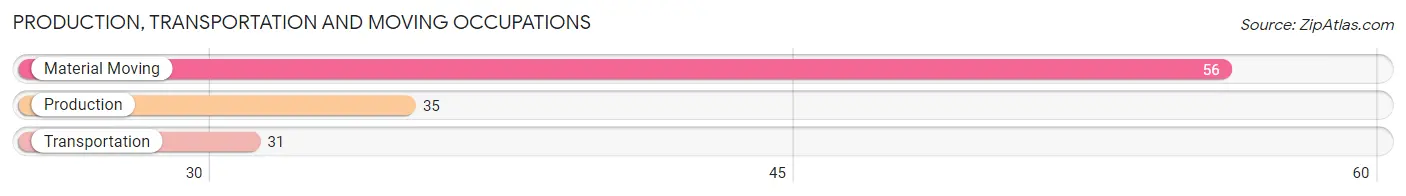
Production, Transportation and Moving Occupations
The most common Production, Transportation and Moving occupations in Aetna Estates are Material Moving (56 | 8.5%), Production (35 | 5.3%), and Transportation (31 | 4.7%).
Production, Transportation and Moving Occupations by Sex
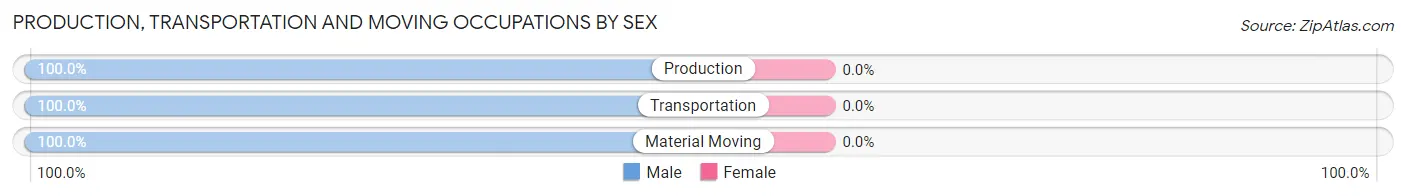
| Occupation | Male | Female |
| Production | 35 (100.0%) | 0 (0.0%) |
| Transportation | 31 (100.0%) | 0 (0.0%) |
| Material Moving | 56 (100.0%) | 0 (0.0%) |
| Total (Category) | 122 (100.0%) | 0 (0.0%) |
| Total (Overall) | 269 (40.9%) | 389 (59.1%) |
Employment Industries by Sex in Aetna Estates
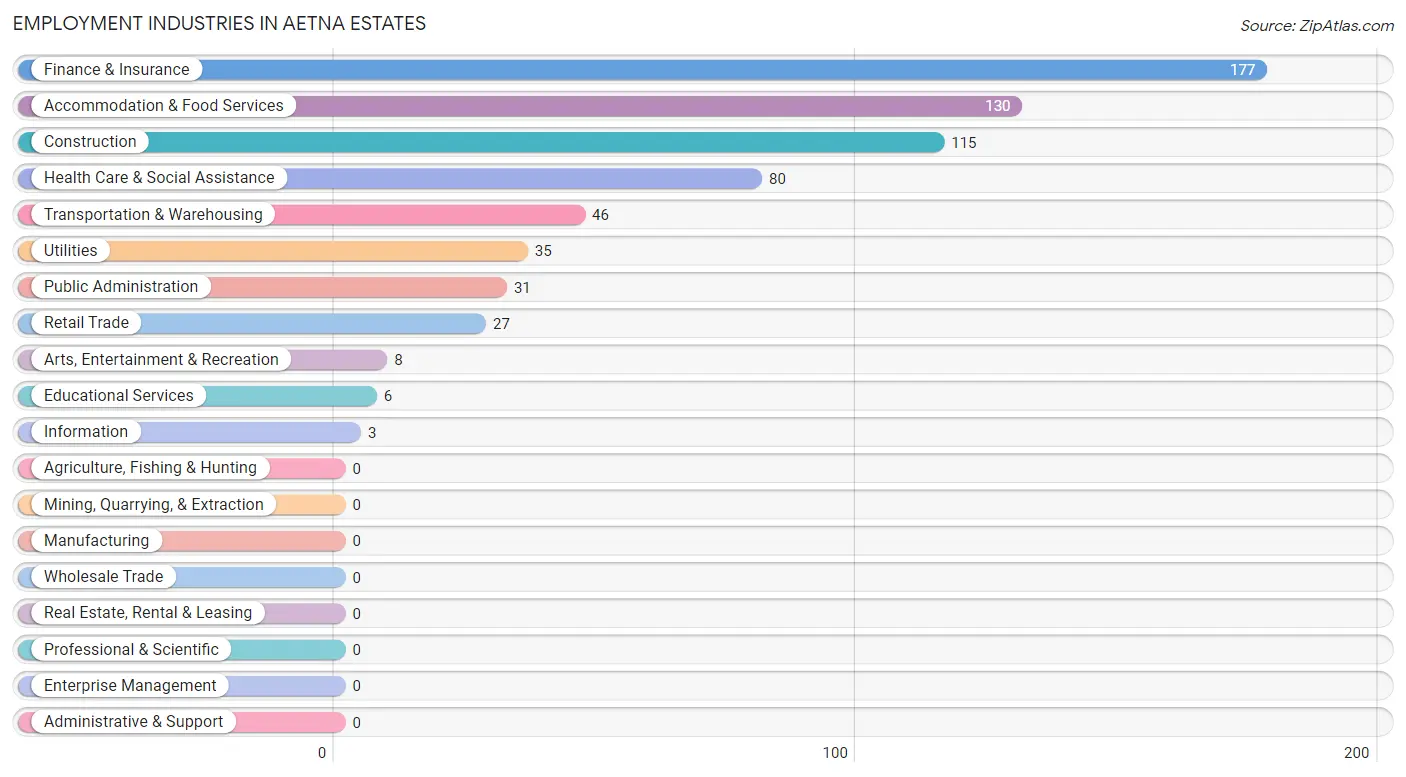
Employment Industries in Aetna Estates
The major employment industries in Aetna Estates include Finance & Insurance (177 | 26.9%), Accommodation & Food Services (130 | 19.8%), Construction (115 | 17.5%), Health Care & Social Assistance (80 | 12.2%), and Transportation & Warehousing (46 | 7.0%).
Employment Industries by Sex in Aetna Estates
The Aetna Estates industries that see more men than women are Construction (100.0%), Transportation & Warehousing (100.0%), and Utilities (100.0%), whereas the industries that tend to have a higher number of women are Information (100.0%), Finance & Insurance (100.0%), and Educational Services (100.0%).
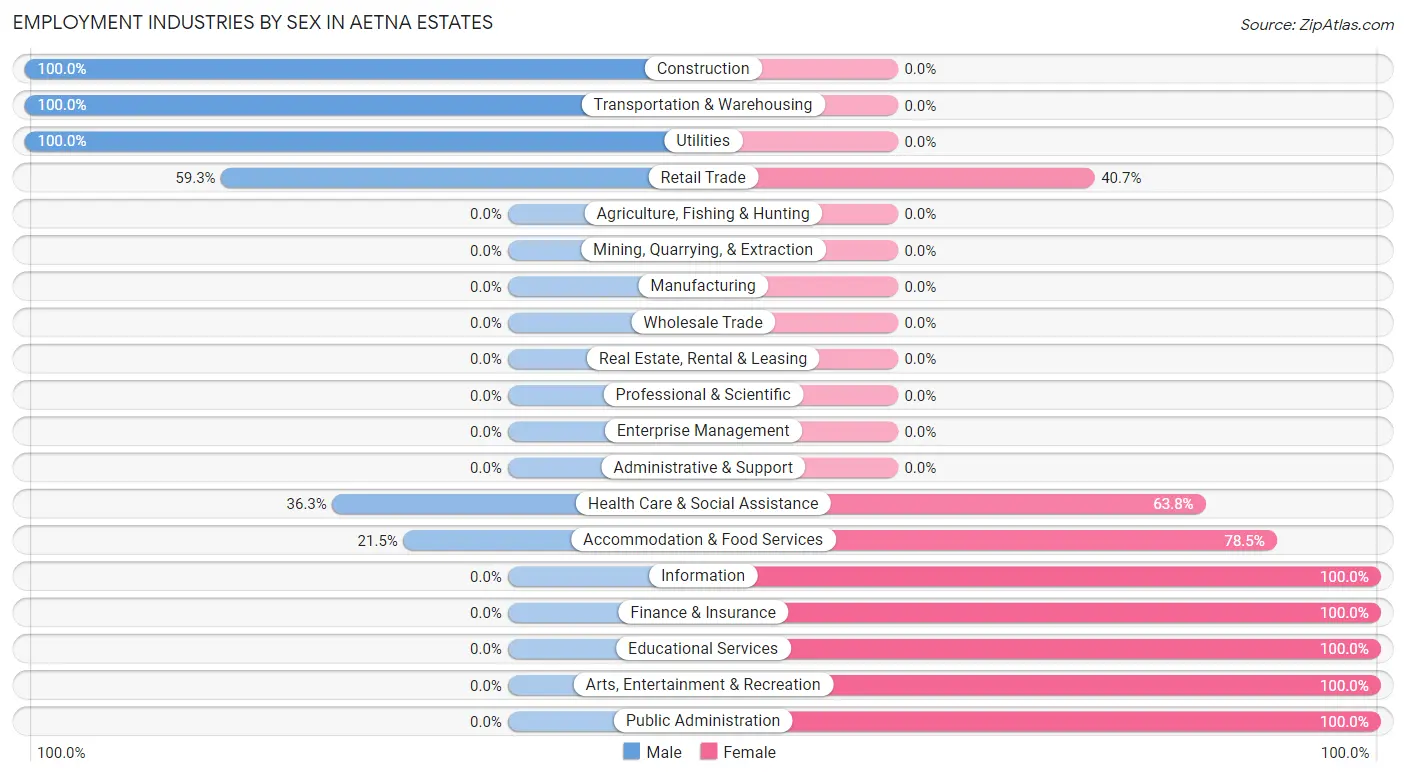
| Industry | Male | Female |
| Agriculture, Fishing & Hunting | 0 (0.0%) | 0 (0.0%) |
| Mining, Quarrying, & Extraction | 0 (0.0%) | 0 (0.0%) |
| Construction | 115 (100.0%) | 0 (0.0%) |
| Manufacturing | 0 (0.0%) | 0 (0.0%) |
| Wholesale Trade | 0 (0.0%) | 0 (0.0%) |
| Retail Trade | 16 (59.3%) | 11 (40.7%) |
| Transportation & Warehousing | 46 (100.0%) | 0 (0.0%) |
| Utilities | 35 (100.0%) | 0 (0.0%) |
| Information | 0 (0.0%) | 3 (100.0%) |
| Finance & Insurance | 0 (0.0%) | 177 (100.0%) |
| Real Estate, Rental & Leasing | 0 (0.0%) | 0 (0.0%) |
| Professional & Scientific | 0 (0.0%) | 0 (0.0%) |
| Enterprise Management | 0 (0.0%) | 0 (0.0%) |
| Administrative & Support | 0 (0.0%) | 0 (0.0%) |
| Educational Services | 0 (0.0%) | 6 (100.0%) |
| Health Care & Social Assistance | 29 (36.2%) | 51 (63.7%) |
| Arts, Entertainment & Recreation | 0 (0.0%) | 8 (100.0%) |
| Accommodation & Food Services | 28 (21.5%) | 102 (78.5%) |
| Public Administration | 0 (0.0%) | 31 (100.0%) |
| Total | 269 (40.9%) | 389 (59.1%) |
Education in Aetna Estates
School Enrollment in Aetna Estates
The most common levels of schooling among the 222 students in Aetna Estates are high school (106 | 47.7%), middle school (50 | 22.5%), and college / undergraduate (43 | 19.4%).
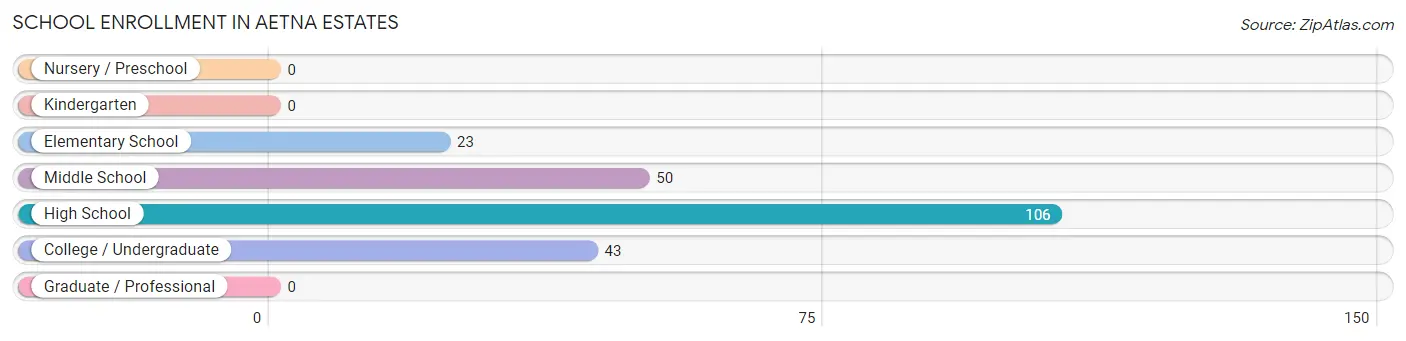
| School Level | # Students | % Students |
| Nursery / Preschool | 0 | 0.0% |
| Kindergarten | 0 | 0.0% |
| Elementary School | 23 | 10.4% |
| Middle School | 50 | 22.5% |
| High School | 106 | 47.7% |
| College / Undergraduate | 43 | 19.4% |
| Graduate / Professional | 0 | 0.0% |
| Total | 222 | 100.0% |
School Enrollment by Age by Funding Source in Aetna Estates
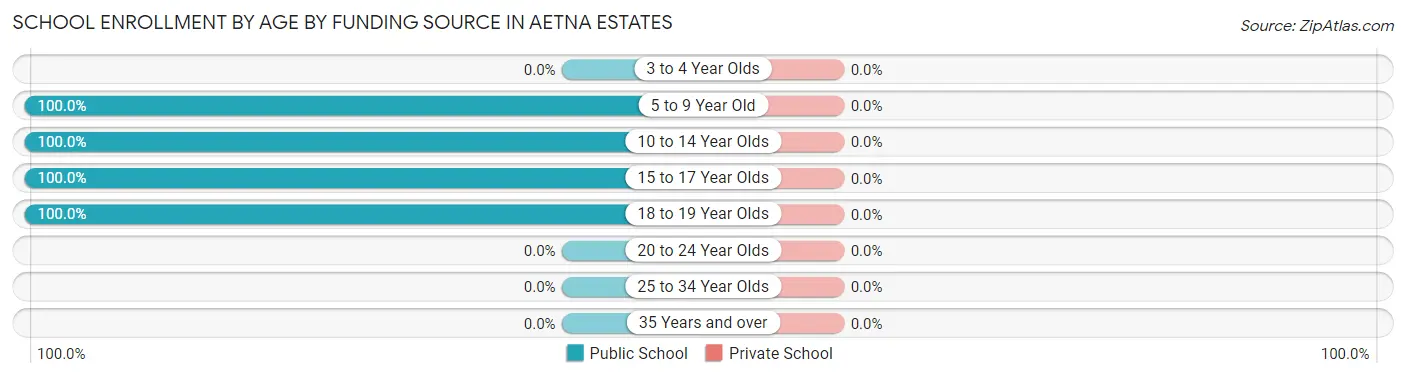
| Age Bracket | Public School | Private School |
| 3 to 4 Year Olds | 0 (0.0%) | 0 (0.0%) |
| 5 to 9 Year Old | 26 (100.0%) | 0 (0.0%) |
| 10 to 14 Year Olds | 82 (100.0%) | 0 (0.0%) |
| 15 to 17 Year Olds | 71 (100.0%) | 0 (0.0%) |
| 18 to 19 Year Olds | 43 (100.0%) | 0 (0.0%) |
| 20 to 24 Year Olds | 0 (0.0%) | 0 (0.0%) |
| 25 to 34 Year Olds | 0 (0.0%) | 0 (0.0%) |
| 35 Years and over | 0 (0.0%) | 0 (0.0%) |
| Total | 222 (100.0%) | 0 (0.0%) |
Educational Attainment by Field of Study in Aetna Estates
Business (31 | 45.6%), arts & humanities (29 | 42.6%), and physical & health sciences (8 | 11.8%) are the most common fields of study among 68 individuals in Aetna Estates who have obtained a bachelor's degree or higher.
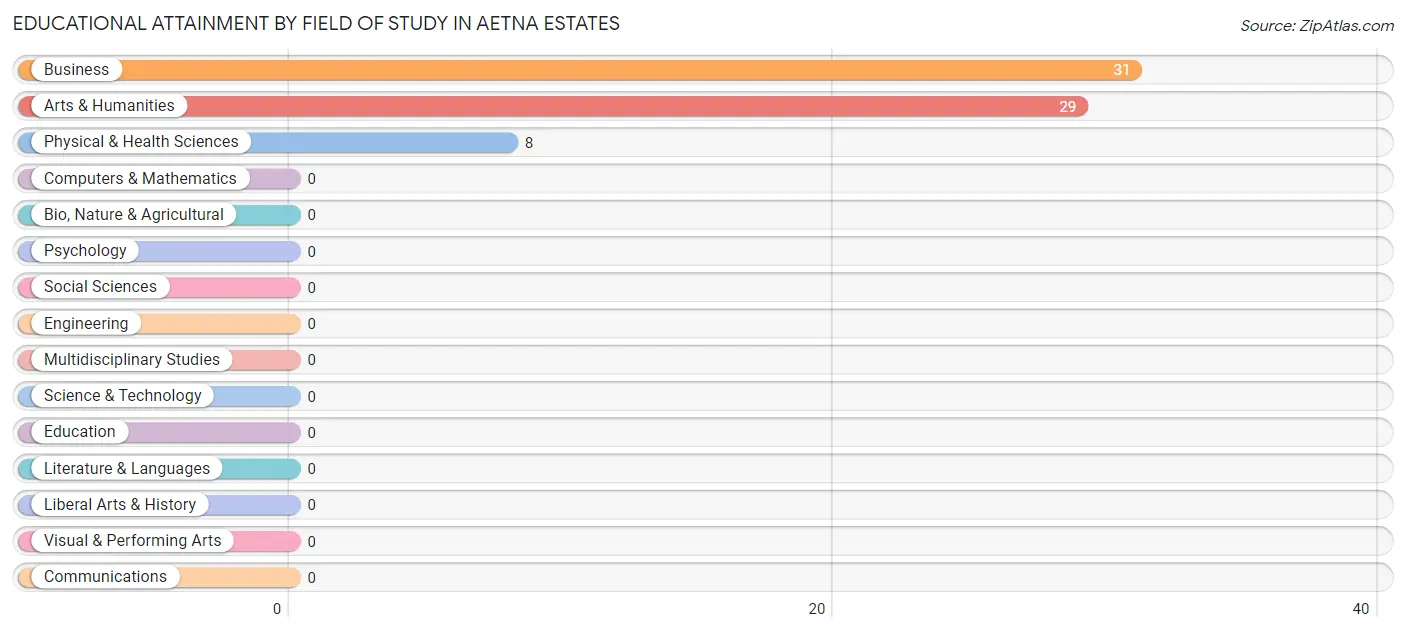
| Field of Study | # Graduates | % Graduates |
| Computers & Mathematics | 0 | 0.0% |
| Bio, Nature & Agricultural | 0 | 0.0% |
| Physical & Health Sciences | 8 | 11.8% |
| Psychology | 0 | 0.0% |
| Social Sciences | 0 | 0.0% |
| Engineering | 0 | 0.0% |
| Multidisciplinary Studies | 0 | 0.0% |
| Science & Technology | 0 | 0.0% |
| Business | 31 | 45.6% |
| Education | 0 | 0.0% |
| Literature & Languages | 0 | 0.0% |
| Liberal Arts & History | 0 | 0.0% |
| Visual & Performing Arts | 0 | 0.0% |
| Communications | 0 | 0.0% |
| Arts & Humanities | 29 | 42.6% |
| Total | 68 | 100.0% |
Transportation & Commute in Aetna Estates
Vehicle Availability by Sex in Aetna Estates
The most prevalent vehicle ownership categories in Aetna Estates are males with 4 vehicles (128, accounting for 47.6%) and females with 4 vehicles (35, making up 32.9%).
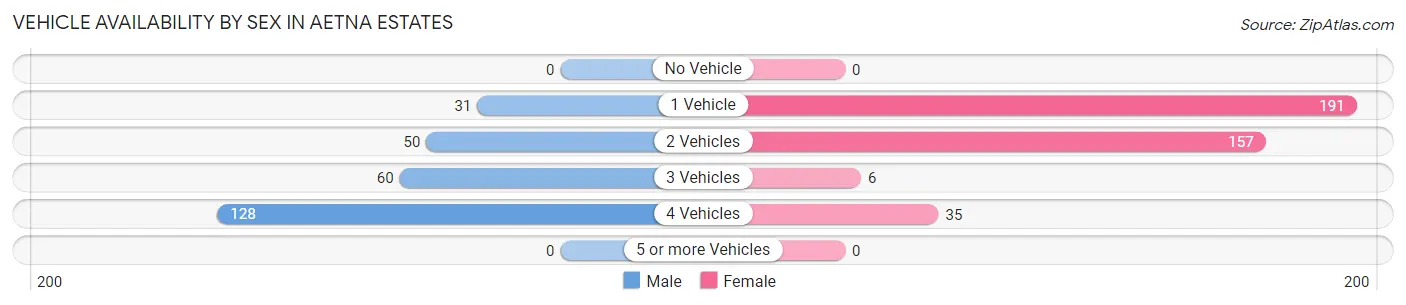
| Vehicles Available | Male | Female |
| No Vehicle | 0 (0.0%) | 0 (0.0%) |
| 1 Vehicle | 31 (11.5%) | 191 (49.1%) |
| 2 Vehicles | 50 (18.6%) | 157 (40.4%) |
| 3 Vehicles | 60 (22.3%) | 6 (1.5%) |
| 4 Vehicles | 128 (47.6%) | 35 (9.0%) |
| 5 or more Vehicles | 0 (0.0%) | 0 (0.0%) |
| Total | 269 (100.0%) | 389 (100.0%) |
Commute Time in Aetna Estates
The most frequently occuring commute durations in Aetna Estates are 15 to 19 minutes (210 commuters, 31.9%), 45 to 59 minutes (172 commuters, 26.1%), and 30 to 34 minutes (85 commuters, 12.9%).
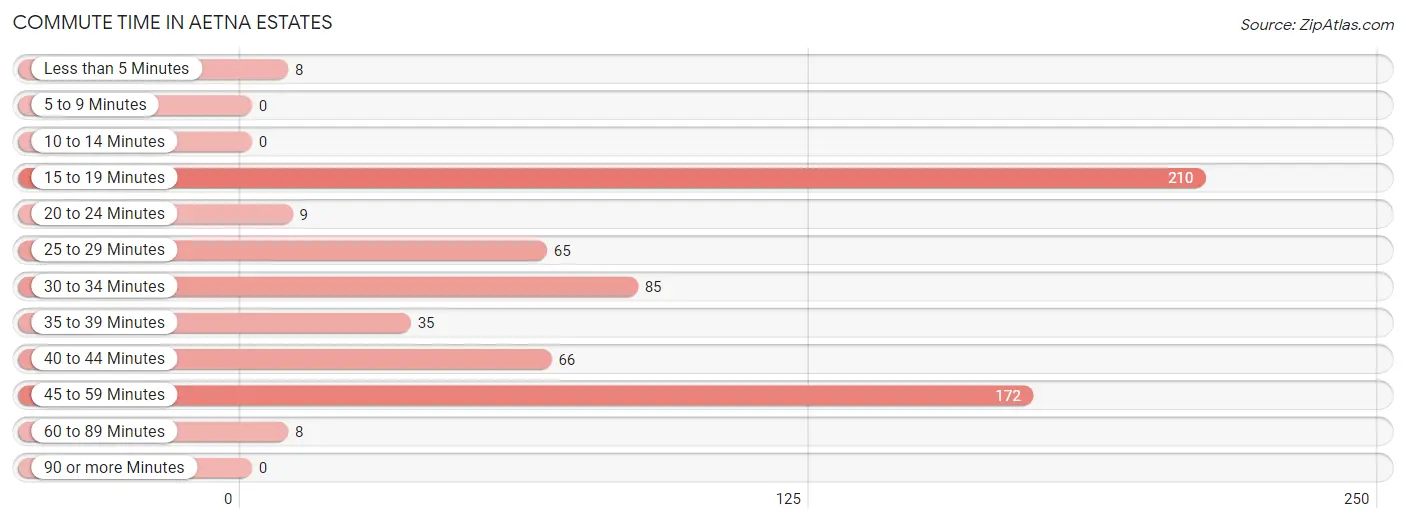
| Commute Time | # Commuters | % Commuters |
| Less than 5 Minutes | 8 | 1.2% |
| 5 to 9 Minutes | 0 | 0.0% |
| 10 to 14 Minutes | 0 | 0.0% |
| 15 to 19 Minutes | 210 | 31.9% |
| 20 to 24 Minutes | 9 | 1.4% |
| 25 to 29 Minutes | 65 | 9.9% |
| 30 to 34 Minutes | 85 | 12.9% |
| 35 to 39 Minutes | 35 | 5.3% |
| 40 to 44 Minutes | 66 | 10.0% |
| 45 to 59 Minutes | 172 | 26.1% |
| 60 to 89 Minutes | 8 | 1.2% |
| 90 or more Minutes | 0 | 0.0% |
Commute Time by Sex in Aetna Estates
The most common commute times in Aetna Estates are 45 to 59 minutes (122 commuters, 45.4%) for males and 15 to 19 minutes (177 commuters, 45.5%) for females.
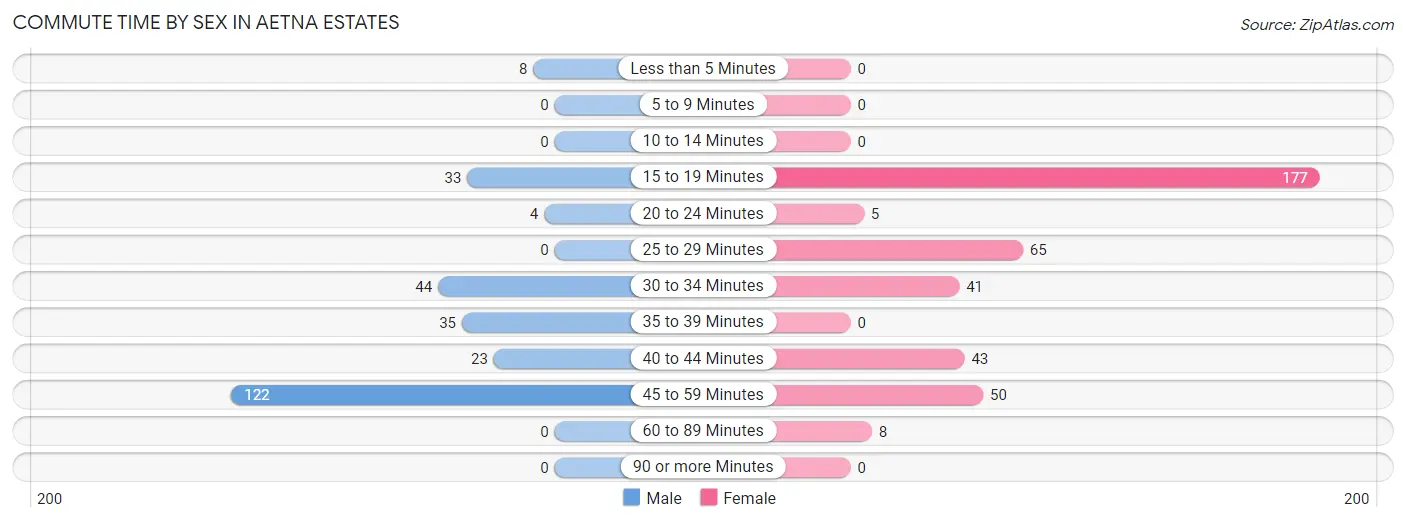
| Commute Time | Male | Female |
| Less than 5 Minutes | 8 (3.0%) | 0 (0.0%) |
| 5 to 9 Minutes | 0 (0.0%) | 0 (0.0%) |
| 10 to 14 Minutes | 0 (0.0%) | 0 (0.0%) |
| 15 to 19 Minutes | 33 (12.3%) | 177 (45.5%) |
| 20 to 24 Minutes | 4 (1.5%) | 5 (1.3%) |
| 25 to 29 Minutes | 0 (0.0%) | 65 (16.7%) |
| 30 to 34 Minutes | 44 (16.4%) | 41 (10.5%) |
| 35 to 39 Minutes | 35 (13.0%) | 0 (0.0%) |
| 40 to 44 Minutes | 23 (8.6%) | 43 (11.1%) |
| 45 to 59 Minutes | 122 (45.4%) | 50 (12.9%) |
| 60 to 89 Minutes | 0 (0.0%) | 8 (2.1%) |
| 90 or more Minutes | 0 (0.0%) | 0 (0.0%) |
Time of Departure to Work by Sex in Aetna Estates
The most frequent times of departure to work in Aetna Estates are 6:30 AM to 6:59 AM (74, 27.5%) for males and 7:00 AM to 7:29 AM (104, 26.7%) for females.
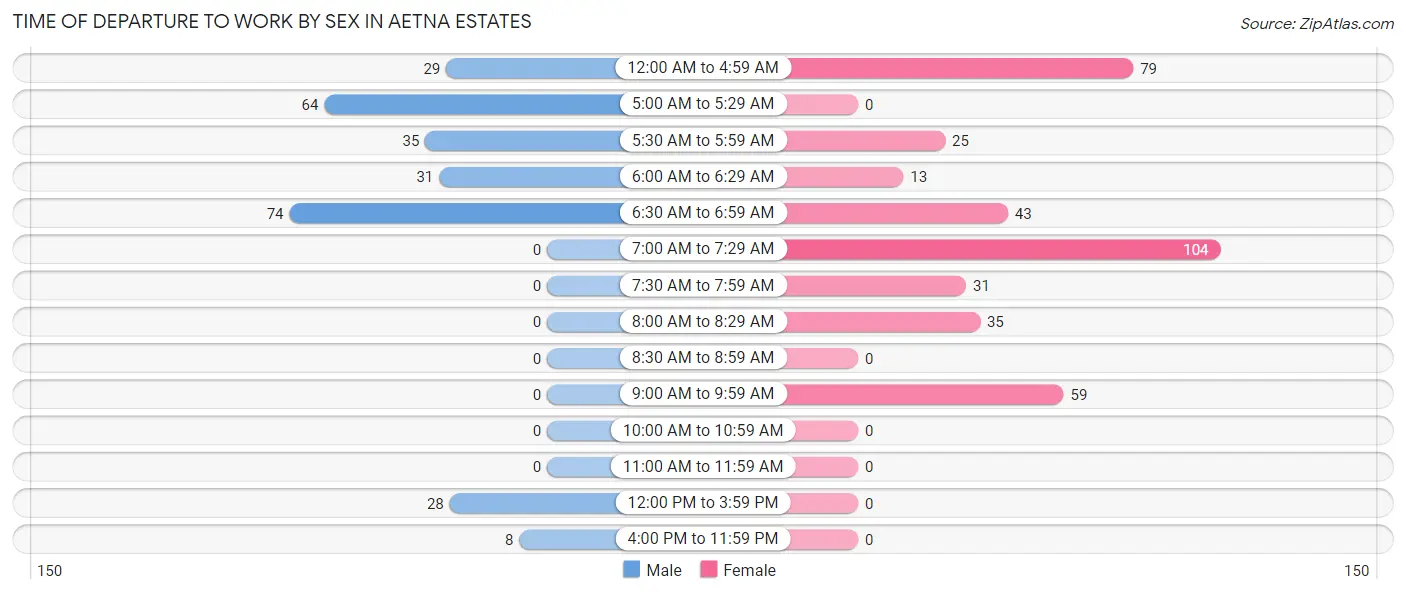
| Time of Departure | Male | Female |
| 12:00 AM to 4:59 AM | 29 (10.8%) | 79 (20.3%) |
| 5:00 AM to 5:29 AM | 64 (23.8%) | 0 (0.0%) |
| 5:30 AM to 5:59 AM | 35 (13.0%) | 25 (6.4%) |
| 6:00 AM to 6:29 AM | 31 (11.5%) | 13 (3.3%) |
| 6:30 AM to 6:59 AM | 74 (27.5%) | 43 (11.1%) |
| 7:00 AM to 7:29 AM | 0 (0.0%) | 104 (26.7%) |
| 7:30 AM to 7:59 AM | 0 (0.0%) | 31 (8.0%) |
| 8:00 AM to 8:29 AM | 0 (0.0%) | 35 (9.0%) |
| 8:30 AM to 8:59 AM | 0 (0.0%) | 0 (0.0%) |
| 9:00 AM to 9:59 AM | 0 (0.0%) | 59 (15.2%) |
| 10:00 AM to 10:59 AM | 0 (0.0%) | 0 (0.0%) |
| 11:00 AM to 11:59 AM | 0 (0.0%) | 0 (0.0%) |
| 12:00 PM to 3:59 PM | 28 (10.4%) | 0 (0.0%) |
| 4:00 PM to 11:59 PM | 8 (3.0%) | 0 (0.0%) |
| Total | 269 (100.0%) | 389 (100.0%) |
Housing Occupancy in Aetna Estates
Occupancy by Ownership in Aetna Estates
Of the total 433 dwellings in Aetna Estates, owner-occupied units account for 186 (43.0%), while renter-occupied units make up 247 (57.0%).
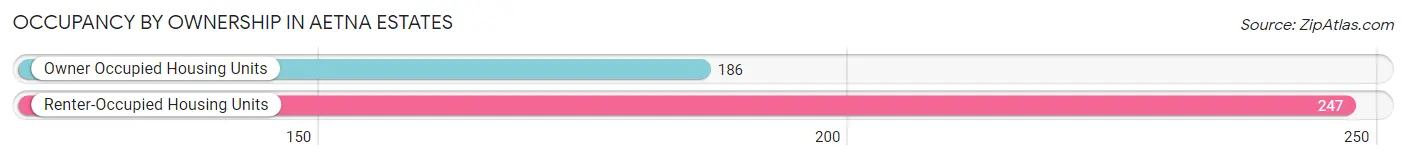
| Occupancy | # Housing Units | % Housing Units |
| Owner Occupied Housing Units | 186 | 43.0% |
| Renter-Occupied Housing Units | 247 | 57.0% |
| Total Occupied Housing Units | 433 | 100.0% |
Occupancy by Household Size in Aetna Estates
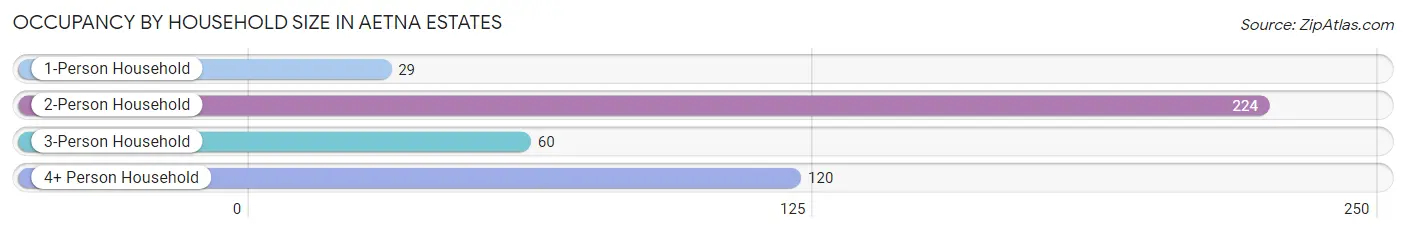
| Household Size | # Housing Units | % Housing Units |
| 1-Person Household | 29 | 6.7% |
| 2-Person Household | 224 | 51.7% |
| 3-Person Household | 60 | 13.9% |
| 4+ Person Household | 120 | 27.7% |
| Total Housing Units | 433 | 100.0% |
Occupancy by Ownership by Household Size in Aetna Estates
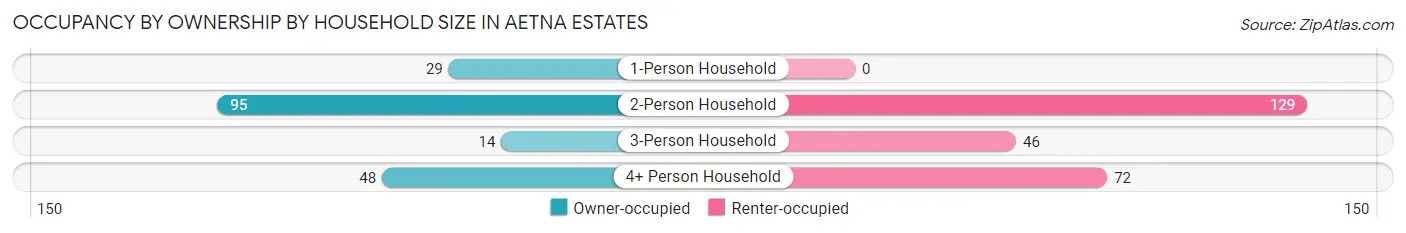
| Household Size | Owner-occupied | Renter-occupied |
| 1-Person Household | 29 (100.0%) | 0 (0.0%) |
| 2-Person Household | 95 (42.4%) | 129 (57.6%) |
| 3-Person Household | 14 (23.3%) | 46 (76.7%) |
| 4+ Person Household | 48 (40.0%) | 72 (60.0%) |
| Total Housing Units | 186 (43.0%) | 247 (57.0%) |
Occupancy by Educational Attainment in Aetna Estates
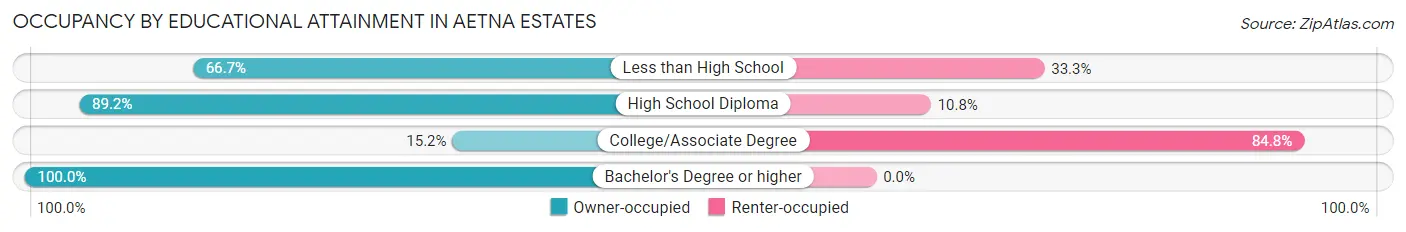
| Household Size | Owner-occupied | Renter-occupied |
| Less than High School | 76 (66.7%) | 38 (33.3%) |
| High School Diploma | 66 (89.2%) | 8 (10.8%) |
| College/Associate Degree | 36 (15.2%) | 201 (84.8%) |
| Bachelor's Degree or higher | 8 (100.0%) | 0 (0.0%) |
Occupancy by Age of Householder in Aetna Estates
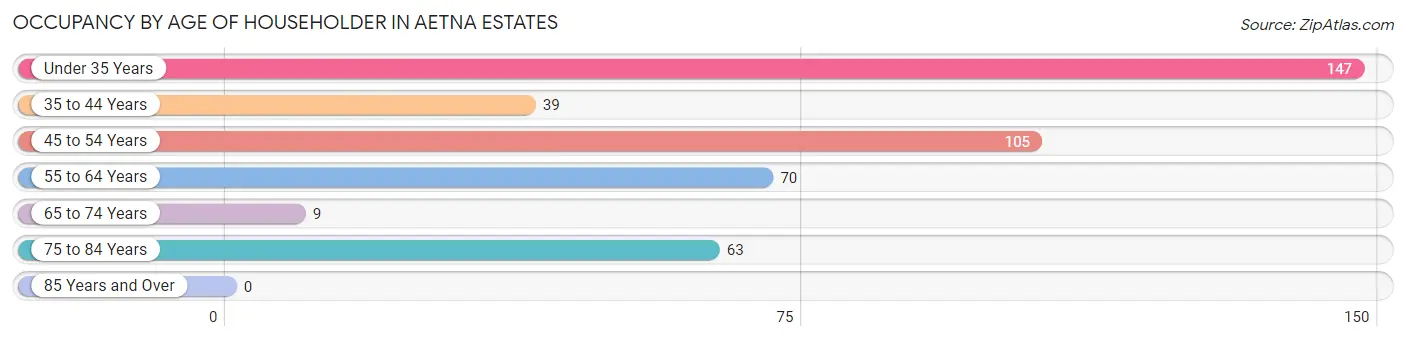
| Age Bracket | # Households | % Households |
| Under 35 Years | 147 | 34.0% |
| 35 to 44 Years | 39 | 9.0% |
| 45 to 54 Years | 105 | 24.2% |
| 55 to 64 Years | 70 | 16.2% |
| 65 to 74 Years | 9 | 2.1% |
| 75 to 84 Years | 63 | 14.5% |
| 85 Years and Over | 0 | 0.0% |
| Total | 433 | 100.0% |
Housing Finances in Aetna Estates
Median Income by Occupancy in Aetna Estates
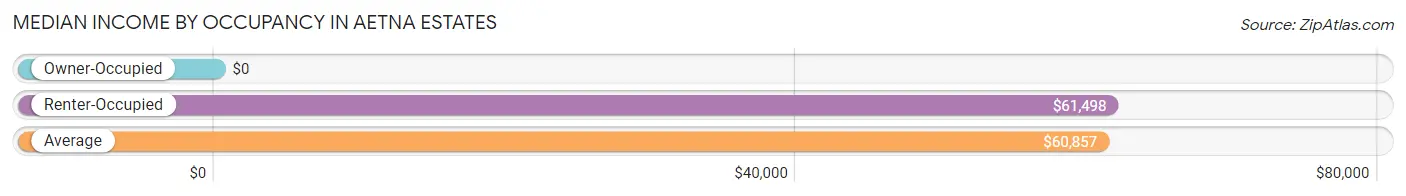
| Occupancy Type | # Households | Median Income |
| Owner-Occupied | 186 (43.0%) | $0 |
| Renter-Occupied | 247 (57.0%) | $61,498 |
| Average | 433 (100.0%) | $60,857 |
Occupancy by Householder Income Bracket in Aetna Estates
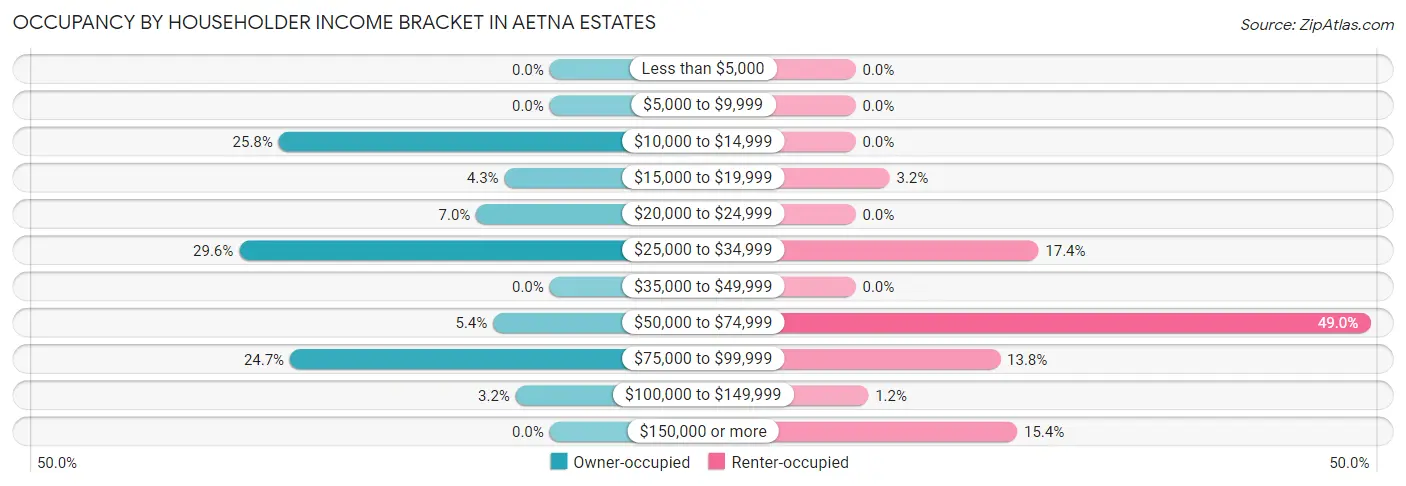
| Income Bracket | Owner-occupied | Renter-occupied |
| Less than $5,000 | 0 (0.0%) | 0 (0.0%) |
| $5,000 to $9,999 | 0 (0.0%) | 0 (0.0%) |
| $10,000 to $14,999 | 48 (25.8%) | 0 (0.0%) |
| $15,000 to $19,999 | 8 (4.3%) | 8 (3.2%) |
| $20,000 to $24,999 | 13 (7.0%) | 0 (0.0%) |
| $25,000 to $34,999 | 55 (29.6%) | 43 (17.4%) |
| $35,000 to $49,999 | 0 (0.0%) | 0 (0.0%) |
| $50,000 to $74,999 | 10 (5.4%) | 121 (49.0%) |
| $75,000 to $99,999 | 46 (24.7%) | 34 (13.8%) |
| $100,000 to $149,999 | 6 (3.2%) | 3 (1.2%) |
| $150,000 or more | 0 (0.0%) | 38 (15.4%) |
| Total | 186 (100.0%) | 247 (100.0%) |
Monthly Housing Cost Tiers in Aetna Estates
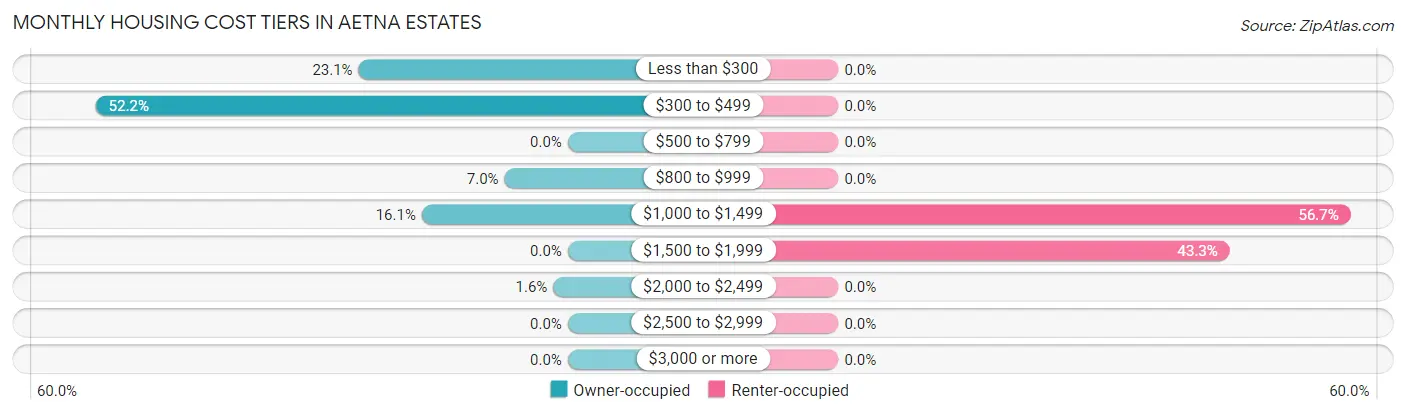
| Monthly Cost | Owner-occupied | Renter-occupied |
| Less than $300 | 43 (23.1%) | 0 (0.0%) |
| $300 to $499 | 97 (52.1%) | 0 (0.0%) |
| $500 to $799 | 0 (0.0%) | 0 (0.0%) |
| $800 to $999 | 13 (7.0%) | 0 (0.0%) |
| $1,000 to $1,499 | 30 (16.1%) | 140 (56.7%) |
| $1,500 to $1,999 | 0 (0.0%) | 107 (43.3%) |
| $2,000 to $2,499 | 3 (1.6%) | 0 (0.0%) |
| $2,500 to $2,999 | 0 (0.0%) | 0 (0.0%) |
| $3,000 or more | 0 (0.0%) | 0 (0.0%) |
| Total | 186 (100.0%) | 247 (100.0%) |
Physical Housing Characteristics in Aetna Estates
Housing Structures in Aetna Estates
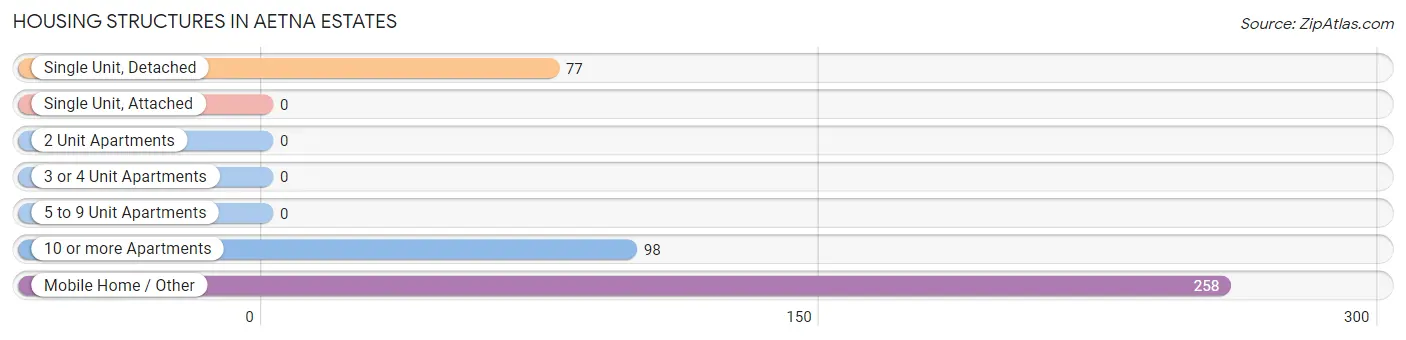
| Structure Type | # Housing Units | % Housing Units |
| Single Unit, Detached | 77 | 17.8% |
| Single Unit, Attached | 0 | 0.0% |
| 2 Unit Apartments | 0 | 0.0% |
| 3 or 4 Unit Apartments | 0 | 0.0% |
| 5 to 9 Unit Apartments | 0 | 0.0% |
| 10 or more Apartments | 98 | 22.6% |
| Mobile Home / Other | 258 | 59.6% |
| Total | 433 | 100.0% |
Housing Structures by Occupancy in Aetna Estates
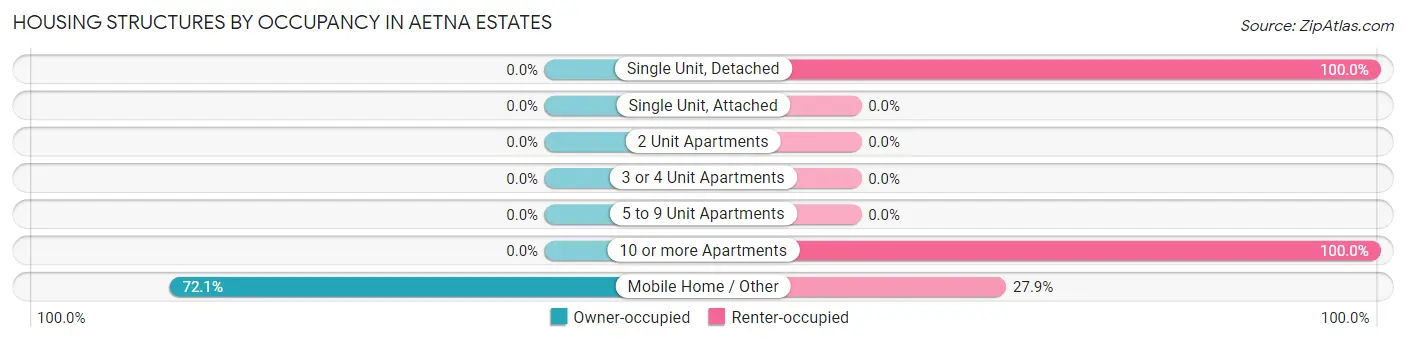
| Structure Type | Owner-occupied | Renter-occupied |
| Single Unit, Detached | 0 (0.0%) | 77 (100.0%) |
| Single Unit, Attached | 0 (0.0%) | 0 (0.0%) |
| 2 Unit Apartments | 0 (0.0%) | 0 (0.0%) |
| 3 or 4 Unit Apartments | 0 (0.0%) | 0 (0.0%) |
| 5 to 9 Unit Apartments | 0 (0.0%) | 0 (0.0%) |
| 10 or more Apartments | 0 (0.0%) | 98 (100.0%) |
| Mobile Home / Other | 186 (72.1%) | 72 (27.9%) |
| Total | 186 (43.0%) | 247 (57.0%) |
Housing Structures by Number of Rooms in Aetna Estates
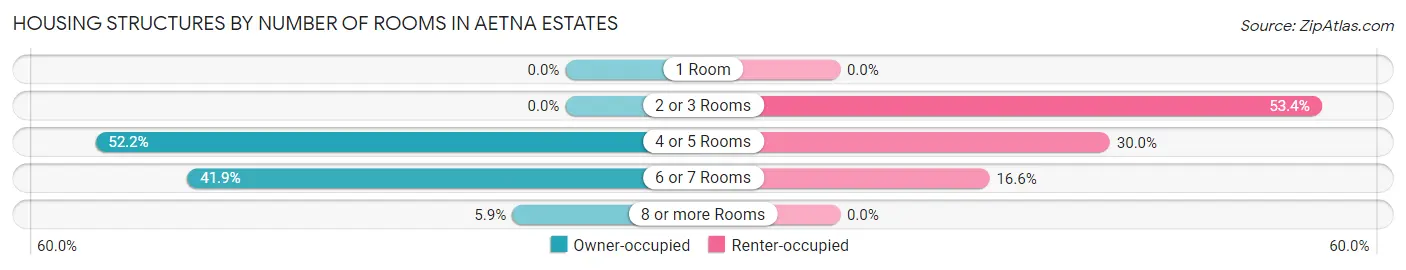
| Number of Rooms | Owner-occupied | Renter-occupied |
| 1 Room | 0 (0.0%) | 0 (0.0%) |
| 2 or 3 Rooms | 0 (0.0%) | 132 (53.4%) |
| 4 or 5 Rooms | 97 (52.1%) | 74 (30.0%) |
| 6 or 7 Rooms | 78 (41.9%) | 41 (16.6%) |
| 8 or more Rooms | 11 (5.9%) | 0 (0.0%) |
| Total | 186 (100.0%) | 247 (100.0%) |
Housing Structure by Heating Type in Aetna Estates
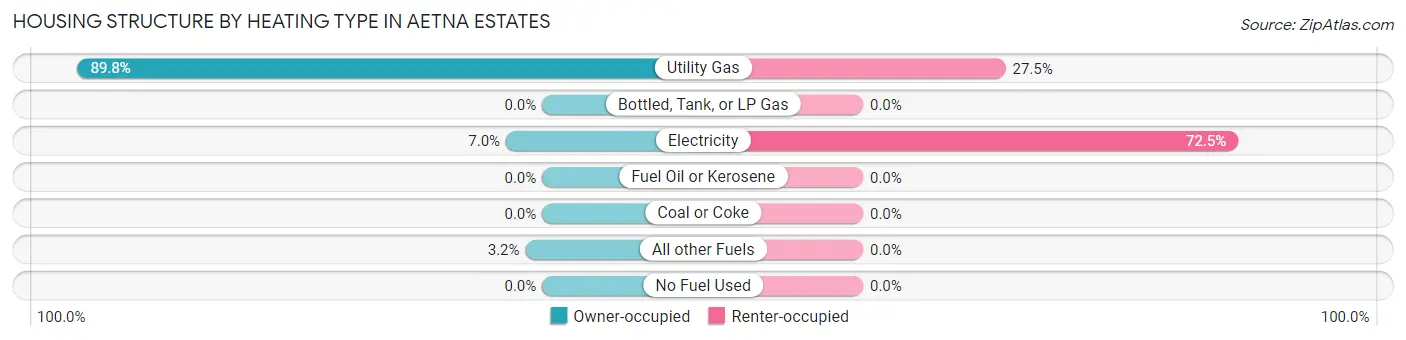
| Heating Type | Owner-occupied | Renter-occupied |
| Utility Gas | 167 (89.8%) | 68 (27.5%) |
| Bottled, Tank, or LP Gas | 0 (0.0%) | 0 (0.0%) |
| Electricity | 13 (7.0%) | 179 (72.5%) |
| Fuel Oil or Kerosene | 0 (0.0%) | 0 (0.0%) |
| Coal or Coke | 0 (0.0%) | 0 (0.0%) |
| All other Fuels | 6 (3.2%) | 0 (0.0%) |
| No Fuel Used | 0 (0.0%) | 0 (0.0%) |
| Total | 186 (100.0%) | 247 (100.0%) |
Household Vehicle Usage in Aetna Estates
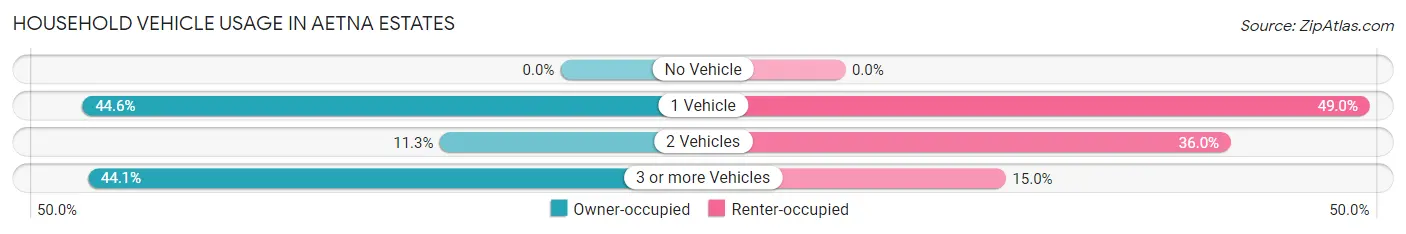
| Vehicles per Household | Owner-occupied | Renter-occupied |
| No Vehicle | 0 (0.0%) | 0 (0.0%) |
| 1 Vehicle | 83 (44.6%) | 121 (49.0%) |
| 2 Vehicles | 21 (11.3%) | 89 (36.0%) |
| 3 or more Vehicles | 82 (44.1%) | 37 (15.0%) |
| Total | 186 (100.0%) | 247 (100.0%) |
Real Estate & Mortgages in Aetna Estates
Real Estate and Mortgage Overview in Aetna Estates
| Characteristic | Without Mortgage | With Mortgage |
| Housing Units | 175 | 11 |
| Median Property Value | $52,700 | $0 |
| Median Household Income | - | - |
| Monthly Housing Costs | $325 | $0 |
| Real Estate Taxes | $199 | $8 |
Property Value by Mortgage Status in Aetna Estates
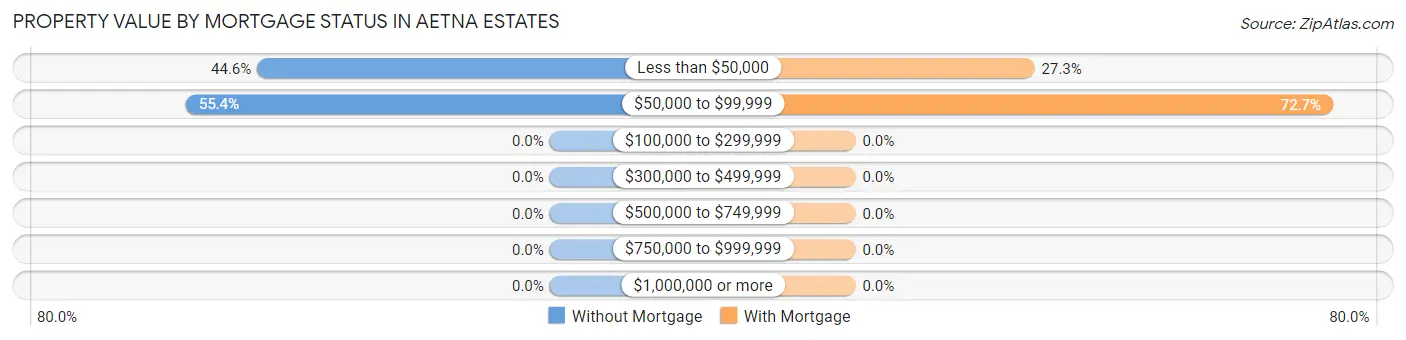
| Property Value | Without Mortgage | With Mortgage |
| Less than $50,000 | 78 (44.6%) | 3 (27.3%) |
| $50,000 to $99,999 | 97 (55.4%) | 8 (72.7%) |
| $100,000 to $299,999 | 0 (0.0%) | 0 (0.0%) |
| $300,000 to $499,999 | 0 (0.0%) | 0 (0.0%) |
| $500,000 to $749,999 | 0 (0.0%) | 0 (0.0%) |
| $750,000 to $999,999 | 0 (0.0%) | 0 (0.0%) |
| $1,000,000 or more | 0 (0.0%) | 0 (0.0%) |
| Total | 175 (100.0%) | 11 (100.0%) |
Household Income by Mortgage Status in Aetna Estates
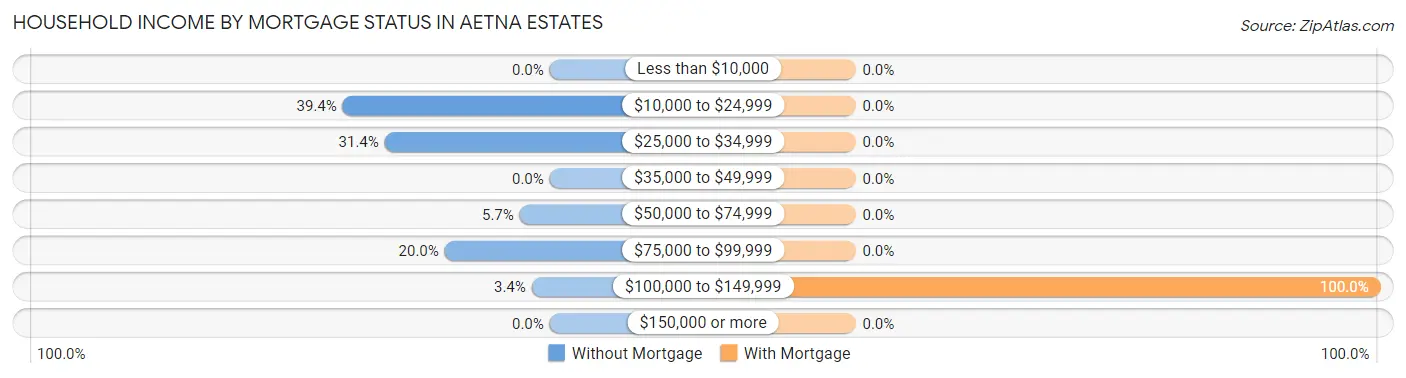
| Household Income | Without Mortgage | With Mortgage |
| Less than $10,000 | 0 (0.0%) | 0 (0.0%) |
| $10,000 to $24,999 | 69 (39.4%) | 0 (0.0%) |
| $25,000 to $34,999 | 55 (31.4%) | 0 (0.0%) |
| $35,000 to $49,999 | 0 (0.0%) | 0 (0.0%) |
| $50,000 to $74,999 | 10 (5.7%) | 0 (0.0%) |
| $75,000 to $99,999 | 35 (20.0%) | 0 (0.0%) |
| $100,000 to $149,999 | 6 (3.4%) | 11 (100.0%) |
| $150,000 or more | 0 (0.0%) | 0 (0.0%) |
| Total | 175 (100.0%) | 11 (100.0%) |
Property Value to Household Income Ratio in Aetna Estates
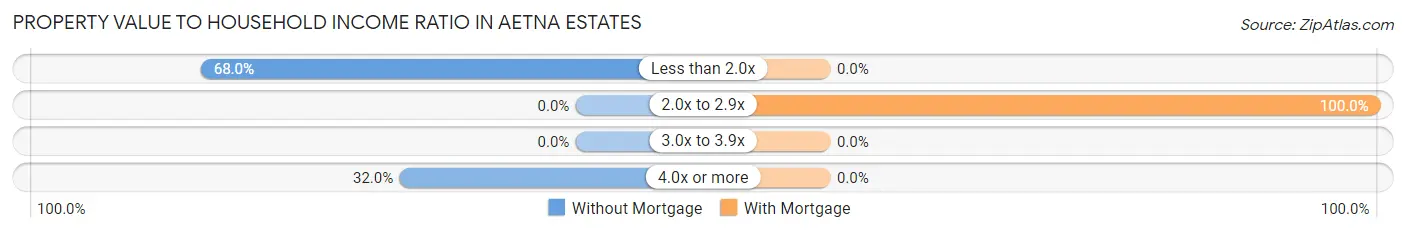
| Value-to-Income Ratio | Without Mortgage | With Mortgage |
| Less than 2.0x | 119 (68.0%) | 0 (0.0%) |
| 2.0x to 2.9x | 0 (0.0%) | 11 (100.0%) |
| 3.0x to 3.9x | 0 (0.0%) | 0 (0.0%) |
| 4.0x or more | 56 (32.0%) | 0 (0.0%) |
| Total | 175 (100.0%) | 11 (100.0%) |
Real Estate Taxes by Mortgage Status in Aetna Estates
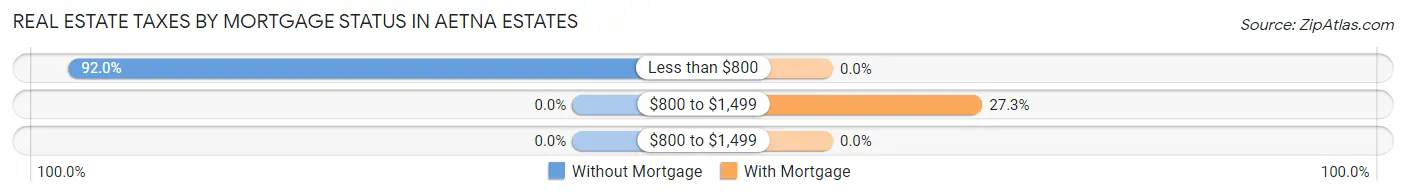
| Property Taxes | Without Mortgage | With Mortgage |
| Less than $800 | 161 (92.0%) | 0 (0.0%) |
| $800 to $1,499 | 0 (0.0%) | 3 (27.3%) |
| $800 to $1,499 | 0 (0.0%) | 0 (0.0%) |
| Total | 175 (100.0%) | 11 (100.0%) |
Health & Disability in Aetna Estates
Health Insurance Coverage by Age in Aetna Estates
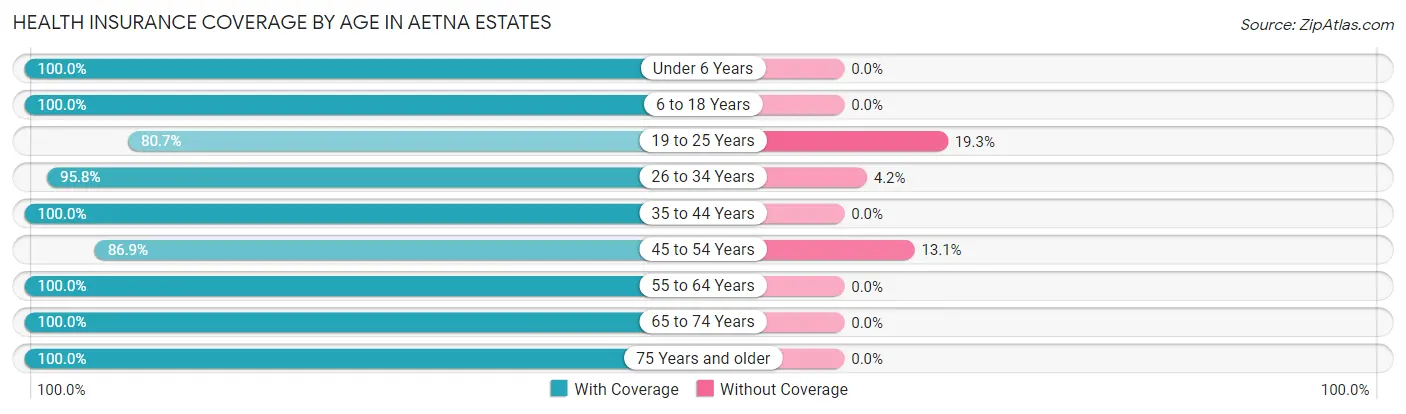
| Age Bracket | With Coverage | Without Coverage |
| Under 6 Years | 6 (100.0%) | 0 (0.0%) |
| 6 to 18 Years | 179 (100.0%) | 0 (0.0%) |
| 19 to 25 Years | 159 (80.7%) | 38 (19.3%) |
| 26 to 34 Years | 183 (95.8%) | 8 (4.2%) |
| 35 to 44 Years | 176 (100.0%) | 0 (0.0%) |
| 45 to 54 Years | 186 (86.9%) | 28 (13.1%) |
| 55 to 64 Years | 152 (100.0%) | 0 (0.0%) |
| 65 to 74 Years | 16 (100.0%) | 0 (0.0%) |
| 75 Years and older | 63 (100.0%) | 0 (0.0%) |
| Total | 1,120 (93.8%) | 74 (6.2%) |
Health Insurance Coverage by Citizenship Status in Aetna Estates
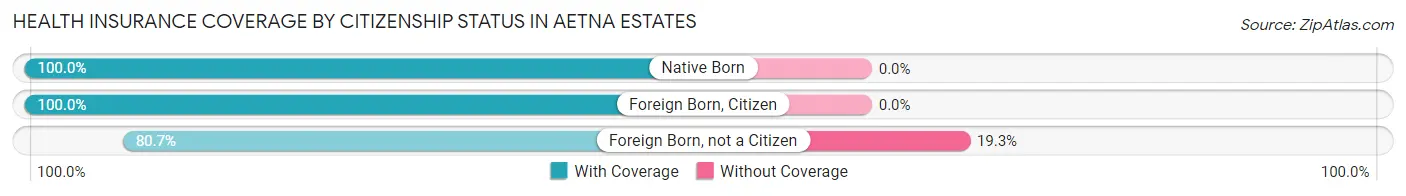
| Citizenship Status | With Coverage | Without Coverage |
| Native Born | 6 (100.0%) | 0 (0.0%) |
| Foreign Born, Citizen | 179 (100.0%) | 0 (0.0%) |
| Foreign Born, not a Citizen | 159 (80.7%) | 38 (19.3%) |
Health Insurance Coverage by Household Income in Aetna Estates
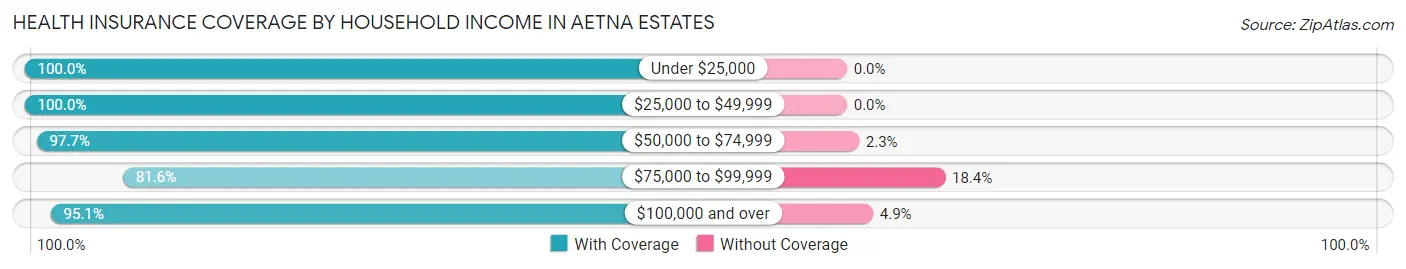
| Household Income | With Coverage | Without Coverage |
| Under $25,000 | 126 (100.0%) | 0 (0.0%) |
| $25,000 to $49,999 | 312 (100.0%) | 0 (0.0%) |
| $50,000 to $74,999 | 260 (97.7%) | 6 (2.3%) |
| $75,000 to $99,999 | 266 (81.6%) | 60 (18.4%) |
| $100,000 and over | 156 (95.1%) | 8 (4.9%) |
Public vs Private Health Insurance Coverage by Age in Aetna Estates
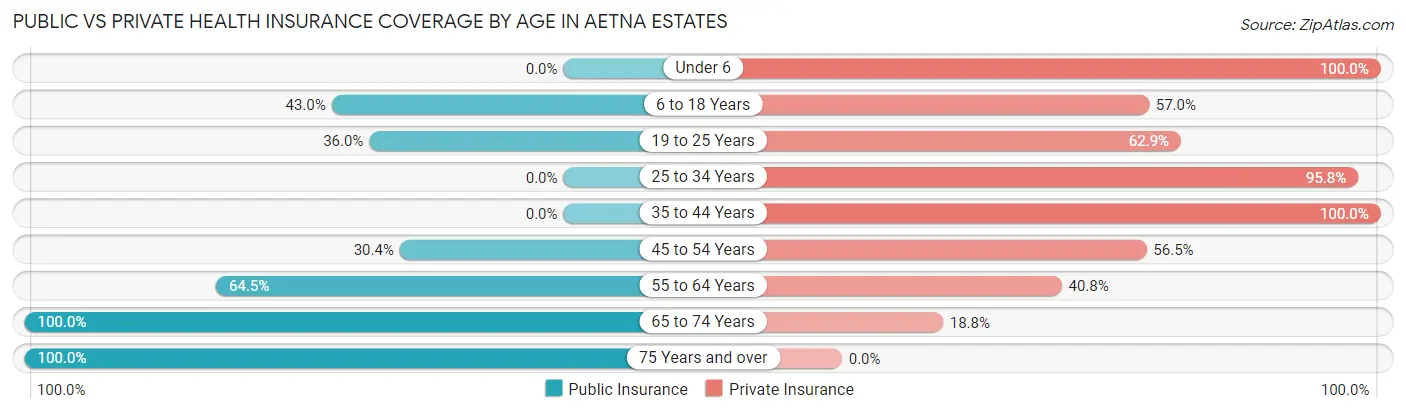
| Age Bracket | Public Insurance | Private Insurance |
| Under 6 | 0 (0.0%) | 6 (100.0%) |
| 6 to 18 Years | 77 (43.0%) | 102 (57.0%) |
| 19 to 25 Years | 71 (36.0%) | 124 (62.9%) |
| 25 to 34 Years | 0 (0.0%) | 183 (95.8%) |
| 35 to 44 Years | 0 (0.0%) | 176 (100.0%) |
| 45 to 54 Years | 65 (30.4%) | 121 (56.5%) |
| 55 to 64 Years | 98 (64.5%) | 62 (40.8%) |
| 65 to 74 Years | 16 (100.0%) | 3 (18.8%) |
| 75 Years and over | 63 (100.0%) | 0 (0.0%) |
| Total | 390 (32.7%) | 777 (65.1%) |
Disability Status by Sex by Age in Aetna Estates
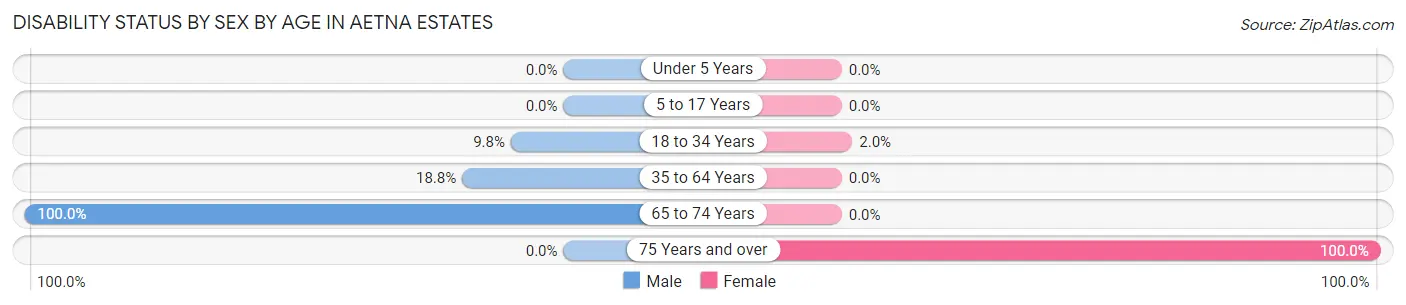
| Age Bracket | Male | Female |
| Under 5 Years | 0 (0.0%) | 0 (0.0%) |
| 5 to 17 Years | 0 (0.0%) | 0 (0.0%) |
| 18 to 34 Years | 8 (9.8%) | 6 (2.0%) |
| 35 to 64 Years | 63 (18.8%) | 0 (0.0%) |
| 65 to 74 Years | 6 (100.0%) | 0 (0.0%) |
| 75 Years and over | 0 (0.0%) | 63 (100.0%) |
Disability Class by Sex by Age in Aetna Estates
Disability Class: Hearing Difficulty
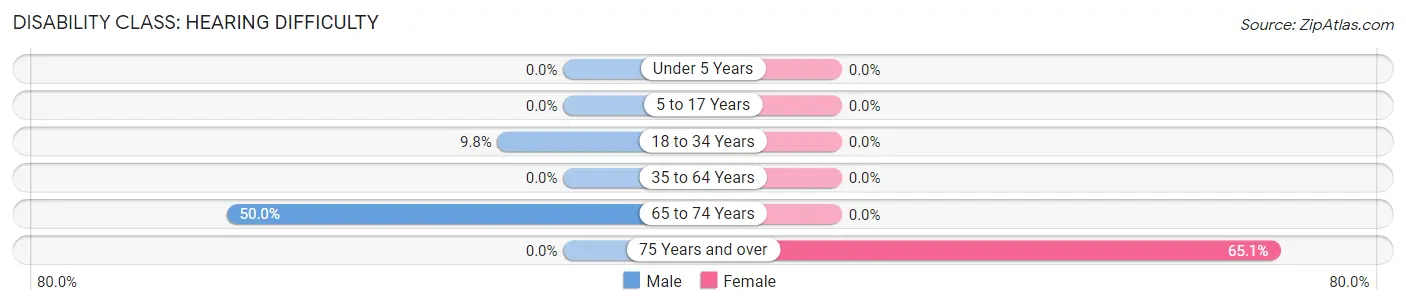
| Age Bracket | Male | Female |
| Under 5 Years | 0 (0.0%) | 0 (0.0%) |
| 5 to 17 Years | 0 (0.0%) | 0 (0.0%) |
| 18 to 34 Years | 8 (9.8%) | 0 (0.0%) |
| 35 to 64 Years | 0 (0.0%) | 0 (0.0%) |
| 65 to 74 Years | 3 (50.0%) | 0 (0.0%) |
| 75 Years and over | 0 (0.0%) | 41 (65.1%) |
Disability Class: Vision Difficulty
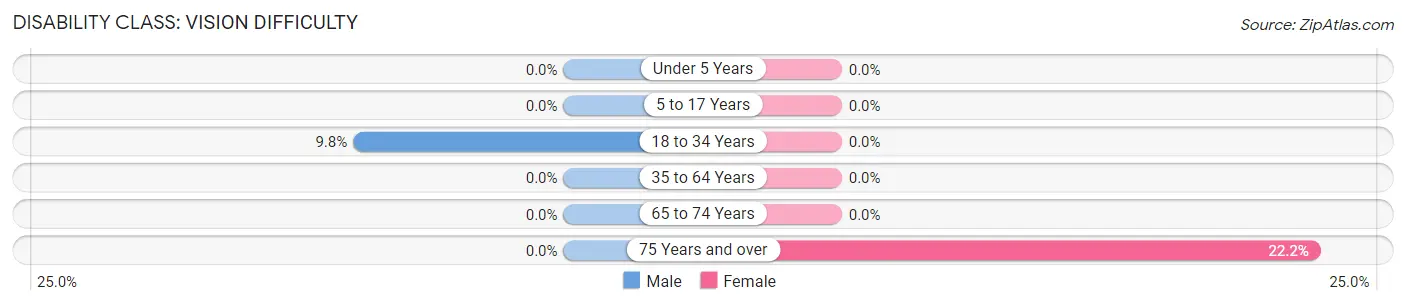
| Age Bracket | Male | Female |
| Under 5 Years | 0 (0.0%) | 0 (0.0%) |
| 5 to 17 Years | 0 (0.0%) | 0 (0.0%) |
| 18 to 34 Years | 8 (9.8%) | 0 (0.0%) |
| 35 to 64 Years | 0 (0.0%) | 0 (0.0%) |
| 65 to 74 Years | 0 (0.0%) | 0 (0.0%) |
| 75 Years and over | 0 (0.0%) | 14 (22.2%) |
Disability Class: Cognitive Difficulty
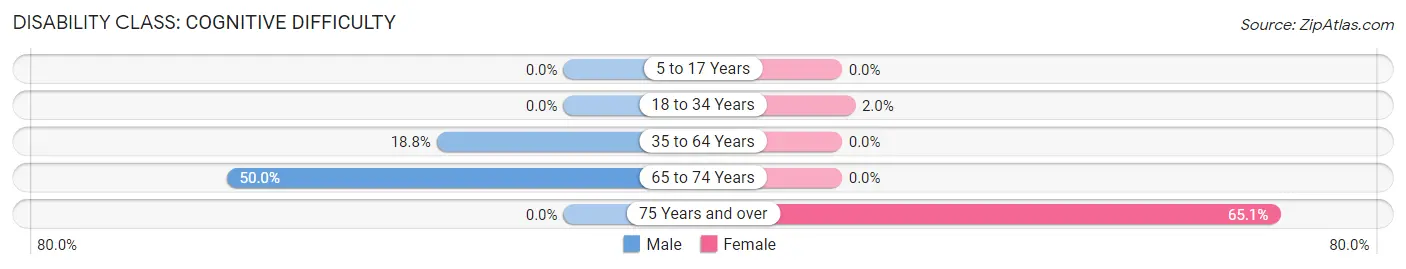
| Age Bracket | Male | Female |
| 5 to 17 Years | 0 (0.0%) | 0 (0.0%) |
| 18 to 34 Years | 0 (0.0%) | 6 (2.0%) |
| 35 to 64 Years | 63 (18.8%) | 0 (0.0%) |
| 65 to 74 Years | 3 (50.0%) | 0 (0.0%) |
| 75 Years and over | 0 (0.0%) | 41 (65.1%) |
Disability Class: Ambulatory Difficulty
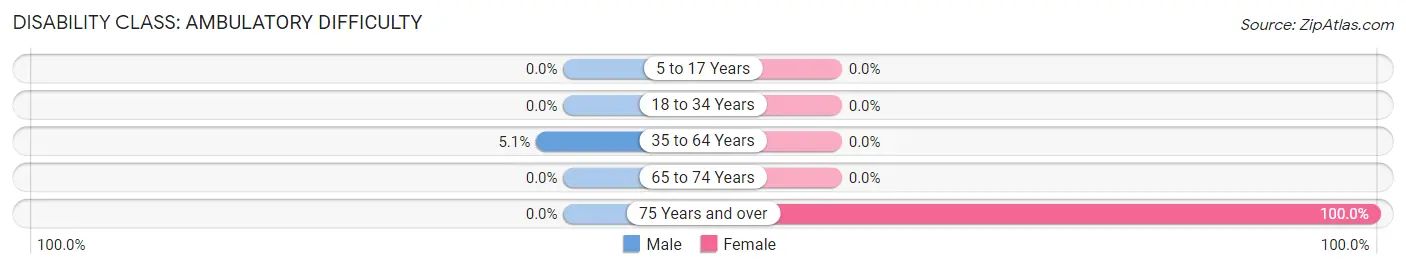
| Age Bracket | Male | Female |
| 5 to 17 Years | 0 (0.0%) | 0 (0.0%) |
| 18 to 34 Years | 0 (0.0%) | 0 (0.0%) |
| 35 to 64 Years | 17 (5.1%) | 0 (0.0%) |
| 65 to 74 Years | 0 (0.0%) | 0 (0.0%) |
| 75 Years and over | 0 (0.0%) | 63 (100.0%) |
Disability Class: Self-Care Difficulty
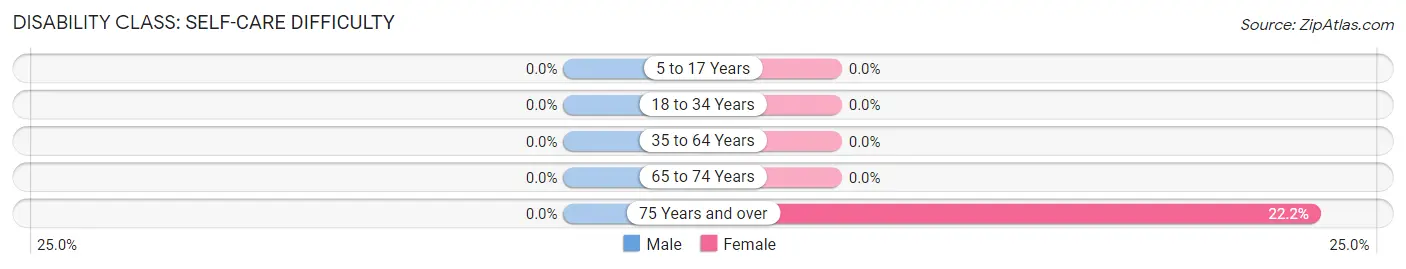
| Age Bracket | Male | Female |
| 5 to 17 Years | 0 (0.0%) | 0 (0.0%) |
| 18 to 34 Years | 0 (0.0%) | 0 (0.0%) |
| 35 to 64 Years | 0 (0.0%) | 0 (0.0%) |
| 65 to 74 Years | 0 (0.0%) | 0 (0.0%) |
| 75 Years and over | 0 (0.0%) | 14 (22.2%) |
Technology Access in Aetna Estates
Computing Device Access in Aetna Estates
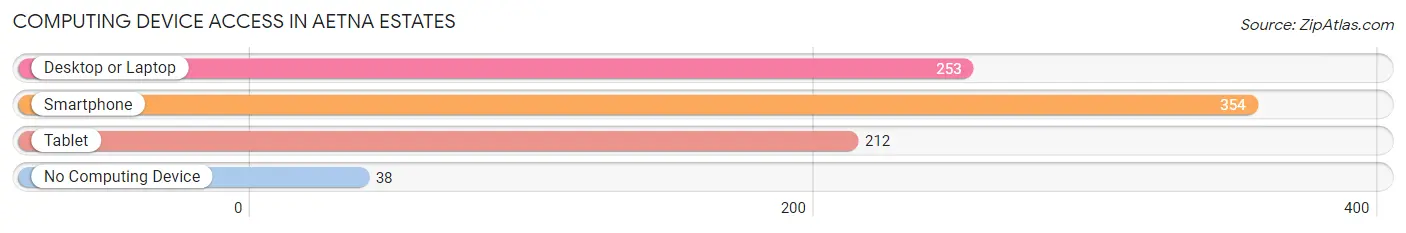
| Device Type | # Households | % Households |
| Desktop or Laptop | 253 | 58.4% |
| Smartphone | 354 | 81.8% |
| Tablet | 212 | 49.0% |
| No Computing Device | 38 | 8.8% |
| Total | 433 | 100.0% |
Internet Access in Aetna Estates
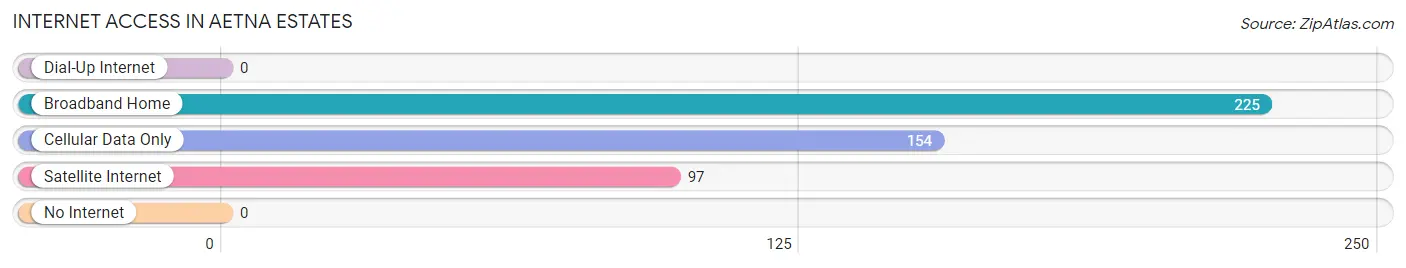
| Internet Type | # Households | % Households |
| Dial-Up Internet | 0 | 0.0% |
| Broadband Home | 225 | 52.0% |
| Cellular Data Only | 154 | 35.6% |
| Satellite Internet | 97 | 22.4% |
| No Internet | 0 | 0.0% |
| Total | 433 | 100.0% |
Aetna Estates Summary
Aetna Estates is a small, unincorporated community located in the foothills of the Rocky Mountains in Colorado. It is situated in the Arapahoe County, approximately 25 miles south of Denver. The community is home to a population of approximately 1,000 people, and is known for its rural atmosphere and small-town charm.
History
Aetna Estates was founded in 1876 by a group of settlers from the Midwest. The settlers were looking for a place to settle and start a new life, and they found it in the foothills of the Rocky Mountains. The settlers named the community after the Aetna Insurance Company, which had provided them with financial assistance to purchase the land.
The settlers quickly established a thriving community, and the town grew rapidly. By the early 1900s, Aetna Estates had become a popular destination for tourists and outdoor enthusiasts. The town was known for its beautiful scenery and outdoor activities, such as fishing, hunting, and camping.
In the 1950s, the town began to experience a decline in population as many of the original settlers moved away. However, the town was able to maintain its rural atmosphere and small-town charm.
Geography
Aetna Estates is located in the foothills of the Rocky Mountains in Colorado. The town is situated in the Arapahoe County, approximately 25 miles south of Denver. The town is surrounded by rolling hills and lush forests, and is known for its beautiful scenery and outdoor activities.
The town is located at an elevation of 6,000 feet, and the climate is generally mild and dry. The average temperature in the summer is around 70 degrees Fahrenheit, and the average temperature in the winter is around 30 degrees Fahrenheit.
Economy
Aetna Estates is a small, rural community with a limited economy. The town is primarily supported by tourism, as many people visit the area to take advantage of the outdoor activities and beautiful scenery. The town also has a few small businesses, such as restaurants, shops, and a gas station.
Demographics
As of the 2010 census, the population of Aetna Estates was 1,000 people. The racial makeup of the town was 95.2% White, 0.7% African American, 0.3% Native American, 0.7% Asian, 0.1% Pacific Islander, and 2.1% from other races. The median household income was $45,000, and the median age was 40 years.
Conclusion
Aetna Estates is a small, unincorporated community located in the foothills of the Rocky Mountains in Colorado. The town is known for its rural atmosphere and small-town charm, and is a popular destination for tourists and outdoor enthusiasts. The town is supported by tourism and a few small businesses, and has a population of approximately 1,000 people.
Common Questions
What is Per Capita Income in Aetna Estates?
Per Capita income in Aetna Estates is $22,287.
What is the Median Family Income in Aetna Estates?
Median Family Income in Aetna Estates is $61,074.
What is the Median Household income in Aetna Estates?
Median Household Income in Aetna Estates is $60,857.
What is Income or Wage Gap in Aetna Estates?
Income or Wage Gap in Aetna Estates is 30.0%.
Women in Aetna Estates earn 70.0 cents for every dollar earned by a man.
What is Inequality or Gini Index in Aetna Estates?
Inequality or Gini Index in Aetna Estates is 0.38.
What is the Total Population of Aetna Estates?
Total Population of Aetna Estates is 1,194.
What is the Total Male Population of Aetna Estates?
Total Male Population of Aetna Estates is 500.
What is the Total Female Population of Aetna Estates?
Total Female Population of Aetna Estates is 694.
What is the Ratio of Males per 100 Females in Aetna Estates?
There are 72.05 Males per 100 Females in Aetna Estates.
What is the Ratio of Females per 100 Males in Aetna Estates?
There are 138.80 Females per 100 Males in Aetna Estates.
What is the Median Population Age in Aetna Estates?
Median Population Age in Aetna Estates is 40.1 Years.
What is the Average Family Size in Aetna Estates
Average Family Size in Aetna Estates is 2.9 People.
What is the Average Household Size in Aetna Estates
Average Household Size in Aetna Estates is 2.8 People.
How Large is the Labor Force in Aetna Estates?
There are 730 People in the Labor Forcein in Aetna Estates.
What is the Percentage of People in the Labor Force in Aetna Estates?
69.7% of People are in the Labor Force in Aetna Estates.
What is the Unemployment Rate in Aetna Estates?
Unemployment Rate in Aetna Estates is 9.9%.