Lincoln Park, CO Map & Demographics
Lincoln Park Map
Lincoln Park Overview
$31,565
PER CAPITA INCOME
$93,155
AVG FAMILY INCOME
$79,408
AVG HOUSEHOLD INCOME
42.9%
WAGE / INCOME GAP [ % ]
57.1¢/ $1
WAGE / INCOME GAP [ $ ]
0.40
INEQUALITY / GINI INDEX
4,413
TOTAL POPULATION
2,250
MALE POPULATION
2,163
FEMALE POPULATION
104.02
MALES / 100 FEMALES
96.13
FEMALES / 100 MALES
47.8
MEDIAN AGE
3.1
AVG FAMILY SIZE
2.5
AVG HOUSEHOLD SIZE
1,554
LABOR FORCE [ PEOPLE ]
40.9%
PERCENT IN LABOR FORCE
5.9%
UNEMPLOYMENT RATE
Income in Lincoln Park
Income Overview in Lincoln Park
Per Capita Income in Lincoln Park is $31,565, while median incomes of families and households are $93,155 and $79,408 respectively.
| Characteristic | Number | Measure |
| Per Capita Income | 4,413 | $31,565 |
| Median Family Income | 1,087 | $93,155 |
| Mean Family Income | 1,087 | $97,744 |
| Median Household Income | 1,773 | $79,408 |
| Mean Household Income | 1,773 | $81,796 |
| Income Deficit | 1,087 | $0 |
| Wage / Income Gap (%) | 4,413 | 42.92% |
| Wage / Income Gap ($) | 4,413 | 57.08¢ per $1 |
| Gini / Inequality Index | 4,413 | 0.40 |
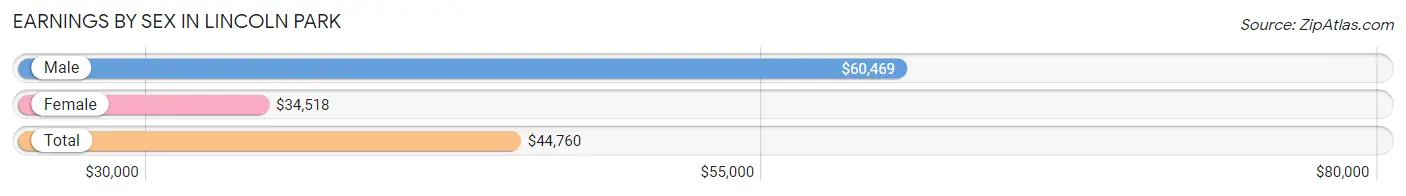
Earnings by Sex in Lincoln Park
Average Earnings in Lincoln Park are $44,760, $60,469 for men and $34,518 for women, a difference of 42.9%.
| Sex | Number | Average Earnings |
| Male | 841 (48.7%) | $60,469 |
| Female | 884 (51.2%) | $34,518 |
| Total | 1,725 (100.0%) | $44,760 |
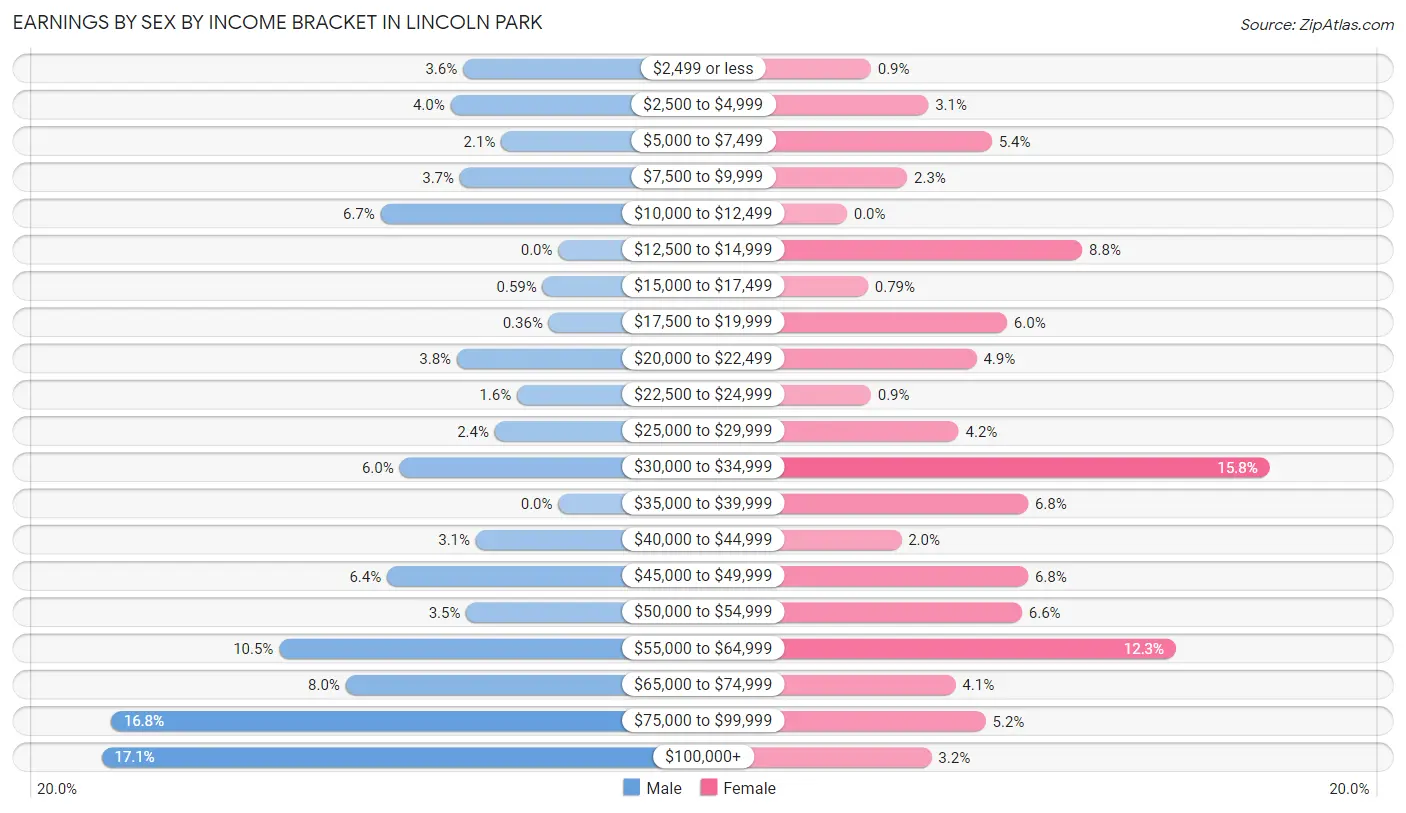
Earnings by Sex by Income Bracket in Lincoln Park
The most common earnings brackets in Lincoln Park are $100,000+ for men (144 | 17.1%) and $30,000 to $34,999 for women (140 | 15.8%).
| Income | Male | Female |
| $2,499 or less | 30 (3.6%) | 8 (0.9%) |
| $2,500 to $4,999 | 34 (4.0%) | 27 (3.0%) |
| $5,000 to $7,499 | 18 (2.1%) | 48 (5.4%) |
| $7,500 to $9,999 | 31 (3.7%) | 20 (2.3%) |
| $10,000 to $12,499 | 56 (6.7%) | 0 (0.0%) |
| $12,500 to $14,999 | 0 (0.0%) | 78 (8.8%) |
| $15,000 to $17,499 | 5 (0.6%) | 7 (0.8%) |
| $17,500 to $19,999 | 3 (0.4%) | 53 (6.0%) |
| $20,000 to $22,499 | 32 (3.8%) | 43 (4.9%) |
| $22,500 to $24,999 | 13 (1.5%) | 8 (0.9%) |
| $25,000 to $29,999 | 20 (2.4%) | 37 (4.2%) |
| $30,000 to $34,999 | 50 (5.9%) | 140 (15.8%) |
| $35,000 to $39,999 | 0 (0.0%) | 60 (6.8%) |
| $40,000 to $44,999 | 26 (3.1%) | 18 (2.0%) |
| $45,000 to $49,999 | 54 (6.4%) | 60 (6.8%) |
| $50,000 to $54,999 | 29 (3.5%) | 58 (6.6%) |
| $55,000 to $64,999 | 88 (10.5%) | 109 (12.3%) |
| $65,000 to $74,999 | 67 (8.0%) | 36 (4.1%) |
| $75,000 to $99,999 | 141 (16.8%) | 46 (5.2%) |
| $100,000+ | 144 (17.1%) | 28 (3.2%) |
| Total | 841 (100.0%) | 884 (100.0%) |
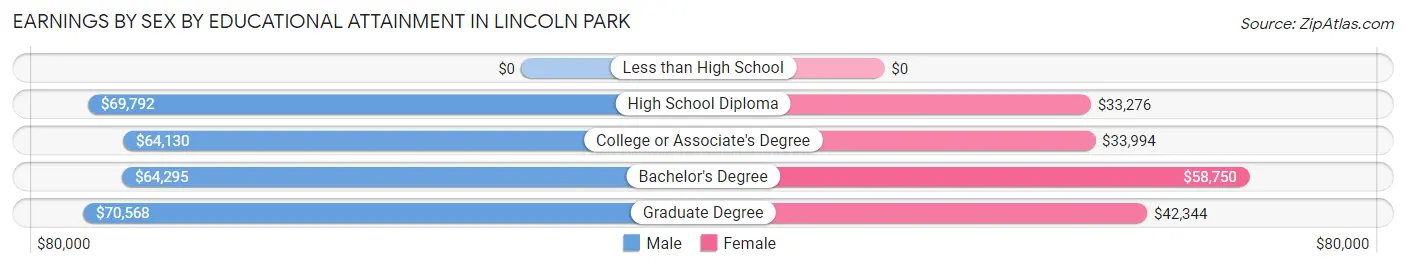
Earnings by Sex by Educational Attainment in Lincoln Park
Average earnings in Lincoln Park are $64,194 for men and $35,859 for women, a difference of 44.1%. Men with an educational attainment of graduate degree enjoy the highest average annual earnings of $70,568, while those with college or associate's degree education earn the least with $64,130. Women with an educational attainment of bachelor's degree earn the most with the average annual earnings of $58,750, while those with high school diploma education have the smallest earnings of $33,276.
| Educational Attainment | Male Income | Female Income |
| Less than High School | - | - |
| High School Diploma | $69,792 | $33,276 |
| College or Associate's Degree | $64,130 | $33,994 |
| Bachelor's Degree | $64,295 | $58,750 |
| Graduate Degree | $70,568 | $42,344 |
| Total | $64,194 | $35,859 |
Family Income in Lincoln Park
Family Income Brackets in Lincoln Park
According to the Lincoln Park family income data, there are 309 families falling into the $100,000 to $149,999 income range, which is the most common income bracket and makes up 28.4% of all families. Conversely, the $15,000 to $24,999 income bracket is the least frequent group with only 12 families (1.1%) belonging to this category.
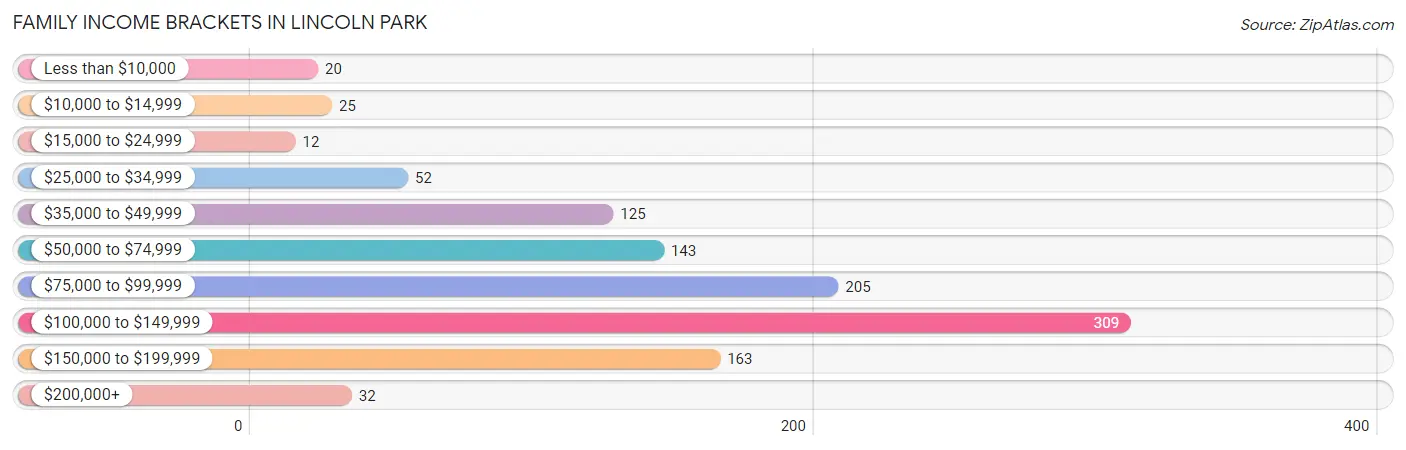
| Income Bracket | # Families | % Families |
| Less than $10,000 | 20 | 1.8% |
| $10,000 to $14,999 | 25 | 2.3% |
| $15,000 to $24,999 | 12 | 1.1% |
| $25,000 to $34,999 | 52 | 4.8% |
| $35,000 to $49,999 | 125 | 11.5% |
| $50,000 to $74,999 | 143 | 13.2% |
| $75,000 to $99,999 | 205 | 18.9% |
| $100,000 to $149,999 | 309 | 28.4% |
| $150,000 to $199,999 | 163 | 15.0% |
| $200,000+ | 32 | 2.9% |
Family Income by Famaliy Size in Lincoln Park
3-person families (190 | 17.5%) account for the highest median family income in Lincoln Park with $103,889 per family, while 2-person families (691 | 63.6%) have the highest median income of $49,653 per family member.
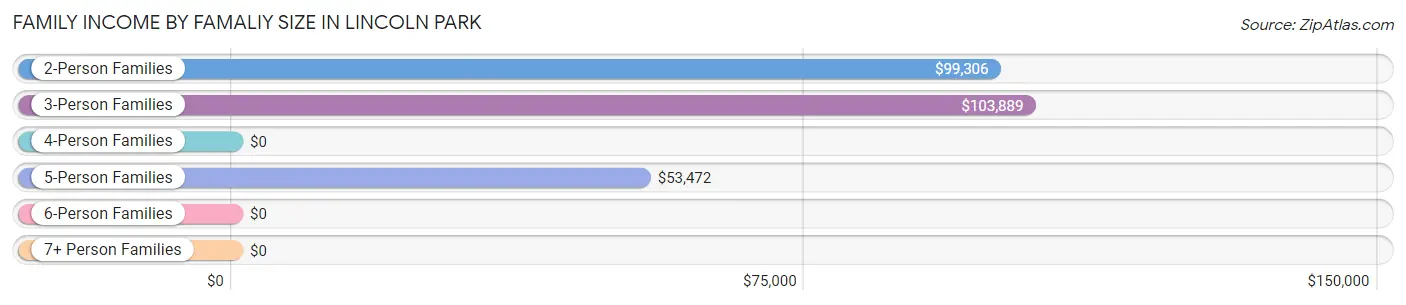
| Income Bracket | # Families | Median Income |
| 2-Person Families | 691 (63.6%) | $99,306 |
| 3-Person Families | 190 (17.5%) | $103,889 |
| 4-Person Families | 17 (1.6%) | $0 |
| 5-Person Families | 146 (13.4%) | $53,472 |
| 6-Person Families | 8 (0.7%) | $0 |
| 7+ Person Families | 35 (3.2%) | $0 |
| Total | 1,087 (100.0%) | $93,155 |
Family Income by Number of Earners in Lincoln Park
The median family income in Lincoln Park is $93,155, with families comprising 2 earners (307) having the highest median family income of $129,825, while families with no earners (405) have the lowest median family income of $71,219, accounting for 28.2% and 37.3% of families, respectively.
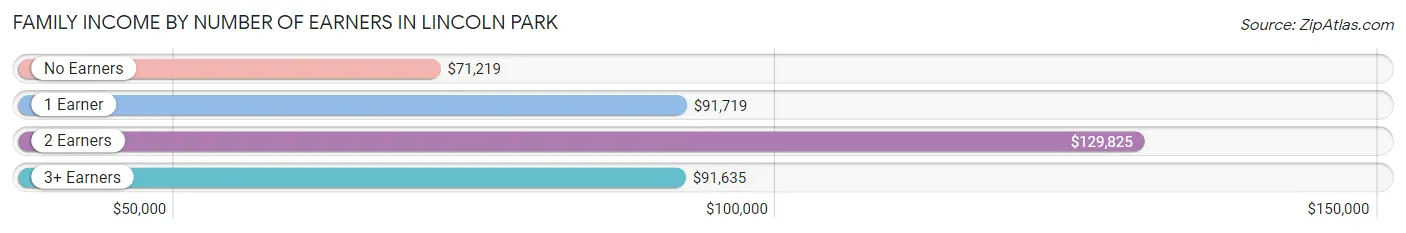
| Number of Earners | # Families | Median Income |
| No Earners | 405 (37.3%) | $71,219 |
| 1 Earner | 323 (29.7%) | $91,719 |
| 2 Earners | 307 (28.2%) | $129,825 |
| 3+ Earners | 52 (4.8%) | $91,635 |
| Total | 1,087 (100.0%) | $93,155 |
Household Income in Lincoln Park
Household Income Brackets in Lincoln Park
With 371 households falling in the category, the $100,000 to $149,999 income range is the most frequent in Lincoln Park, accounting for 20.9% of all households. In contrast, only 39 households (2.2%) fall into the $200,000+ income bracket, making it the least populous group.
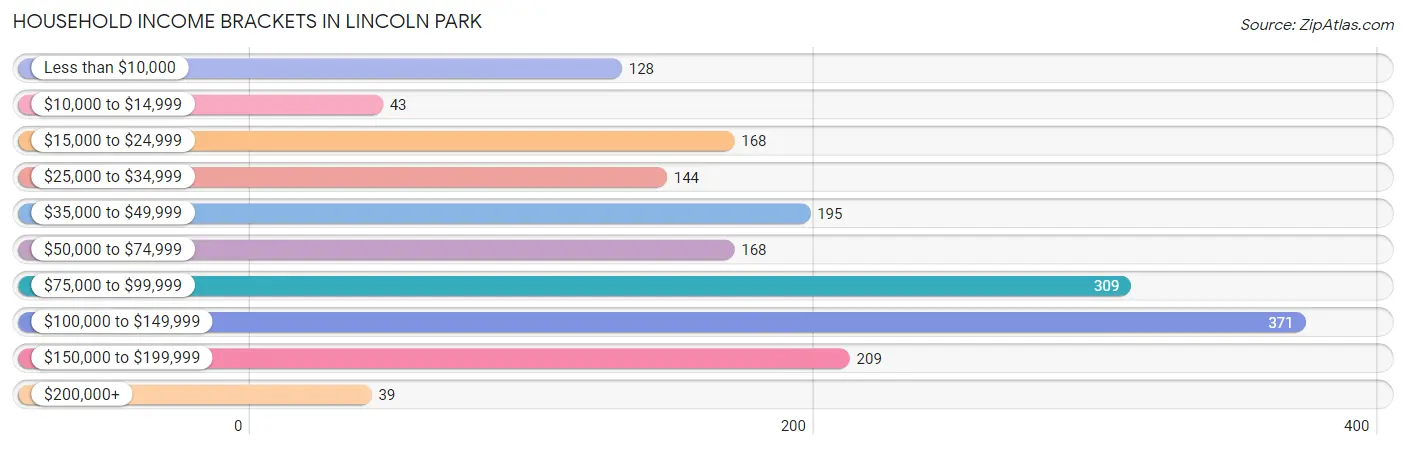
| Income Bracket | # Households | % Households |
| Less than $10,000 | 128 | 7.2% |
| $10,000 to $14,999 | 43 | 2.4% |
| $15,000 to $24,999 | 168 | 9.5% |
| $25,000 to $34,999 | 144 | 8.1% |
| $35,000 to $49,999 | 195 | 11.0% |
| $50,000 to $74,999 | 168 | 9.5% |
| $75,000 to $99,999 | 309 | 17.4% |
| $100,000 to $149,999 | 371 | 20.9% |
| $150,000 to $199,999 | 209 | 11.8% |
| $200,000+ | 39 | 2.2% |
Household Income by Householder Age in Lincoln Park
The median household income in Lincoln Park is $79,408, with the highest median household income of $118,571 found in the 45 to 64 years age bracket for the primary householder. A total of 622 households (35.1%) fall into this category. Meanwhile, the 15 to 24 years age bracket for the primary householder has the lowest median household income of $0, with 54 households (3.0%) in this group.
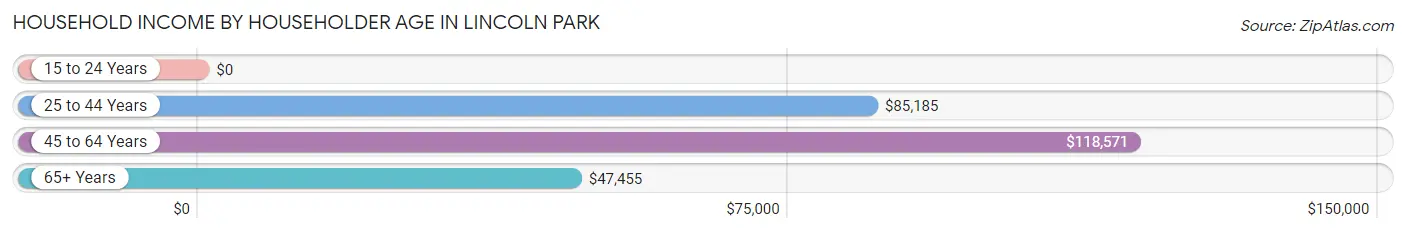
| Income Bracket | # Households | Median Income |
| 15 to 24 Years | 54 (3.0%) | $0 |
| 25 to 44 Years | 338 (19.1%) | $85,185 |
| 45 to 64 Years | 622 (35.1%) | $118,571 |
| 65+ Years | 759 (42.8%) | $47,455 |
| Total | 1,773 (100.0%) | $79,408 |
Poverty in Lincoln Park
Income Below Poverty by Sex and Age in Lincoln Park
With 18.6% poverty level for males and 10.8% for females among the residents of Lincoln Park, 18 to 24 year old males and 18 to 24 year old females are the most vulnerable to poverty, with 121 males (71.6%) and 52 females (41.6%) in their respective age groups living below the poverty level.
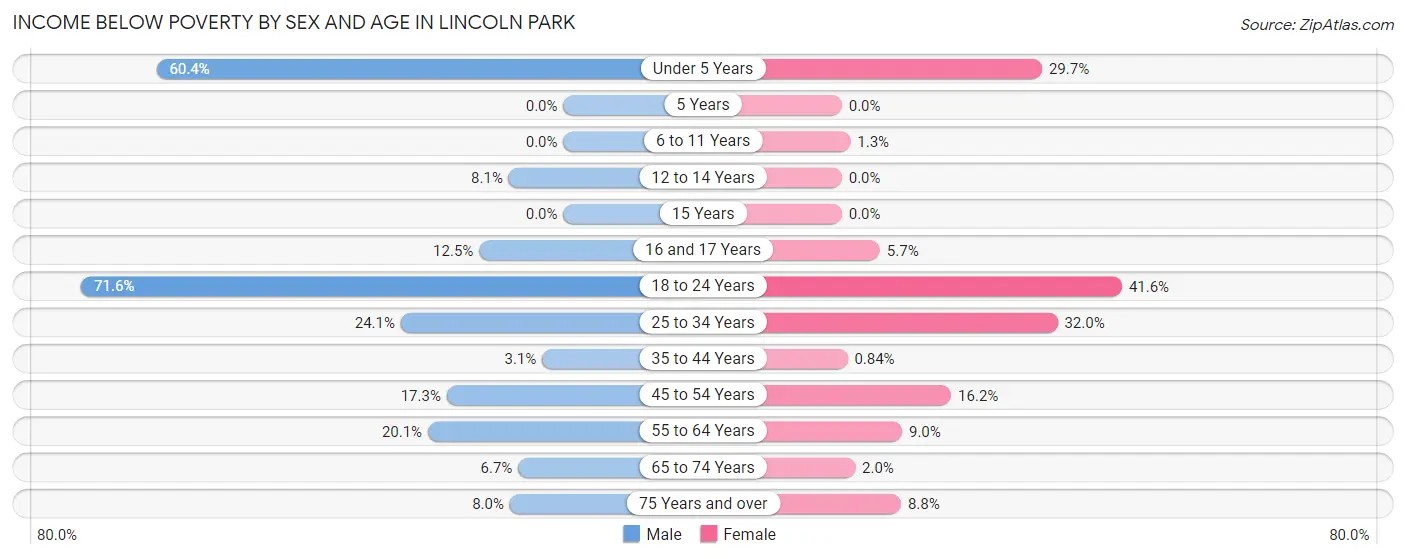
| Age Bracket | Male | Female |
| Under 5 Years | 29 (60.4%) | 22 (29.7%) |
| 5 Years | 0 (0.0%) | 0 (0.0%) |
| 6 to 11 Years | 0 (0.0%) | 2 (1.3%) |
| 12 to 14 Years | 3 (8.1%) | 0 (0.0%) |
| 15 Years | 0 (0.0%) | 0 (0.0%) |
| 16 and 17 Years | 2 (12.5%) | 3 (5.7%) |
| 18 to 24 Years | 121 (71.6%) | 52 (41.6%) |
| 25 to 34 Years | 112 (24.1%) | 49 (32.0%) |
| 35 to 44 Years | 6 (3.1%) | 2 (0.8%) |
| 45 to 54 Years | 31 (17.3%) | 38 (16.2%) |
| 55 to 64 Years | 70 (20.1%) | 34 (8.9%) |
| 65 to 74 Years | 23 (6.7%) | 7 (2.0%) |
| 75 Years and over | 21 (8.0%) | 24 (8.8%) |
| Total | 418 (18.6%) | 233 (10.8%) |
Income Above Poverty by Sex and Age in Lincoln Park
According to the poverty statistics in Lincoln Park, males aged 6 to 11 years and females aged 5 years are the age groups that are most secure financially, with 100.0% of males and 100.0% of females in these age groups living above the poverty line.
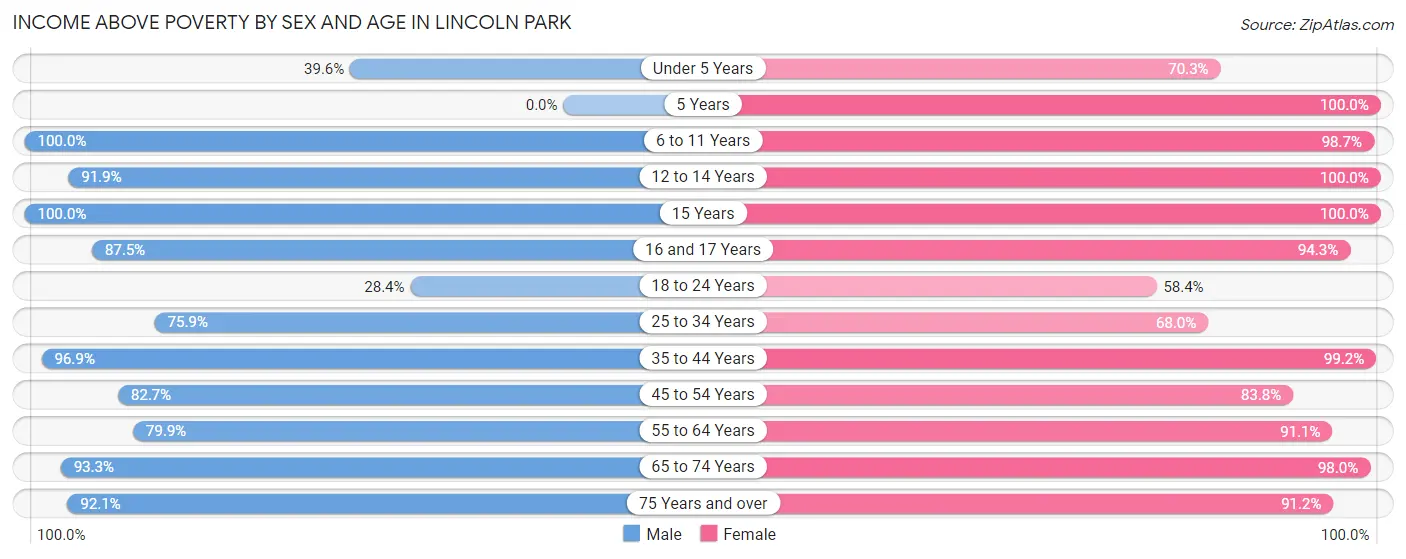
| Age Bracket | Male | Female |
| Under 5 Years | 19 (39.6%) | 52 (70.3%) |
| 5 Years | 0 (0.0%) | 40 (100.0%) |
| 6 to 11 Years | 142 (100.0%) | 155 (98.7%) |
| 12 to 14 Years | 34 (91.9%) | 16 (100.0%) |
| 15 Years | 46 (100.0%) | 54 (100.0%) |
| 16 and 17 Years | 14 (87.5%) | 50 (94.3%) |
| 18 to 24 Years | 48 (28.4%) | 73 (58.4%) |
| 25 to 34 Years | 352 (75.9%) | 104 (68.0%) |
| 35 to 44 Years | 185 (96.9%) | 235 (99.2%) |
| 45 to 54 Years | 148 (82.7%) | 196 (83.8%) |
| 55 to 64 Years | 278 (79.9%) | 346 (91.0%) |
| 65 to 74 Years | 320 (93.3%) | 348 (98.0%) |
| 75 Years and over | 243 (92.0%) | 249 (91.2%) |
| Total | 1,829 (81.4%) | 1,918 (89.2%) |
Income Below Poverty Among Married-Couple Families in Lincoln Park
The poverty statistics for married-couple families in Lincoln Park show that 1.4% or 13 of the total 932 families live below the poverty line. Families with no children have the highest poverty rate of 1.8%, comprising of 13 families. On the other hand, families with 1 or 2 children have the lowest poverty rate of 0.0%, which includes 0 families.
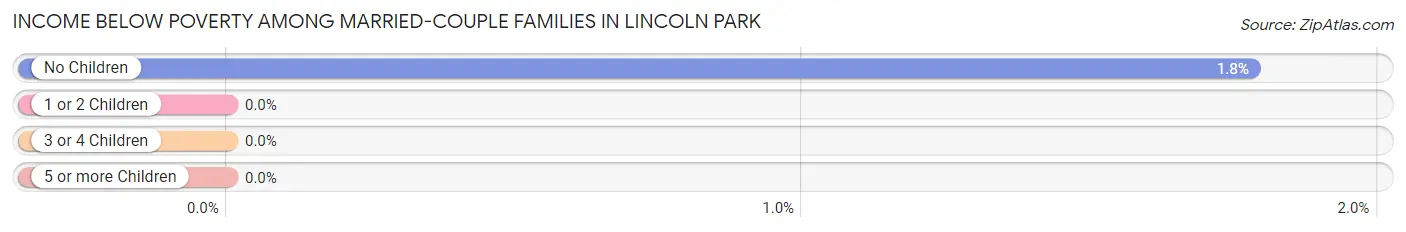
| Children | Above Poverty | Below Poverty |
| No Children | 716 (98.2%) | 13 (1.8%) |
| 1 or 2 Children | 69 (100.0%) | 0 (0.0%) |
| 3 or 4 Children | 108 (100.0%) | 0 (0.0%) |
| 5 or more Children | 26 (100.0%) | 0 (0.0%) |
| Total | 919 (98.6%) | 13 (1.4%) |
Income Below Poverty Among Single-Parent Households in Lincoln Park
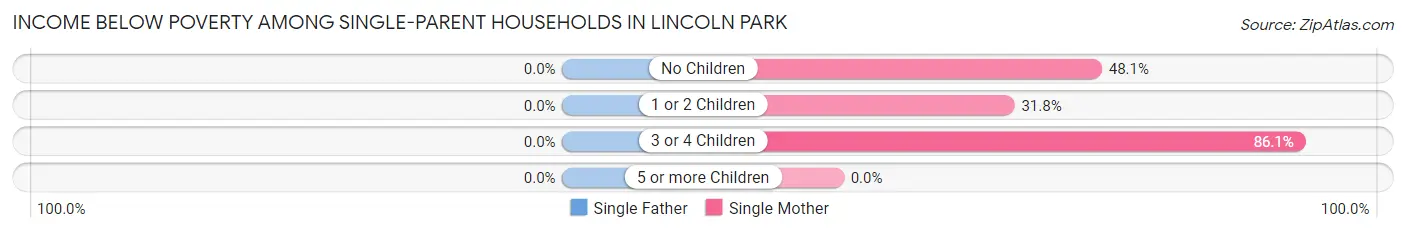
| Children | Single Father | Single Mother |
| No Children | 0 (0.0%) | 25 (48.1%) |
| 1 or 2 Children | 0 (0.0%) | 7 (31.8%) |
| 3 or 4 Children | 0 (0.0%) | 37 (86.1%) |
| 5 or more Children | 0 (0.0%) | 0 (0.0%) |
| Total | 0 (0.0%) | 69 (59.0%) |
Income Below Poverty Among Married-Couple vs Single-Parent Households in Lincoln Park
The poverty data for Lincoln Park shows that 13 of the married-couple family households (1.4%) and 69 of the single-parent households (44.5%) are living below the poverty level. Within the married-couple family households, those with no children have the highest poverty rate, with 13 households (1.8%) falling below the poverty line. Among the single-parent households, those with 3 or 4 children have the highest poverty rate, with 37 household (86.1%) living below poverty.
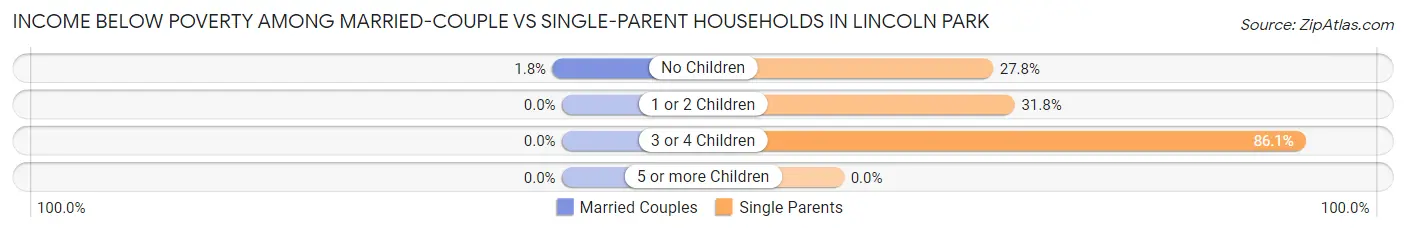
| Children | Married-Couple Families | Single-Parent Households |
| No Children | 13 (1.8%) | 25 (27.8%) |
| 1 or 2 Children | 0 (0.0%) | 7 (31.8%) |
| 3 or 4 Children | 0 (0.0%) | 37 (86.1%) |
| 5 or more Children | 0 (0.0%) | 0 (0.0%) |
| Total | 13 (1.4%) | 69 (44.5%) |
Race in Lincoln Park
The most populous races in Lincoln Park are White / Caucasian (3,921 | 88.8%), Hispanic or Latino (409 | 9.3%), and Two or more Races (399 | 9.0%).
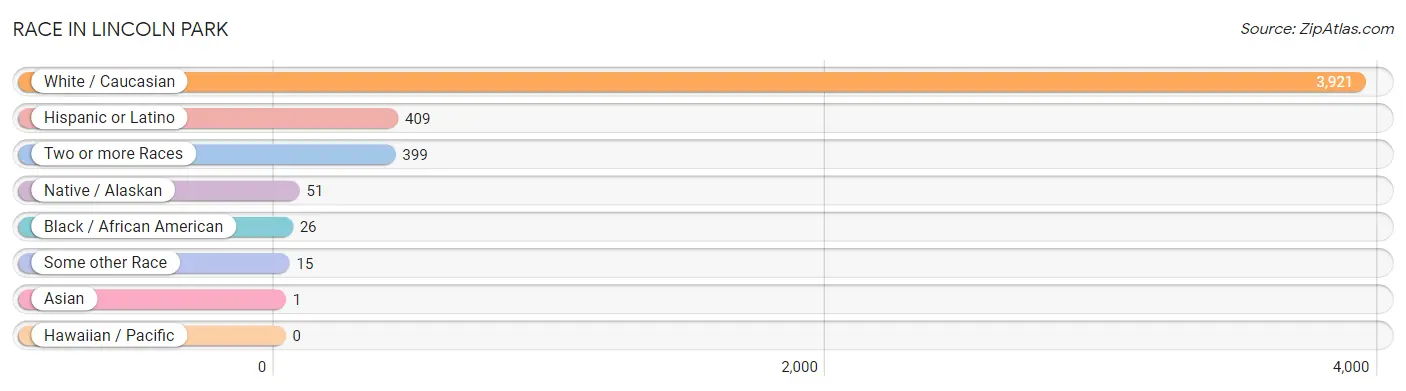
| Race | # Population | % Population |
| Asian | 1 | 0.0% |
| Black / African American | 26 | 0.6% |
| Hawaiian / Pacific | 0 | 0.0% |
| Hispanic or Latino | 409 | 9.3% |
| Native / Alaskan | 51 | 1.2% |
| White / Caucasian | 3,921 | 88.8% |
| Two or more Races | 399 | 9.0% |
| Some other Race | 15 | 0.3% |
| Total | 4,413 | 100.0% |
Ancestry in Lincoln Park
The most populous ancestries reported in Lincoln Park are German (909 | 20.6%), English (896 | 20.3%), Irish (636 | 14.4%), Mexican (323 | 7.3%), and Scottish (238 | 5.4%), together accounting for 68.0% of all Lincoln Park residents.
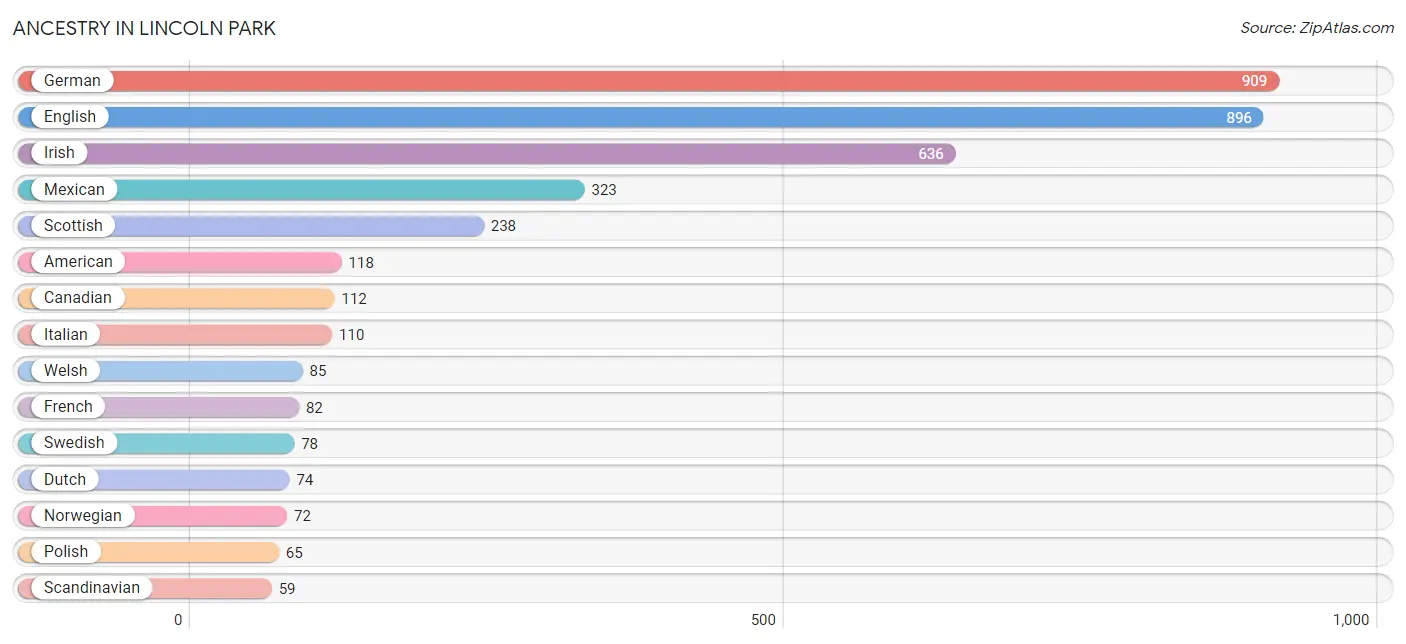
| Ancestry | # Population | % Population |
| American | 118 | 2.7% |
| Arapaho | 2 | 0.1% |
| Austrian | 36 | 0.8% |
| Canadian | 112 | 2.5% |
| Central American | 14 | 0.3% |
| Cherokee | 29 | 0.7% |
| Czech | 36 | 0.8% |
| Danish | 35 | 0.8% |
| Dutch | 74 | 1.7% |
| English | 896 | 20.3% |
| European | 18 | 0.4% |
| Finnish | 7 | 0.2% |
| French | 82 | 1.9% |
| French Canadian | 10 | 0.2% |
| German | 909 | 20.6% |
| Irish | 636 | 14.4% |
| Italian | 110 | 2.5% |
| Mexican | 323 | 7.3% |
| Northern European | 17 | 0.4% |
| Norwegian | 72 | 1.6% |
| Polish | 65 | 1.5% |
| Portuguese | 10 | 0.2% |
| Russian | 30 | 0.7% |
| Salvadoran | 14 | 0.3% |
| Scandinavian | 59 | 1.3% |
| Scotch-Irish | 33 | 0.7% |
| Scottish | 238 | 5.4% |
| Slovak | 10 | 0.2% |
| Slovene | 7 | 0.2% |
| Spanish | 14 | 0.3% |
| Swedish | 78 | 1.8% |
| Swiss | 6 | 0.1% |
| Thai | 1 | 0.0% |
| Ute | 47 | 1.1% |
| Welsh | 85 | 1.9% | View All 35 Rows |
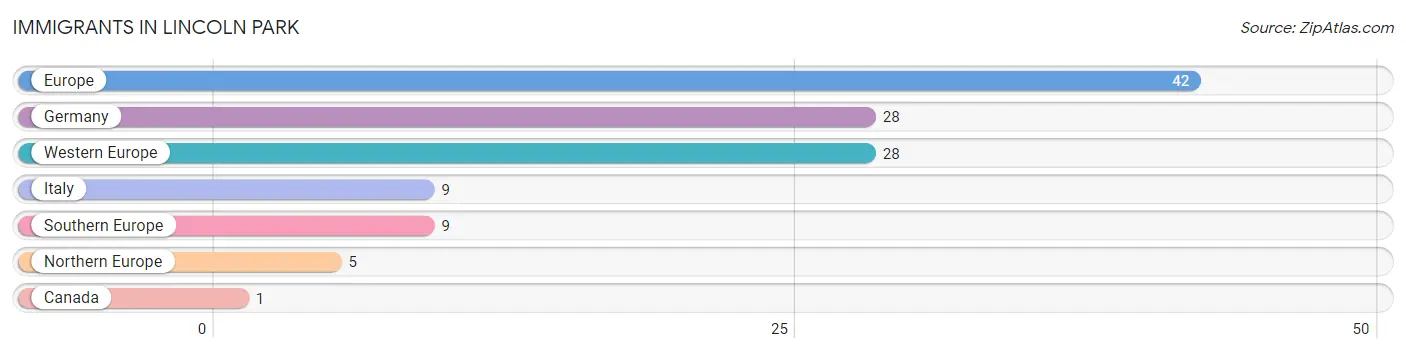
Immigrants in Lincoln Park
The most numerous immigrant groups reported in Lincoln Park came from Europe (42 | 0.9%), Germany (28 | 0.6%), Western Europe (28 | 0.6%), Italy (9 | 0.2%), and Southern Europe (9 | 0.2%), together accounting for 2.6% of all Lincoln Park residents.
| Immigration Origin | # Population | % Population |
| Canada | 1 | 0.0% |
| Europe | 42 | 0.9% |
| Germany | 28 | 0.6% |
| Italy | 9 | 0.2% |
| Northern Europe | 5 | 0.1% |
| Southern Europe | 9 | 0.2% |
| Western Europe | 28 | 0.6% | View All 7 Rows |
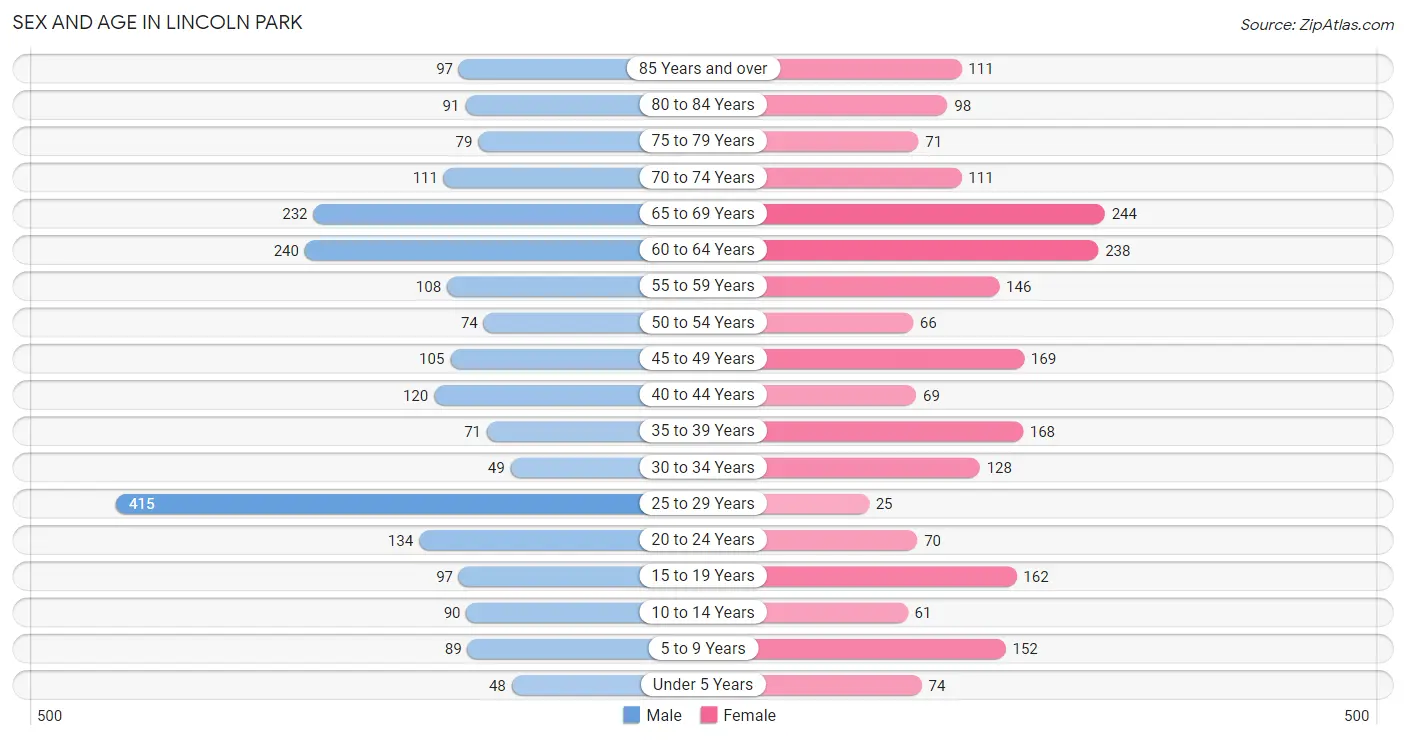
Sex and Age in Lincoln Park
Sex and Age in Lincoln Park
The most populous age groups in Lincoln Park are 25 to 29 Years (415 | 18.4%) for men and 65 to 69 Years (244 | 11.3%) for women.
| Age Bracket | Male | Female |
| Under 5 Years | 48 (2.1%) | 74 (3.4%) |
| 5 to 9 Years | 89 (4.0%) | 152 (7.0%) |
| 10 to 14 Years | 90 (4.0%) | 61 (2.8%) |
| 15 to 19 Years | 97 (4.3%) | 162 (7.5%) |
| 20 to 24 Years | 134 (6.0%) | 70 (3.2%) |
| 25 to 29 Years | 415 (18.4%) | 25 (1.2%) |
| 30 to 34 Years | 49 (2.2%) | 128 (5.9%) |
| 35 to 39 Years | 71 (3.2%) | 168 (7.8%) |
| 40 to 44 Years | 120 (5.3%) | 69 (3.2%) |
| 45 to 49 Years | 105 (4.7%) | 169 (7.8%) |
| 50 to 54 Years | 74 (3.3%) | 66 (3.0%) |
| 55 to 59 Years | 108 (4.8%) | 146 (6.8%) |
| 60 to 64 Years | 240 (10.7%) | 238 (11.0%) |
| 65 to 69 Years | 232 (10.3%) | 244 (11.3%) |
| 70 to 74 Years | 111 (4.9%) | 111 (5.1%) |
| 75 to 79 Years | 79 (3.5%) | 71 (3.3%) |
| 80 to 84 Years | 91 (4.0%) | 98 (4.5%) |
| 85 Years and over | 97 (4.3%) | 111 (5.1%) |
| Total | 2,250 (100.0%) | 2,163 (100.0%) |
Families and Households in Lincoln Park
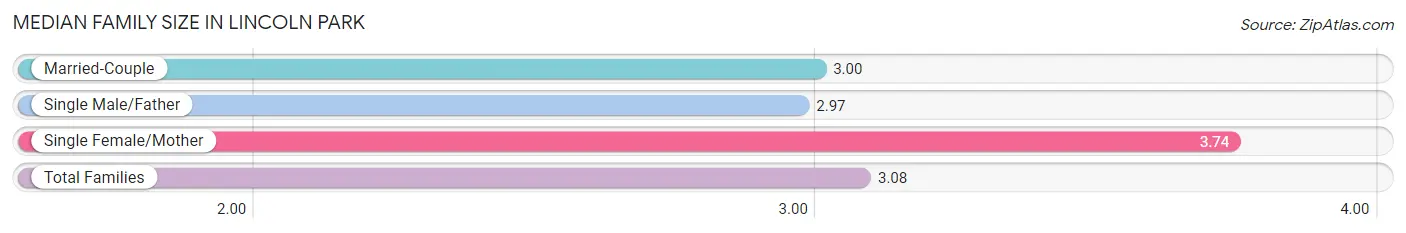
Median Family Size in Lincoln Park
The median family size in Lincoln Park is 3.08 persons per family, with single female/mother families (117 | 10.8%) accounting for the largest median family size of 3.74 persons per family. On the other hand, single male/father families (38 | 3.5%) represent the smallest median family size with 2.97 persons per family.
| Family Type | # Families | Family Size |
| Married-Couple | 932 (85.7%) | 3.00 |
| Single Male/Father | 38 (3.5%) | 2.97 |
| Single Female/Mother | 117 (10.8%) | 3.74 |
| Total Families | 1,087 (100.0%) | 3.08 |
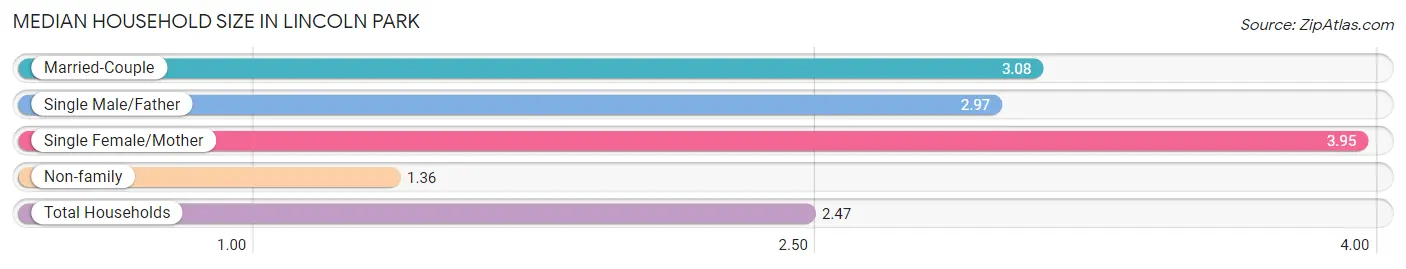
Median Household Size in Lincoln Park
The median household size in Lincoln Park is 2.47 persons per household, with single female/mother households (117 | 6.6%) accounting for the largest median household size of 3.95 persons per household. non-family households (686 | 38.7%) represent the smallest median household size with 1.36 persons per household.
| Household Type | # Households | Household Size |
| Married-Couple | 932 (52.6%) | 3.08 |
| Single Male/Father | 38 (2.1%) | 2.97 |
| Single Female/Mother | 117 (6.6%) | 3.95 |
| Non-family | 686 (38.7%) | 1.36 |
| Total Households | 1,773 (100.0%) | 2.47 |
Household Size by Marriage Status in Lincoln Park
Out of a total of 1,773 households in Lincoln Park, 1,087 (61.3%) are family households, while 686 (38.7%) are nonfamily households. The most numerous type of family households are 2-person households, comprising 665, and the most common type of nonfamily households are 1-person households, comprising 492.
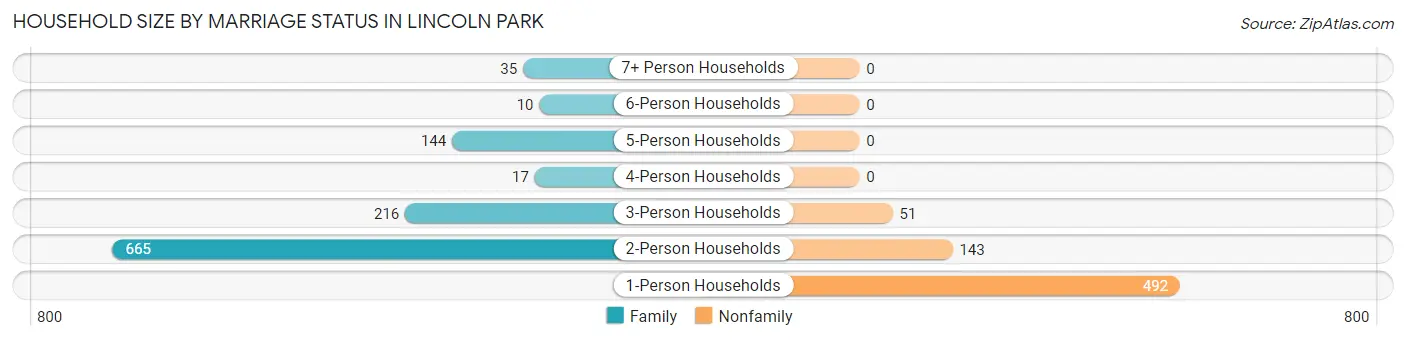
| Household Size | Family Households | Nonfamily Households |
| 1-Person Households | - | 492 (27.8%) |
| 2-Person Households | 665 (37.5%) | 143 (8.1%) |
| 3-Person Households | 216 (12.2%) | 51 (2.9%) |
| 4-Person Households | 17 (1.0%) | 0 (0.0%) |
| 5-Person Households | 144 (8.1%) | 0 (0.0%) |
| 6-Person Households | 10 (0.6%) | 0 (0.0%) |
| 7+ Person Households | 35 (2.0%) | 0 (0.0%) |
| Total | 1,087 (61.3%) | 686 (38.7%) |
Female Fertility in Lincoln Park
Fertility by Age in Lincoln Park
Average fertility rate in Lincoln Park is 20.0 births per 1,000 women. Women in the age bracket of 20 to 34 years have the highest fertility rate with 72.0 births per 1,000 women. Women in the age bracket of 20 to 34 years acount for 100.0% of all women with births.
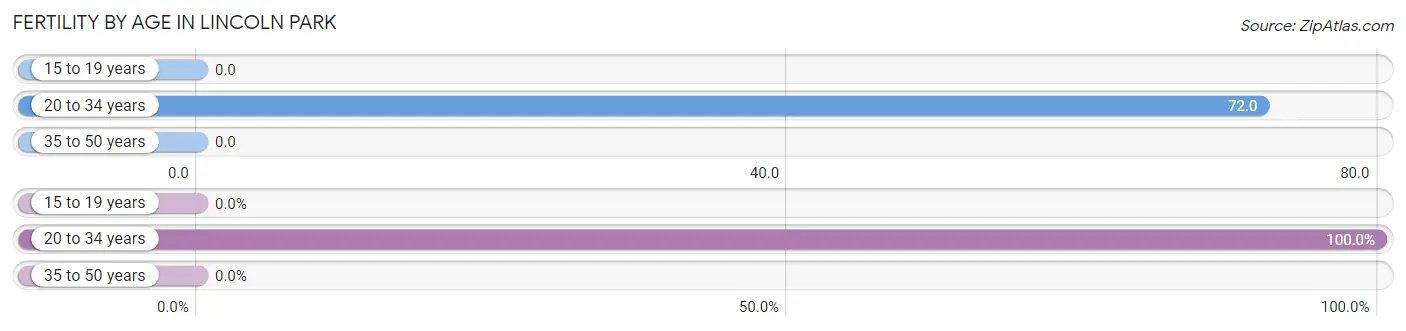
| Age Bracket | Women with Births | Births / 1,000 Women |
| 15 to 19 years | 0 (0.0%) | 0.0 |
| 20 to 34 years | 16 (100.0%) | 72.0 |
| 35 to 50 years | 0 (0.0%) | 0.0 |
| Total | 16 (100.0%) | 20.0 |
Fertility by Age by Marriage Status in Lincoln Park
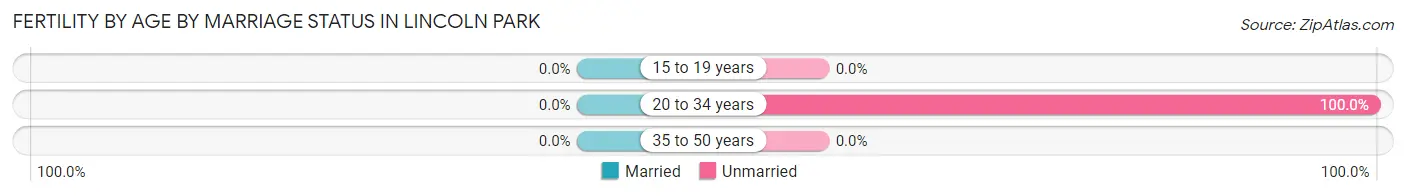
| Age Bracket | Married | Unmarried |
| 15 to 19 years | 0 (0.0%) | 0 (0.0%) |
| 20 to 34 years | 0 (0.0%) | 16 (100.0%) |
| 35 to 50 years | 0 (0.0%) | 0 (0.0%) |
| Total | 0 (0.0%) | 16 (100.0%) |
Fertility by Education in Lincoln Park
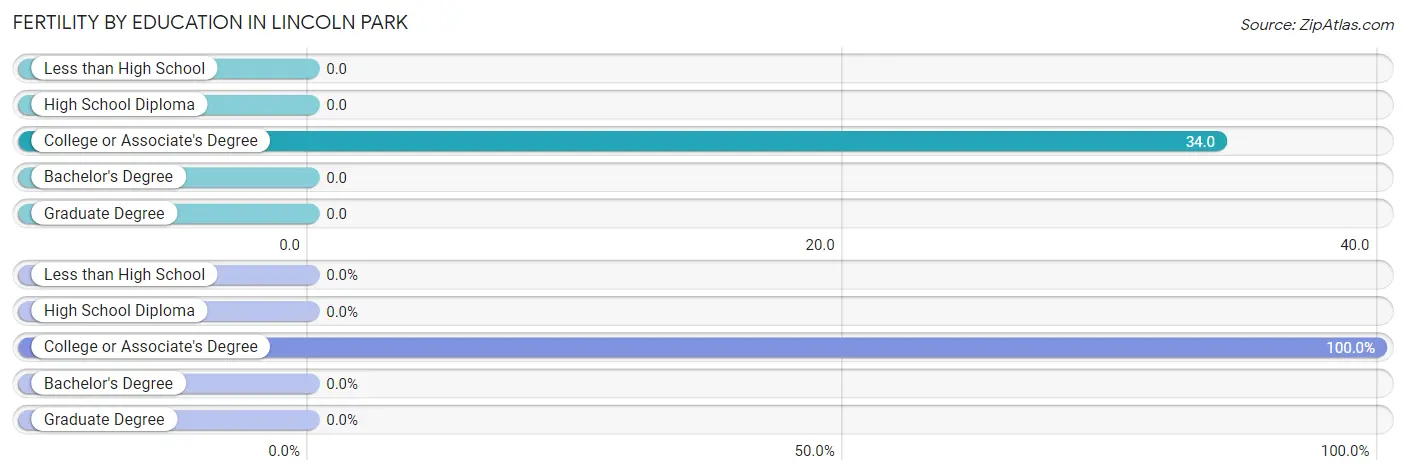
| Educational Attainment | Women with Births | Births / 1,000 Women |
| Less than High School | 0 (0.0%) | 0.0 |
| High School Diploma | 0 (0.0%) | 0.0 |
| College or Associate's Degree | 16 (100.0%) | 34.0 |
| Bachelor's Degree | 0 (0.0%) | 0.0 |
| Graduate Degree | 0 (0.0%) | 0.0 |
| Total | 16 (100.0%) | 20.0 |
Fertility by Education by Marriage Status in Lincoln Park
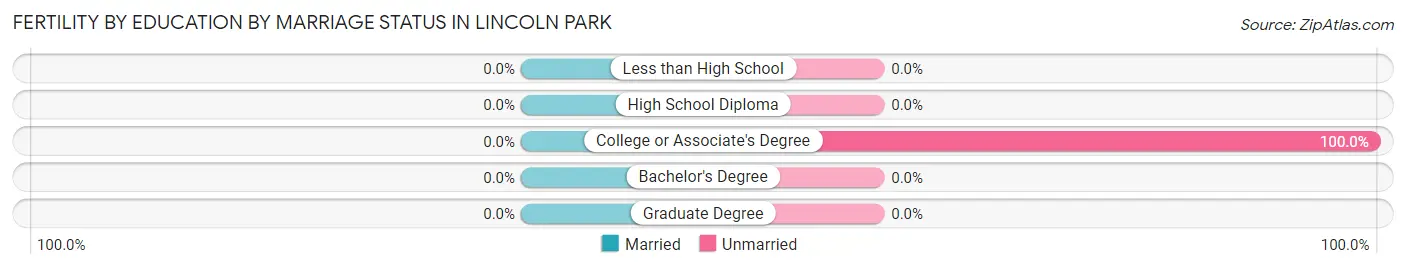
| Educational Attainment | Married | Unmarried |
| Less than High School | 0 (0.0%) | 0 (0.0%) |
| High School Diploma | 0 (0.0%) | 0 (0.0%) |
| College or Associate's Degree | 0 (0.0%) | 16 (100.0%) |
| Bachelor's Degree | 0 (0.0%) | 0 (0.0%) |
| Graduate Degree | 0 (0.0%) | 0 (0.0%) |
| Total | 0 (0.0%) | 16 (100.0%) |
Employment Characteristics in Lincoln Park
Employment by Class of Employer in Lincoln Park
Among the 1,343 employed individuals in Lincoln Park, private company employees (719 | 53.5%), self-employed (incorporated) (157 | 11.7%), and self-employed (not incorporated) (142 | 10.6%) make up the most common classes of employment.
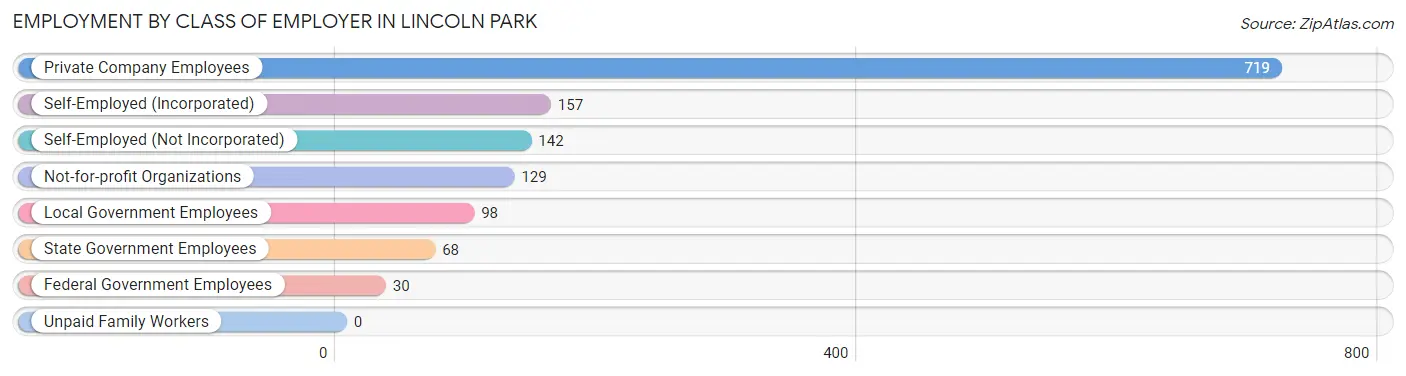
| Employer Class | # Employees | % Employees |
| Private Company Employees | 719 | 53.5% |
| Self-Employed (Incorporated) | 157 | 11.7% |
| Self-Employed (Not Incorporated) | 142 | 10.6% |
| Not-for-profit Organizations | 129 | 9.6% |
| Local Government Employees | 98 | 7.3% |
| State Government Employees | 68 | 5.1% |
| Federal Government Employees | 30 | 2.2% |
| Unpaid Family Workers | 0 | 0.0% |
| Total | 1,343 | 100.0% |
Employment Status by Age in Lincoln Park
According to the labor force statistics for Lincoln Park, out of the total population over 16 years of age (3,799), 40.9% or 1,554 individuals are in the labor force, with 5.9% or 92 of them unemployed. The age group with the highest labor force participation rate is 35 to 44 years, with 84.6% or 362 individuals in the labor force. Within the labor force, the 20 to 24 years age range has the highest percentage of unemployed individuals, with 40.7% or 33 of them being unemployed.
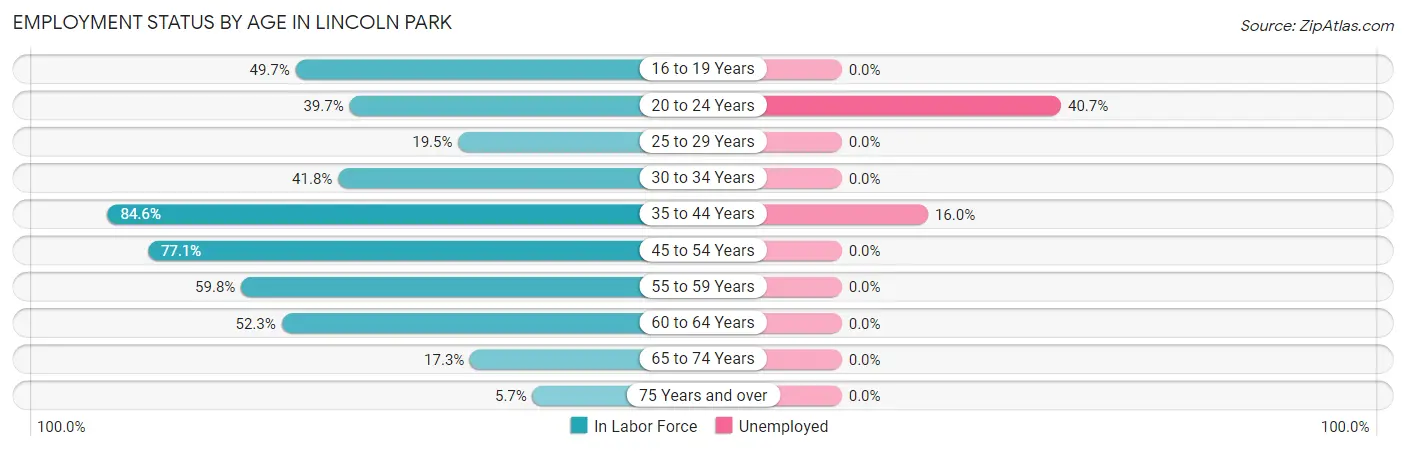
| Age Bracket | In Labor Force | Unemployed |
| 16 to 19 Years | 79 (49.7%) | 0 (0.0%) |
| 20 to 24 Years | 81 (39.7%) | 33 (40.7%) |
| 25 to 29 Years | 86 (19.5%) | 0 (0.0%) |
| 30 to 34 Years | 74 (41.8%) | 0 (0.0%) |
| 35 to 44 Years | 362 (84.6%) | 58 (16.0%) |
| 45 to 54 Years | 319 (77.1%) | 0 (0.0%) |
| 55 to 59 Years | 152 (59.8%) | 0 (0.0%) |
| 60 to 64 Years | 250 (52.3%) | 0 (0.0%) |
| 65 to 74 Years | 121 (17.3%) | 0 (0.0%) |
| 75 Years and over | 31 (5.7%) | 0 (0.0%) |
| Total | 1,554 (40.9%) | 92 (5.9%) |
Employment Status by Educational Attainment in Lincoln Park
According to labor force statistics for Lincoln Park, 56.7% of individuals (1,242) out of the total population between 25 and 64 years of age (2,191) are in the labor force, with 4.7% or 58 of them being unemployed. The group with the highest labor force participation rate are those with the educational attainment of less than high school, with 94.6% or 70 individuals in the labor force. Within the labor force, individuals with high school diploma education have the highest percentage of unemployment, with 18.2% or 58 of them being unemployed.
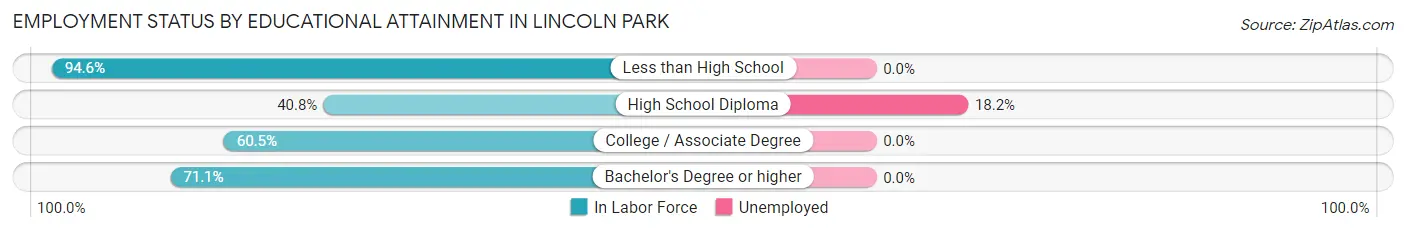
| Educational Attainment | In Labor Force | Unemployed |
| Less than High School | 70 (94.6%) | 0 (0.0%) |
| High School Diploma | 318 (40.8%) | 142 (18.2%) |
| College / Associate Degree | 543 (60.5%) | 0 (0.0%) |
| Bachelor's Degree or higher | 312 (71.1%) | 0 (0.0%) |
| Total | 1,242 (56.7%) | 103 (4.7%) |
Employment Occupations by Sex in Lincoln Park
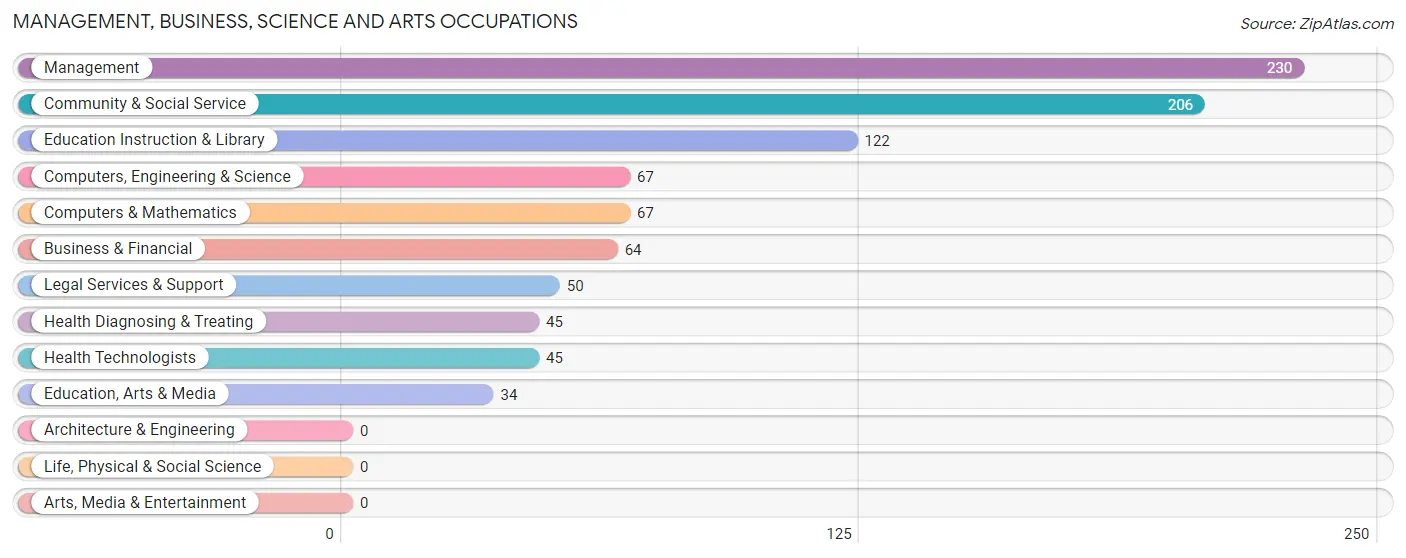
Management, Business, Science and Arts Occupations
The most common Management, Business, Science and Arts occupations in Lincoln Park are Management (230 | 15.7%), Community & Social Service (206 | 14.1%), Education Instruction & Library (122 | 8.3%), Computers, Engineering & Science (67 | 4.6%), and Computers & Mathematics (67 | 4.6%).
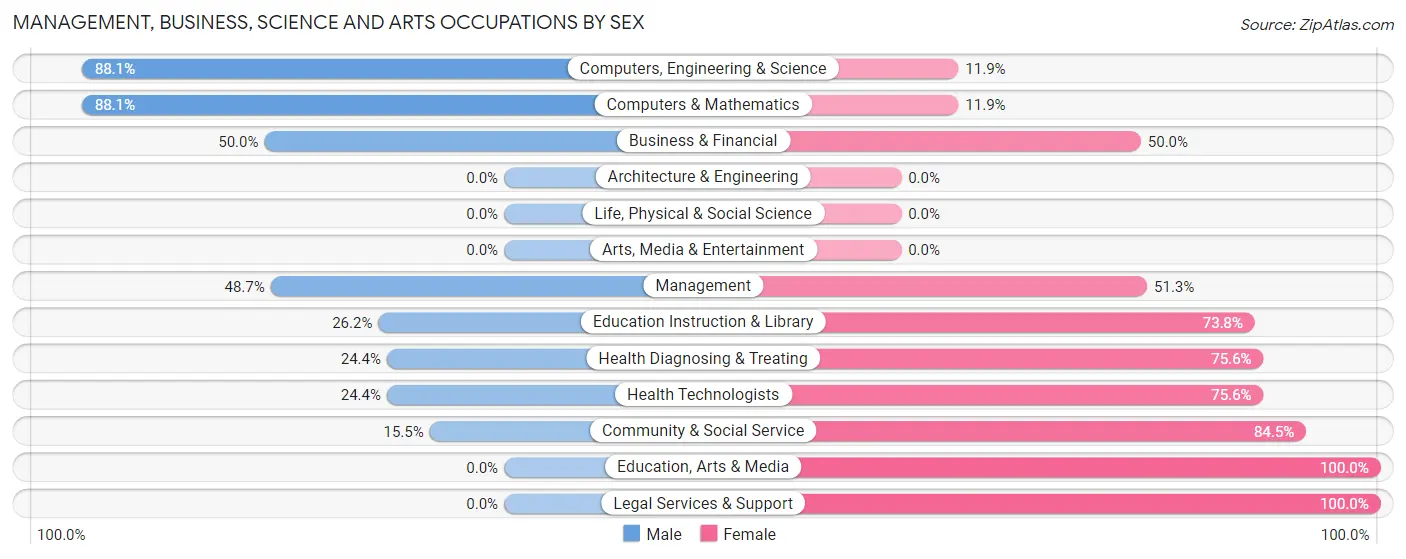
Management, Business, Science and Arts Occupations by Sex
Within the Management, Business, Science and Arts occupations in Lincoln Park, the most male-oriented occupations are Computers, Engineering & Science (88.1%), Computers & Mathematics (88.1%), and Business & Financial (50.0%), while the most female-oriented occupations are Education, Arts & Media (100.0%), Legal Services & Support (100.0%), and Community & Social Service (84.5%).
| Occupation | Male | Female |
| Management | 112 (48.7%) | 118 (51.3%) |
| Business & Financial | 32 (50.0%) | 32 (50.0%) |
| Computers, Engineering & Science | 59 (88.1%) | 8 (11.9%) |
| Computers & Mathematics | 59 (88.1%) | 8 (11.9%) |
| Architecture & Engineering | 0 (0.0%) | 0 (0.0%) |
| Life, Physical & Social Science | 0 (0.0%) | 0 (0.0%) |
| Community & Social Service | 32 (15.5%) | 174 (84.5%) |
| Education, Arts & Media | 0 (0.0%) | 34 (100.0%) |
| Legal Services & Support | 0 (0.0%) | 50 (100.0%) |
| Education Instruction & Library | 32 (26.2%) | 90 (73.8%) |
| Arts, Media & Entertainment | 0 (0.0%) | 0 (0.0%) |
| Health Diagnosing & Treating | 11 (24.4%) | 34 (75.6%) |
| Health Technologists | 11 (24.4%) | 34 (75.6%) |
| Total (Category) | 246 (40.2%) | 366 (59.8%) |
| Total (Overall) | 762 (52.0%) | 702 (47.9%) |
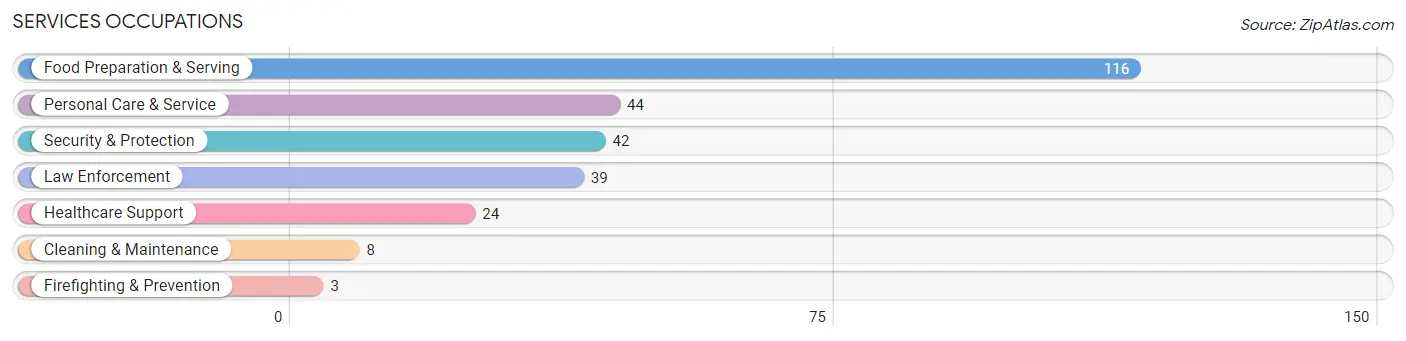
Services Occupations
The most common Services occupations in Lincoln Park are Food Preparation & Serving (116 | 7.9%), Personal Care & Service (44 | 3.0%), Security & Protection (42 | 2.9%), Law Enforcement (39 | 2.7%), and Healthcare Support (24 | 1.6%).
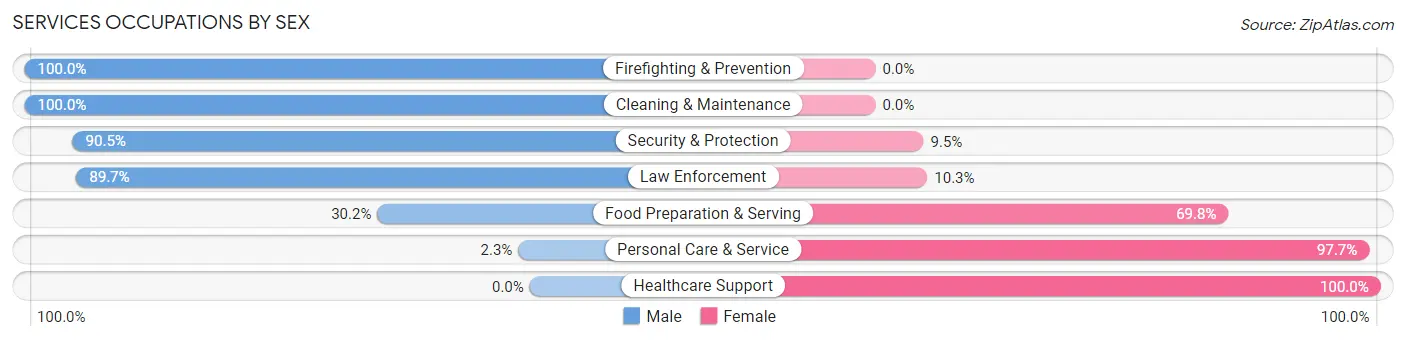
Services Occupations by Sex
Within the Services occupations in Lincoln Park, the most male-oriented occupations are Firefighting & Prevention (100.0%), Cleaning & Maintenance (100.0%), and Security & Protection (90.5%), while the most female-oriented occupations are Healthcare Support (100.0%), Personal Care & Service (97.7%), and Food Preparation & Serving (69.8%).
| Occupation | Male | Female |
| Healthcare Support | 0 (0.0%) | 24 (100.0%) |
| Security & Protection | 38 (90.5%) | 4 (9.5%) |
| Firefighting & Prevention | 3 (100.0%) | 0 (0.0%) |
| Law Enforcement | 35 (89.7%) | 4 (10.3%) |
| Food Preparation & Serving | 35 (30.2%) | 81 (69.8%) |
| Cleaning & Maintenance | 8 (100.0%) | 0 (0.0%) |
| Personal Care & Service | 1 (2.3%) | 43 (97.7%) |
| Total (Category) | 82 (35.0%) | 152 (65.0%) |
| Total (Overall) | 762 (52.0%) | 702 (47.9%) |
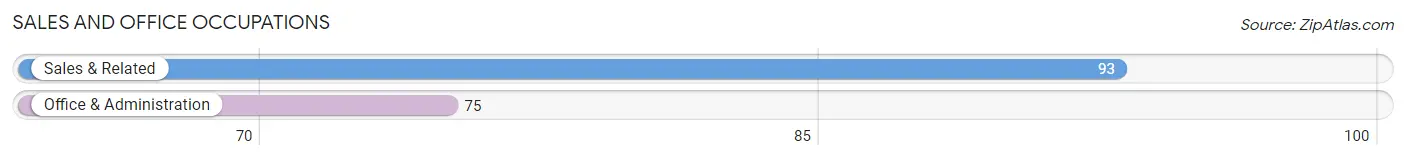
Sales and Office Occupations
The most common Sales and Office occupations in Lincoln Park are Sales & Related (93 | 6.4%), and Office & Administration (75 | 5.1%).
Sales and Office Occupations by Sex
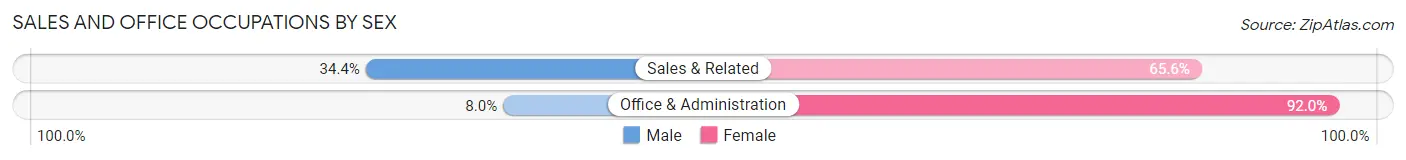
| Occupation | Male | Female |
| Sales & Related | 32 (34.4%) | 61 (65.6%) |
| Office & Administration | 6 (8.0%) | 69 (92.0%) |
| Total (Category) | 38 (22.6%) | 130 (77.4%) |
| Total (Overall) | 762 (52.0%) | 702 (47.9%) |
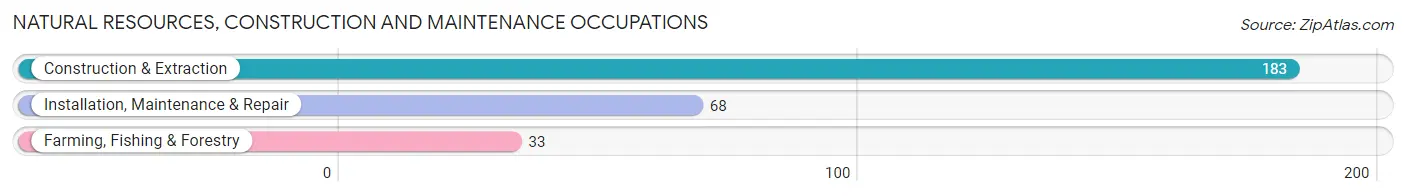
Natural Resources, Construction and Maintenance Occupations
The most common Natural Resources, Construction and Maintenance occupations in Lincoln Park are Construction & Extraction (183 | 12.5%), Installation, Maintenance & Repair (68 | 4.6%), and Farming, Fishing & Forestry (33 | 2.2%).
Natural Resources, Construction and Maintenance Occupations by Sex
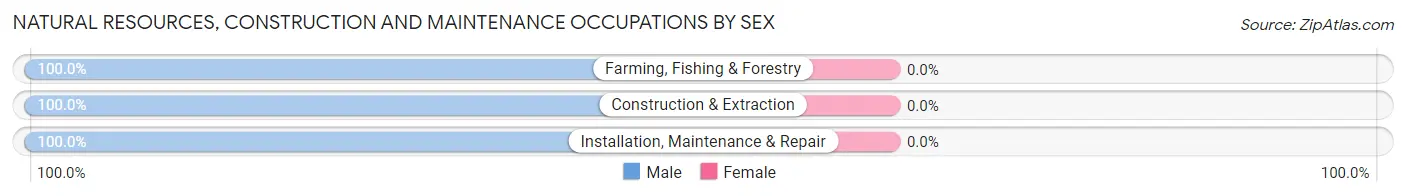
| Occupation | Male | Female |
| Farming, Fishing & Forestry | 33 (100.0%) | 0 (0.0%) |
| Construction & Extraction | 183 (100.0%) | 0 (0.0%) |
| Installation, Maintenance & Repair | 68 (100.0%) | 0 (0.0%) |
| Total (Category) | 284 (100.0%) | 0 (0.0%) |
| Total (Overall) | 762 (52.0%) | 702 (47.9%) |
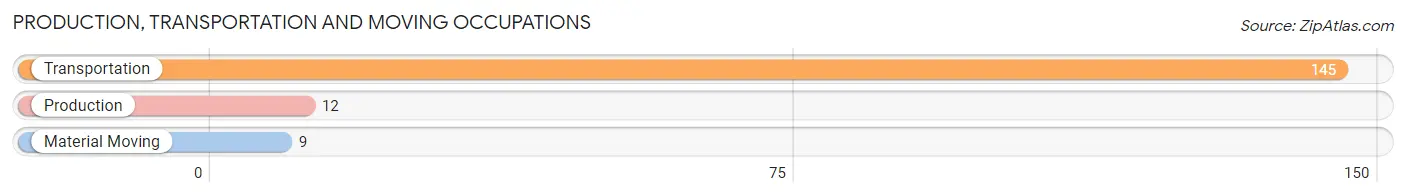
Production, Transportation and Moving Occupations
The most common Production, Transportation and Moving occupations in Lincoln Park are Transportation (145 | 9.9%), Production (12 | 0.8%), and Material Moving (9 | 0.6%).
Production, Transportation and Moving Occupations by Sex
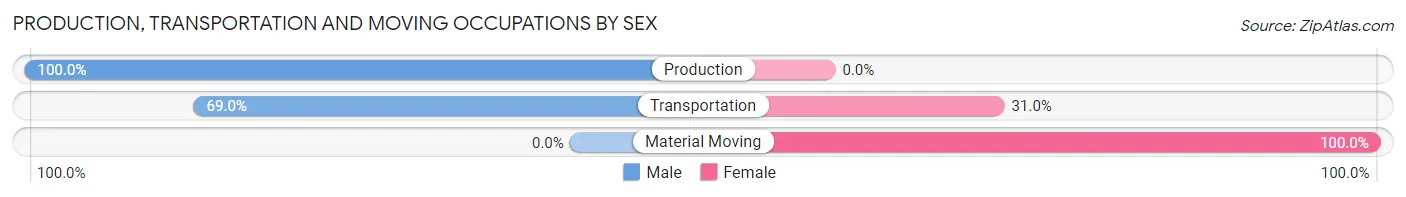
| Occupation | Male | Female |
| Production | 12 (100.0%) | 0 (0.0%) |
| Transportation | 100 (69.0%) | 45 (31.0%) |
| Material Moving | 0 (0.0%) | 9 (100.0%) |
| Total (Category) | 112 (67.5%) | 54 (32.5%) |
| Total (Overall) | 762 (52.0%) | 702 (47.9%) |
Employment Industries by Sex in Lincoln Park
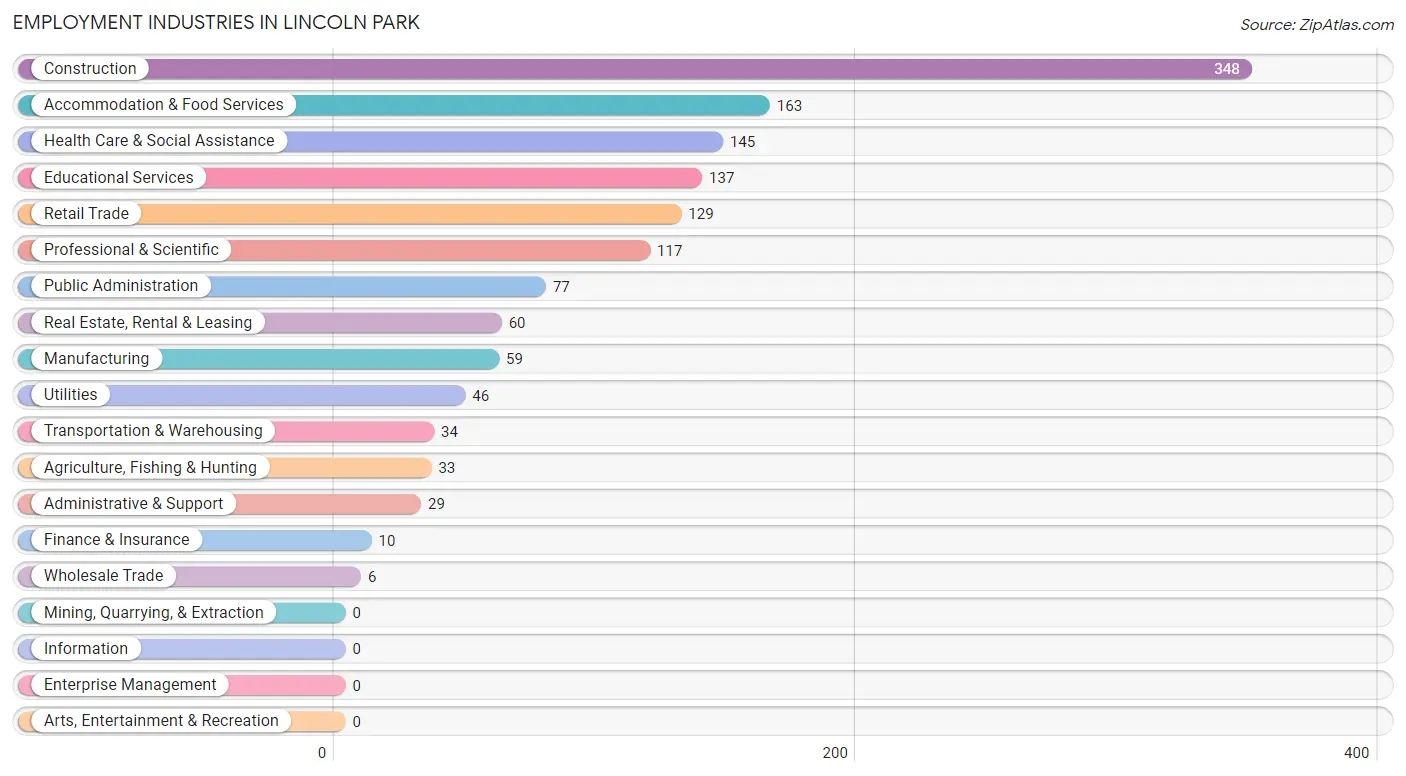
Employment Industries in Lincoln Park
The major employment industries in Lincoln Park include Construction (348 | 23.8%), Accommodation & Food Services (163 | 11.1%), Health Care & Social Assistance (145 | 9.9%), Educational Services (137 | 9.4%), and Retail Trade (129 | 8.8%).
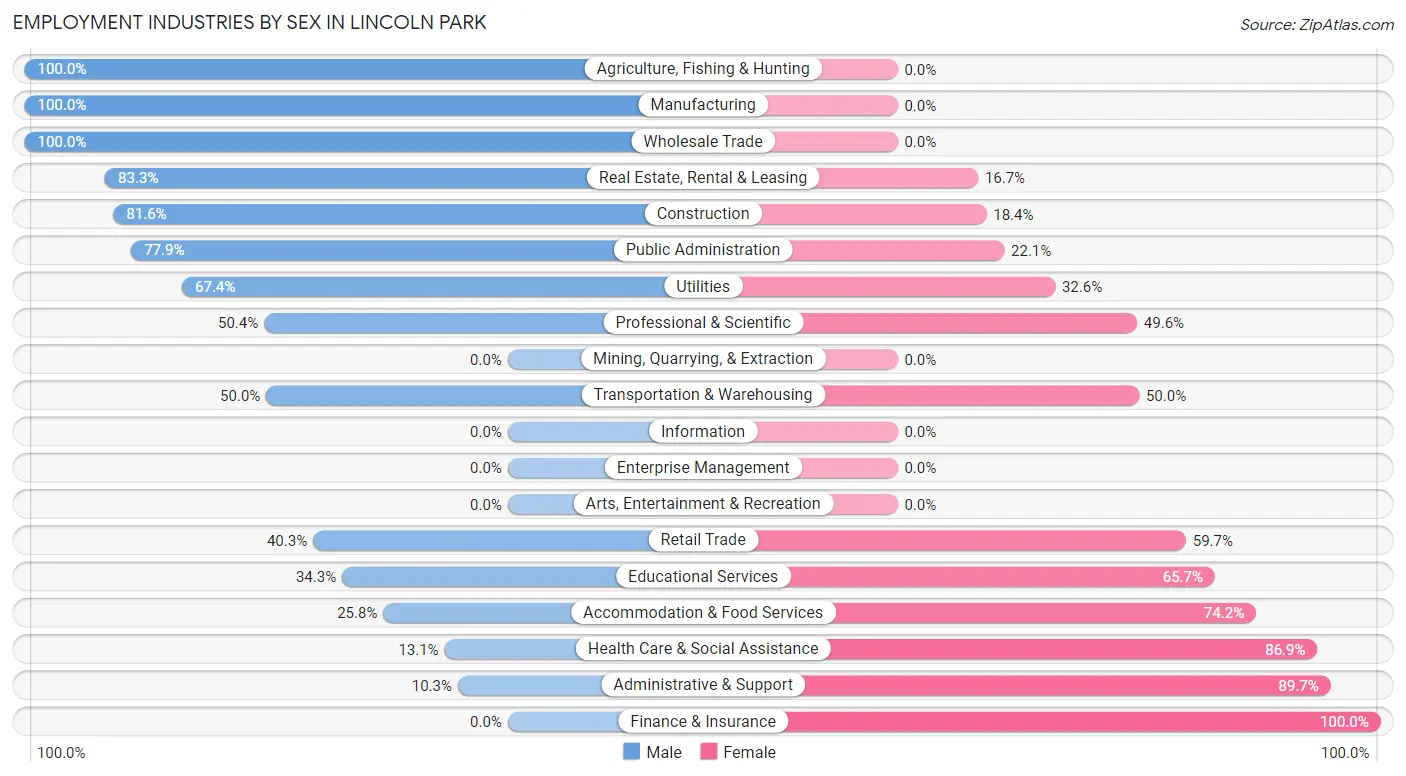
Employment Industries by Sex in Lincoln Park
The Lincoln Park industries that see more men than women are Agriculture, Fishing & Hunting (100.0%), Manufacturing (100.0%), and Wholesale Trade (100.0%), whereas the industries that tend to have a higher number of women are Finance & Insurance (100.0%), Administrative & Support (89.7%), and Health Care & Social Assistance (86.9%).
| Industry | Male | Female |
| Agriculture, Fishing & Hunting | 33 (100.0%) | 0 (0.0%) |
| Mining, Quarrying, & Extraction | 0 (0.0%) | 0 (0.0%) |
| Construction | 284 (81.6%) | 64 (18.4%) |
| Manufacturing | 59 (100.0%) | 0 (0.0%) |
| Wholesale Trade | 6 (100.0%) | 0 (0.0%) |
| Retail Trade | 52 (40.3%) | 77 (59.7%) |
| Transportation & Warehousing | 17 (50.0%) | 17 (50.0%) |
| Utilities | 31 (67.4%) | 15 (32.6%) |
| Information | 0 (0.0%) | 0 (0.0%) |
| Finance & Insurance | 0 (0.0%) | 10 (100.0%) |
| Real Estate, Rental & Leasing | 50 (83.3%) | 10 (16.7%) |
| Professional & Scientific | 59 (50.4%) | 58 (49.6%) |
| Enterprise Management | 0 (0.0%) | 0 (0.0%) |
| Administrative & Support | 3 (10.3%) | 26 (89.7%) |
| Educational Services | 47 (34.3%) | 90 (65.7%) |
| Health Care & Social Assistance | 19 (13.1%) | 126 (86.9%) |
| Arts, Entertainment & Recreation | 0 (0.0%) | 0 (0.0%) |
| Accommodation & Food Services | 42 (25.8%) | 121 (74.2%) |
| Public Administration | 60 (77.9%) | 17 (22.1%) |
| Total | 762 (52.0%) | 702 (47.9%) |
Education in Lincoln Park
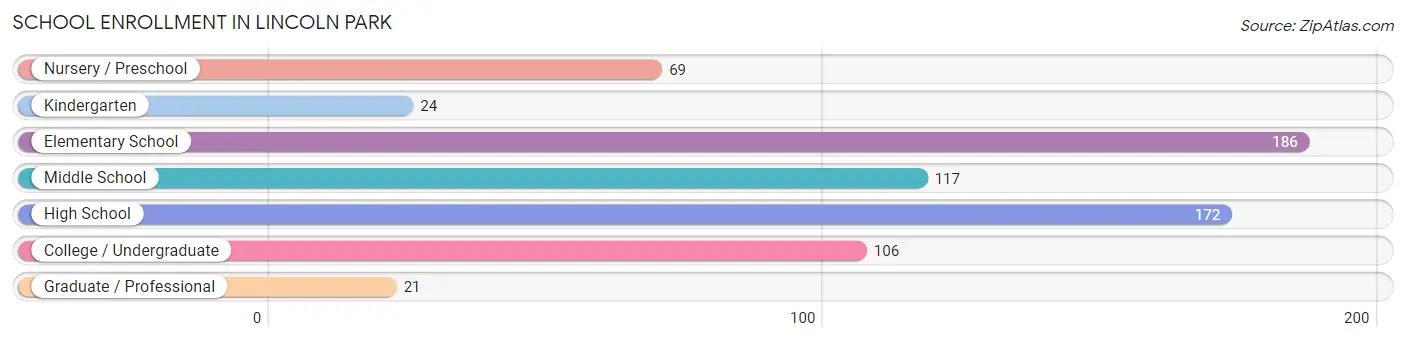
School Enrollment in Lincoln Park
The most common levels of schooling among the 695 students in Lincoln Park are elementary school (186 | 26.8%), high school (172 | 24.7%), and middle school (117 | 16.8%).
| School Level | # Students | % Students |
| Nursery / Preschool | 69 | 9.9% |
| Kindergarten | 24 | 3.5% |
| Elementary School | 186 | 26.8% |
| Middle School | 117 | 16.8% |
| High School | 172 | 24.7% |
| College / Undergraduate | 106 | 15.2% |
| Graduate / Professional | 21 | 3.0% |
| Total | 695 | 100.0% |
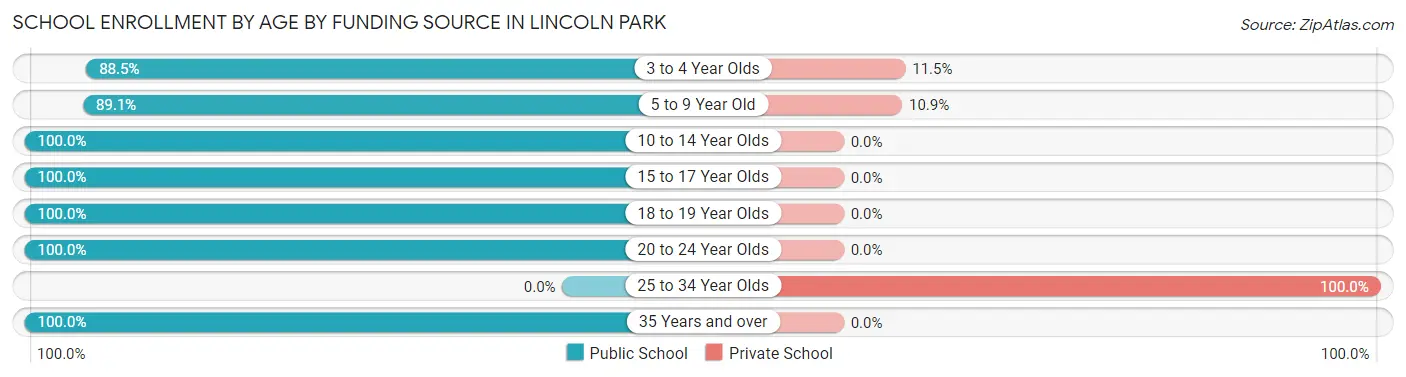
School Enrollment by Age by Funding Source in Lincoln Park
Out of a total of 695 students who are enrolled in schools in Lincoln Park, 37 (5.3%) attend a private institution, while the remaining 658 (94.7%) are enrolled in public schools. The age group of 25 to 34 year olds has the highest likelihood of being enrolled in private schools, with 10 (100.0% in the age bracket) enrolled. Conversely, the age group of 10 to 14 year olds has the lowest likelihood of being enrolled in a private school, with 151 (100.0% in the age bracket) attending a public institution.
| Age Bracket | Public School | Private School |
| 3 to 4 Year Olds | 54 (88.5%) | 7 (11.5%) |
| 5 to 9 Year Old | 164 (89.1%) | 20 (10.9%) |
| 10 to 14 Year Olds | 151 (100.0%) | 0 (0.0%) |
| 15 to 17 Year Olds | 169 (100.0%) | 0 (0.0%) |
| 18 to 19 Year Olds | 43 (100.0%) | 0 (0.0%) |
| 20 to 24 Year Olds | 7 (100.0%) | 0 (0.0%) |
| 25 to 34 Year Olds | 0 (0.0%) | 10 (100.0%) |
| 35 Years and over | 70 (100.0%) | 0 (0.0%) |
| Total | 658 (94.7%) | 37 (5.3%) |
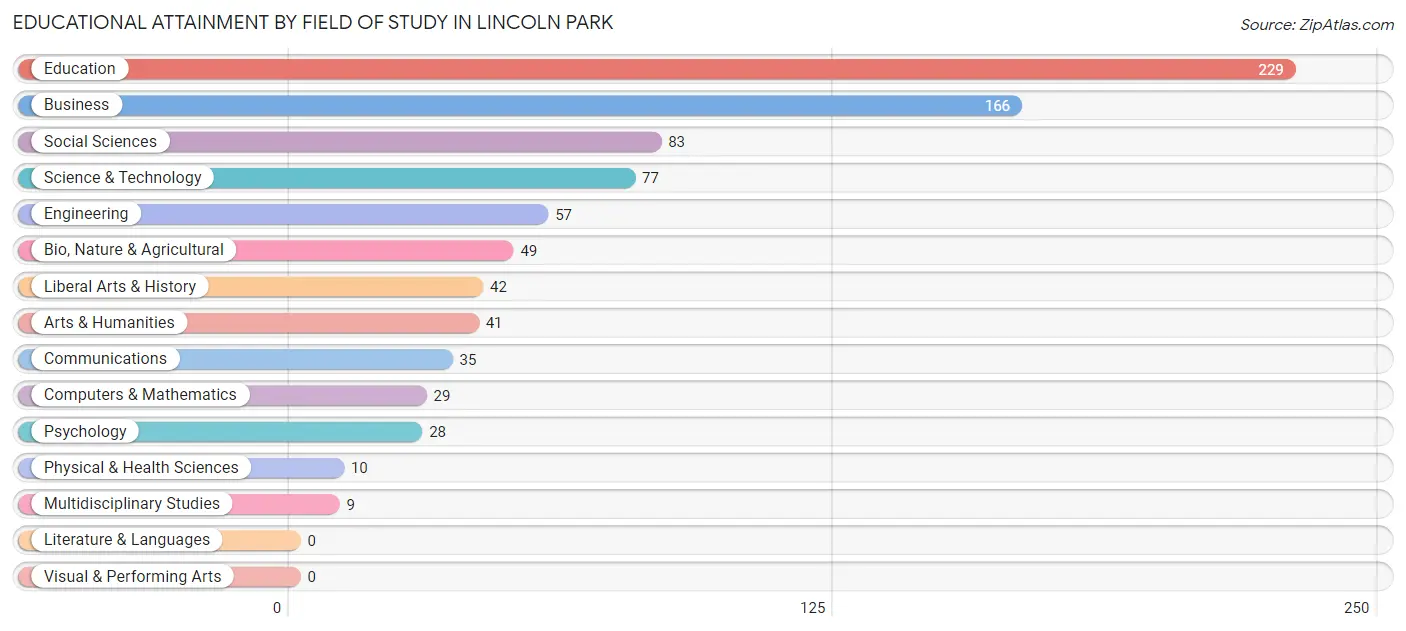
Educational Attainment by Field of Study in Lincoln Park
Education (229 | 26.8%), business (166 | 19.4%), social sciences (83 | 9.7%), science & technology (77 | 9.0%), and engineering (57 | 6.7%) are the most common fields of study among 855 individuals in Lincoln Park who have obtained a bachelor's degree or higher.
| Field of Study | # Graduates | % Graduates |
| Computers & Mathematics | 29 | 3.4% |
| Bio, Nature & Agricultural | 49 | 5.7% |
| Physical & Health Sciences | 10 | 1.2% |
| Psychology | 28 | 3.3% |
| Social Sciences | 83 | 9.7% |
| Engineering | 57 | 6.7% |
| Multidisciplinary Studies | 9 | 1.1% |
| Science & Technology | 77 | 9.0% |
| Business | 166 | 19.4% |
| Education | 229 | 26.8% |
| Literature & Languages | 0 | 0.0% |
| Liberal Arts & History | 42 | 4.9% |
| Visual & Performing Arts | 0 | 0.0% |
| Communications | 35 | 4.1% |
| Arts & Humanities | 41 | 4.8% |
| Total | 855 | 100.0% |
Transportation & Commute in Lincoln Park
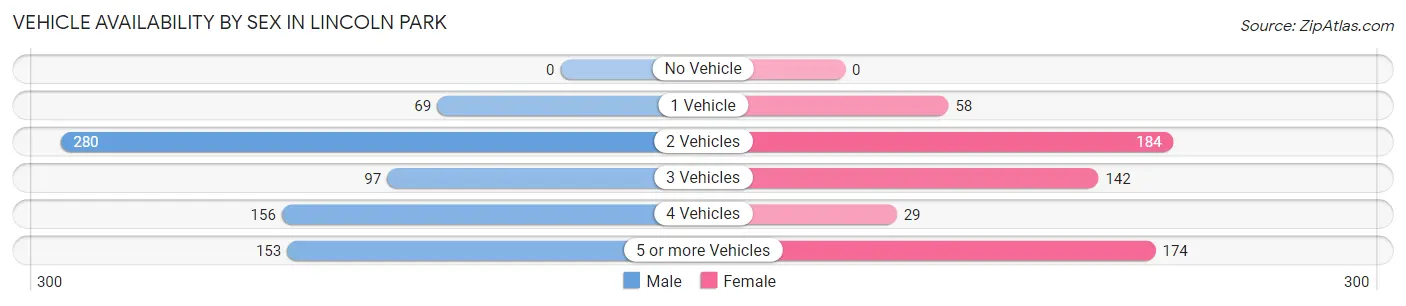
Vehicle Availability by Sex in Lincoln Park
The most prevalent vehicle ownership categories in Lincoln Park are males with 2 vehicles (280, accounting for 37.1%) and females with 2 vehicles (184, making up 47.7%).
| Vehicles Available | Male | Female |
| No Vehicle | 0 (0.0%) | 0 (0.0%) |
| 1 Vehicle | 69 (9.1%) | 58 (9.9%) |
| 2 Vehicles | 280 (37.1%) | 184 (31.4%) |
| 3 Vehicles | 97 (12.9%) | 142 (24.2%) |
| 4 Vehicles | 156 (20.7%) | 29 (4.9%) |
| 5 or more Vehicles | 153 (20.3%) | 174 (29.6%) |
| Total | 755 (100.0%) | 587 (100.0%) |
Commute Time in Lincoln Park
The most frequently occuring commute durations in Lincoln Park are 5 to 9 minutes (313 commuters, 28.8%), 10 to 14 minutes (267 commuters, 24.6%), and 15 to 19 minutes (189 commuters, 17.4%).
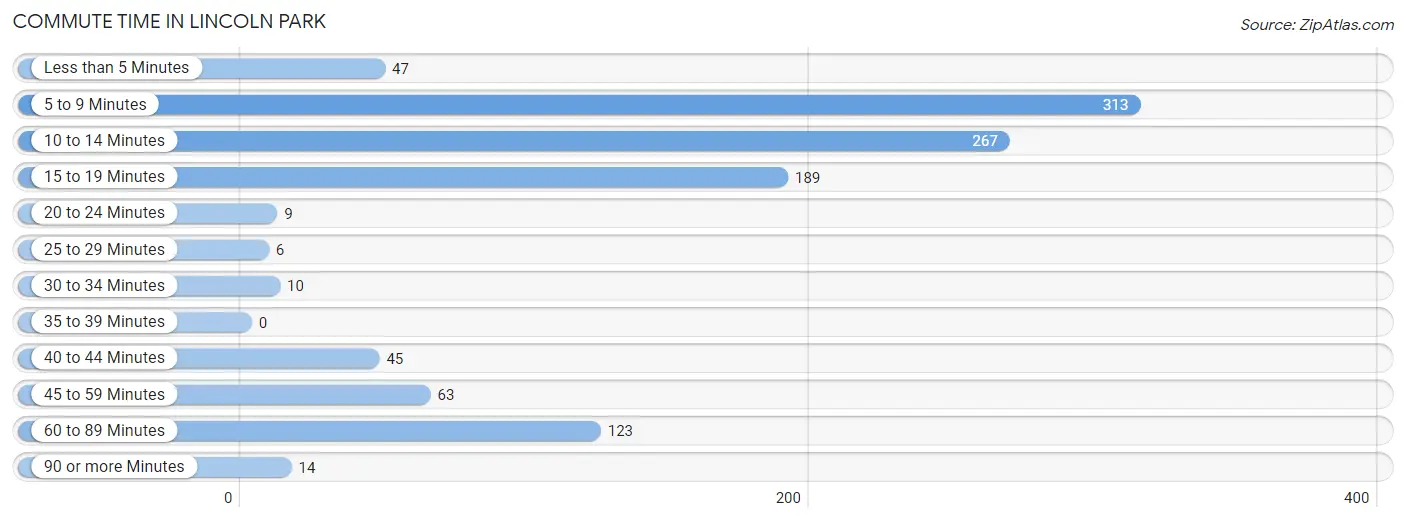
| Commute Time | # Commuters | % Commuters |
| Less than 5 Minutes | 47 | 4.3% |
| 5 to 9 Minutes | 313 | 28.8% |
| 10 to 14 Minutes | 267 | 24.6% |
| 15 to 19 Minutes | 189 | 17.4% |
| 20 to 24 Minutes | 9 | 0.8% |
| 25 to 29 Minutes | 6 | 0.5% |
| 30 to 34 Minutes | 10 | 0.9% |
| 35 to 39 Minutes | 0 | 0.0% |
| 40 to 44 Minutes | 45 | 4.1% |
| 45 to 59 Minutes | 63 | 5.8% |
| 60 to 89 Minutes | 123 | 11.3% |
| 90 or more Minutes | 14 | 1.3% |
Commute Time by Sex in Lincoln Park
The most common commute times in Lincoln Park are 5 to 9 minutes (177 commuters, 30.2%) for males and 10 to 14 minutes (192 commuters, 38.4%) for females.
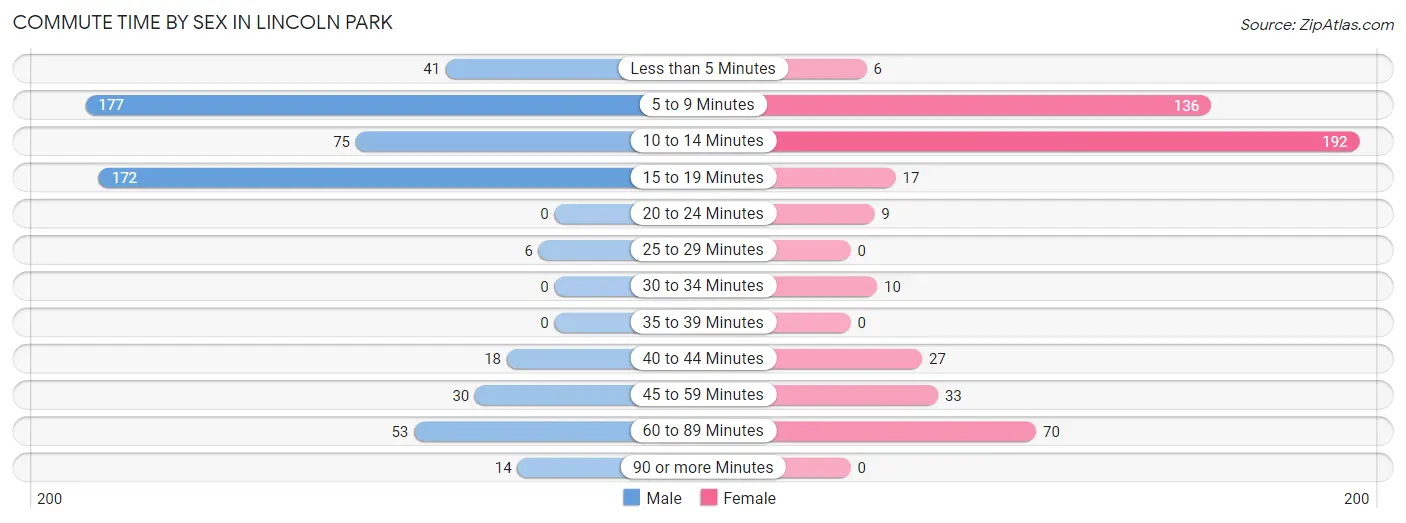
| Commute Time | Male | Female |
| Less than 5 Minutes | 41 (7.0%) | 6 (1.2%) |
| 5 to 9 Minutes | 177 (30.2%) | 136 (27.2%) |
| 10 to 14 Minutes | 75 (12.8%) | 192 (38.4%) |
| 15 to 19 Minutes | 172 (29.3%) | 17 (3.4%) |
| 20 to 24 Minutes | 0 (0.0%) | 9 (1.8%) |
| 25 to 29 Minutes | 6 (1.0%) | 0 (0.0%) |
| 30 to 34 Minutes | 0 (0.0%) | 10 (2.0%) |
| 35 to 39 Minutes | 0 (0.0%) | 0 (0.0%) |
| 40 to 44 Minutes | 18 (3.1%) | 27 (5.4%) |
| 45 to 59 Minutes | 30 (5.1%) | 33 (6.6%) |
| 60 to 89 Minutes | 53 (9.0%) | 70 (14.0%) |
| 90 or more Minutes | 14 (2.4%) | 0 (0.0%) |
Time of Departure to Work by Sex in Lincoln Park
The most frequent times of departure to work in Lincoln Park are 5:30 AM to 5:59 AM (141, 24.1%) for males and 7:30 AM to 7:59 AM (161, 32.2%) for females.
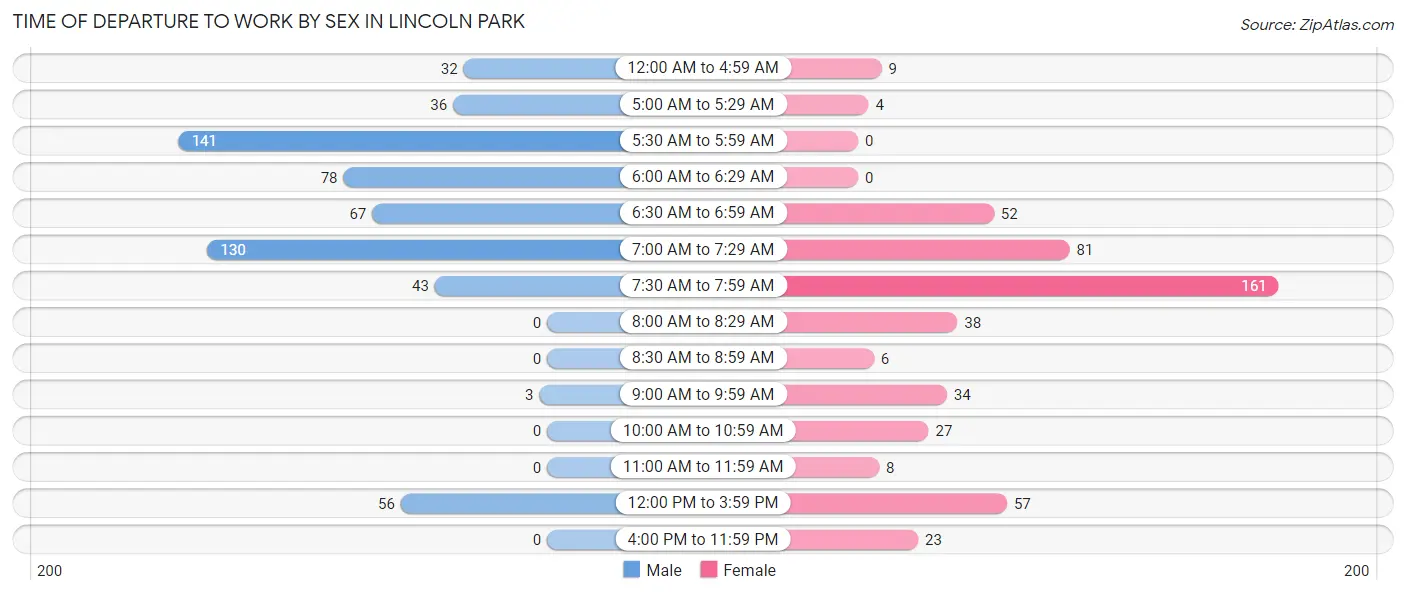
| Time of Departure | Male | Female |
| 12:00 AM to 4:59 AM | 32 (5.5%) | 9 (1.8%) |
| 5:00 AM to 5:29 AM | 36 (6.1%) | 4 (0.8%) |
| 5:30 AM to 5:59 AM | 141 (24.1%) | 0 (0.0%) |
| 6:00 AM to 6:29 AM | 78 (13.3%) | 0 (0.0%) |
| 6:30 AM to 6:59 AM | 67 (11.4%) | 52 (10.4%) |
| 7:00 AM to 7:29 AM | 130 (22.2%) | 81 (16.2%) |
| 7:30 AM to 7:59 AM | 43 (7.3%) | 161 (32.2%) |
| 8:00 AM to 8:29 AM | 0 (0.0%) | 38 (7.6%) |
| 8:30 AM to 8:59 AM | 0 (0.0%) | 6 (1.2%) |
| 9:00 AM to 9:59 AM | 3 (0.5%) | 34 (6.8%) |
| 10:00 AM to 10:59 AM | 0 (0.0%) | 27 (5.4%) |
| 11:00 AM to 11:59 AM | 0 (0.0%) | 8 (1.6%) |
| 12:00 PM to 3:59 PM | 56 (9.6%) | 57 (11.4%) |
| 4:00 PM to 11:59 PM | 0 (0.0%) | 23 (4.6%) |
| Total | 586 (100.0%) | 500 (100.0%) |
Housing Occupancy in Lincoln Park
Occupancy by Ownership in Lincoln Park
Of the total 1,773 dwellings in Lincoln Park, owner-occupied units account for 1,334 (75.2%), while renter-occupied units make up 439 (24.8%).
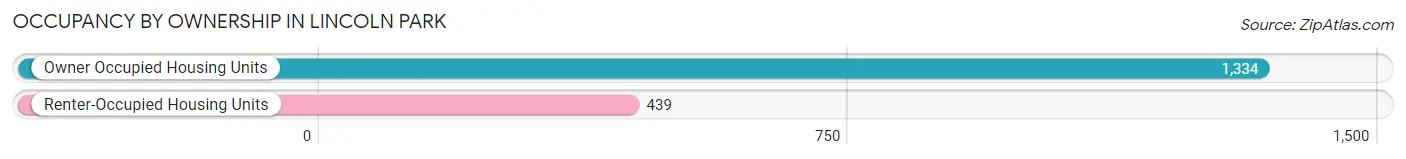
| Occupancy | # Housing Units | % Housing Units |
| Owner Occupied Housing Units | 1,334 | 75.2% |
| Renter-Occupied Housing Units | 439 | 24.8% |
| Total Occupied Housing Units | 1,773 | 100.0% |
Occupancy by Household Size in Lincoln Park
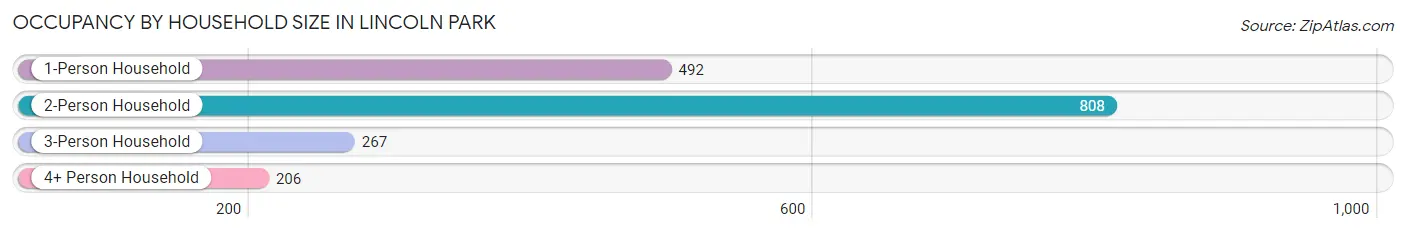
| Household Size | # Housing Units | % Housing Units |
| 1-Person Household | 492 | 27.8% |
| 2-Person Household | 808 | 45.6% |
| 3-Person Household | 267 | 15.1% |
| 4+ Person Household | 206 | 11.6% |
| Total Housing Units | 1,773 | 100.0% |
Occupancy by Ownership by Household Size in Lincoln Park
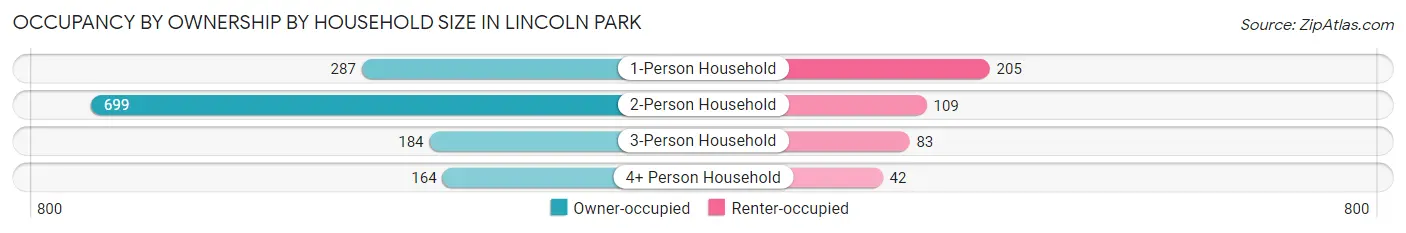
| Household Size | Owner-occupied | Renter-occupied |
| 1-Person Household | 287 (58.3%) | 205 (41.7%) |
| 2-Person Household | 699 (86.5%) | 109 (13.5%) |
| 3-Person Household | 184 (68.9%) | 83 (31.1%) |
| 4+ Person Household | 164 (79.6%) | 42 (20.4%) |
| Total Housing Units | 1,334 (75.2%) | 439 (24.8%) |
Occupancy by Educational Attainment in Lincoln Park
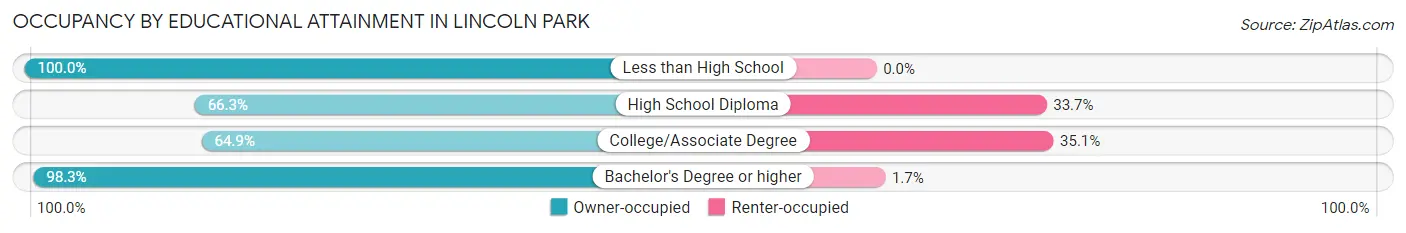
| Household Size | Owner-occupied | Renter-occupied |
| Less than High School | 64 (100.0%) | 0 (0.0%) |
| High School Diploma | 334 (66.3%) | 170 (33.7%) |
| College/Associate Degree | 483 (64.9%) | 261 (35.1%) |
| Bachelor's Degree or higher | 453 (98.3%) | 8 (1.7%) |
Occupancy by Age of Householder in Lincoln Park
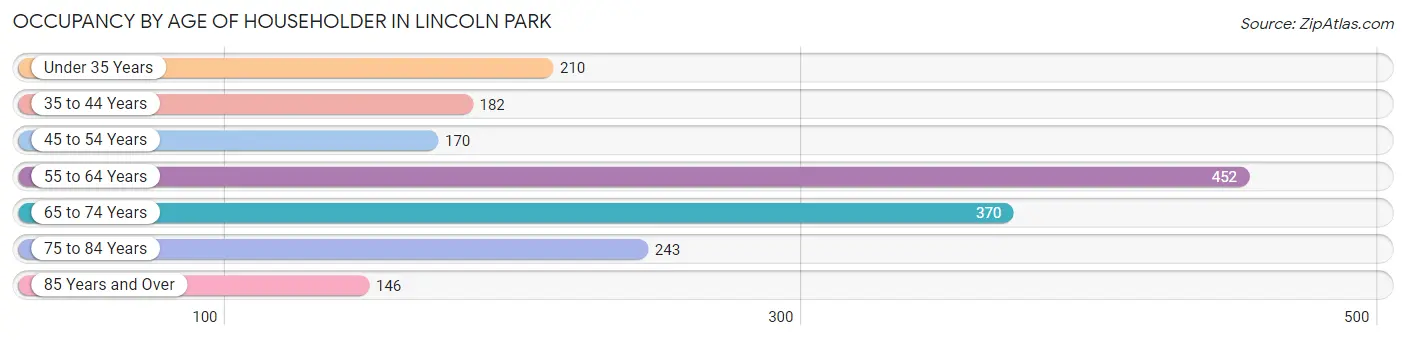
| Age Bracket | # Households | % Households |
| Under 35 Years | 210 | 11.8% |
| 35 to 44 Years | 182 | 10.3% |
| 45 to 54 Years | 170 | 9.6% |
| 55 to 64 Years | 452 | 25.5% |
| 65 to 74 Years | 370 | 20.9% |
| 75 to 84 Years | 243 | 13.7% |
| 85 Years and Over | 146 | 8.2% |
| Total | 1,773 | 100.0% |
Housing Finances in Lincoln Park
Median Income by Occupancy in Lincoln Park
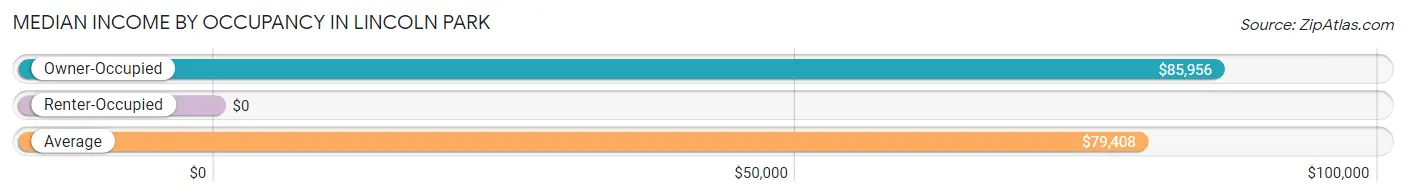
| Occupancy Type | # Households | Median Income |
| Owner-Occupied | 1,334 (75.2%) | $85,956 |
| Renter-Occupied | 439 (24.8%) | $0 |
| Average | 1,773 (100.0%) | $79,408 |
Occupancy by Householder Income Bracket in Lincoln Park
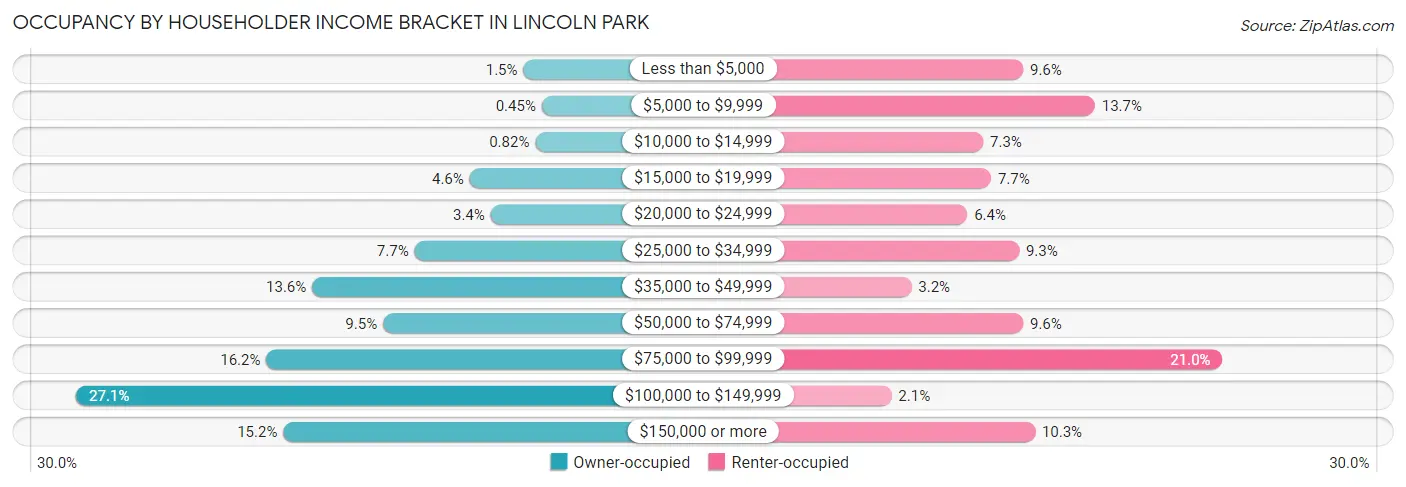
| Income Bracket | Owner-occupied | Renter-occupied |
| Less than $5,000 | 20 (1.5%) | 42 (9.6%) |
| $5,000 to $9,999 | 6 (0.4%) | 60 (13.7%) |
| $10,000 to $14,999 | 11 (0.8%) | 32 (7.3%) |
| $15,000 to $19,999 | 61 (4.6%) | 34 (7.7%) |
| $20,000 to $24,999 | 45 (3.4%) | 28 (6.4%) |
| $25,000 to $34,999 | 103 (7.7%) | 41 (9.3%) |
| $35,000 to $49,999 | 181 (13.6%) | 14 (3.2%) |
| $50,000 to $74,999 | 127 (9.5%) | 42 (9.6%) |
| $75,000 to $99,999 | 216 (16.2%) | 92 (21.0%) |
| $100,000 to $149,999 | 361 (27.1%) | 9 (2.1%) |
| $150,000 or more | 203 (15.2%) | 45 (10.2%) |
| Total | 1,334 (100.0%) | 439 (100.0%) |
Monthly Housing Cost Tiers in Lincoln Park
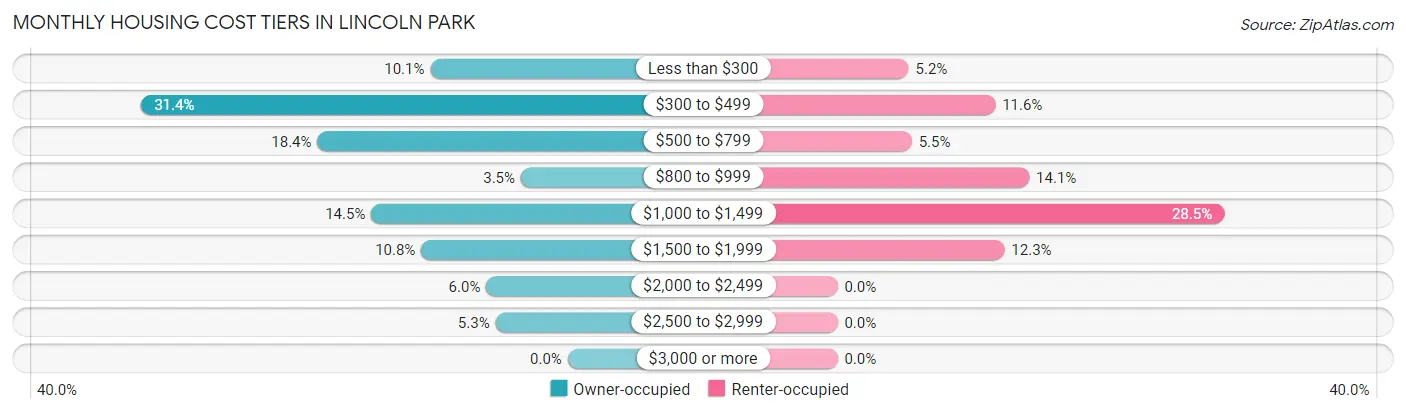
| Monthly Cost | Owner-occupied | Renter-occupied |
| Less than $300 | 135 (10.1%) | 23 (5.2%) |
| $300 to $499 | 419 (31.4%) | 51 (11.6%) |
| $500 to $799 | 246 (18.4%) | 24 (5.5%) |
| $800 to $999 | 46 (3.5%) | 62 (14.1%) |
| $1,000 to $1,499 | 193 (14.5%) | 125 (28.5%) |
| $1,500 to $1,999 | 144 (10.8%) | 54 (12.3%) |
| $2,000 to $2,499 | 80 (6.0%) | 0 (0.0%) |
| $2,500 to $2,999 | 71 (5.3%) | 0 (0.0%) |
| $3,000 or more | 0 (0.0%) | 0 (0.0%) |
| Total | 1,334 (100.0%) | 439 (100.0%) |
Physical Housing Characteristics in Lincoln Park
Housing Structures in Lincoln Park
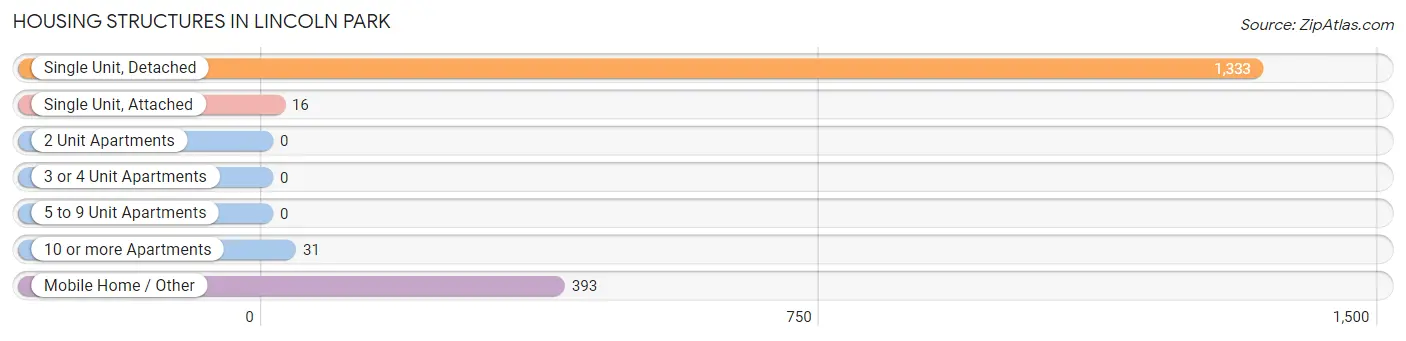
| Structure Type | # Housing Units | % Housing Units |
| Single Unit, Detached | 1,333 | 75.2% |
| Single Unit, Attached | 16 | 0.9% |
| 2 Unit Apartments | 0 | 0.0% |
| 3 or 4 Unit Apartments | 0 | 0.0% |
| 5 to 9 Unit Apartments | 0 | 0.0% |
| 10 or more Apartments | 31 | 1.8% |
| Mobile Home / Other | 393 | 22.2% |
| Total | 1,773 | 100.0% |
Housing Structures by Occupancy in Lincoln Park
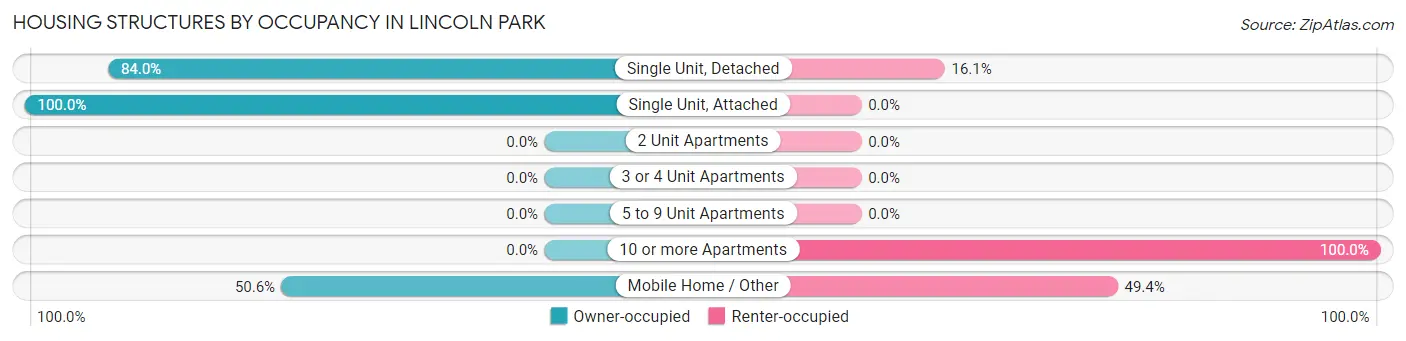
| Structure Type | Owner-occupied | Renter-occupied |
| Single Unit, Detached | 1,119 (84.0%) | 214 (16.1%) |
| Single Unit, Attached | 16 (100.0%) | 0 (0.0%) |
| 2 Unit Apartments | 0 (0.0%) | 0 (0.0%) |
| 3 or 4 Unit Apartments | 0 (0.0%) | 0 (0.0%) |
| 5 to 9 Unit Apartments | 0 (0.0%) | 0 (0.0%) |
| 10 or more Apartments | 0 (0.0%) | 31 (100.0%) |
| Mobile Home / Other | 199 (50.6%) | 194 (49.4%) |
| Total | 1,334 (75.2%) | 439 (24.8%) |
Housing Structures by Number of Rooms in Lincoln Park
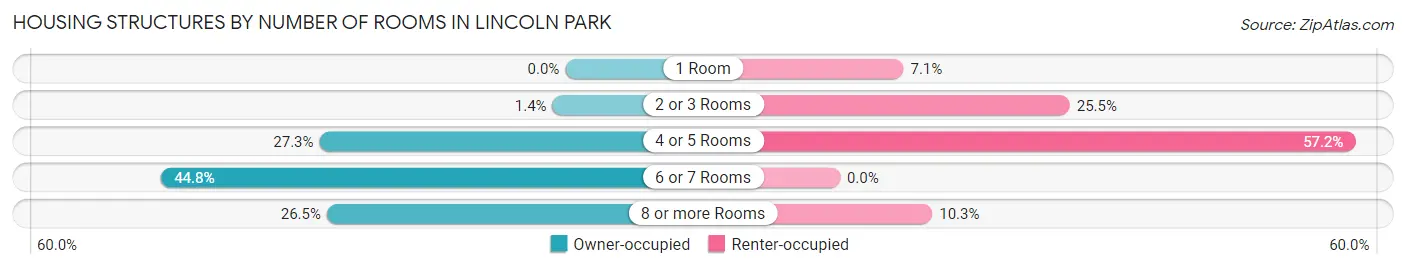
| Number of Rooms | Owner-occupied | Renter-occupied |
| 1 Room | 0 (0.0%) | 31 (7.1%) |
| 2 or 3 Rooms | 19 (1.4%) | 112 (25.5%) |
| 4 or 5 Rooms | 364 (27.3%) | 251 (57.2%) |
| 6 or 7 Rooms | 598 (44.8%) | 0 (0.0%) |
| 8 or more Rooms | 353 (26.5%) | 45 (10.2%) |
| Total | 1,334 (100.0%) | 439 (100.0%) |
Housing Structure by Heating Type in Lincoln Park
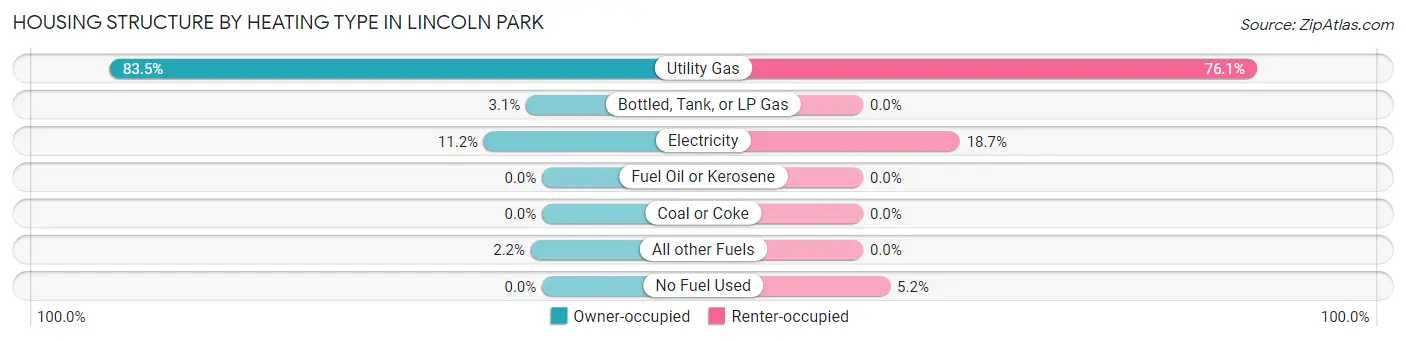
| Heating Type | Owner-occupied | Renter-occupied |
| Utility Gas | 1,114 (83.5%) | 334 (76.1%) |
| Bottled, Tank, or LP Gas | 41 (3.1%) | 0 (0.0%) |
| Electricity | 150 (11.2%) | 82 (18.7%) |
| Fuel Oil or Kerosene | 0 (0.0%) | 0 (0.0%) |
| Coal or Coke | 0 (0.0%) | 0 (0.0%) |
| All other Fuels | 29 (2.2%) | 0 (0.0%) |
| No Fuel Used | 0 (0.0%) | 23 (5.2%) |
| Total | 1,334 (100.0%) | 439 (100.0%) |
Household Vehicle Usage in Lincoln Park
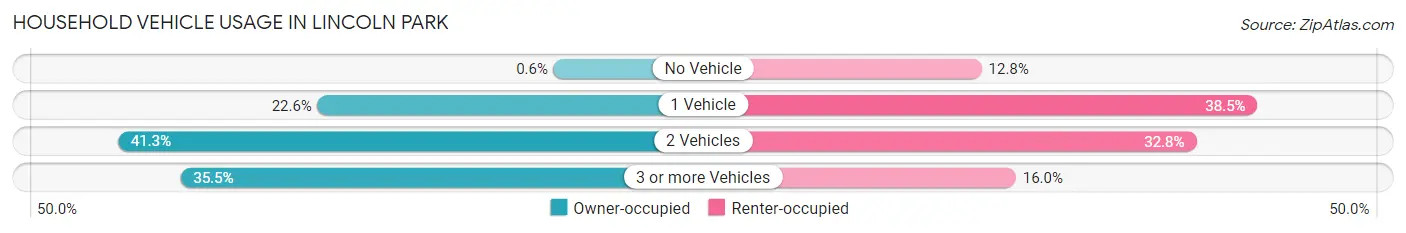
| Vehicles per Household | Owner-occupied | Renter-occupied |
| No Vehicle | 8 (0.6%) | 56 (12.8%) |
| 1 Vehicle | 302 (22.6%) | 169 (38.5%) |
| 2 Vehicles | 551 (41.3%) | 144 (32.8%) |
| 3 or more Vehicles | 473 (35.5%) | 70 (16.0%) |
| Total | 1,334 (100.0%) | 439 (100.0%) |
Real Estate & Mortgages in Lincoln Park
Real Estate and Mortgage Overview in Lincoln Park
| Characteristic | Without Mortgage | With Mortgage |
| Housing Units | 709 | 625 |
| Median Property Value | $220,500 | $304,600 |
| Median Household Income | $57,679 | $144 |
| Monthly Housing Costs | $403 | $0 |
| Real Estate Taxes | $949 | $0 |
Property Value by Mortgage Status in Lincoln Park
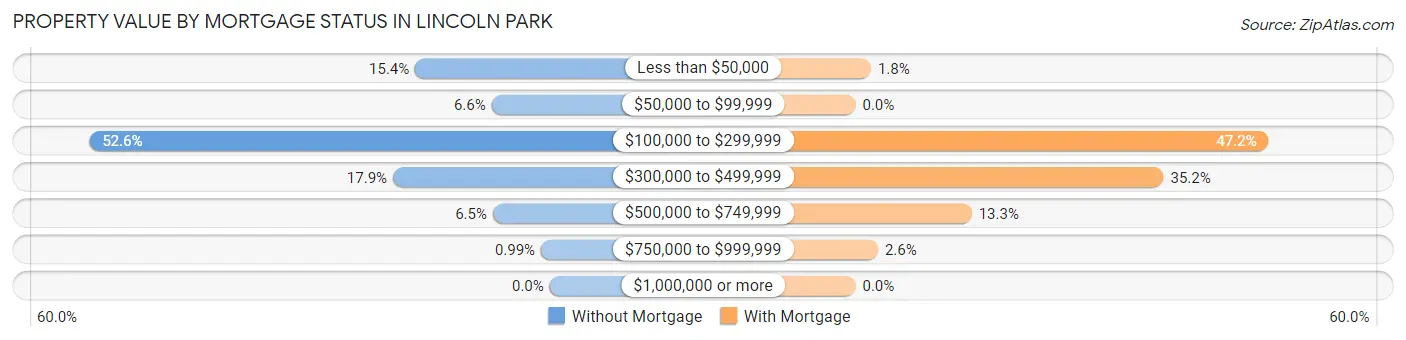
| Property Value | Without Mortgage | With Mortgage |
| Less than $50,000 | 109 (15.4%) | 11 (1.8%) |
| $50,000 to $99,999 | 47 (6.6%) | 0 (0.0%) |
| $100,000 to $299,999 | 373 (52.6%) | 295 (47.2%) |
| $300,000 to $499,999 | 127 (17.9%) | 220 (35.2%) |
| $500,000 to $749,999 | 46 (6.5%) | 83 (13.3%) |
| $750,000 to $999,999 | 7 (1.0%) | 16 (2.6%) |
| $1,000,000 or more | 0 (0.0%) | 0 (0.0%) |
| Total | 709 (100.0%) | 625 (100.0%) |
Household Income by Mortgage Status in Lincoln Park
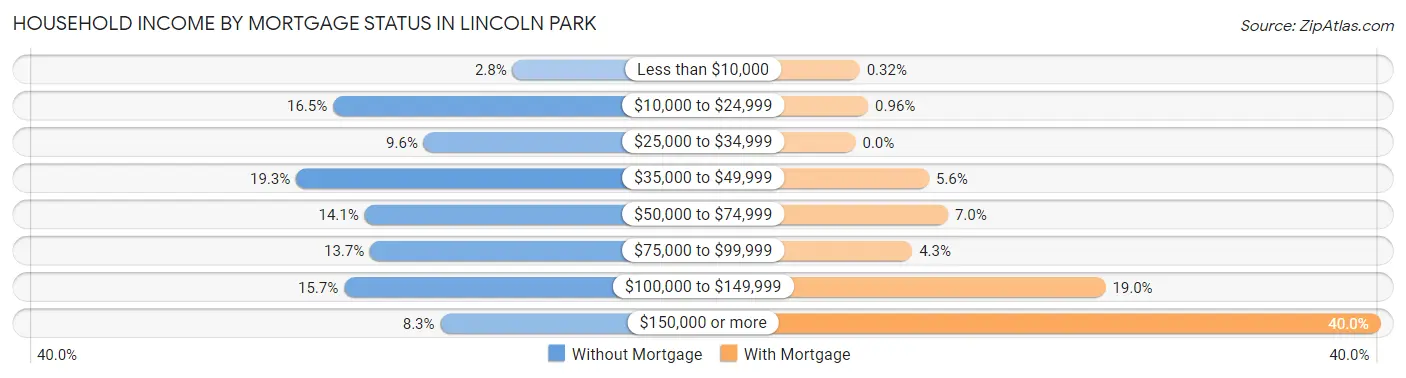
| Household Income | Without Mortgage | With Mortgage |
| Less than $10,000 | 20 (2.8%) | 2 (0.3%) |
| $10,000 to $24,999 | 117 (16.5%) | 6 (1.0%) |
| $25,000 to $34,999 | 68 (9.6%) | 0 (0.0%) |
| $35,000 to $49,999 | 137 (19.3%) | 35 (5.6%) |
| $50,000 to $74,999 | 100 (14.1%) | 44 (7.0%) |
| $75,000 to $99,999 | 97 (13.7%) | 27 (4.3%) |
| $100,000 to $149,999 | 111 (15.7%) | 119 (19.0%) |
| $150,000 or more | 59 (8.3%) | 250 (40.0%) |
| Total | 709 (100.0%) | 625 (100.0%) |
Property Value to Household Income Ratio in Lincoln Park
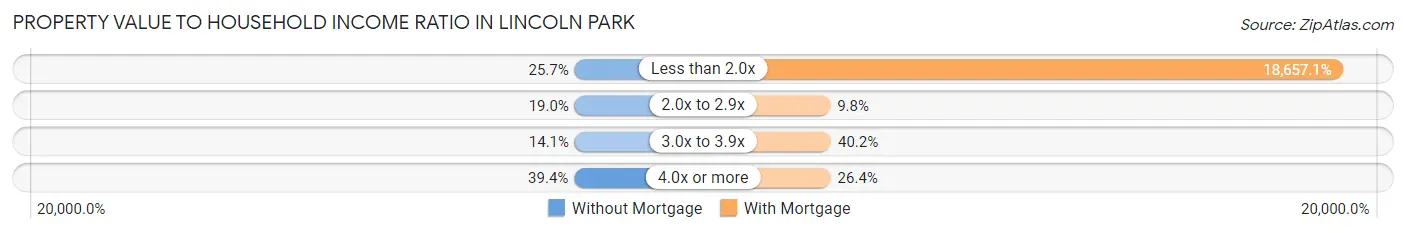
| Value-to-Income Ratio | Without Mortgage | With Mortgage |
| Less than 2.0x | 182 (25.7%) | 116,607 (18,657.1%) |
| 2.0x to 2.9x | 135 (19.0%) | 61 (9.8%) |
| 3.0x to 3.9x | 100 (14.1%) | 251 (40.2%) |
| 4.0x or more | 279 (39.4%) | 165 (26.4%) |
| Total | 709 (100.0%) | 625 (100.0%) |
Real Estate Taxes by Mortgage Status in Lincoln Park
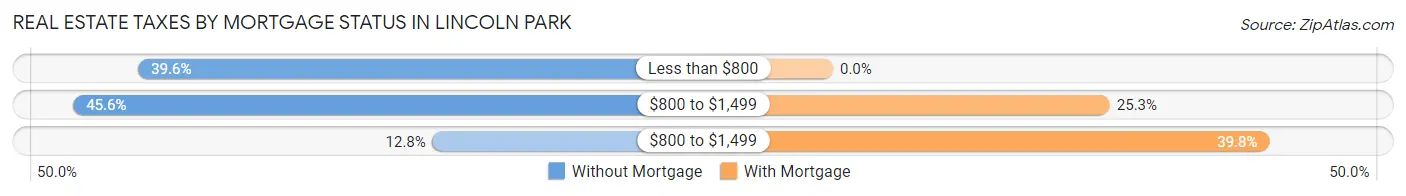
| Property Taxes | Without Mortgage | With Mortgage |
| Less than $800 | 281 (39.6%) | 0 (0.0%) |
| $800 to $1,499 | 323 (45.6%) | 158 (25.3%) |
| $800 to $1,499 | 91 (12.8%) | 249 (39.8%) |
| Total | 709 (100.0%) | 625 (100.0%) |
Health & Disability in Lincoln Park
Health Insurance Coverage by Age in Lincoln Park
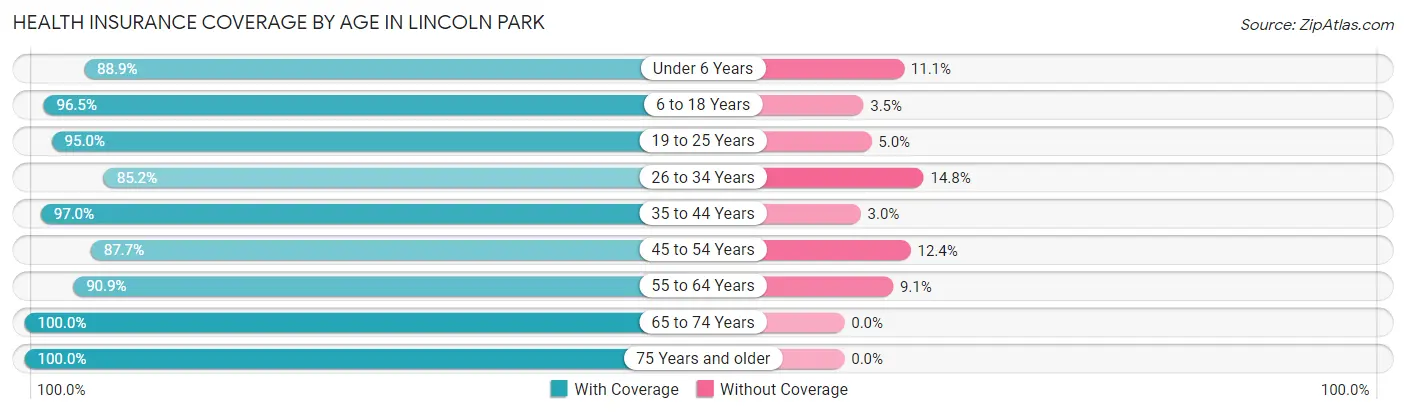
| Age Bracket | With Coverage | Without Coverage |
| Under 6 Years | 144 (88.9%) | 18 (11.1%) |
| 6 to 18 Years | 545 (96.5%) | 20 (3.5%) |
| 19 to 25 Years | 245 (95.0%) | 13 (5.0%) |
| 26 to 34 Years | 519 (85.2%) | 90 (14.8%) |
| 35 to 44 Years | 415 (97.0%) | 13 (3.0%) |
| 45 to 54 Years | 362 (87.6%) | 51 (12.3%) |
| 55 to 64 Years | 662 (90.9%) | 66 (9.1%) |
| 65 to 74 Years | 698 (100.0%) | 0 (0.0%) |
| 75 Years and older | 537 (100.0%) | 0 (0.0%) |
| Total | 4,127 (93.8%) | 271 (6.2%) |
Health Insurance Coverage by Citizenship Status in Lincoln Park
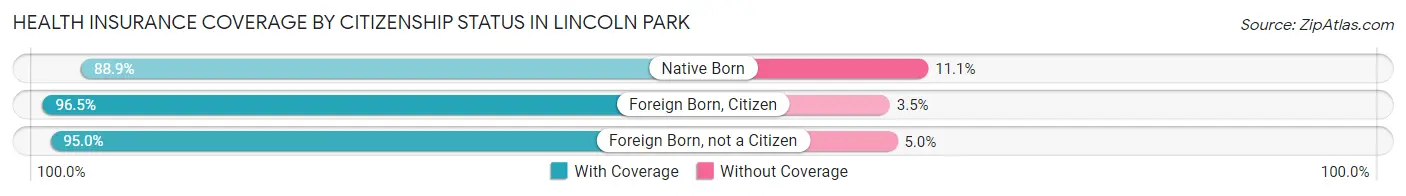
| Citizenship Status | With Coverage | Without Coverage |
| Native Born | 144 (88.9%) | 18 (11.1%) |
| Foreign Born, Citizen | 545 (96.5%) | 20 (3.5%) |
| Foreign Born, not a Citizen | 245 (95.0%) | 13 (5.0%) |
Health Insurance Coverage by Household Income in Lincoln Park
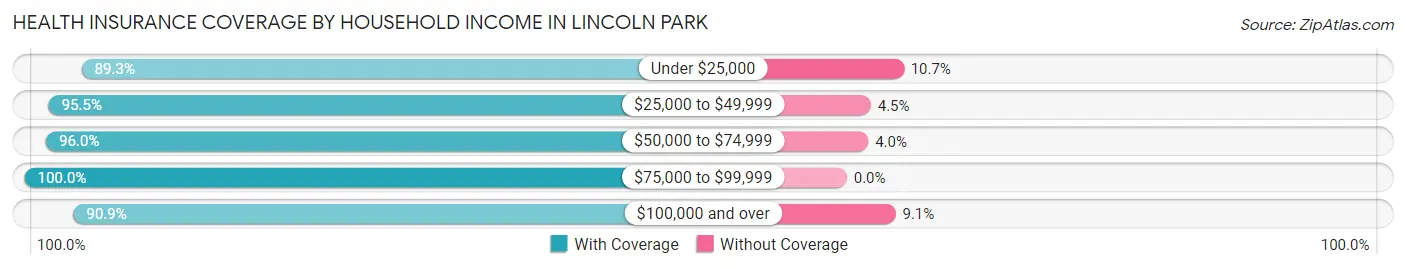
| Household Income | With Coverage | Without Coverage |
| Under $25,000 | 511 (89.3%) | 61 (10.7%) |
| $25,000 to $49,999 | 552 (95.5%) | 26 (4.5%) |
| $50,000 to $74,999 | 406 (96.0%) | 17 (4.0%) |
| $75,000 to $99,999 | 976 (100.0%) | 0 (0.0%) |
| $100,000 and over | 1,663 (90.9%) | 167 (9.1%) |
Public vs Private Health Insurance Coverage by Age in Lincoln Park
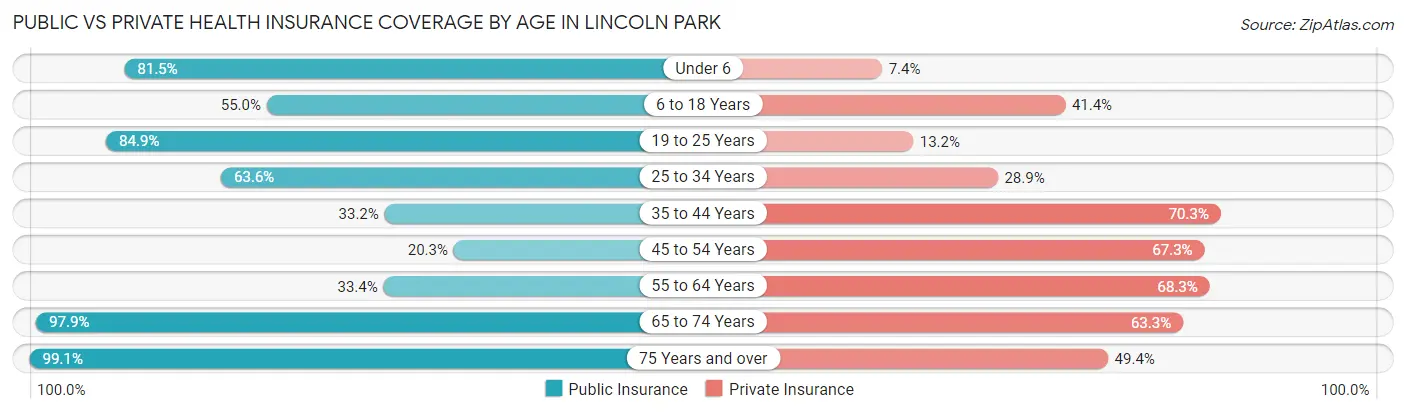
| Age Bracket | Public Insurance | Private Insurance |
| Under 6 | 132 (81.5%) | 12 (7.4%) |
| 6 to 18 Years | 311 (55.0%) | 234 (41.4%) |
| 19 to 25 Years | 219 (84.9%) | 34 (13.2%) |
| 25 to 34 Years | 387 (63.5%) | 176 (28.9%) |
| 35 to 44 Years | 142 (33.2%) | 301 (70.3%) |
| 45 to 54 Years | 84 (20.3%) | 278 (67.3%) |
| 55 to 64 Years | 243 (33.4%) | 497 (68.3%) |
| 65 to 74 Years | 683 (97.9%) | 442 (63.3%) |
| 75 Years and over | 532 (99.1%) | 265 (49.3%) |
| Total | 2,733 (62.1%) | 2,239 (50.9%) |
Disability Status by Sex by Age in Lincoln Park
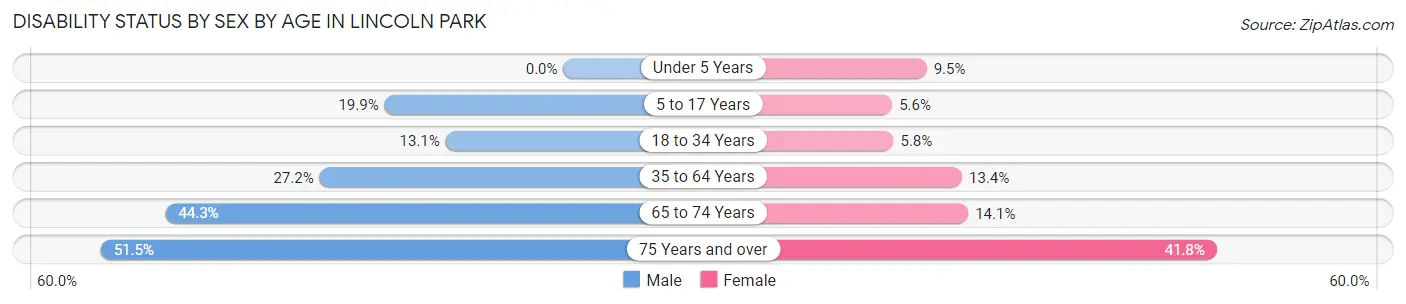
| Age Bracket | Male | Female |
| Under 5 Years | 0 (0.0%) | 7 (9.5%) |
| 5 to 17 Years | 48 (19.9%) | 18 (5.6%) |
| 18 to 34 Years | 83 (13.1%) | 16 (5.8%) |
| 35 to 64 Years | 195 (27.2%) | 114 (13.4%) |
| 65 to 74 Years | 152 (44.3%) | 50 (14.1%) |
| 75 Years and over | 136 (51.5%) | 114 (41.8%) |
Disability Class by Sex by Age in Lincoln Park
Disability Class: Hearing Difficulty
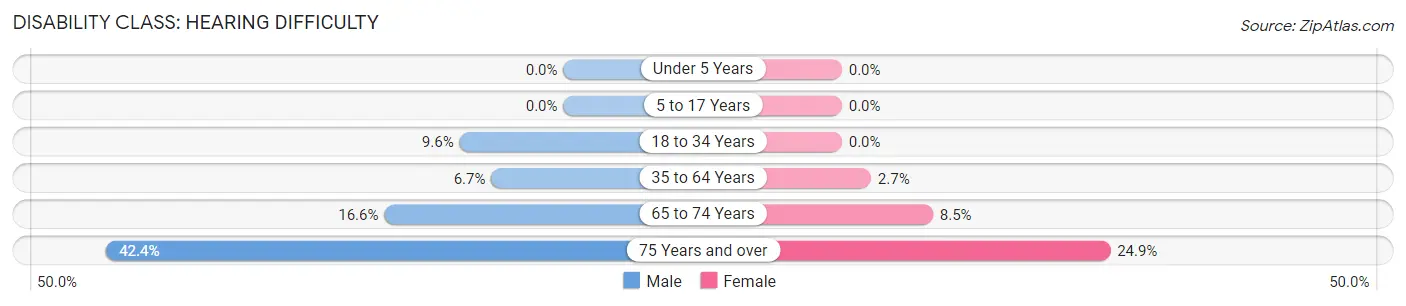
| Age Bracket | Male | Female |
| Under 5 Years | 0 (0.0%) | 0 (0.0%) |
| 5 to 17 Years | 0 (0.0%) | 0 (0.0%) |
| 18 to 34 Years | 61 (9.6%) | 0 (0.0%) |
| 35 to 64 Years | 48 (6.7%) | 23 (2.7%) |
| 65 to 74 Years | 57 (16.6%) | 30 (8.5%) |
| 75 Years and over | 112 (42.4%) | 68 (24.9%) |
Disability Class: Vision Difficulty
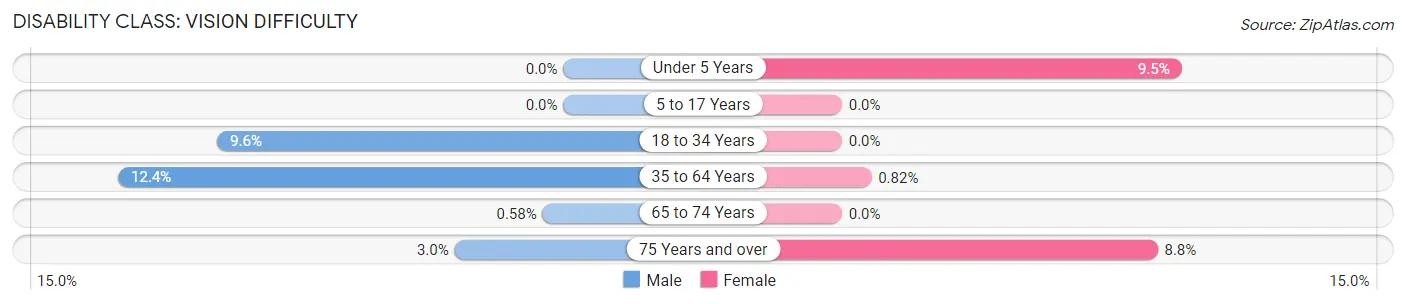
| Age Bracket | Male | Female |
| Under 5 Years | 0 (0.0%) | 7 (9.5%) |
| 5 to 17 Years | 0 (0.0%) | 0 (0.0%) |
| 18 to 34 Years | 61 (9.6%) | 0 (0.0%) |
| 35 to 64 Years | 89 (12.4%) | 7 (0.8%) |
| 65 to 74 Years | 2 (0.6%) | 0 (0.0%) |
| 75 Years and over | 8 (3.0%) | 24 (8.8%) |
Disability Class: Cognitive Difficulty
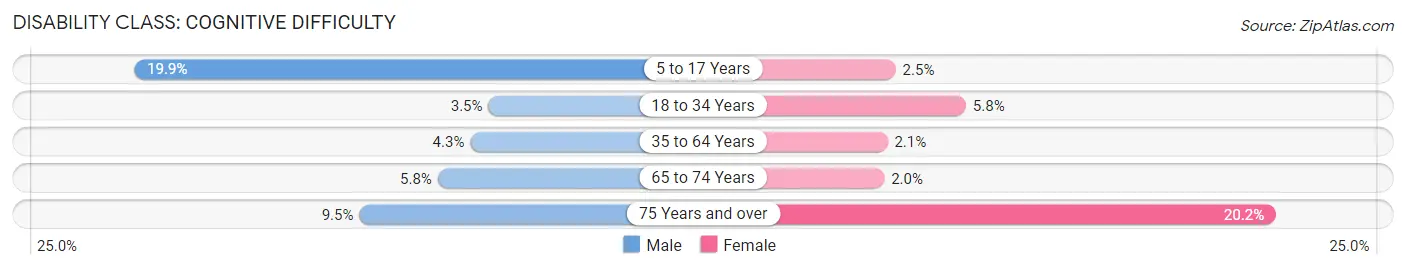
| Age Bracket | Male | Female |
| 5 to 17 Years | 48 (19.9%) | 8 (2.5%) |
| 18 to 34 Years | 22 (3.5%) | 16 (5.8%) |
| 35 to 64 Years | 31 (4.3%) | 18 (2.1%) |
| 65 to 74 Years | 20 (5.8%) | 7 (2.0%) |
| 75 Years and over | 25 (9.5%) | 55 (20.2%) |
Disability Class: Ambulatory Difficulty
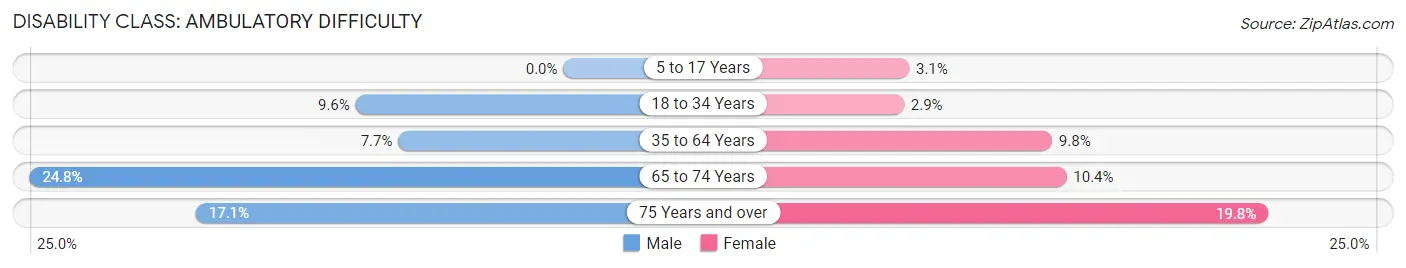
| Age Bracket | Male | Female |
| 5 to 17 Years | 0 (0.0%) | 10 (3.1%) |
| 18 to 34 Years | 61 (9.6%) | 8 (2.9%) |
| 35 to 64 Years | 55 (7.7%) | 83 (9.8%) |
| 65 to 74 Years | 85 (24.8%) | 37 (10.4%) |
| 75 Years and over | 45 (17.1%) | 54 (19.8%) |
Disability Class: Self-Care Difficulty
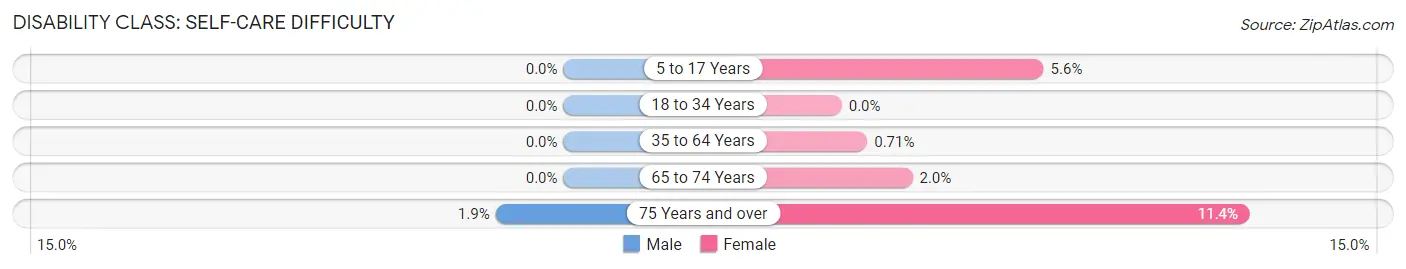
| Age Bracket | Male | Female |
| 5 to 17 Years | 0 (0.0%) | 18 (5.6%) |
| 18 to 34 Years | 0 (0.0%) | 0 (0.0%) |
| 35 to 64 Years | 0 (0.0%) | 6 (0.7%) |
| 65 to 74 Years | 0 (0.0%) | 7 (2.0%) |
| 75 Years and over | 5 (1.9%) | 31 (11.4%) |
Technology Access in Lincoln Park
Computing Device Access in Lincoln Park
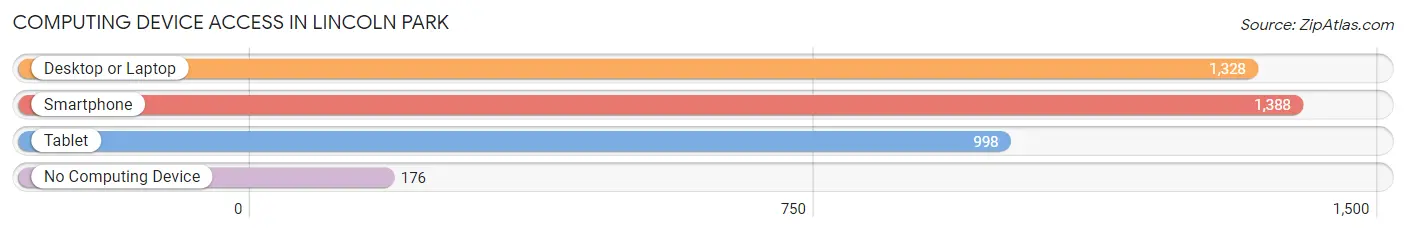
| Device Type | # Households | % Households |
| Desktop or Laptop | 1,328 | 74.9% |
| Smartphone | 1,388 | 78.3% |
| Tablet | 998 | 56.3% |
| No Computing Device | 176 | 9.9% |
| Total | 1,773 | 100.0% |
Internet Access in Lincoln Park
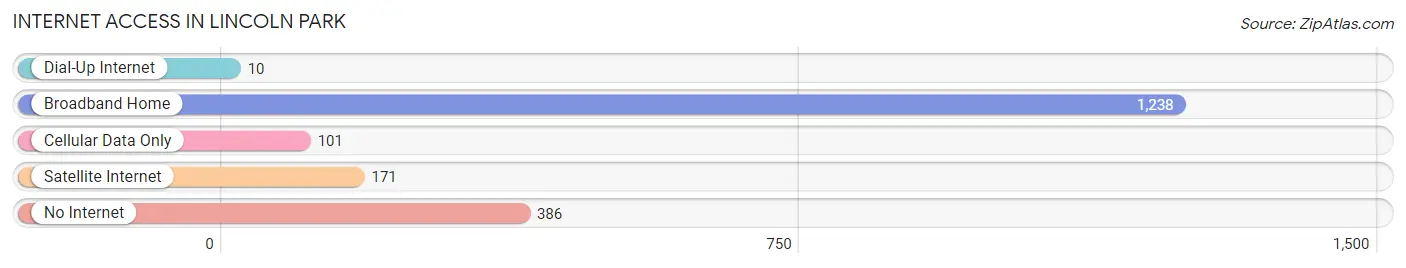
| Internet Type | # Households | % Households |
| Dial-Up Internet | 10 | 0.6% |
| Broadband Home | 1,238 | 69.8% |
| Cellular Data Only | 101 | 5.7% |
| Satellite Internet | 171 | 9.6% |
| No Internet | 386 | 21.8% |
| Total | 1,773 | 100.0% |
Lincoln Park Summary
Lincoln Park is a small town located in the San Luis Valley in south-central Colorado. It is situated at the base of the Sangre de Cristo Mountains, and is surrounded by the Rio Grande National Forest. The town is home to a population of approximately 1,000 people, and is known for its rural charm and outdoor recreation opportunities.
History
Lincoln Park was founded in 1876 by a group of settlers from the nearby town of Saguache. The town was named after Abraham Lincoln, the 16th President of the United States. The settlers were attracted to the area due to its fertile soil and abundant water supply. The town quickly grew, and by the early 1900s, it had become a bustling agricultural center.
In the 1920s, the town began to experience a decline in population as many of its residents moved away in search of better economic opportunities. This trend continued until the 1950s, when the town began to experience a resurgence in population growth. This was due in part to the construction of the nearby San Luis Valley Regional Airport, which provided the town with a much-needed economic boost.
Geography
Lincoln Park is located in the San Luis Valley, which is a large intermontane basin located in south-central Colorado. The valley is surrounded by the Sangre de Cristo Mountains to the east, the San Juan Mountains to the west, and the San Juan National Forest to the north. The town is situated at an elevation of 7,800 feet, and is located approximately 30 miles south of Alamosa and 60 miles north of Taos, New Mexico.
The climate in Lincoln Park is semi-arid, with hot summers and cold winters. The average annual temperature is approximately 50 degrees Fahrenheit, and the average annual precipitation is approximately 12 inches.
Economy
The economy of Lincoln Park is largely based on agriculture and tourism. The town is home to several farms and ranches, which produce a variety of crops, including potatoes, alfalfa, and hay. The town is also home to several tourist attractions, including the San Luis Valley Museum, the Lincoln Park Historical Society, and the Rio Grande National Forest.
In addition to agriculture and tourism, the town is also home to several small businesses, including restaurants, retail stores, and service providers. The town is also home to a branch of the San Luis Valley Federal Bank, which provides banking services to the local community.
Demographics
As of the 2010 census, the population of Lincoln Park was 1,000. The racial makeup of the town was 95.2% White, 0.7% African American, 0.7% Native American, 0.7% Asian, 0.7% from other races, and 2.1% from two or more races. Hispanic or Latino of any race were 4.7% of the population.
The median household income in Lincoln Park was $37,500, and the median family income was $41,250. The per capita income for the town was $17,500. Approximately 15.7% of the population was below the poverty line.
Conclusion
Lincoln Park is a small town located in the San Luis Valley in south-central Colorado. It is home to a population of approximately 1,000 people, and is known for its rural charm and outdoor recreation opportunities. The town's economy is largely based on agriculture and tourism, and it is home to several small businesses, including restaurants, retail stores, and service providers. The town is also home to a branch of the San Luis Valley Federal Bank, which provides banking services to the local community.
Common Questions
What is Per Capita Income in Lincoln Park?
Per Capita income in Lincoln Park is $31,565.
What is the Median Family Income in Lincoln Park?
Median Family Income in Lincoln Park is $93,155.
What is the Median Household income in Lincoln Park?
Median Household Income in Lincoln Park is $79,408.
What is Income or Wage Gap in Lincoln Park?
Income or Wage Gap in Lincoln Park is 42.9%.
Women in Lincoln Park earn 57.1 cents for every dollar earned by a man.
What is Inequality or Gini Index in Lincoln Park?
Inequality or Gini Index in Lincoln Park is 0.40.
What is the Total Population of Lincoln Park?
Total Population of Lincoln Park is 4,413.
What is the Total Male Population of Lincoln Park?
Total Male Population of Lincoln Park is 2,250.
What is the Total Female Population of Lincoln Park?
Total Female Population of Lincoln Park is 2,163.
What is the Ratio of Males per 100 Females in Lincoln Park?
There are 104.02 Males per 100 Females in Lincoln Park.
What is the Ratio of Females per 100 Males in Lincoln Park?
There are 96.13 Females per 100 Males in Lincoln Park.
What is the Median Population Age in Lincoln Park?
Median Population Age in Lincoln Park is 47.8 Years.
What is the Average Family Size in Lincoln Park
Average Family Size in Lincoln Park is 3.1 People.
What is the Average Household Size in Lincoln Park
Average Household Size in Lincoln Park is 2.5 People.
How Large is the Labor Force in Lincoln Park?
There are 1,554 People in the Labor Forcein in Lincoln Park.
What is the Percentage of People in the Labor Force in Lincoln Park?
40.9% of People are in the Labor Force in Lincoln Park.
What is the Unemployment Rate in Lincoln Park?
Unemployment Rate in Lincoln Park is 5.9%.