Idaho Springs, CO Map & Demographics
Idaho Springs Map
Idaho Springs Overview
$37,390
PER CAPITA INCOME
$105,938
AVG FAMILY INCOME
$72,101
AVG HOUSEHOLD INCOME
30.1%
WAGE / INCOME GAP [ % ]
69.9¢/ $1
WAGE / INCOME GAP [ $ ]
0.40
INEQUALITY / GINI INDEX
2,113
TOTAL POPULATION
986
MALE POPULATION
1,127
FEMALE POPULATION
87.49
MALES / 100 FEMALES
114.30
FEMALES / 100 MALES
40.3
MEDIAN AGE
2.7
AVG FAMILY SIZE
2.4
AVG HOUSEHOLD SIZE
1,391
LABOR FORCE [ PEOPLE ]
73.0%
PERCENT IN LABOR FORCE
6.8%
UNEMPLOYMENT RATE
Idaho Springs Zip Codes
Income in Idaho Springs
Income Overview in Idaho Springs
Per Capita Income in Idaho Springs is $37,390, while median incomes of families and households are $105,938 and $72,101 respectively.
| Characteristic | Number | Measure |
| Per Capita Income | 2,113 | $37,390 |
| Median Family Income | 560 | $105,938 |
| Mean Family Income | 560 | $114,163 |
| Median Household Income | 883 | $72,101 |
| Mean Household Income | 883 | $94,247 |
| Income Deficit | 560 | $0 |
| Wage / Income Gap (%) | 2,113 | 30.14% |
| Wage / Income Gap ($) | 2,113 | 69.86¢ per $1 |
| Gini / Inequality Index | 2,113 | 0.40 |
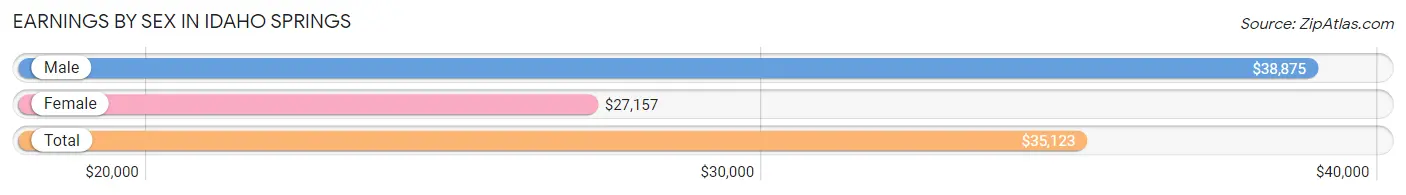
Earnings by Sex in Idaho Springs
Average Earnings in Idaho Springs are $35,123, $38,875 for men and $27,157 for women, a difference of 30.1%.
| Sex | Number | Average Earnings |
| Male | 721 (49.1%) | $38,875 |
| Female | 746 (50.8%) | $27,157 |
| Total | 1,467 (100.0%) | $35,123 |
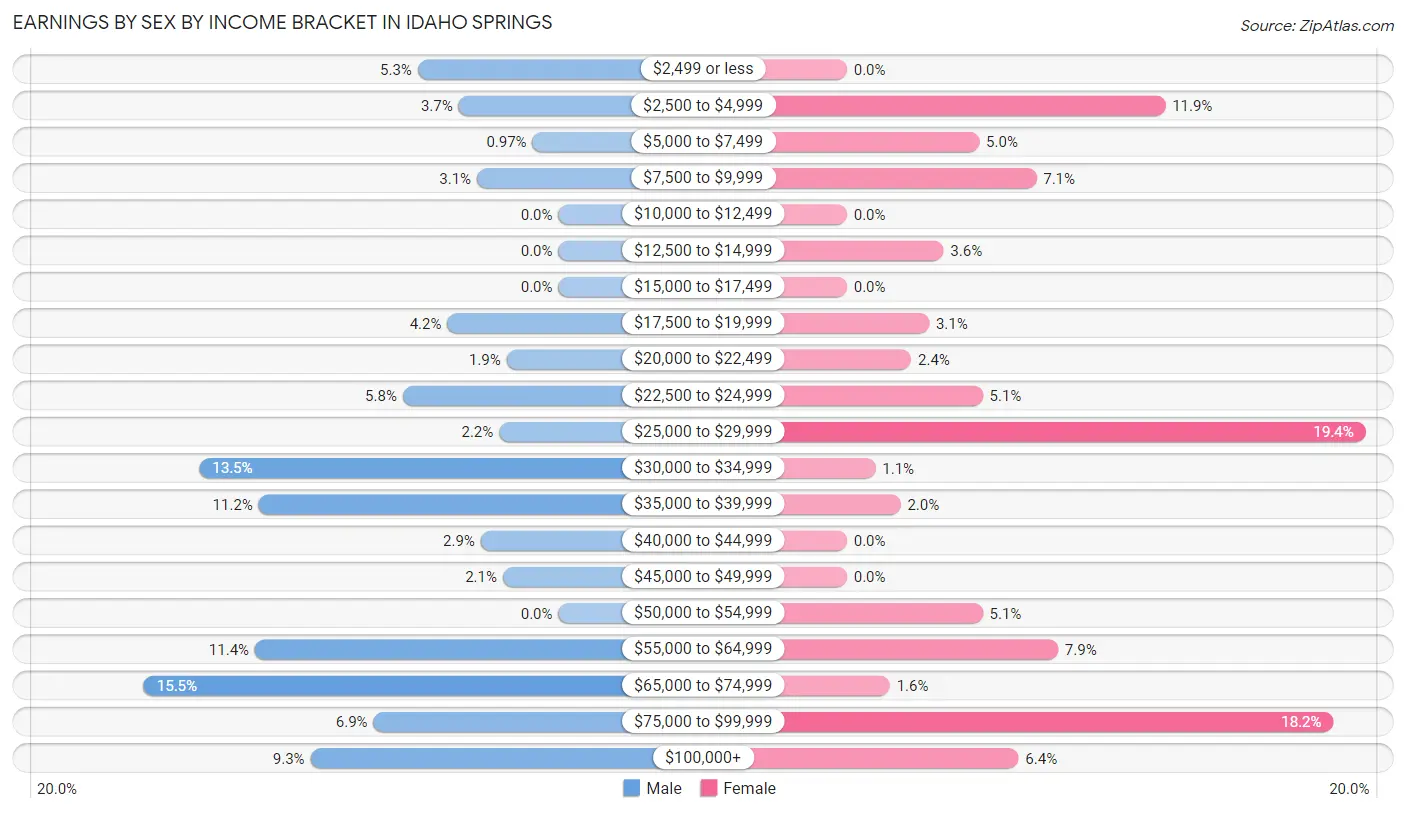
Earnings by Sex by Income Bracket in Idaho Springs
The most common earnings brackets in Idaho Springs are $65,000 to $74,999 for men (112 | 15.5%) and $25,000 to $29,999 for women (145 | 19.4%).
| Income | Male | Female |
| $2,499 or less | 38 (5.3%) | 0 (0.0%) |
| $2,500 to $4,999 | 27 (3.7%) | 89 (11.9%) |
| $5,000 to $7,499 | 7 (1.0%) | 37 (5.0%) |
| $7,500 to $9,999 | 22 (3.0%) | 53 (7.1%) |
| $10,000 to $12,499 | 0 (0.0%) | 0 (0.0%) |
| $12,500 to $14,999 | 0 (0.0%) | 27 (3.6%) |
| $15,000 to $17,499 | 0 (0.0%) | 0 (0.0%) |
| $17,500 to $19,999 | 30 (4.2%) | 23 (3.1%) |
| $20,000 to $22,499 | 14 (1.9%) | 18 (2.4%) |
| $22,500 to $24,999 | 42 (5.8%) | 38 (5.1%) |
| $25,000 to $29,999 | 16 (2.2%) | 145 (19.4%) |
| $30,000 to $34,999 | 97 (13.5%) | 8 (1.1%) |
| $35,000 to $39,999 | 81 (11.2%) | 15 (2.0%) |
| $40,000 to $44,999 | 21 (2.9%) | 0 (0.0%) |
| $45,000 to $49,999 | 15 (2.1%) | 0 (0.0%) |
| $50,000 to $54,999 | 0 (0.0%) | 38 (5.1%) |
| $55,000 to $64,999 | 82 (11.4%) | 59 (7.9%) |
| $65,000 to $74,999 | 112 (15.5%) | 12 (1.6%) |
| $75,000 to $99,999 | 50 (6.9%) | 136 (18.2%) |
| $100,000+ | 67 (9.3%) | 48 (6.4%) |
| Total | 721 (100.0%) | 746 (100.0%) |
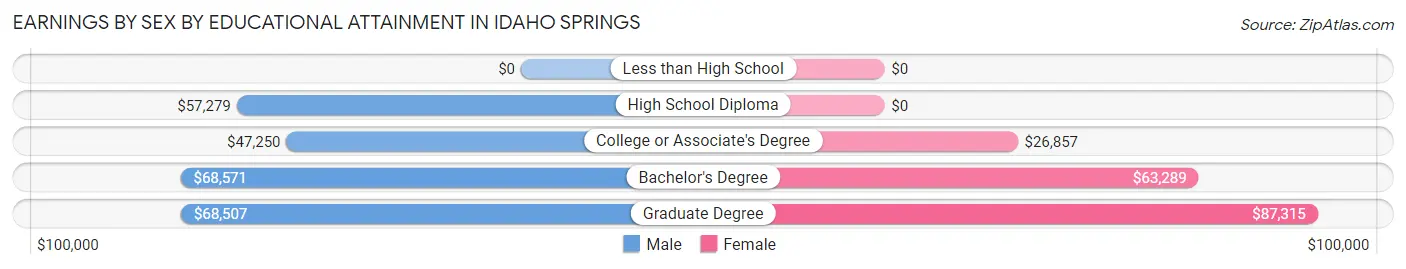
Earnings by Sex by Educational Attainment in Idaho Springs
Average earnings in Idaho Springs are $63,173 for men and $39,250 for women, a difference of 37.9%. Men with an educational attainment of bachelor's degree enjoy the highest average annual earnings of $68,571, while those with college or associate's degree education earn the least with $47,250. Women with an educational attainment of graduate degree earn the most with the average annual earnings of $87,315, while those with college or associate's degree education have the smallest earnings of $26,857.
| Educational Attainment | Male Income | Female Income |
| Less than High School | - | - |
| High School Diploma | $57,279 | $0 |
| College or Associate's Degree | $47,250 | $26,857 |
| Bachelor's Degree | $68,571 | $63,289 |
| Graduate Degree | $68,507 | $87,315 |
| Total | $63,173 | $39,250 |
Family Income in Idaho Springs
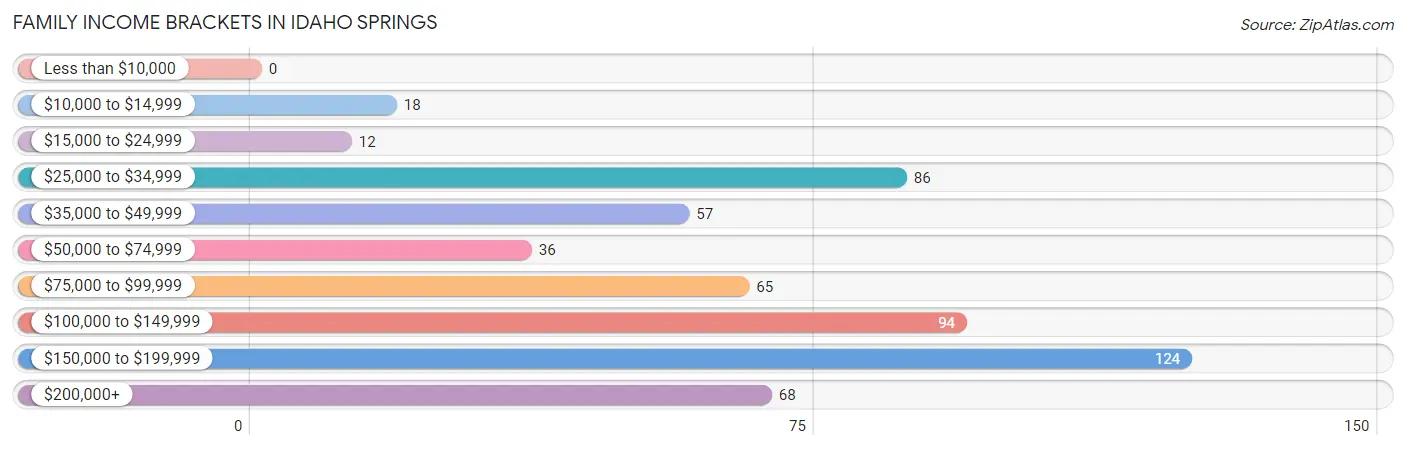
Family Income Brackets in Idaho Springs
According to the Idaho Springs family income data, there are 124 families falling into the $150,000 to $199,999 income range, which is the most common income bracket and makes up 22.1% of all families.
| Income Bracket | # Families | % Families |
| Less than $10,000 | 0 | 0.0% |
| $10,000 to $14,999 | 18 | 3.2% |
| $15,000 to $24,999 | 12 | 2.1% |
| $25,000 to $34,999 | 86 | 15.4% |
| $35,000 to $49,999 | 57 | 10.2% |
| $50,000 to $74,999 | 36 | 6.4% |
| $75,000 to $99,999 | 65 | 11.6% |
| $100,000 to $149,999 | 94 | 16.8% |
| $150,000 to $199,999 | 124 | 22.1% |
| $200,000+ | 68 | 12.1% |
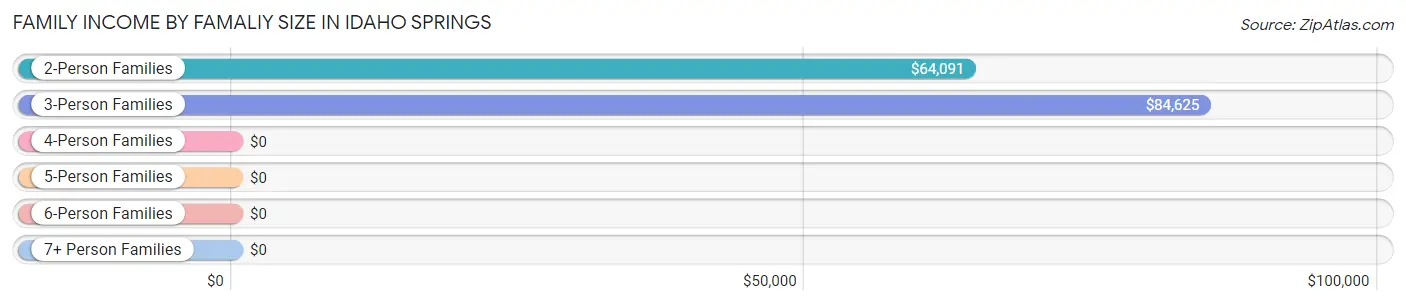
Family Income by Famaliy Size in Idaho Springs
3-person families (147 | 26.3%) account for the highest median family income in Idaho Springs with $84,625 per family, while 2-person families (264 | 47.1%) have the highest median income of $32,046 per family member.
| Income Bracket | # Families | Median Income |
| 2-Person Families | 264 (47.1%) | $64,091 |
| 3-Person Families | 147 (26.3%) | $84,625 |
| 4-Person Families | 68 (12.1%) | $0 |
| 5-Person Families | 81 (14.5%) | $0 |
| 6-Person Families | 0 (0.0%) | $0 |
| 7+ Person Families | 0 (0.0%) | $0 |
| Total | 560 (100.0%) | $105,938 |
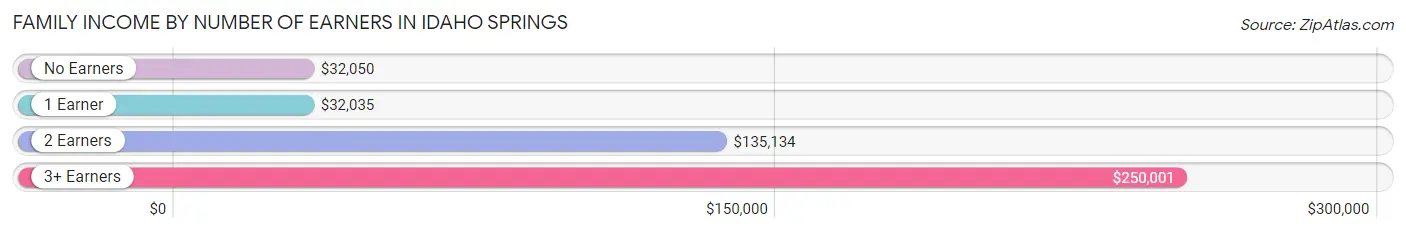
Family Income by Number of Earners in Idaho Springs
The median family income in Idaho Springs is $105,938, with families comprising 3+ earners (100) having the highest median family income of $250,001, while families with 1 earner (166) have the lowest median family income of $32,035, accounting for 17.9% and 29.6% of families, respectively.
| Number of Earners | # Families | Median Income |
| No Earners | 41 (7.3%) | $32,050 |
| 1 Earner | 166 (29.6%) | $32,035 |
| 2 Earners | 253 (45.2%) | $135,134 |
| 3+ Earners | 100 (17.9%) | $250,001 |
| Total | 560 (100.0%) | $105,938 |
Household Income in Idaho Springs
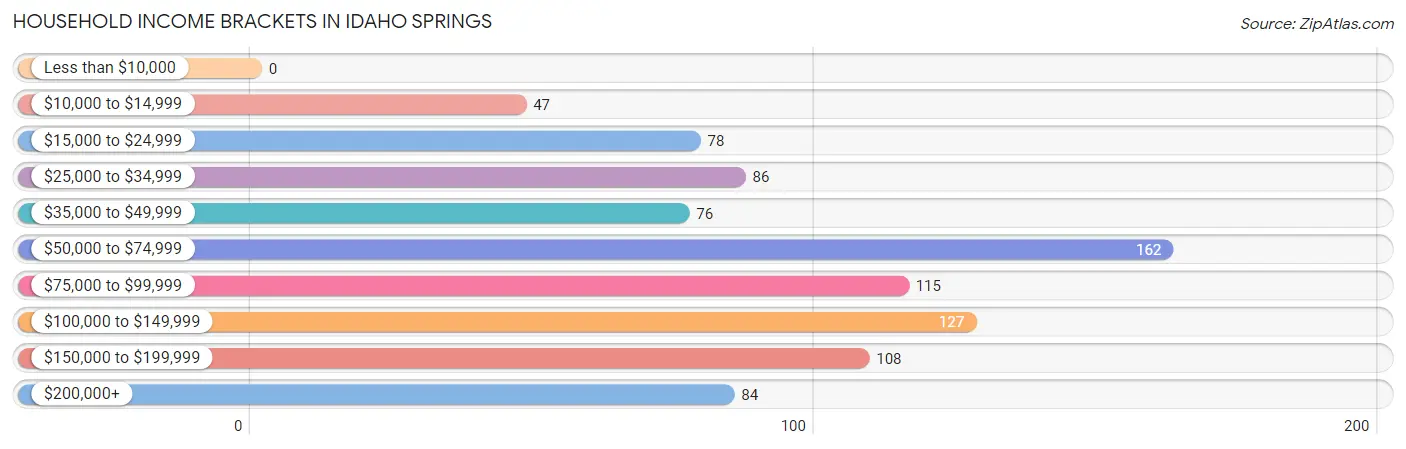
Household Income Brackets in Idaho Springs
With 162 households falling in the category, the $50,000 to $74,999 income range is the most frequent in Idaho Springs, accounting for 18.3% of all households.
| Income Bracket | # Households | % Households |
| Less than $10,000 | 0 | 0.0% |
| $10,000 to $14,999 | 47 | 5.3% |
| $15,000 to $24,999 | 78 | 8.8% |
| $25,000 to $34,999 | 86 | 9.7% |
| $35,000 to $49,999 | 76 | 8.6% |
| $50,000 to $74,999 | 162 | 18.3% |
| $75,000 to $99,999 | 115 | 13.0% |
| $100,000 to $149,999 | 127 | 14.4% |
| $150,000 to $199,999 | 108 | 12.2% |
| $200,000+ | 84 | 9.5% |
Household Income by Householder Age in Idaho Springs
The median household income in Idaho Springs is $72,101, with the highest median household income of $122,266 found in the 45 to 64 years age bracket for the primary householder. A total of 389 households (44.1%) fall into this category. Meanwhile, the 15 to 24 years age bracket for the primary householder has the lowest median household income of $0, with 98 households (11.1%) in this group.
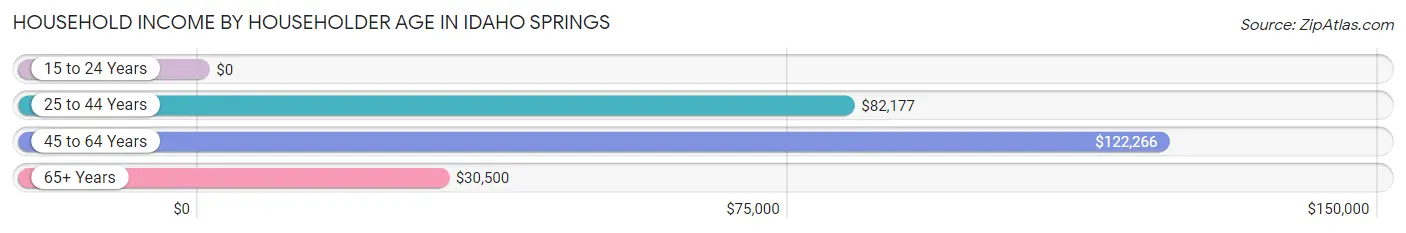
| Income Bracket | # Households | Median Income |
| 15 to 24 Years | 98 (11.1%) | $0 |
| 25 to 44 Years | 206 (23.3%) | $82,177 |
| 45 to 64 Years | 389 (44.1%) | $122,266 |
| 65+ Years | 190 (21.5%) | $30,500 |
| Total | 883 (100.0%) | $72,101 |
Poverty in Idaho Springs
Income Below Poverty by Sex and Age in Idaho Springs
With 10.6% poverty level for males and 10.4% for females among the residents of Idaho Springs, under 5 year old males and 18 to 24 year old females are the most vulnerable to poverty, with 18 males (100.0%) and 42 females (25.8%) in their respective age groups living below the poverty level.
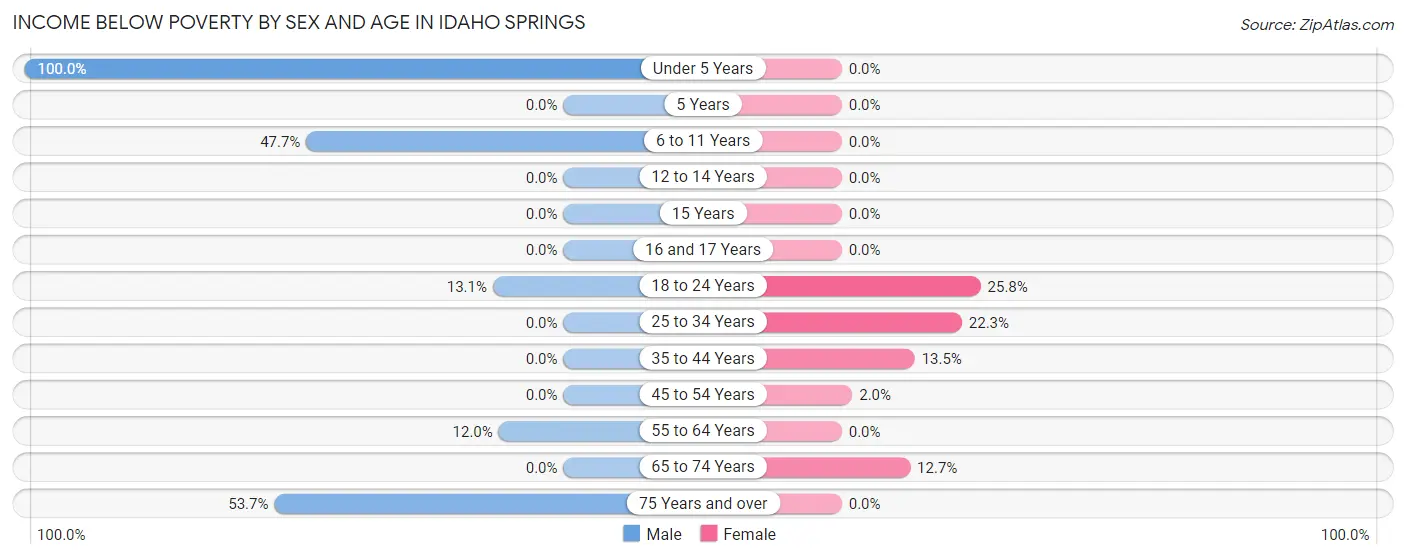
| Age Bracket | Male | Female |
| Under 5 Years | 18 (100.0%) | 0 (0.0%) |
| 5 Years | 0 (0.0%) | 0 (0.0%) |
| 6 to 11 Years | 21 (47.7%) | 0 (0.0%) |
| 12 to 14 Years | 0 (0.0%) | 0 (0.0%) |
| 15 Years | 0 (0.0%) | 0 (0.0%) |
| 16 and 17 Years | 0 (0.0%) | 0 (0.0%) |
| 18 to 24 Years | 22 (13.1%) | 42 (25.8%) |
| 25 to 34 Years | 0 (0.0%) | 37 (22.3%) |
| 35 to 44 Years | 0 (0.0%) | 18 (13.5%) |
| 45 to 54 Years | 0 (0.0%) | 3 (1.9%) |
| 55 to 64 Years | 22 (12.0%) | 0 (0.0%) |
| 65 to 74 Years | 0 (0.0%) | 17 (12.7%) |
| 75 Years and over | 22 (53.7%) | 0 (0.0%) |
| Total | 105 (10.6%) | 117 (10.4%) |
Income Above Poverty by Sex and Age in Idaho Springs
According to the poverty statistics in Idaho Springs, males aged 5 years and females aged under 5 years are the age groups that are most secure financially, with 100.0% of males and 100.0% of females in these age groups living above the poverty line.
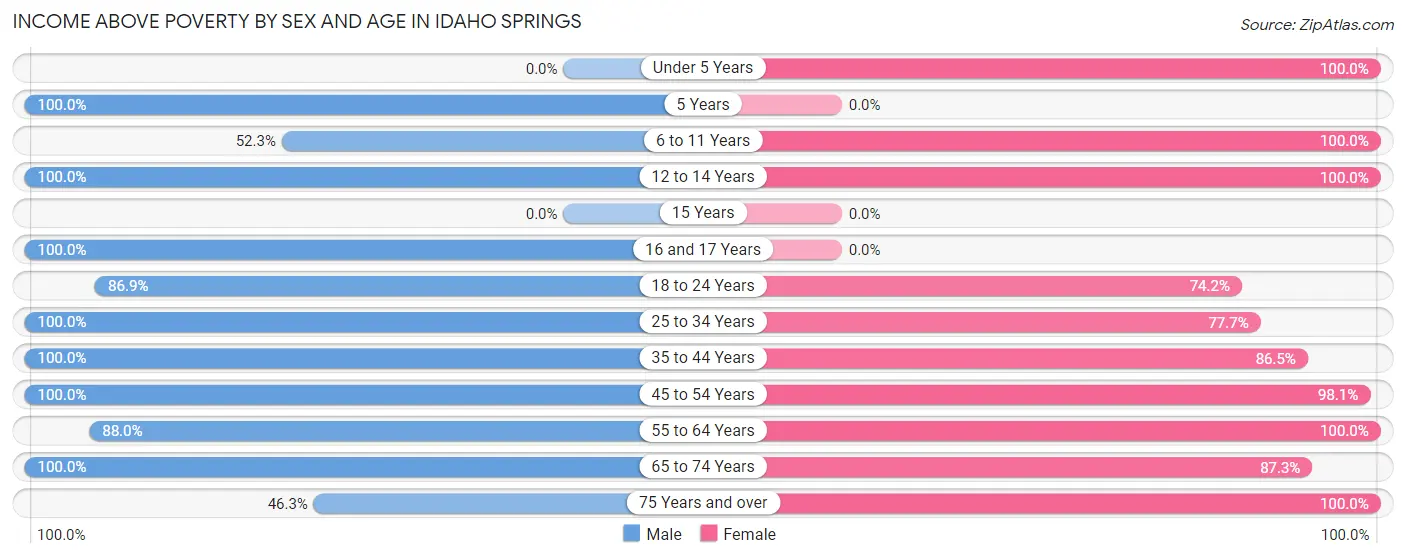
| Age Bracket | Male | Female |
| Under 5 Years | 0 (0.0%) | 71 (100.0%) |
| 5 Years | 15 (100.0%) | 0 (0.0%) |
| 6 to 11 Years | 23 (52.3%) | 25 (100.0%) |
| 12 to 14 Years | 14 (100.0%) | 21 (100.0%) |
| 15 Years | 0 (0.0%) | 0 (0.0%) |
| 16 and 17 Years | 38 (100.0%) | 0 (0.0%) |
| 18 to 24 Years | 146 (86.9%) | 121 (74.2%) |
| 25 to 34 Years | 172 (100.0%) | 129 (77.7%) |
| 35 to 44 Years | 84 (100.0%) | 115 (86.5%) |
| 45 to 54 Years | 84 (100.0%) | 151 (98.1%) |
| 55 to 64 Years | 161 (88.0%) | 192 (100.0%) |
| 65 to 74 Years | 125 (100.0%) | 117 (87.3%) |
| 75 Years and over | 19 (46.3%) | 68 (100.0%) |
| Total | 881 (89.3%) | 1,010 (89.6%) |
Income Below Poverty Among Married-Couple Families in Idaho Springs
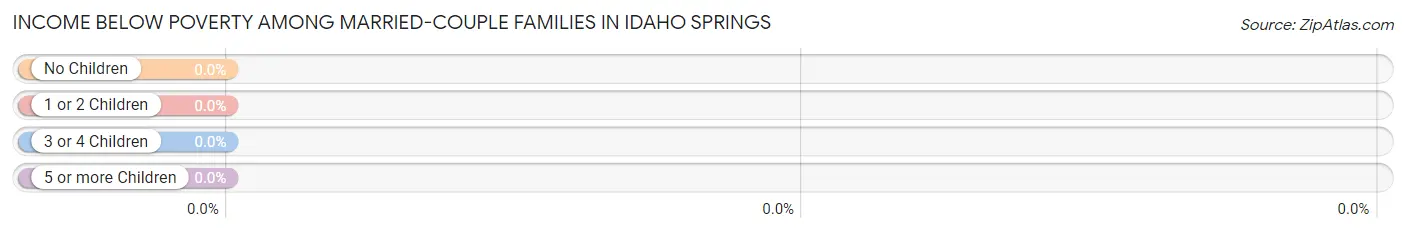
| Children | Above Poverty | Below Poverty |
| No Children | 292 (100.0%) | 0 (0.0%) |
| 1 or 2 Children | 169 (100.0%) | 0 (0.0%) |
| 3 or 4 Children | 0 (0.0%) | 0 (0.0%) |
| 5 or more Children | 0 (0.0%) | 0 (0.0%) |
| Total | 461 (100.0%) | 0 (0.0%) |
Income Below Poverty Among Single-Parent Households in Idaho Springs
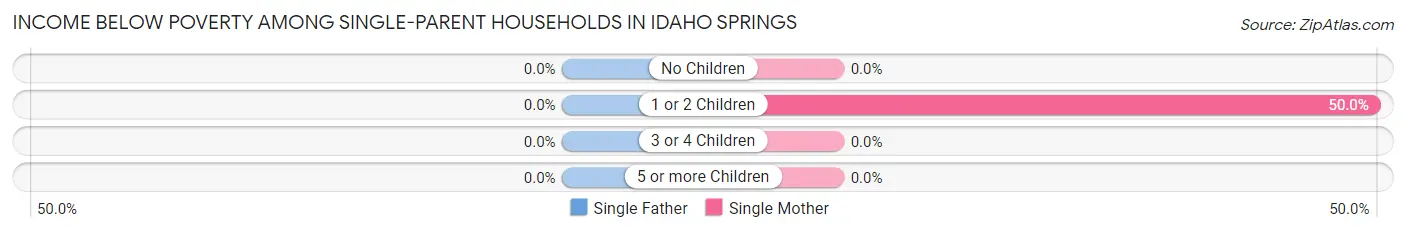
| Children | Single Father | Single Mother |
| No Children | 0 (0.0%) | 0 (0.0%) |
| 1 or 2 Children | 0 (0.0%) | 18 (50.0%) |
| 3 or 4 Children | 0 (0.0%) | 0 (0.0%) |
| 5 or more Children | 0 (0.0%) | 0 (0.0%) |
| Total | 0 (0.0%) | 18 (22.8%) |
Income Below Poverty Among Married-Couple vs Single-Parent Households in Idaho Springs
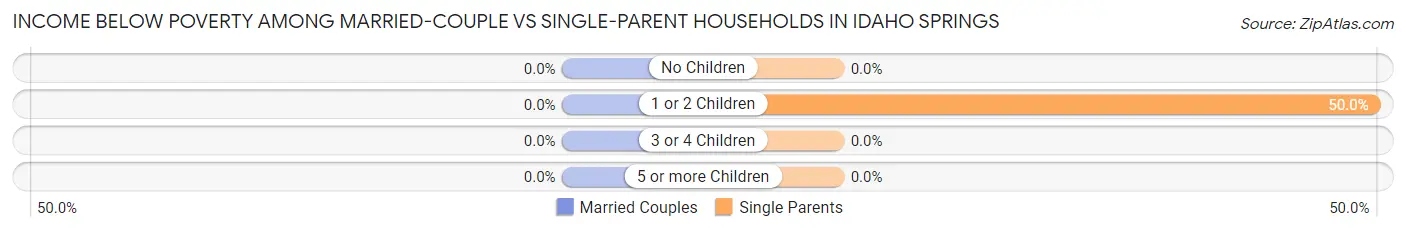
| Children | Married-Couple Families | Single-Parent Households |
| No Children | 0 (0.0%) | 0 (0.0%) |
| 1 or 2 Children | 0 (0.0%) | 18 (50.0%) |
| 3 or 4 Children | 0 (0.0%) | 0 (0.0%) |
| 5 or more Children | 0 (0.0%) | 0 (0.0%) |
| Total | 0 (0.0%) | 18 (18.2%) |
Race in Idaho Springs
The most populous races in Idaho Springs are White / Caucasian (1,808 | 85.6%), Hispanic or Latino (253 | 12.0%), and Two or more Races (149 | 7.0%).
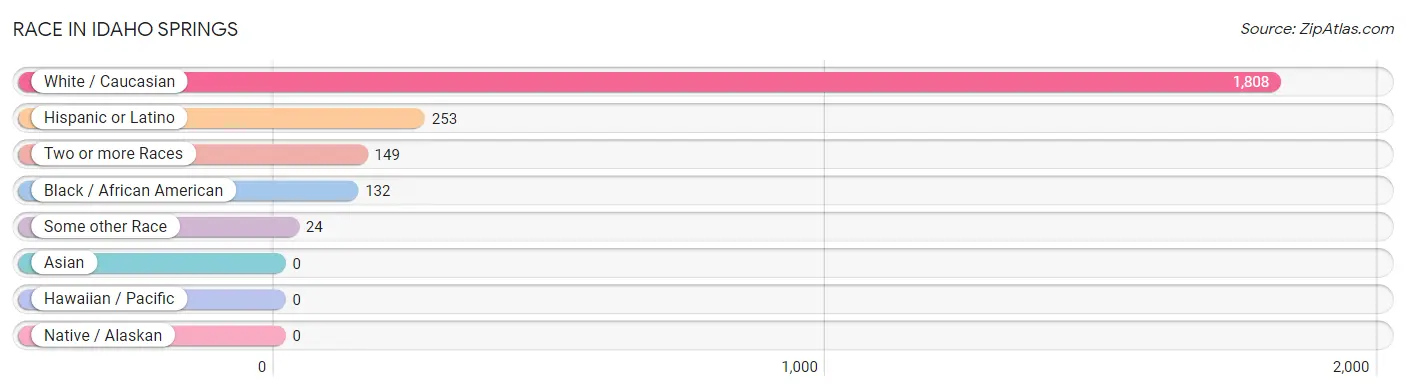
| Race | # Population | % Population |
| Asian | 0 | 0.0% |
| Black / African American | 132 | 6.2% |
| Hawaiian / Pacific | 0 | 0.0% |
| Hispanic or Latino | 253 | 12.0% |
| Native / Alaskan | 0 | 0.0% |
| White / Caucasian | 1,808 | 85.6% |
| Two or more Races | 149 | 7.0% |
| Some other Race | 24 | 1.1% |
| Total | 2,113 | 100.0% |
Ancestry in Idaho Springs
The most populous ancestries reported in Idaho Springs are German (529 | 25.0%), Irish (297 | 14.1%), English (210 | 9.9%), Scottish (140 | 6.6%), and Puerto Rican (118 | 5.6%), together accounting for 61.2% of all Idaho Springs residents.
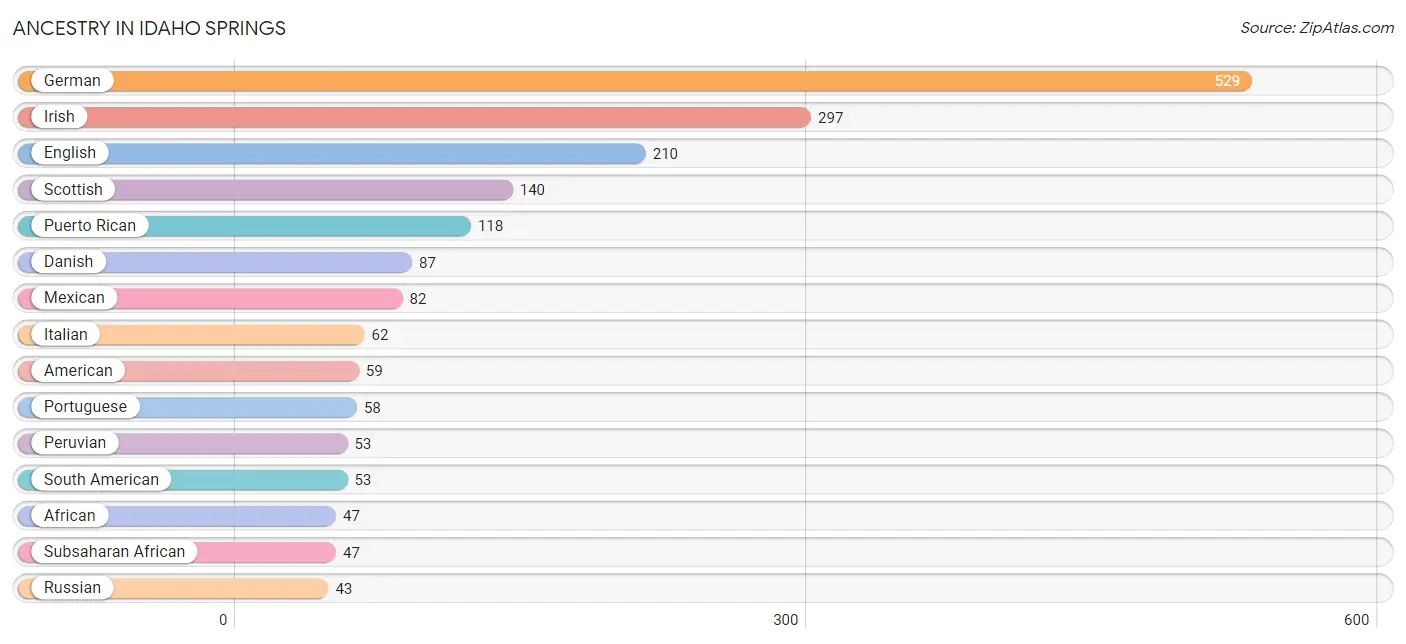
| Ancestry | # Population | % Population |
| African | 47 | 2.2% |
| American | 59 | 2.8% |
| Arab | 16 | 0.8% |
| Austrian | 6 | 0.3% |
| British | 36 | 1.7% |
| Cheyenne | 9 | 0.4% |
| Danish | 87 | 4.1% |
| Dutch | 37 | 1.8% |
| Eastern European | 13 | 0.6% |
| English | 210 | 9.9% |
| French | 29 | 1.4% |
| German | 529 | 25.0% |
| Irish | 297 | 14.1% |
| Italian | 62 | 2.9% |
| Mexican | 82 | 3.9% |
| Norwegian | 20 | 0.9% |
| Pakistani | 25 | 1.2% |
| Peruvian | 53 | 2.5% |
| Portuguese | 58 | 2.7% |
| Puerto Rican | 118 | 5.6% |
| Russian | 43 | 2.0% |
| Scotch-Irish | 9 | 0.4% |
| Scottish | 140 | 6.6% |
| South American | 53 | 2.5% |
| Subsaharan African | 47 | 2.2% |
| Swedish | 24 | 1.1% |
| Welsh | 14 | 0.7% |
| Yugoslavian | 10 | 0.5% | View All 28 Rows |
Immigrants in Idaho Springs
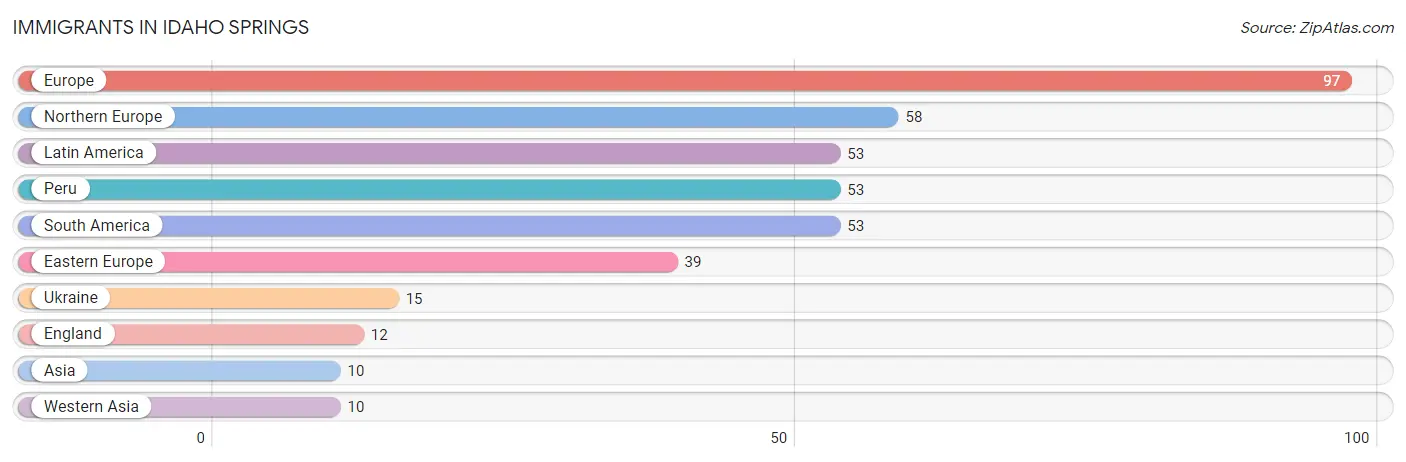
The most numerous immigrant groups reported in Idaho Springs came from Europe (97 | 4.6%), Northern Europe (58 | 2.7%), Latin America (53 | 2.5%), Peru (53 | 2.5%), and South America (53 | 2.5%), together accounting for 14.9% of all Idaho Springs residents.
| Immigration Origin | # Population | % Population |
| Asia | 10 | 0.5% |
| Eastern Europe | 39 | 1.8% |
| England | 12 | 0.6% |
| Europe | 97 | 4.6% |
| Latin America | 53 | 2.5% |
| Northern Europe | 58 | 2.7% |
| Peru | 53 | 2.5% |
| South America | 53 | 2.5% |
| Ukraine | 15 | 0.7% |
| Western Asia | 10 | 0.5% | View All 10 Rows |
Sex and Age in Idaho Springs
Sex and Age in Idaho Springs
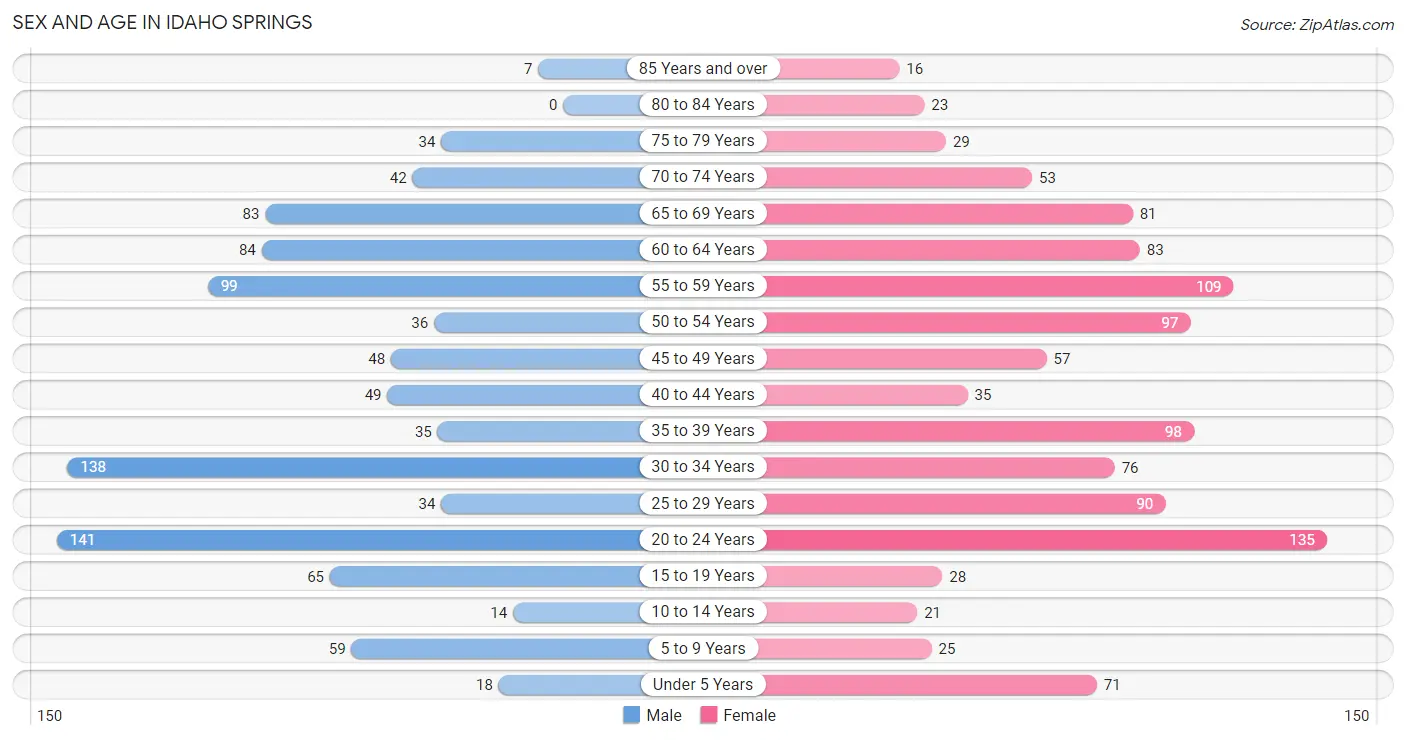
The most populous age groups in Idaho Springs are 20 to 24 Years (141 | 14.3%) for men and 20 to 24 Years (135 | 12.0%) for women.
| Age Bracket | Male | Female |
| Under 5 Years | 18 (1.8%) | 71 (6.3%) |
| 5 to 9 Years | 59 (6.0%) | 25 (2.2%) |
| 10 to 14 Years | 14 (1.4%) | 21 (1.9%) |
| 15 to 19 Years | 65 (6.6%) | 28 (2.5%) |
| 20 to 24 Years | 141 (14.3%) | 135 (12.0%) |
| 25 to 29 Years | 34 (3.5%) | 90 (8.0%) |
| 30 to 34 Years | 138 (14.0%) | 76 (6.7%) |
| 35 to 39 Years | 35 (3.5%) | 98 (8.7%) |
| 40 to 44 Years | 49 (5.0%) | 35 (3.1%) |
| 45 to 49 Years | 48 (4.9%) | 57 (5.1%) |
| 50 to 54 Years | 36 (3.6%) | 97 (8.6%) |
| 55 to 59 Years | 99 (10.0%) | 109 (9.7%) |
| 60 to 64 Years | 84 (8.5%) | 83 (7.4%) |
| 65 to 69 Years | 83 (8.4%) | 81 (7.2%) |
| 70 to 74 Years | 42 (4.3%) | 53 (4.7%) |
| 75 to 79 Years | 34 (3.5%) | 29 (2.6%) |
| 80 to 84 Years | 0 (0.0%) | 23 (2.0%) |
| 85 Years and over | 7 (0.7%) | 16 (1.4%) |
| Total | 986 (100.0%) | 1,127 (100.0%) |
Families and Households in Idaho Springs
Median Family Size in Idaho Springs
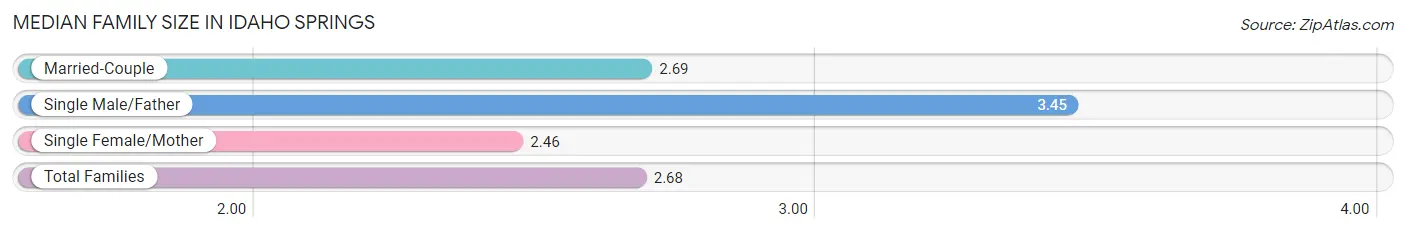
The median family size in Idaho Springs is 2.68 persons per family, with single male/father families (20 | 3.6%) accounting for the largest median family size of 3.45 persons per family. On the other hand, single female/mother families (79 | 14.1%) represent the smallest median family size with 2.46 persons per family.
| Family Type | # Families | Family Size |
| Married-Couple | 461 (82.3%) | 2.69 |
| Single Male/Father | 20 (3.6%) | 3.45 |
| Single Female/Mother | 79 (14.1%) | 2.46 |
| Total Families | 560 (100.0%) | 2.68 |
Median Household Size in Idaho Springs
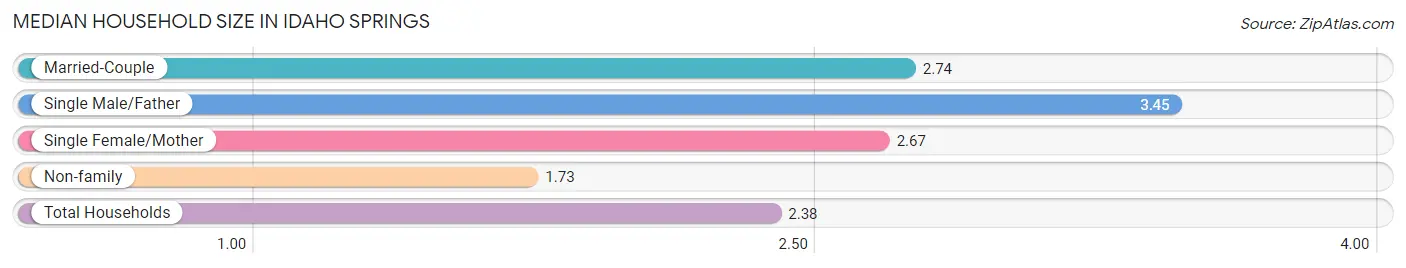
The median household size in Idaho Springs is 2.38 persons per household, with single male/father households (20 | 2.3%) accounting for the largest median household size of 3.45 persons per household. non-family households (323 | 36.6%) represent the smallest median household size with 1.73 persons per household.
| Household Type | # Households | Household Size |
| Married-Couple | 461 (52.2%) | 2.74 |
| Single Male/Father | 20 (2.3%) | 3.45 |
| Single Female/Mother | 79 (8.9%) | 2.67 |
| Non-family | 323 (36.6%) | 1.73 |
| Total Households | 883 (100.0%) | 2.38 |
Household Size by Marriage Status in Idaho Springs
Out of a total of 883 households in Idaho Springs, 560 (63.4%) are family households, while 323 (36.6%) are nonfamily households. The most numerous type of family households are 2-person households, comprising 246, and the most common type of nonfamily households are 1-person households, comprising 161.
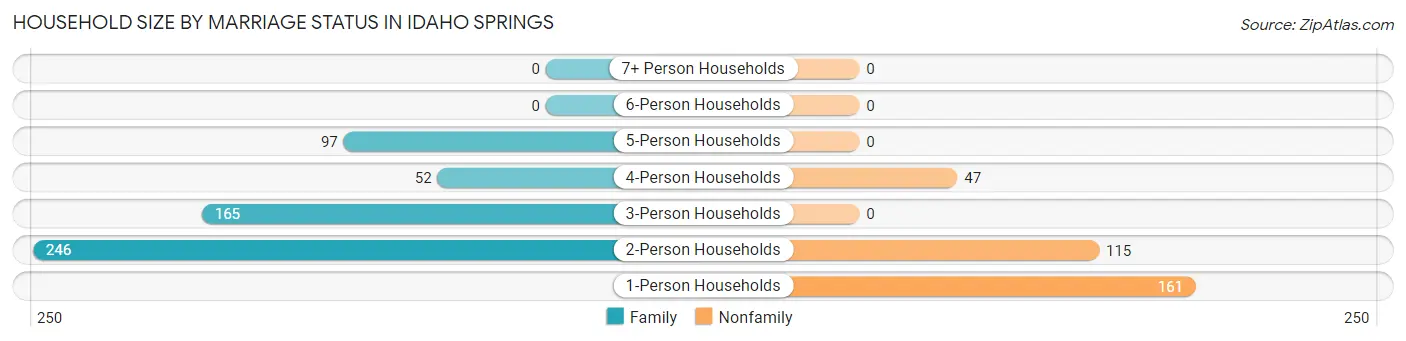
| Household Size | Family Households | Nonfamily Households |
| 1-Person Households | - | 161 (18.2%) |
| 2-Person Households | 246 (27.9%) | 115 (13.0%) |
| 3-Person Households | 165 (18.7%) | 0 (0.0%) |
| 4-Person Households | 52 (5.9%) | 47 (5.3%) |
| 5-Person Households | 97 (11.0%) | 0 (0.0%) |
| 6-Person Households | 0 (0.0%) | 0 (0.0%) |
| 7+ Person Households | 0 (0.0%) | 0 (0.0%) |
| Total | 560 (63.4%) | 323 (36.6%) |
Female Fertility in Idaho Springs
Fertility by Age in Idaho Springs
Average fertility rate in Idaho Springs is 24.0 births per 1,000 women. Women in the age bracket of 20 to 34 years have the highest fertility rate with 43.0 births per 1,000 women. Women in the age bracket of 20 to 34 years acount for 100.0% of all women with births.
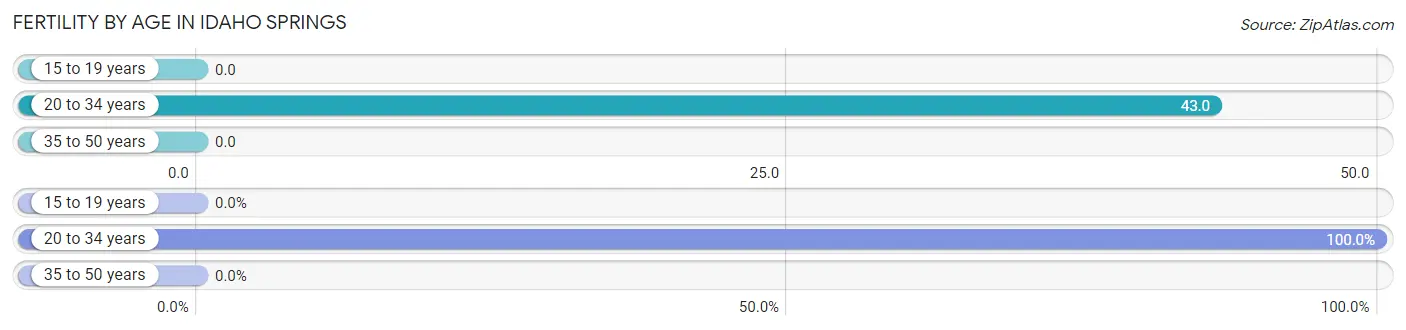
| Age Bracket | Women with Births | Births / 1,000 Women |
| 15 to 19 years | 0 (0.0%) | 0.0 |
| 20 to 34 years | 13 (100.0%) | 43.0 |
| 35 to 50 years | 0 (0.0%) | 0.0 |
| Total | 13 (100.0%) | 24.0 |
Fertility by Age by Marriage Status in Idaho Springs
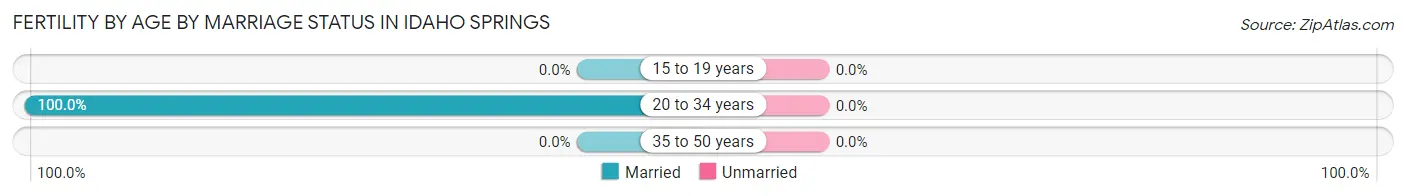
| Age Bracket | Married | Unmarried |
| 15 to 19 years | 0 (0.0%) | 0 (0.0%) |
| 20 to 34 years | 13 (100.0%) | 0 (0.0%) |
| 35 to 50 years | 0 (0.0%) | 0 (0.0%) |
| Total | 13 (100.0%) | 0 (0.0%) |
Fertility by Education in Idaho Springs
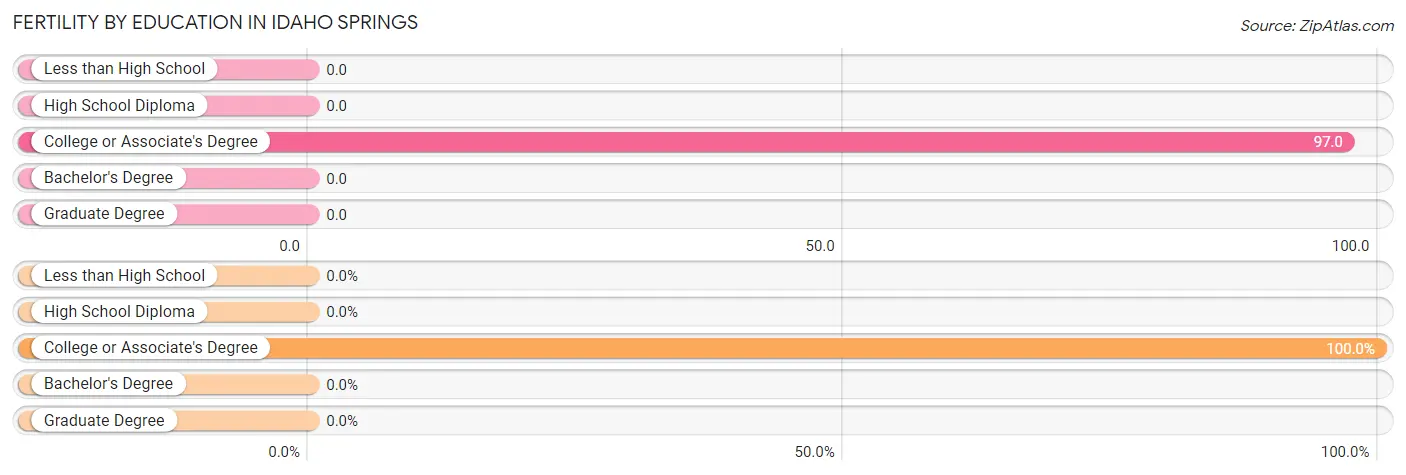
| Educational Attainment | Women with Births | Births / 1,000 Women |
| Less than High School | 0 (0.0%) | 0.0 |
| High School Diploma | 0 (0.0%) | 0.0 |
| College or Associate's Degree | 13 (100.0%) | 97.0 |
| Bachelor's Degree | 0 (0.0%) | 0.0 |
| Graduate Degree | 0 (0.0%) | 0.0 |
| Total | 13 (100.0%) | 24.0 |
Fertility by Education by Marriage Status in Idaho Springs
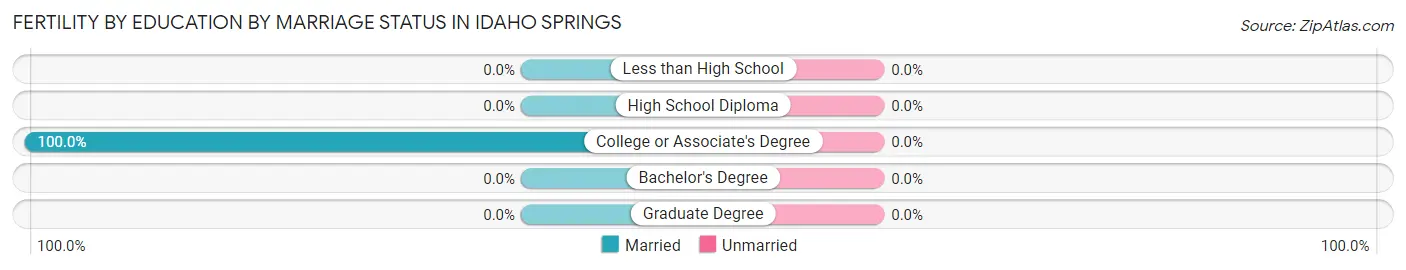
| Educational Attainment | Married | Unmarried |
| Less than High School | 0 (0.0%) | 0 (0.0%) |
| High School Diploma | 0 (0.0%) | 0 (0.0%) |
| College or Associate's Degree | 13 (100.0%) | 0 (0.0%) |
| Bachelor's Degree | 0 (0.0%) | 0 (0.0%) |
| Graduate Degree | 0 (0.0%) | 0 (0.0%) |
| Total | 13 (100.0%) | 0 (0.0%) |
Employment Characteristics in Idaho Springs
Employment by Class of Employer in Idaho Springs
Among the 1,253 employed individuals in Idaho Springs, private company employees (805 | 64.2%), not-for-profit organizations (205 | 16.4%), and local government employees (106 | 8.5%) make up the most common classes of employment.
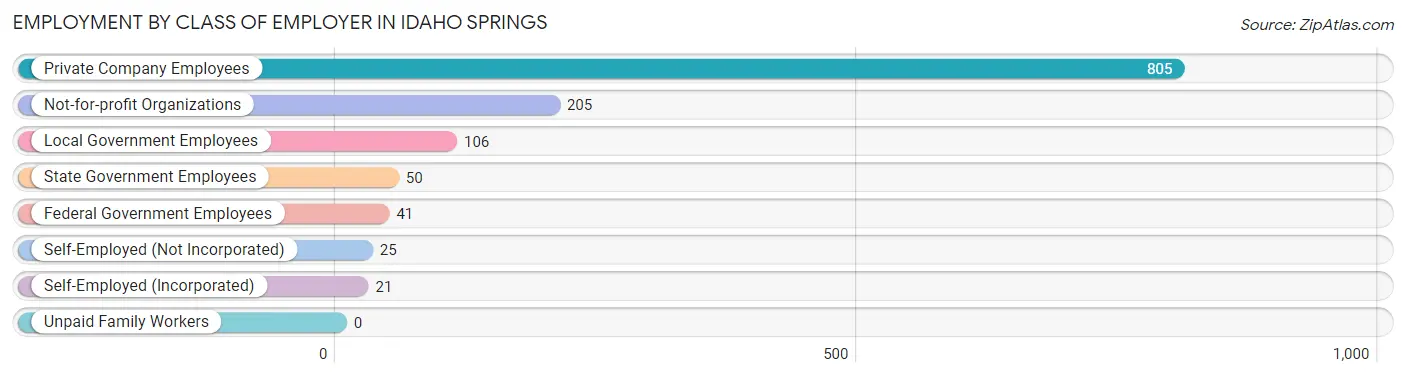
| Employer Class | # Employees | % Employees |
| Private Company Employees | 805 | 64.2% |
| Self-Employed (Incorporated) | 21 | 1.7% |
| Self-Employed (Not Incorporated) | 25 | 2.0% |
| Not-for-profit Organizations | 205 | 16.4% |
| Local Government Employees | 106 | 8.5% |
| State Government Employees | 50 | 4.0% |
| Federal Government Employees | 41 | 3.3% |
| Unpaid Family Workers | 0 | 0.0% |
| Total | 1,253 | 100.0% |
Employment Status by Age in Idaho Springs
According to the labor force statistics for Idaho Springs, out of the total population over 16 years of age (1,905), 73.0% or 1,391 individuals are in the labor force, with 6.8% or 95 of them unemployed. The age group with the highest labor force participation rate is 20 to 24 years, with 100.0% or 276 individuals in the labor force. Within the labor force, the 16 to 19 years age range has the highest percentage of unemployed individuals, with 38.6% or 27 of them being unemployed.
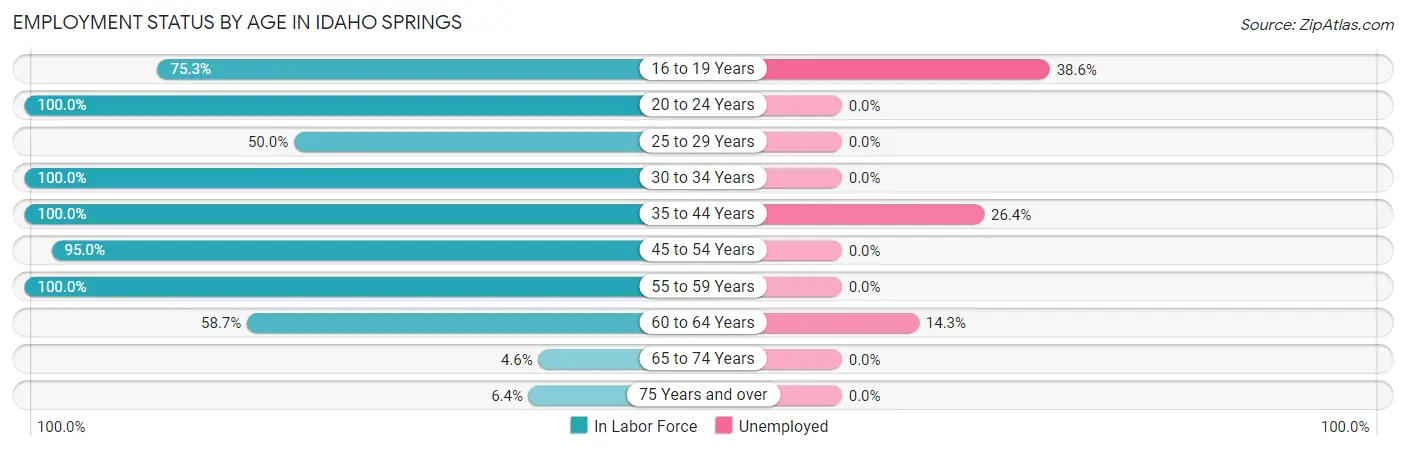
| Age Bracket | In Labor Force | Unemployed |
| 16 to 19 Years | 70 (75.3%) | 27 (38.6%) |
| 20 to 24 Years | 276 (100.0%) | 0 (0.0%) |
| 25 to 29 Years | 62 (50.0%) | 0 (0.0%) |
| 30 to 34 Years | 214 (100.0%) | 0 (0.0%) |
| 35 to 44 Years | 217 (100.0%) | 57 (26.4%) |
| 45 to 54 Years | 226 (95.0%) | 0 (0.0%) |
| 55 to 59 Years | 208 (100.0%) | 0 (0.0%) |
| 60 to 64 Years | 98 (58.7%) | 14 (14.3%) |
| 65 to 74 Years | 12 (4.6%) | 0 (0.0%) |
| 75 Years and over | 7 (6.4%) | 0 (0.0%) |
| Total | 1,391 (73.0%) | 95 (6.8%) |
Employment Status by Educational Attainment in Idaho Springs
According to labor force statistics for Idaho Springs, 87.8% of individuals (1,026) out of the total population between 25 and 64 years of age (1,168) are in the labor force, with 6.6% or 68 of them being unemployed. The group with the highest labor force participation rate are those with the educational attainment of bachelor's degree or higher, with 95.1% or 546 individuals in the labor force. Within the labor force, individuals with bachelor's degree or higher education have the highest percentage of unemployment, with 12.6% or 69 of them being unemployed.
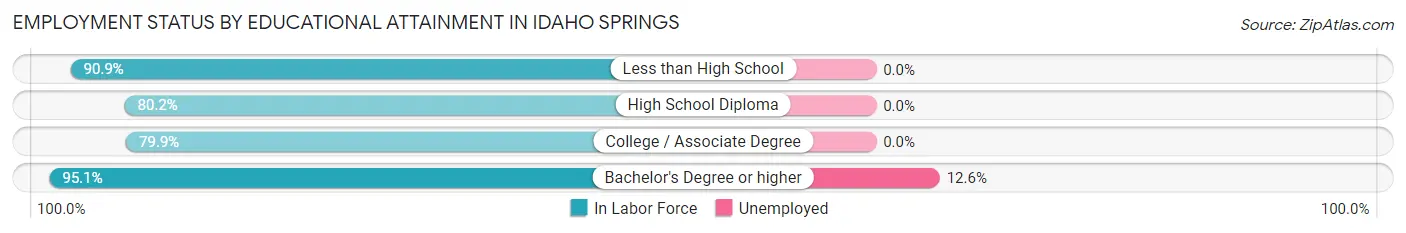
| Educational Attainment | In Labor Force | Unemployed |
| Less than High School | 30 (90.9%) | 0 (0.0%) |
| High School Diploma | 199 (80.2%) | 0 (0.0%) |
| College / Associate Degree | 250 (79.9%) | 0 (0.0%) |
| Bachelor's Degree or higher | 546 (95.1%) | 72 (12.6%) |
| Total | 1,026 (87.8%) | 77 (6.6%) |
Employment Occupations by Sex in Idaho Springs
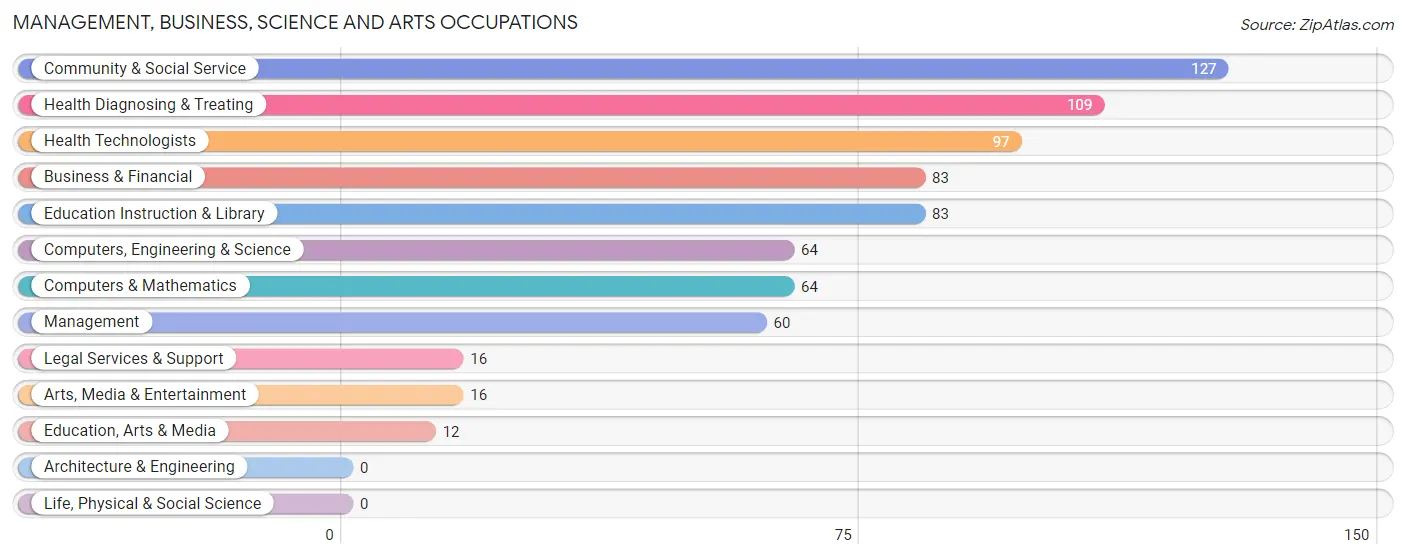
Management, Business, Science and Arts Occupations
The most common Management, Business, Science and Arts occupations in Idaho Springs are Community & Social Service (127 | 9.9%), Health Diagnosing & Treating (109 | 8.5%), Health Technologists (97 | 7.6%), Business & Financial (83 | 6.5%), and Education Instruction & Library (83 | 6.5%).
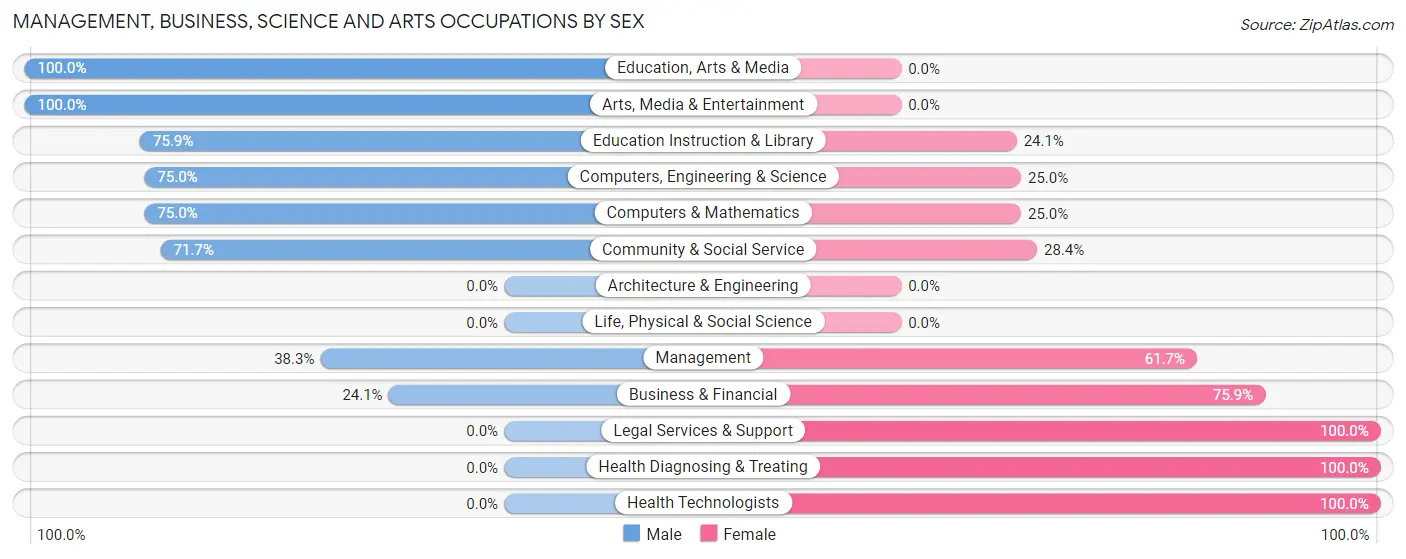
Management, Business, Science and Arts Occupations by Sex
Within the Management, Business, Science and Arts occupations in Idaho Springs, the most male-oriented occupations are Education, Arts & Media (100.0%), Arts, Media & Entertainment (100.0%), and Education Instruction & Library (75.9%), while the most female-oriented occupations are Legal Services & Support (100.0%), Health Diagnosing & Treating (100.0%), and Health Technologists (100.0%).
| Occupation | Male | Female |
| Management | 23 (38.3%) | 37 (61.7%) |
| Business & Financial | 20 (24.1%) | 63 (75.9%) |
| Computers, Engineering & Science | 48 (75.0%) | 16 (25.0%) |
| Computers & Mathematics | 48 (75.0%) | 16 (25.0%) |
| Architecture & Engineering | 0 (0.0%) | 0 (0.0%) |
| Life, Physical & Social Science | 0 (0.0%) | 0 (0.0%) |
| Community & Social Service | 91 (71.7%) | 36 (28.3%) |
| Education, Arts & Media | 12 (100.0%) | 0 (0.0%) |
| Legal Services & Support | 0 (0.0%) | 16 (100.0%) |
| Education Instruction & Library | 63 (75.9%) | 20 (24.1%) |
| Arts, Media & Entertainment | 16 (100.0%) | 0 (0.0%) |
| Health Diagnosing & Treating | 0 (0.0%) | 109 (100.0%) |
| Health Technologists | 0 (0.0%) | 97 (100.0%) |
| Total (Category) | 182 (41.1%) | 261 (58.9%) |
| Total (Overall) | 630 (49.2%) | 650 (50.8%) |
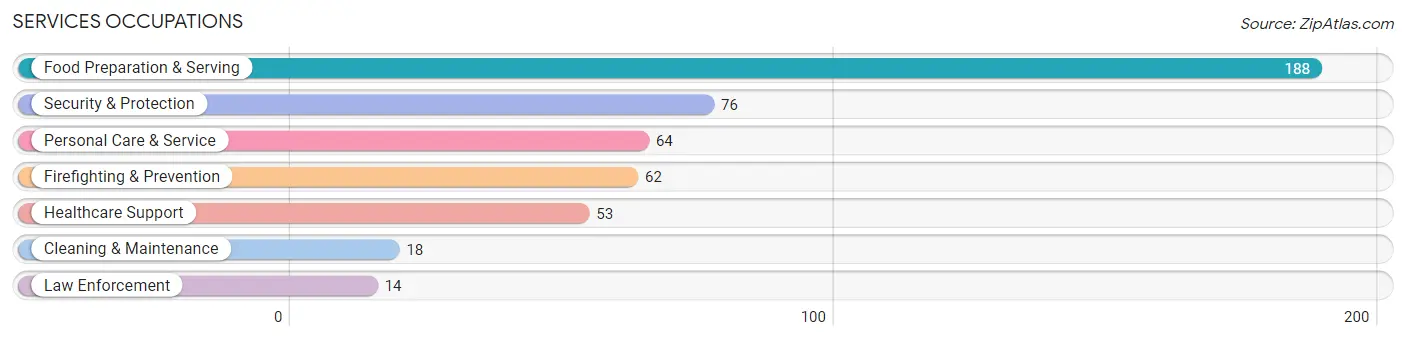
Services Occupations
The most common Services occupations in Idaho Springs are Food Preparation & Serving (188 | 14.7%), Security & Protection (76 | 5.9%), Personal Care & Service (64 | 5.0%), Firefighting & Prevention (62 | 4.8%), and Healthcare Support (53 | 4.1%).
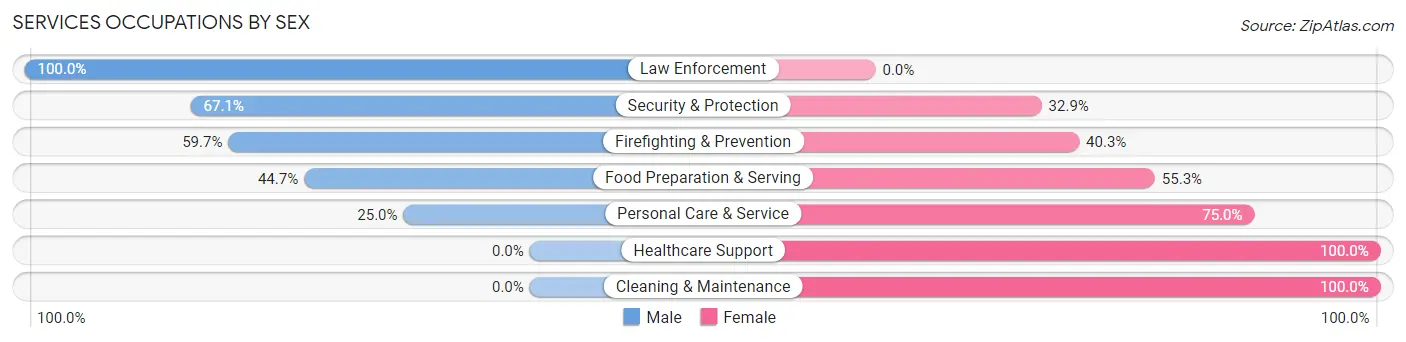
Services Occupations by Sex
Within the Services occupations in Idaho Springs, the most male-oriented occupations are Law Enforcement (100.0%), Security & Protection (67.1%), and Firefighting & Prevention (59.7%), while the most female-oriented occupations are Healthcare Support (100.0%), Cleaning & Maintenance (100.0%), and Personal Care & Service (75.0%).
| Occupation | Male | Female |
| Healthcare Support | 0 (0.0%) | 53 (100.0%) |
| Security & Protection | 51 (67.1%) | 25 (32.9%) |
| Firefighting & Prevention | 37 (59.7%) | 25 (40.3%) |
| Law Enforcement | 14 (100.0%) | 0 (0.0%) |
| Food Preparation & Serving | 84 (44.7%) | 104 (55.3%) |
| Cleaning & Maintenance | 0 (0.0%) | 18 (100.0%) |
| Personal Care & Service | 16 (25.0%) | 48 (75.0%) |
| Total (Category) | 151 (37.8%) | 248 (62.2%) |
| Total (Overall) | 630 (49.2%) | 650 (50.8%) |
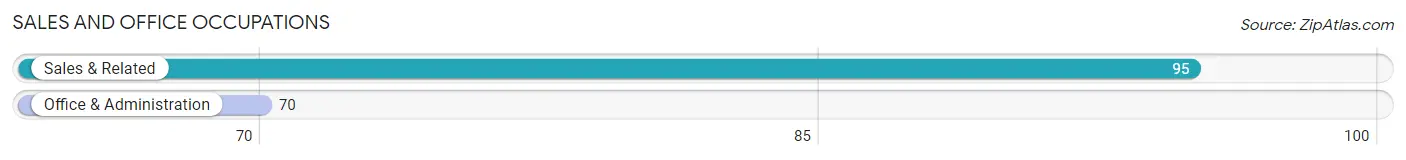
Sales and Office Occupations
The most common Sales and Office occupations in Idaho Springs are Sales & Related (95 | 7.4%), and Office & Administration (70 | 5.5%).
Sales and Office Occupations by Sex
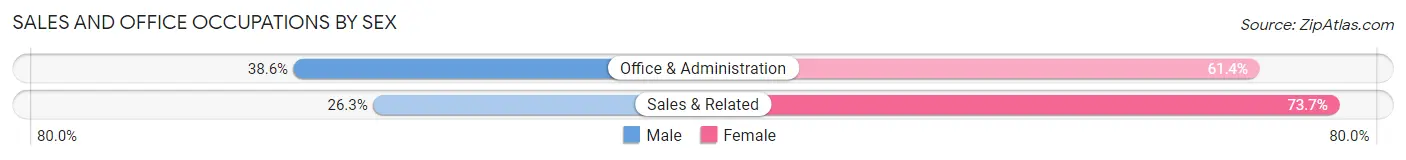
| Occupation | Male | Female |
| Sales & Related | 25 (26.3%) | 70 (73.7%) |
| Office & Administration | 27 (38.6%) | 43 (61.4%) |
| Total (Category) | 52 (31.5%) | 113 (68.5%) |
| Total (Overall) | 630 (49.2%) | 650 (50.8%) |
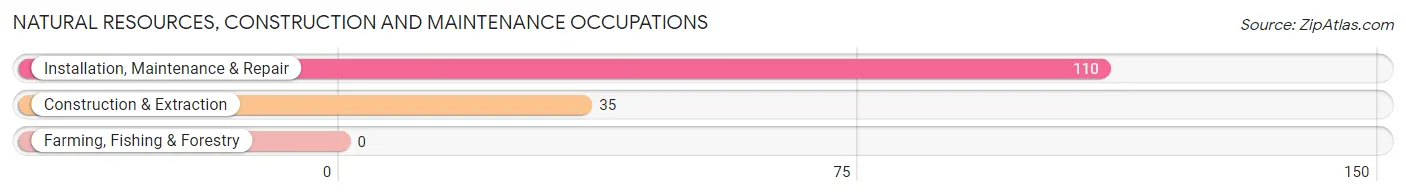
Natural Resources, Construction and Maintenance Occupations
The most common Natural Resources, Construction and Maintenance occupations in Idaho Springs are Installation, Maintenance & Repair (110 | 8.6%), and Construction & Extraction (35 | 2.7%).
Natural Resources, Construction and Maintenance Occupations by Sex
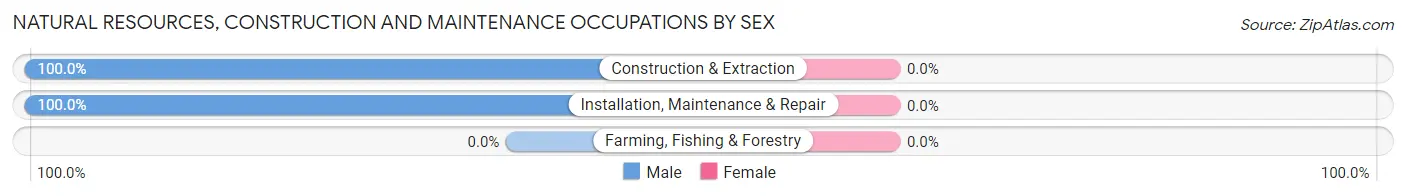
| Occupation | Male | Female |
| Farming, Fishing & Forestry | 0 (0.0%) | 0 (0.0%) |
| Construction & Extraction | 35 (100.0%) | 0 (0.0%) |
| Installation, Maintenance & Repair | 110 (100.0%) | 0 (0.0%) |
| Total (Category) | 145 (100.0%) | 0 (0.0%) |
| Total (Overall) | 630 (49.2%) | 650 (50.8%) |
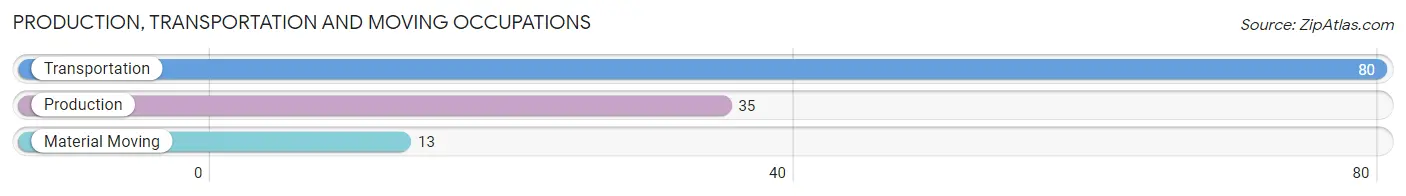
Production, Transportation and Moving Occupations
The most common Production, Transportation and Moving occupations in Idaho Springs are Transportation (80 | 6.2%), Production (35 | 2.7%), and Material Moving (13 | 1.0%).
Production, Transportation and Moving Occupations by Sex
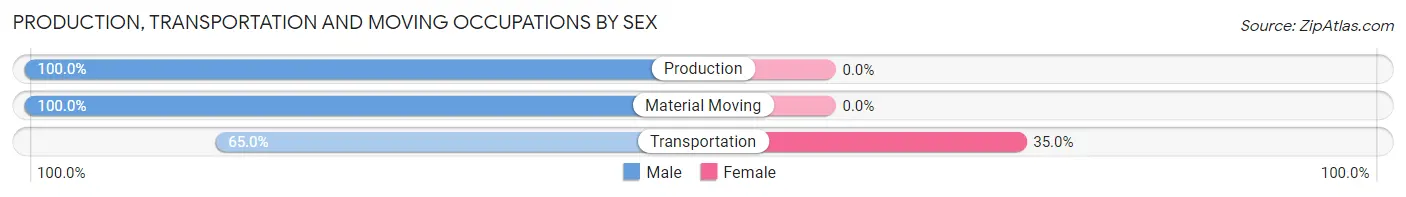
| Occupation | Male | Female |
| Production | 35 (100.0%) | 0 (0.0%) |
| Transportation | 52 (65.0%) | 28 (35.0%) |
| Material Moving | 13 (100.0%) | 0 (0.0%) |
| Total (Category) | 100 (78.1%) | 28 (21.9%) |
| Total (Overall) | 630 (49.2%) | 650 (50.8%) |
Employment Industries by Sex in Idaho Springs
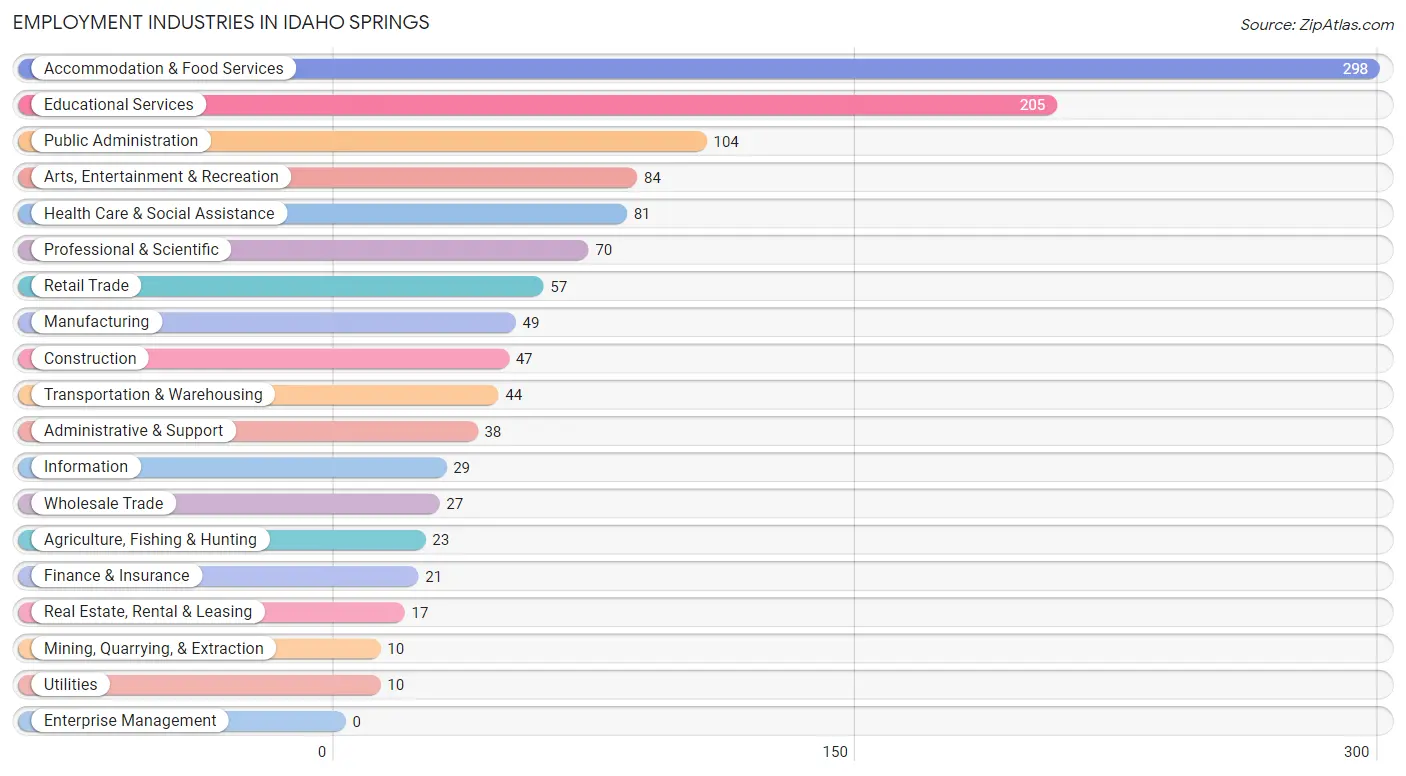
Employment Industries in Idaho Springs
The major employment industries in Idaho Springs include Accommodation & Food Services (298 | 23.3%), Educational Services (205 | 16.0%), Public Administration (104 | 8.1%), Arts, Entertainment & Recreation (84 | 6.6%), and Health Care & Social Assistance (81 | 6.3%).
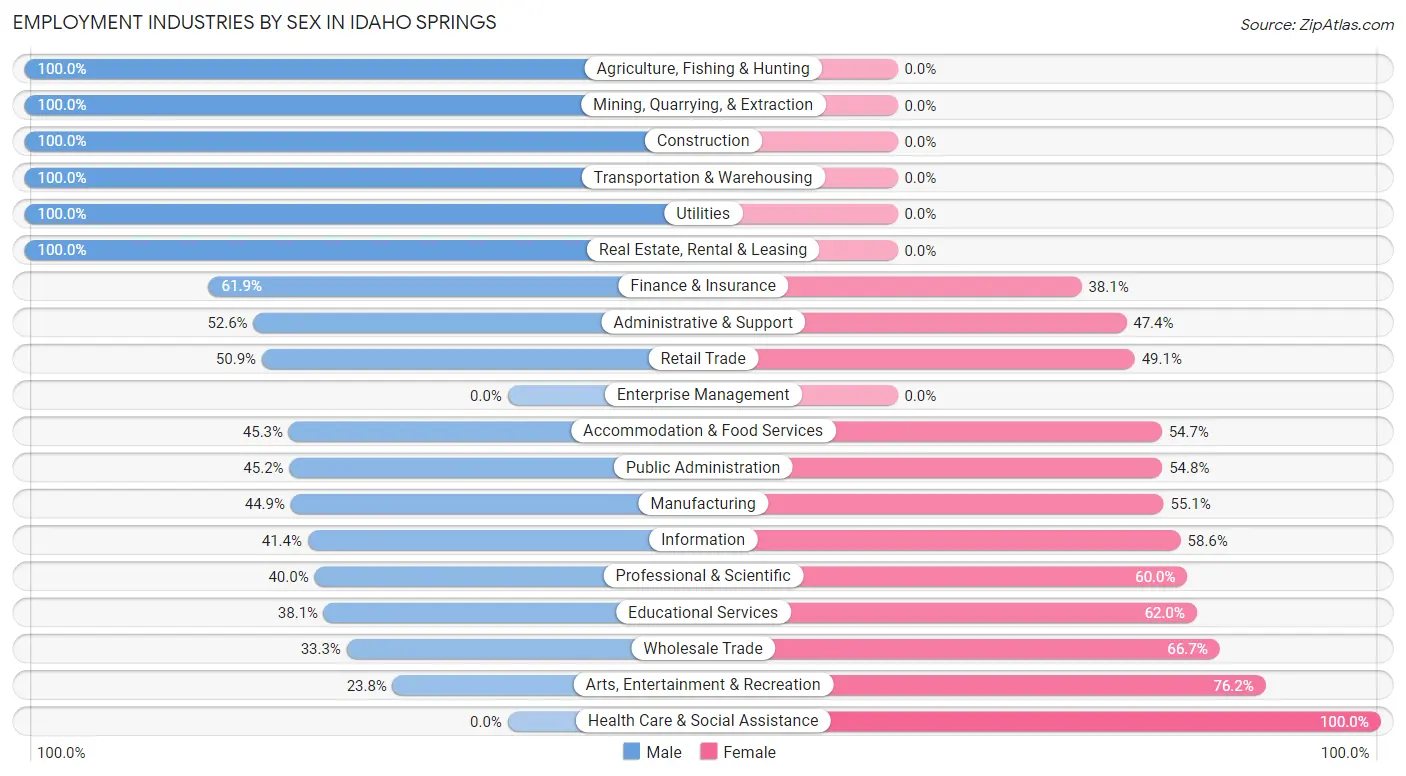
Employment Industries by Sex in Idaho Springs
The Idaho Springs industries that see more men than women are Agriculture, Fishing & Hunting (100.0%), Mining, Quarrying, & Extraction (100.0%), and Construction (100.0%), whereas the industries that tend to have a higher number of women are Health Care & Social Assistance (100.0%), Arts, Entertainment & Recreation (76.2%), and Wholesale Trade (66.7%).
| Industry | Male | Female |
| Agriculture, Fishing & Hunting | 23 (100.0%) | 0 (0.0%) |
| Mining, Quarrying, & Extraction | 10 (100.0%) | 0 (0.0%) |
| Construction | 47 (100.0%) | 0 (0.0%) |
| Manufacturing | 22 (44.9%) | 27 (55.1%) |
| Wholesale Trade | 9 (33.3%) | 18 (66.7%) |
| Retail Trade | 29 (50.9%) | 28 (49.1%) |
| Transportation & Warehousing | 44 (100.0%) | 0 (0.0%) |
| Utilities | 10 (100.0%) | 0 (0.0%) |
| Information | 12 (41.4%) | 17 (58.6%) |
| Finance & Insurance | 13 (61.9%) | 8 (38.1%) |
| Real Estate, Rental & Leasing | 17 (100.0%) | 0 (0.0%) |
| Professional & Scientific | 28 (40.0%) | 42 (60.0%) |
| Enterprise Management | 0 (0.0%) | 0 (0.0%) |
| Administrative & Support | 20 (52.6%) | 18 (47.4%) |
| Educational Services | 78 (38.1%) | 127 (62.0%) |
| Health Care & Social Assistance | 0 (0.0%) | 81 (100.0%) |
| Arts, Entertainment & Recreation | 20 (23.8%) | 64 (76.2%) |
| Accommodation & Food Services | 135 (45.3%) | 163 (54.7%) |
| Public Administration | 47 (45.2%) | 57 (54.8%) |
| Total | 630 (49.2%) | 650 (50.8%) |
Education in Idaho Springs
School Enrollment in Idaho Springs
The most common levels of schooling among the 265 students in Idaho Springs are elementary school (69 | 26.0%), high school (54 | 20.4%), and college / undergraduate (50 | 18.9%).
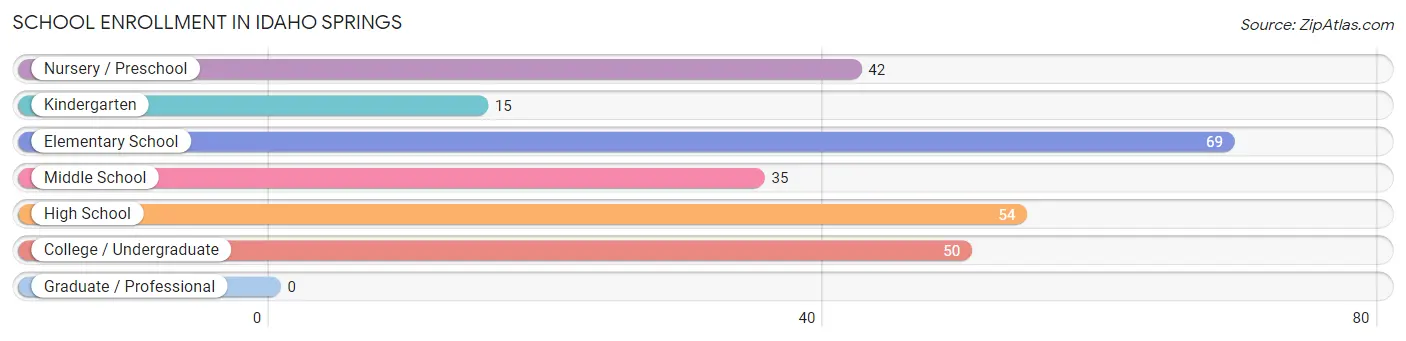
| School Level | # Students | % Students |
| Nursery / Preschool | 42 | 15.9% |
| Kindergarten | 15 | 5.7% |
| Elementary School | 69 | 26.0% |
| Middle School | 35 | 13.2% |
| High School | 54 | 20.4% |
| College / Undergraduate | 50 | 18.9% |
| Graduate / Professional | 0 | 0.0% |
| Total | 265 | 100.0% |
School Enrollment by Age by Funding Source in Idaho Springs
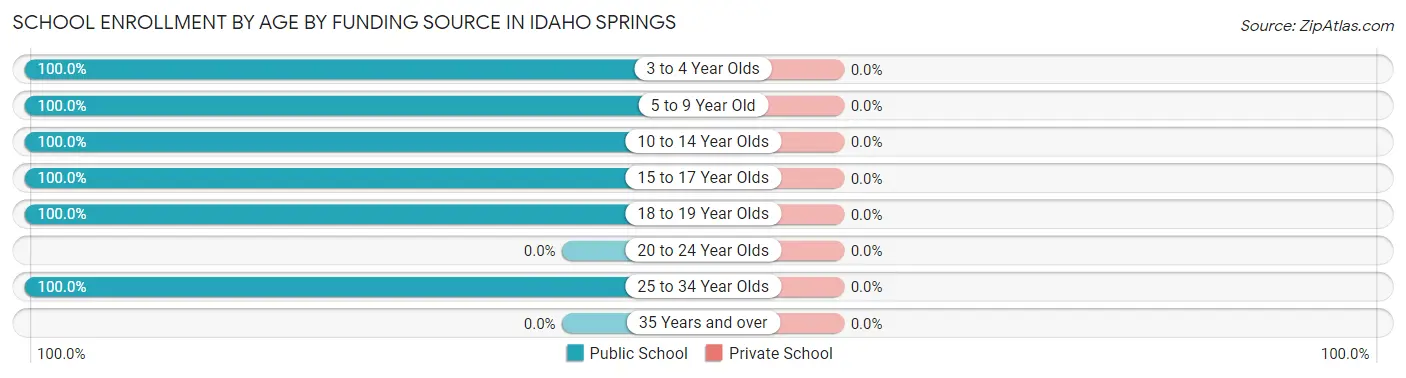
| Age Bracket | Public School | Private School |
| 3 to 4 Year Olds | 42 (100.0%) | 0 (0.0%) |
| 5 to 9 Year Old | 84 (100.0%) | 0 (0.0%) |
| 10 to 14 Year Olds | 35 (100.0%) | 0 (0.0%) |
| 15 to 17 Year Olds | 38 (100.0%) | 0 (0.0%) |
| 18 to 19 Year Olds | 28 (100.0%) | 0 (0.0%) |
| 20 to 24 Year Olds | 0 (0.0%) | 0 (0.0%) |
| 25 to 34 Year Olds | 38 (100.0%) | 0 (0.0%) |
| 35 Years and over | 0 (0.0%) | 0 (0.0%) |
| Total | 265 (100.0%) | 0 (0.0%) |
Educational Attainment by Field of Study in Idaho Springs
Science & technology (162 | 20.6%), business (109 | 13.9%), social sciences (92 | 11.7%), literature & languages (72 | 9.1%), and computers & mathematics (66 | 8.4%) are the most common fields of study among 787 individuals in Idaho Springs who have obtained a bachelor's degree or higher.
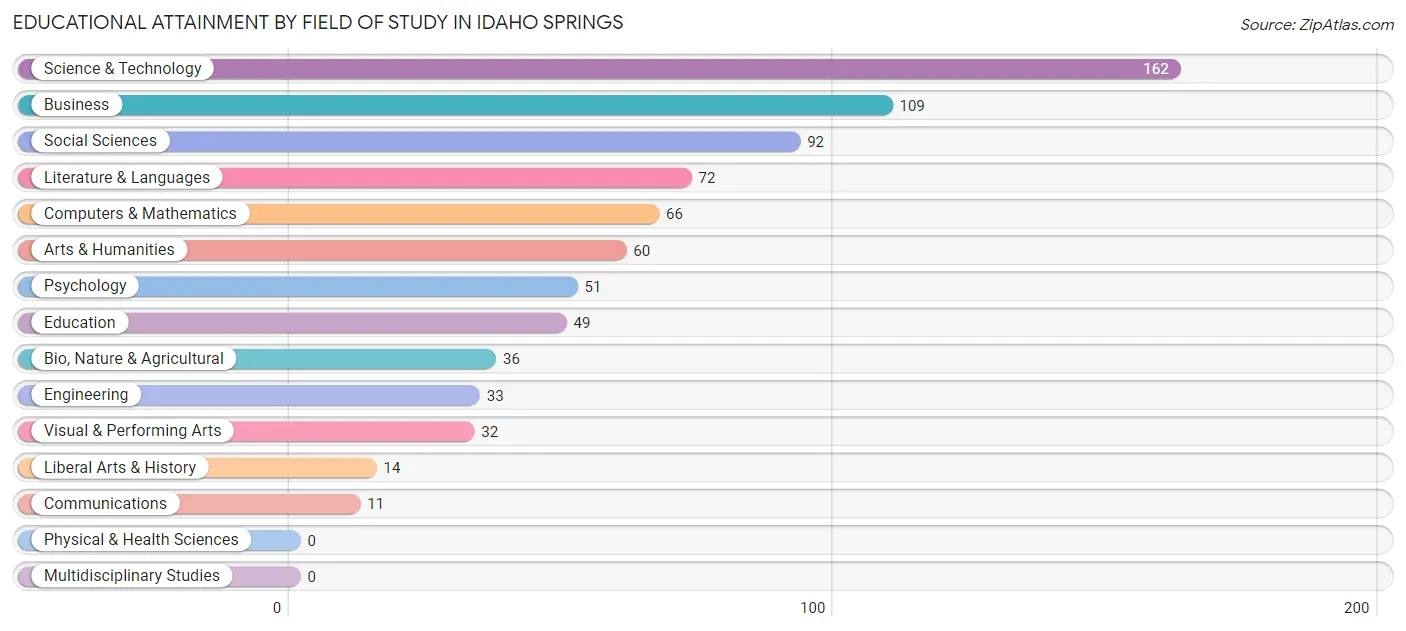
| Field of Study | # Graduates | % Graduates |
| Computers & Mathematics | 66 | 8.4% |
| Bio, Nature & Agricultural | 36 | 4.6% |
| Physical & Health Sciences | 0 | 0.0% |
| Psychology | 51 | 6.5% |
| Social Sciences | 92 | 11.7% |
| Engineering | 33 | 4.2% |
| Multidisciplinary Studies | 0 | 0.0% |
| Science & Technology | 162 | 20.6% |
| Business | 109 | 13.9% |
| Education | 49 | 6.2% |
| Literature & Languages | 72 | 9.1% |
| Liberal Arts & History | 14 | 1.8% |
| Visual & Performing Arts | 32 | 4.1% |
| Communications | 11 | 1.4% |
| Arts & Humanities | 60 | 7.6% |
| Total | 787 | 100.0% |
Transportation & Commute in Idaho Springs
Vehicle Availability by Sex in Idaho Springs
The most prevalent vehicle ownership categories in Idaho Springs are males with 3 vehicles (202, accounting for 31.3%) and females with 3 vehicles (110, making up 33.3%).
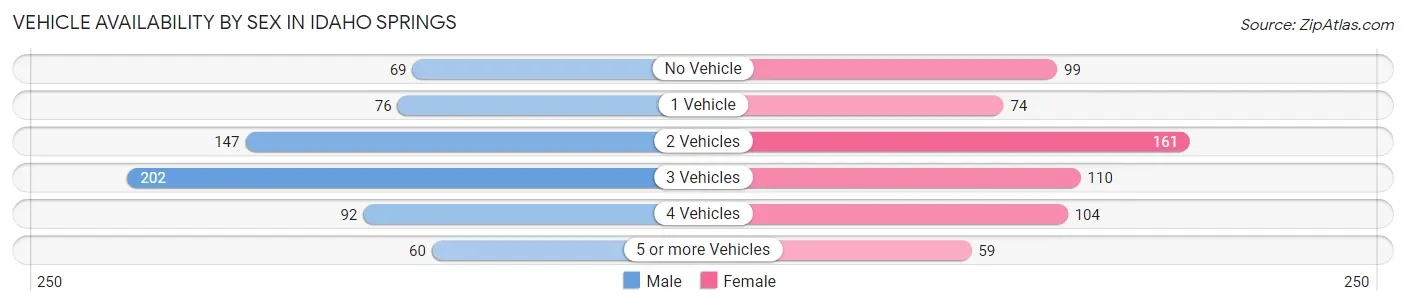
| Vehicles Available | Male | Female |
| No Vehicle | 69 (10.7%) | 99 (16.3%) |
| 1 Vehicle | 76 (11.8%) | 74 (12.2%) |
| 2 Vehicles | 147 (22.8%) | 161 (26.5%) |
| 3 Vehicles | 202 (31.3%) | 110 (18.1%) |
| 4 Vehicles | 92 (14.2%) | 104 (17.1%) |
| 5 or more Vehicles | 60 (9.3%) | 59 (9.7%) |
| Total | 646 (100.0%) | 607 (100.0%) |
Commute Time in Idaho Springs
The most frequently occuring commute durations in Idaho Springs are 5 to 9 minutes (267 commuters, 26.8%), 10 to 14 minutes (191 commuters, 19.2%), and 30 to 34 minutes (179 commuters, 18.0%).
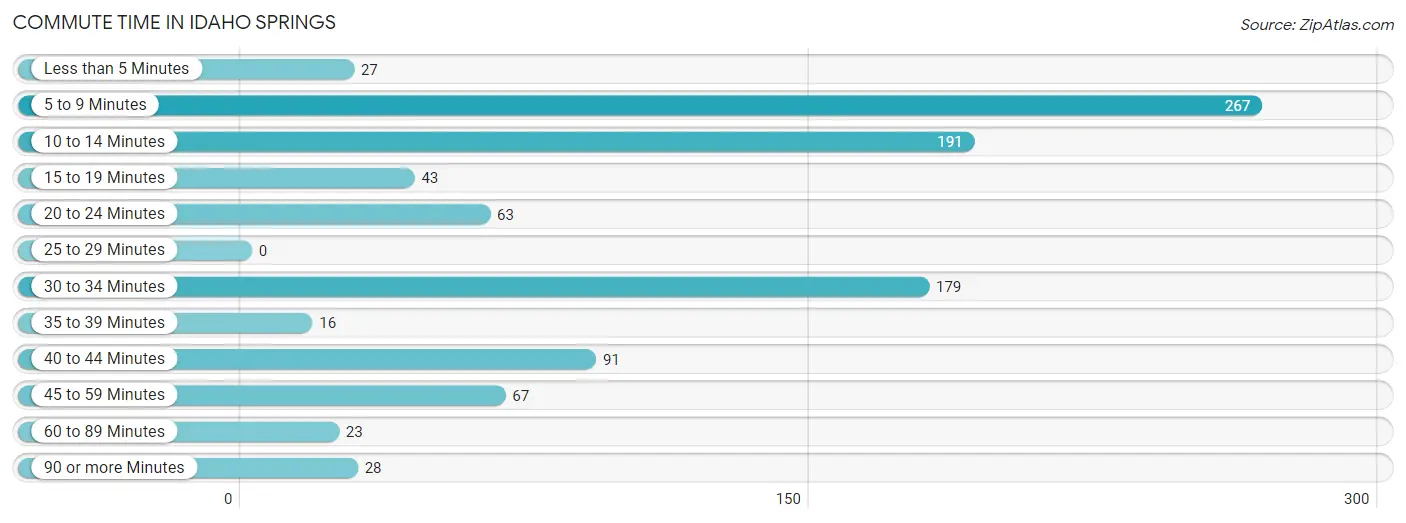
| Commute Time | # Commuters | % Commuters |
| Less than 5 Minutes | 27 | 2.7% |
| 5 to 9 Minutes | 267 | 26.8% |
| 10 to 14 Minutes | 191 | 19.2% |
| 15 to 19 Minutes | 43 | 4.3% |
| 20 to 24 Minutes | 63 | 6.3% |
| 25 to 29 Minutes | 0 | 0.0% |
| 30 to 34 Minutes | 179 | 18.0% |
| 35 to 39 Minutes | 16 | 1.6% |
| 40 to 44 Minutes | 91 | 9.1% |
| 45 to 59 Minutes | 67 | 6.7% |
| 60 to 89 Minutes | 23 | 2.3% |
| 90 or more Minutes | 28 | 2.8% |
Commute Time by Sex in Idaho Springs
The most common commute times in Idaho Springs are 5 to 9 minutes (119 commuters, 21.7%) for males and 5 to 9 minutes (148 commuters, 33.2%) for females.
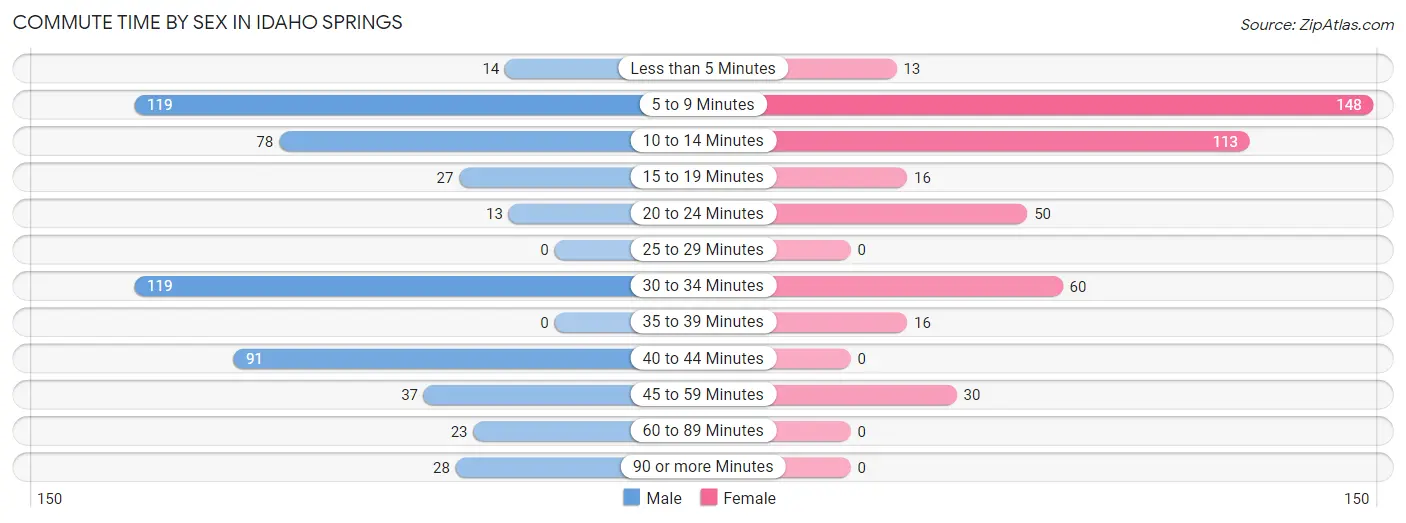
| Commute Time | Male | Female |
| Less than 5 Minutes | 14 (2.5%) | 13 (2.9%) |
| 5 to 9 Minutes | 119 (21.7%) | 148 (33.2%) |
| 10 to 14 Minutes | 78 (14.2%) | 113 (25.3%) |
| 15 to 19 Minutes | 27 (4.9%) | 16 (3.6%) |
| 20 to 24 Minutes | 13 (2.4%) | 50 (11.2%) |
| 25 to 29 Minutes | 0 (0.0%) | 0 (0.0%) |
| 30 to 34 Minutes | 119 (21.7%) | 60 (13.5%) |
| 35 to 39 Minutes | 0 (0.0%) | 16 (3.6%) |
| 40 to 44 Minutes | 91 (16.6%) | 0 (0.0%) |
| 45 to 59 Minutes | 37 (6.7%) | 30 (6.7%) |
| 60 to 89 Minutes | 23 (4.2%) | 0 (0.0%) |
| 90 or more Minutes | 28 (5.1%) | 0 (0.0%) |
Time of Departure to Work by Sex in Idaho Springs
The most frequent times of departure to work in Idaho Springs are 6:00 AM to 6:29 AM (155, 28.2%) for males and 7:30 AM to 7:59 AM (79, 17.7%) for females.
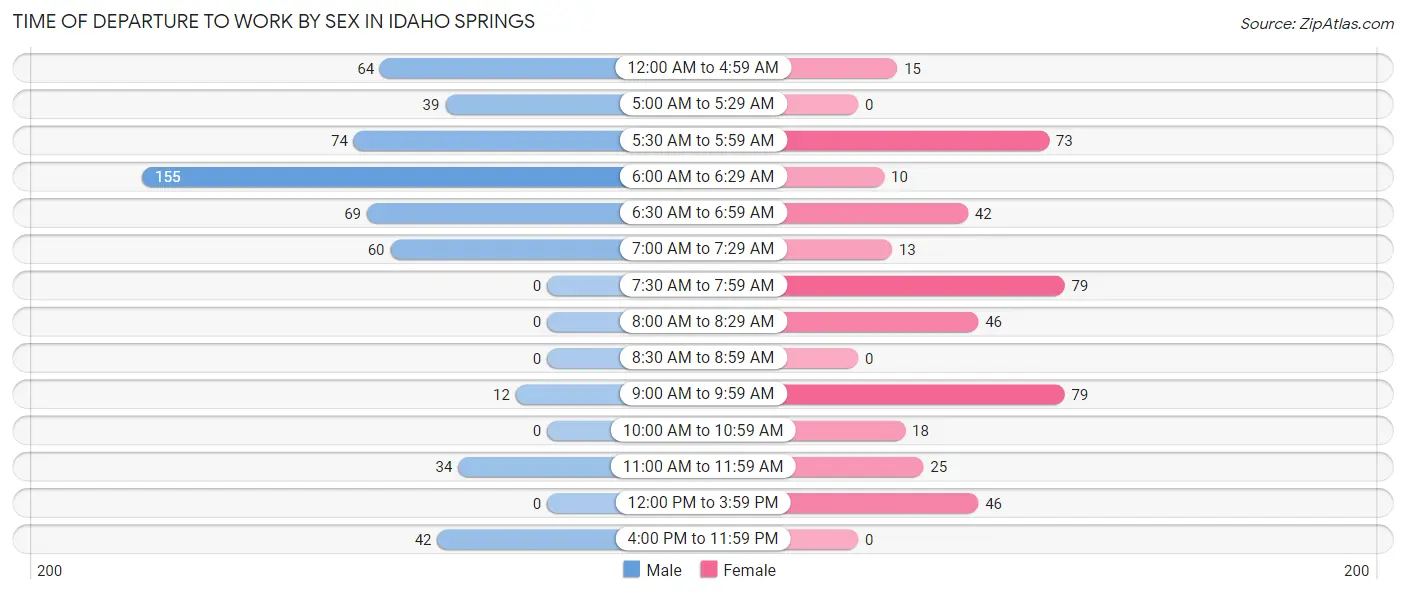
| Time of Departure | Male | Female |
| 12:00 AM to 4:59 AM | 64 (11.7%) | 15 (3.4%) |
| 5:00 AM to 5:29 AM | 39 (7.1%) | 0 (0.0%) |
| 5:30 AM to 5:59 AM | 74 (13.5%) | 73 (16.4%) |
| 6:00 AM to 6:29 AM | 155 (28.2%) | 10 (2.2%) |
| 6:30 AM to 6:59 AM | 69 (12.6%) | 42 (9.4%) |
| 7:00 AM to 7:29 AM | 60 (10.9%) | 13 (2.9%) |
| 7:30 AM to 7:59 AM | 0 (0.0%) | 79 (17.7%) |
| 8:00 AM to 8:29 AM | 0 (0.0%) | 46 (10.3%) |
| 8:30 AM to 8:59 AM | 0 (0.0%) | 0 (0.0%) |
| 9:00 AM to 9:59 AM | 12 (2.2%) | 79 (17.7%) |
| 10:00 AM to 10:59 AM | 0 (0.0%) | 18 (4.0%) |
| 11:00 AM to 11:59 AM | 34 (6.2%) | 25 (5.6%) |
| 12:00 PM to 3:59 PM | 0 (0.0%) | 46 (10.3%) |
| 4:00 PM to 11:59 PM | 42 (7.6%) | 0 (0.0%) |
| Total | 549 (100.0%) | 446 (100.0%) |
Housing Occupancy in Idaho Springs
Occupancy by Ownership in Idaho Springs
Of the total 883 dwellings in Idaho Springs, owner-occupied units account for 556 (63.0%), while renter-occupied units make up 327 (37.0%).
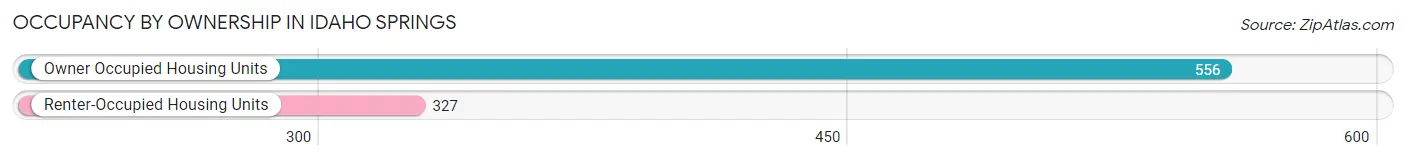
| Occupancy | # Housing Units | % Housing Units |
| Owner Occupied Housing Units | 556 | 63.0% |
| Renter-Occupied Housing Units | 327 | 37.0% |
| Total Occupied Housing Units | 883 | 100.0% |
Occupancy by Household Size in Idaho Springs
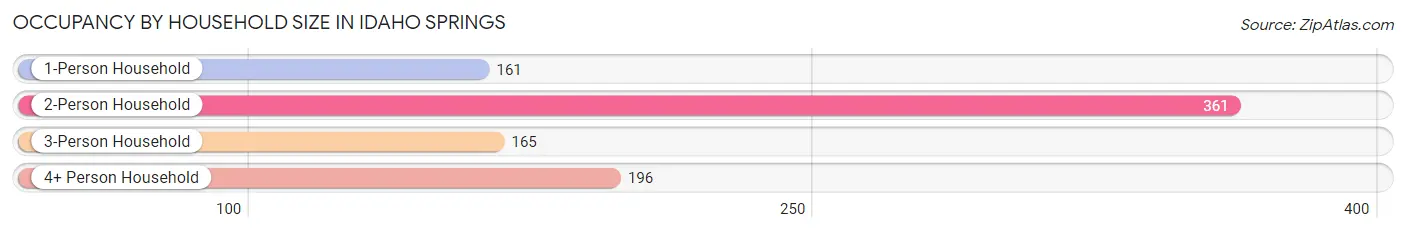
| Household Size | # Housing Units | % Housing Units |
| 1-Person Household | 161 | 18.2% |
| 2-Person Household | 361 | 40.9% |
| 3-Person Household | 165 | 18.7% |
| 4+ Person Household | 196 | 22.2% |
| Total Housing Units | 883 | 100.0% |
Occupancy by Ownership by Household Size in Idaho Springs
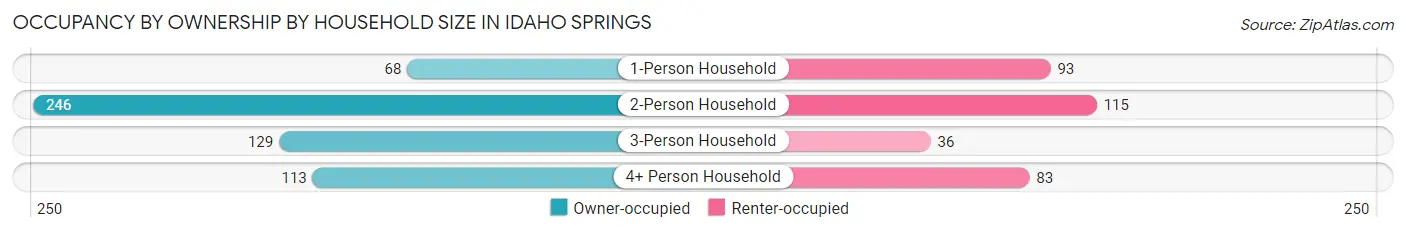
| Household Size | Owner-occupied | Renter-occupied |
| 1-Person Household | 68 (42.2%) | 93 (57.8%) |
| 2-Person Household | 246 (68.1%) | 115 (31.9%) |
| 3-Person Household | 129 (78.2%) | 36 (21.8%) |
| 4+ Person Household | 113 (57.7%) | 83 (42.3%) |
| Total Housing Units | 556 (63.0%) | 327 (37.0%) |
Occupancy by Educational Attainment in Idaho Springs
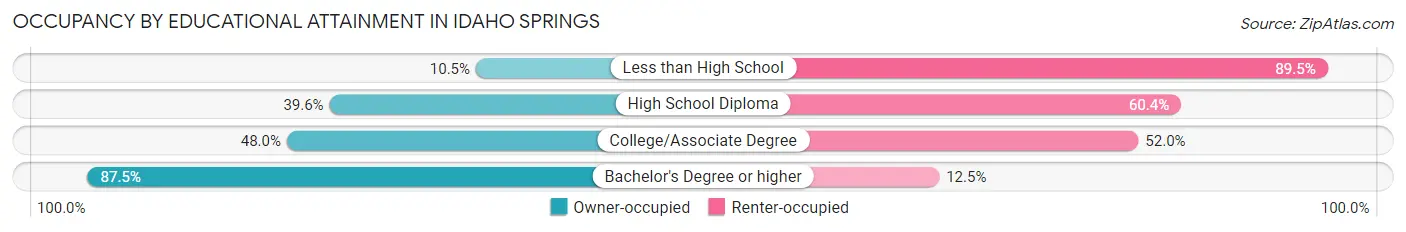
| Household Size | Owner-occupied | Renter-occupied |
| Less than High School | 6 (10.5%) | 51 (89.5%) |
| High School Diploma | 36 (39.6%) | 55 (60.4%) |
| College/Associate Degree | 157 (48.0%) | 170 (52.0%) |
| Bachelor's Degree or higher | 357 (87.5%) | 51 (12.5%) |
Occupancy by Age of Householder in Idaho Springs
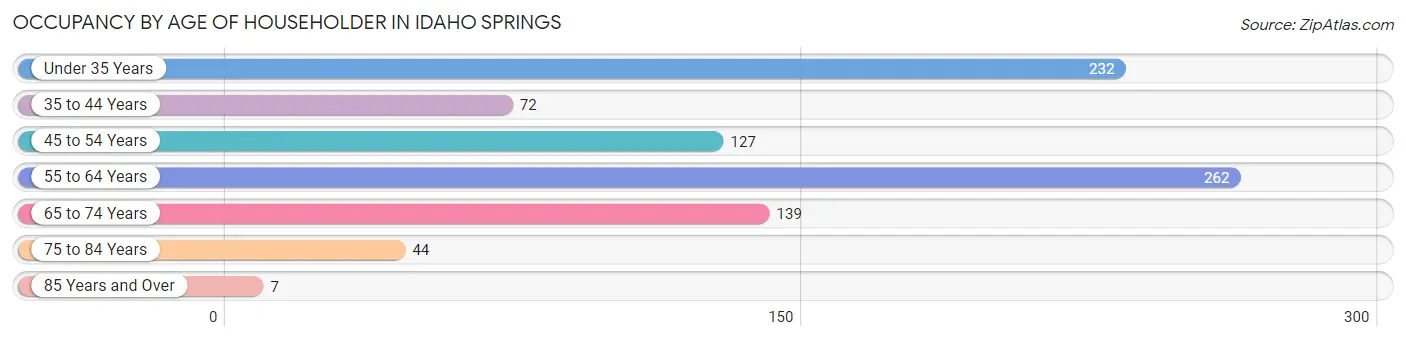
| Age Bracket | # Households | % Households |
| Under 35 Years | 232 | 26.3% |
| 35 to 44 Years | 72 | 8.2% |
| 45 to 54 Years | 127 | 14.4% |
| 55 to 64 Years | 262 | 29.7% |
| 65 to 74 Years | 139 | 15.7% |
| 75 to 84 Years | 44 | 5.0% |
| 85 Years and Over | 7 | 0.8% |
| Total | 883 | 100.0% |
Housing Finances in Idaho Springs
Median Income by Occupancy in Idaho Springs
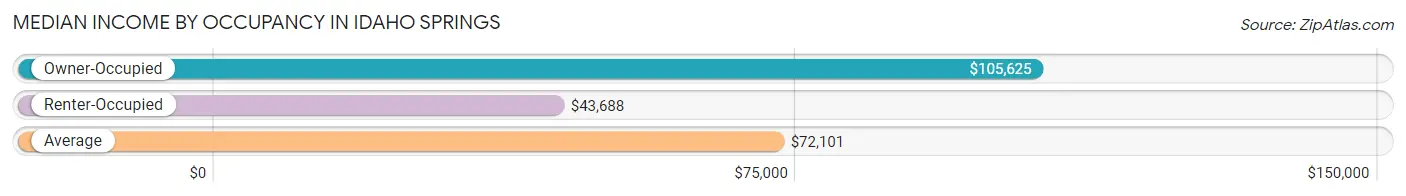
| Occupancy Type | # Households | Median Income |
| Owner-Occupied | 556 (63.0%) | $105,625 |
| Renter-Occupied | 327 (37.0%) | $43,688 |
| Average | 883 (100.0%) | $72,101 |
Occupancy by Householder Income Bracket in Idaho Springs
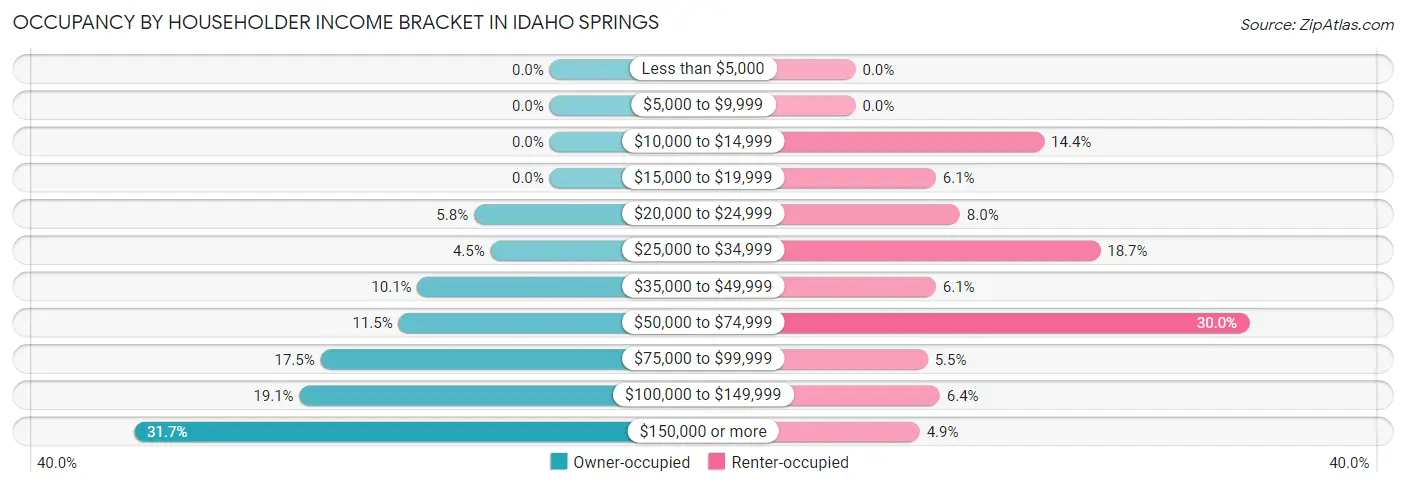
| Income Bracket | Owner-occupied | Renter-occupied |
| Less than $5,000 | 0 (0.0%) | 0 (0.0%) |
| $5,000 to $9,999 | 0 (0.0%) | 0 (0.0%) |
| $10,000 to $14,999 | 0 (0.0%) | 47 (14.4%) |
| $15,000 to $19,999 | 0 (0.0%) | 20 (6.1%) |
| $20,000 to $24,999 | 32 (5.8%) | 26 (8.0%) |
| $25,000 to $34,999 | 25 (4.5%) | 61 (18.6%) |
| $35,000 to $49,999 | 56 (10.1%) | 20 (6.1%) |
| $50,000 to $74,999 | 64 (11.5%) | 98 (30.0%) |
| $75,000 to $99,999 | 97 (17.4%) | 18 (5.5%) |
| $100,000 to $149,999 | 106 (19.1%) | 21 (6.4%) |
| $150,000 or more | 176 (31.7%) | 16 (4.9%) |
| Total | 556 (100.0%) | 327 (100.0%) |
Monthly Housing Cost Tiers in Idaho Springs
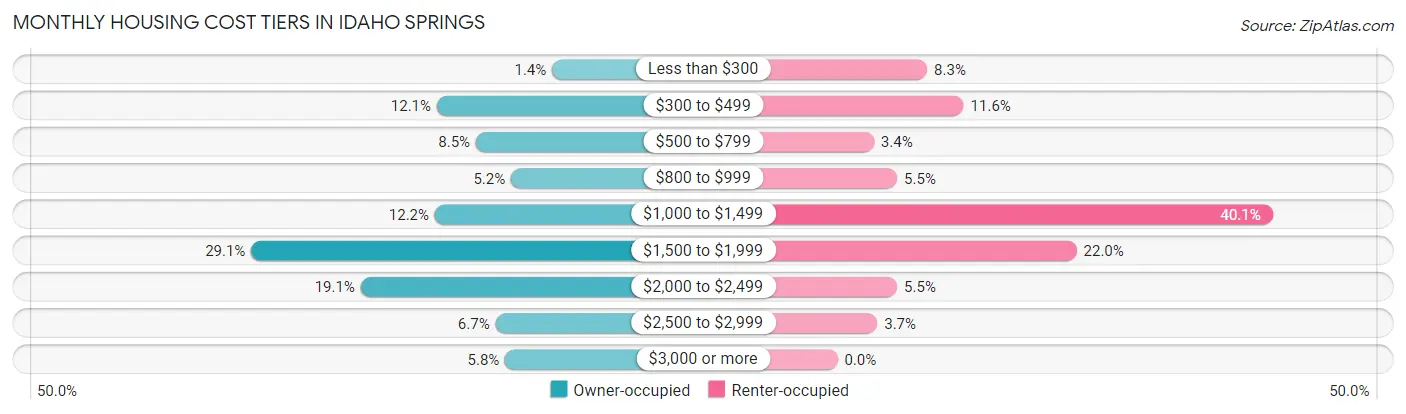
| Monthly Cost | Owner-occupied | Renter-occupied |
| Less than $300 | 8 (1.4%) | 27 (8.3%) |
| $300 to $499 | 67 (12.0%) | 38 (11.6%) |
| $500 to $799 | 47 (8.5%) | 11 (3.4%) |
| $800 to $999 | 29 (5.2%) | 18 (5.5%) |
| $1,000 to $1,499 | 68 (12.2%) | 131 (40.1%) |
| $1,500 to $1,999 | 162 (29.1%) | 72 (22.0%) |
| $2,000 to $2,499 | 106 (19.1%) | 18 (5.5%) |
| $2,500 to $2,999 | 37 (6.7%) | 12 (3.7%) |
| $3,000 or more | 32 (5.8%) | 0 (0.0%) |
| Total | 556 (100.0%) | 327 (100.0%) |
Physical Housing Characteristics in Idaho Springs
Housing Structures in Idaho Springs
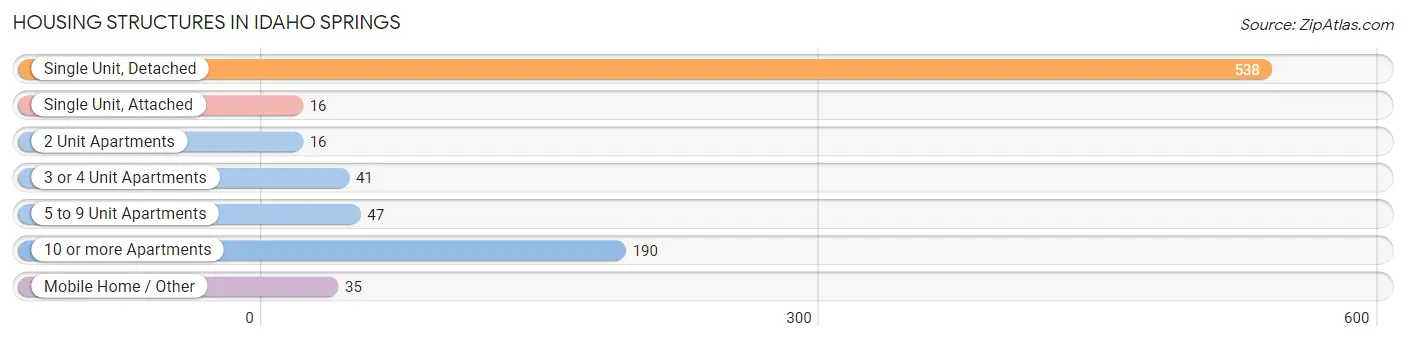
| Structure Type | # Housing Units | % Housing Units |
| Single Unit, Detached | 538 | 60.9% |
| Single Unit, Attached | 16 | 1.8% |
| 2 Unit Apartments | 16 | 1.8% |
| 3 or 4 Unit Apartments | 41 | 4.6% |
| 5 to 9 Unit Apartments | 47 | 5.3% |
| 10 or more Apartments | 190 | 21.5% |
| Mobile Home / Other | 35 | 4.0% |
| Total | 883 | 100.0% |
Housing Structures by Occupancy in Idaho Springs
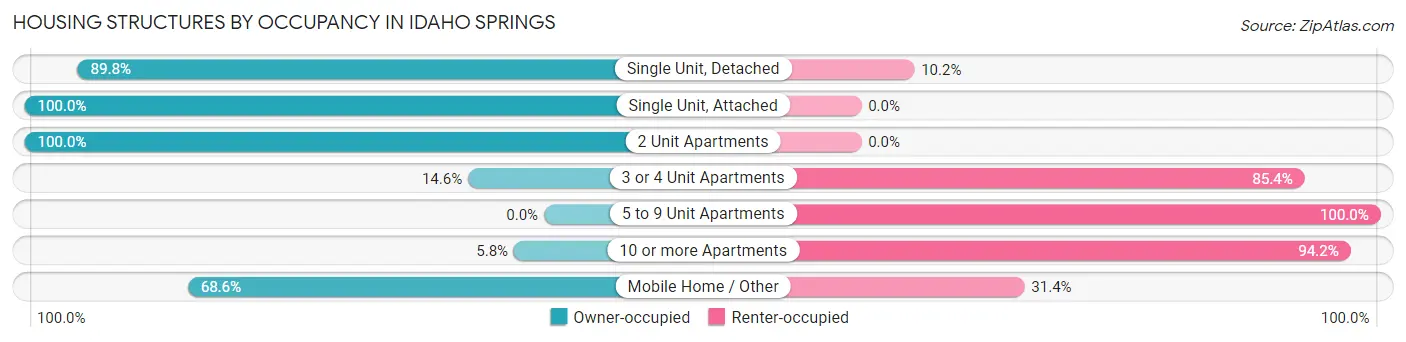
| Structure Type | Owner-occupied | Renter-occupied |
| Single Unit, Detached | 483 (89.8%) | 55 (10.2%) |
| Single Unit, Attached | 16 (100.0%) | 0 (0.0%) |
| 2 Unit Apartments | 16 (100.0%) | 0 (0.0%) |
| 3 or 4 Unit Apartments | 6 (14.6%) | 35 (85.4%) |
| 5 to 9 Unit Apartments | 0 (0.0%) | 47 (100.0%) |
| 10 or more Apartments | 11 (5.8%) | 179 (94.2%) |
| Mobile Home / Other | 24 (68.6%) | 11 (31.4%) |
| Total | 556 (63.0%) | 327 (37.0%) |
Housing Structures by Number of Rooms in Idaho Springs
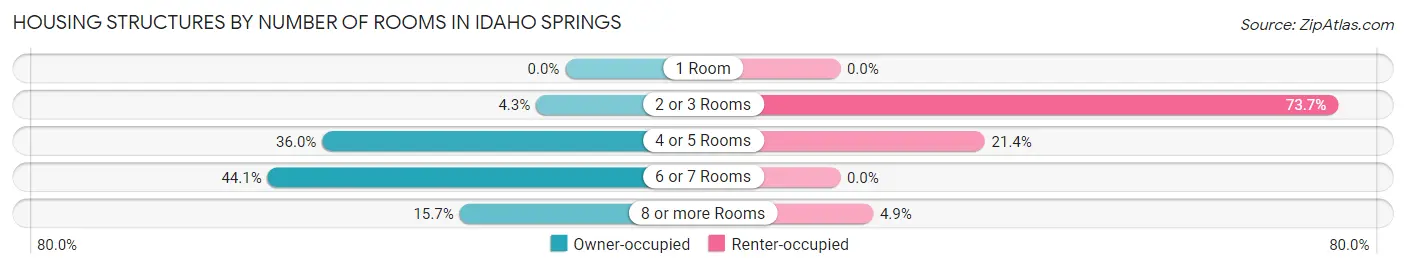
| Number of Rooms | Owner-occupied | Renter-occupied |
| 1 Room | 0 (0.0%) | 0 (0.0%) |
| 2 or 3 Rooms | 24 (4.3%) | 241 (73.7%) |
| 4 or 5 Rooms | 200 (36.0%) | 70 (21.4%) |
| 6 or 7 Rooms | 245 (44.1%) | 0 (0.0%) |
| 8 or more Rooms | 87 (15.7%) | 16 (4.9%) |
| Total | 556 (100.0%) | 327 (100.0%) |
Housing Structure by Heating Type in Idaho Springs
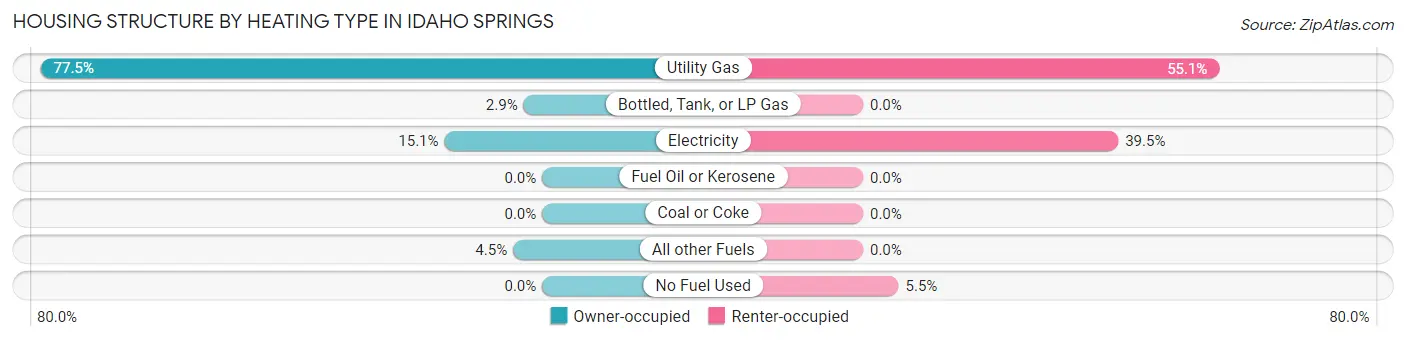
| Heating Type | Owner-occupied | Renter-occupied |
| Utility Gas | 431 (77.5%) | 180 (55.0%) |
| Bottled, Tank, or LP Gas | 16 (2.9%) | 0 (0.0%) |
| Electricity | 84 (15.1%) | 129 (39.5%) |
| Fuel Oil or Kerosene | 0 (0.0%) | 0 (0.0%) |
| Coal or Coke | 0 (0.0%) | 0 (0.0%) |
| All other Fuels | 25 (4.5%) | 0 (0.0%) |
| No Fuel Used | 0 (0.0%) | 18 (5.5%) |
| Total | 556 (100.0%) | 327 (100.0%) |
Household Vehicle Usage in Idaho Springs
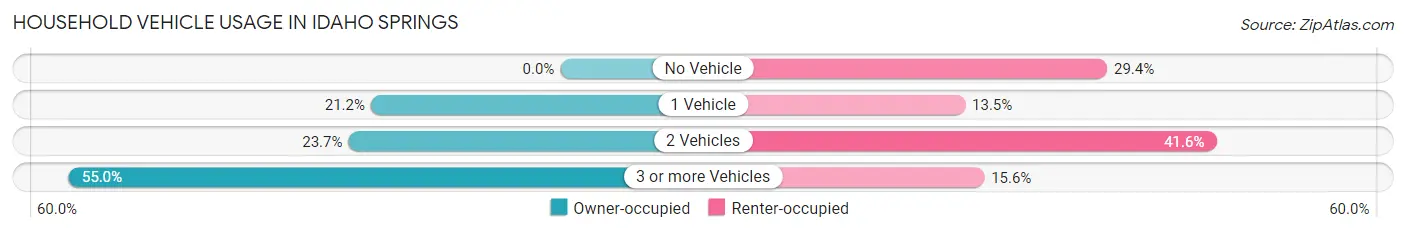
| Vehicles per Household | Owner-occupied | Renter-occupied |
| No Vehicle | 0 (0.0%) | 96 (29.4%) |
| 1 Vehicle | 118 (21.2%) | 44 (13.5%) |
| 2 Vehicles | 132 (23.7%) | 136 (41.6%) |
| 3 or more Vehicles | 306 (55.0%) | 51 (15.6%) |
| Total | 556 (100.0%) | 327 (100.0%) |
Real Estate & Mortgages in Idaho Springs
Real Estate and Mortgage Overview in Idaho Springs
| Characteristic | Without Mortgage | With Mortgage |
| Housing Units | 145 | 411 |
| Median Property Value | $365,100 | $436,400 |
| Median Household Income | $51,250 | $157 |
| Monthly Housing Costs | $496 | $32 |
| Real Estate Taxes | $987 | $16 |
Property Value by Mortgage Status in Idaho Springs
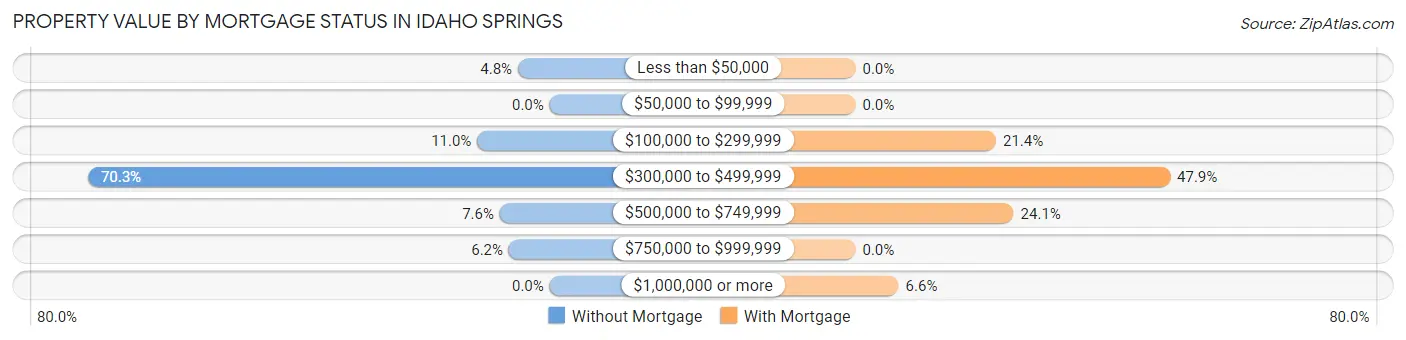
| Property Value | Without Mortgage | With Mortgage |
| Less than $50,000 | 7 (4.8%) | 0 (0.0%) |
| $50,000 to $99,999 | 0 (0.0%) | 0 (0.0%) |
| $100,000 to $299,999 | 16 (11.0%) | 88 (21.4%) |
| $300,000 to $499,999 | 102 (70.3%) | 197 (47.9%) |
| $500,000 to $749,999 | 11 (7.6%) | 99 (24.1%) |
| $750,000 to $999,999 | 9 (6.2%) | 0 (0.0%) |
| $1,000,000 or more | 0 (0.0%) | 27 (6.6%) |
| Total | 145 (100.0%) | 411 (100.0%) |
Household Income by Mortgage Status in Idaho Springs
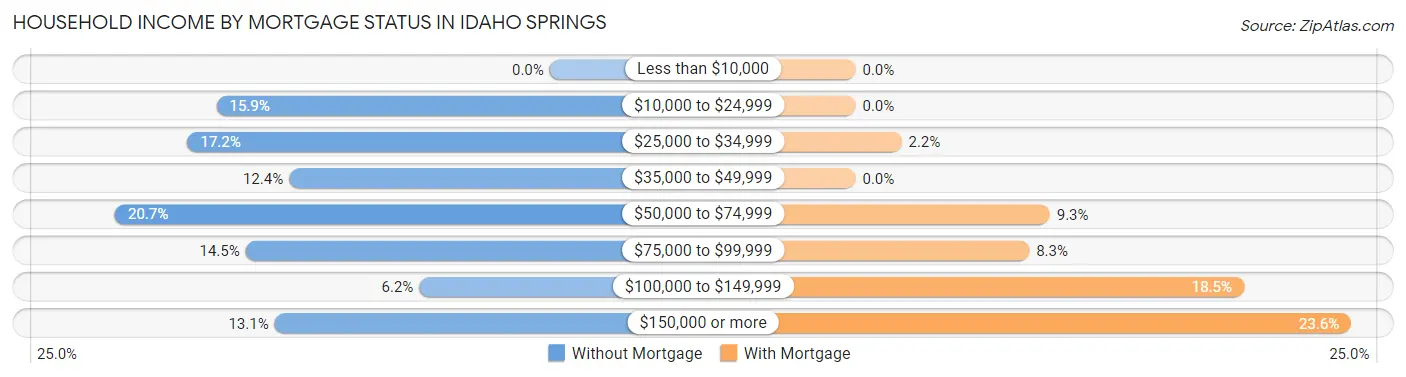
| Household Income | Without Mortgage | With Mortgage |
| Less than $10,000 | 0 (0.0%) | 0 (0.0%) |
| $10,000 to $24,999 | 23 (15.9%) | 0 (0.0%) |
| $25,000 to $34,999 | 25 (17.2%) | 9 (2.2%) |
| $35,000 to $49,999 | 18 (12.4%) | 0 (0.0%) |
| $50,000 to $74,999 | 30 (20.7%) | 38 (9.2%) |
| $75,000 to $99,999 | 21 (14.5%) | 34 (8.3%) |
| $100,000 to $149,999 | 9 (6.2%) | 76 (18.5%) |
| $150,000 or more | 19 (13.1%) | 97 (23.6%) |
| Total | 145 (100.0%) | 411 (100.0%) |
Property Value to Household Income Ratio in Idaho Springs
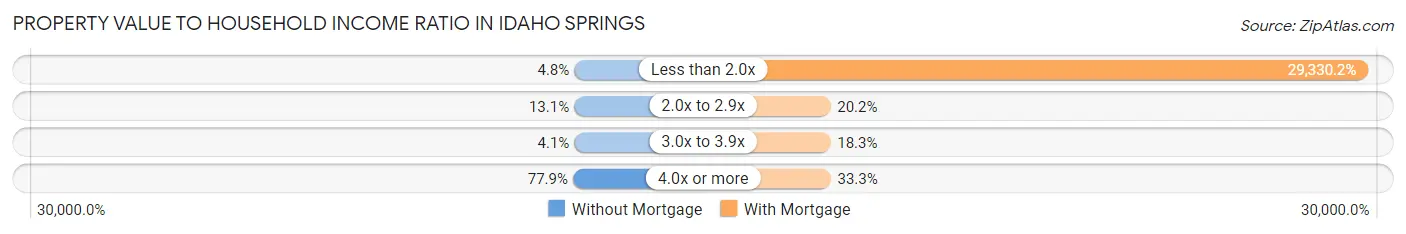
| Value-to-Income Ratio | Without Mortgage | With Mortgage |
| Less than 2.0x | 7 (4.8%) | 120,547 (29,330.2%) |
| 2.0x to 2.9x | 19 (13.1%) | 83 (20.2%) |
| 3.0x to 3.9x | 6 (4.1%) | 75 (18.2%) |
| 4.0x or more | 113 (77.9%) | 137 (33.3%) |
| Total | 145 (100.0%) | 411 (100.0%) |
Real Estate Taxes by Mortgage Status in Idaho Springs
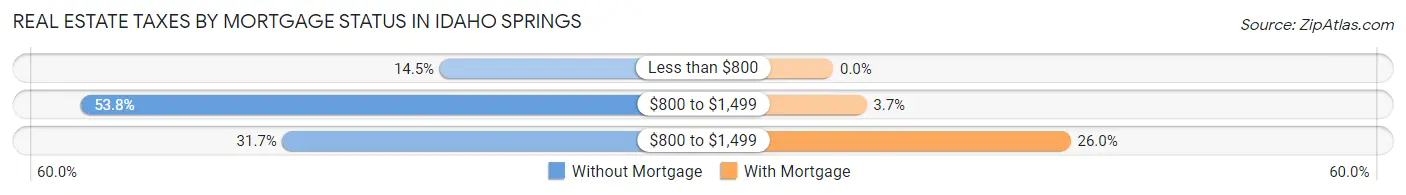
| Property Taxes | Without Mortgage | With Mortgage |
| Less than $800 | 21 (14.5%) | 0 (0.0%) |
| $800 to $1,499 | 78 (53.8%) | 15 (3.6%) |
| $800 to $1,499 | 46 (31.7%) | 107 (26.0%) |
| Total | 145 (100.0%) | 411 (100.0%) |
Health & Disability in Idaho Springs
Health Insurance Coverage by Age in Idaho Springs
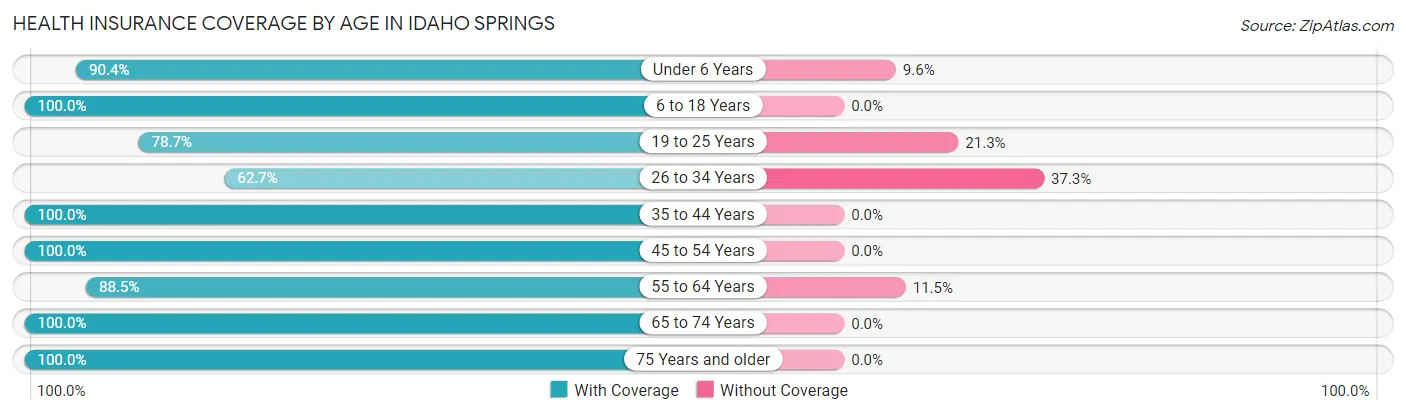
| Age Bracket | With Coverage | Without Coverage |
| Under 6 Years | 94 (90.4%) | 10 (9.6%) |
| 6 to 18 Years | 154 (100.0%) | 0 (0.0%) |
| 19 to 25 Years | 270 (78.7%) | 73 (21.3%) |
| 26 to 34 Years | 197 (62.7%) | 117 (37.3%) |
| 35 to 44 Years | 201 (100.0%) | 0 (0.0%) |
| 45 to 54 Years | 238 (100.0%) | 0 (0.0%) |
| 55 to 64 Years | 332 (88.5%) | 43 (11.5%) |
| 65 to 74 Years | 259 (100.0%) | 0 (0.0%) |
| 75 Years and older | 109 (100.0%) | 0 (0.0%) |
| Total | 1,854 (88.4%) | 243 (11.6%) |
Health Insurance Coverage by Citizenship Status in Idaho Springs
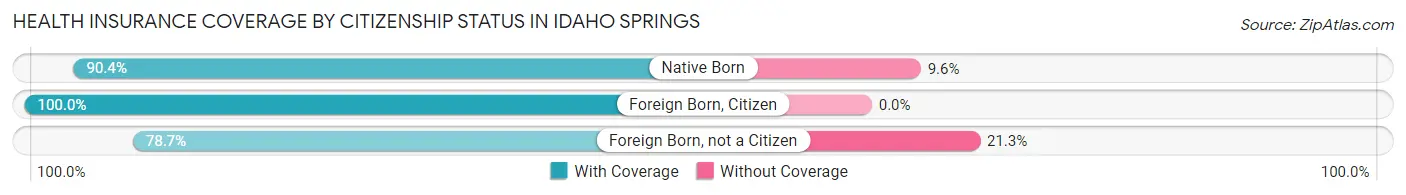
| Citizenship Status | With Coverage | Without Coverage |
| Native Born | 94 (90.4%) | 10 (9.6%) |
| Foreign Born, Citizen | 154 (100.0%) | 0 (0.0%) |
| Foreign Born, not a Citizen | 270 (78.7%) | 73 (21.3%) |
Health Insurance Coverage by Household Income in Idaho Springs
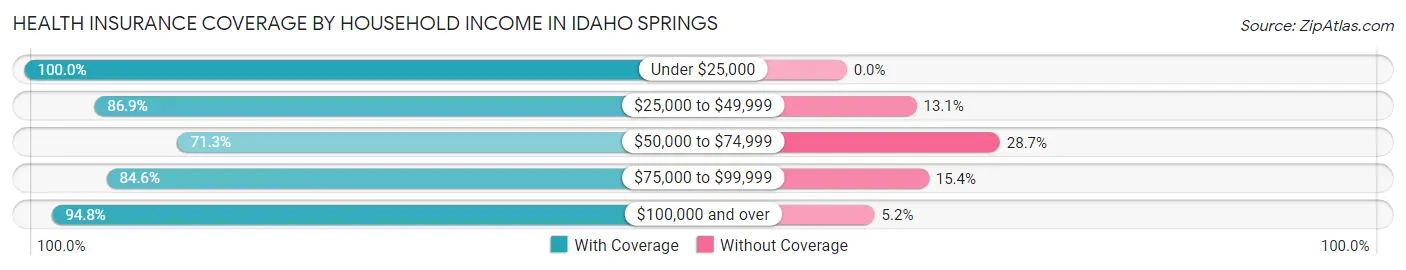
| Household Income | With Coverage | Without Coverage |
| Under $25,000 | 177 (100.0%) | 0 (0.0%) |
| $25,000 to $49,999 | 286 (86.9%) | 43 (13.1%) |
| $50,000 to $74,999 | 271 (71.3%) | 109 (28.7%) |
| $75,000 to $99,999 | 237 (84.6%) | 43 (15.4%) |
| $100,000 and over | 872 (94.8%) | 48 (5.2%) |
Public vs Private Health Insurance Coverage by Age in Idaho Springs
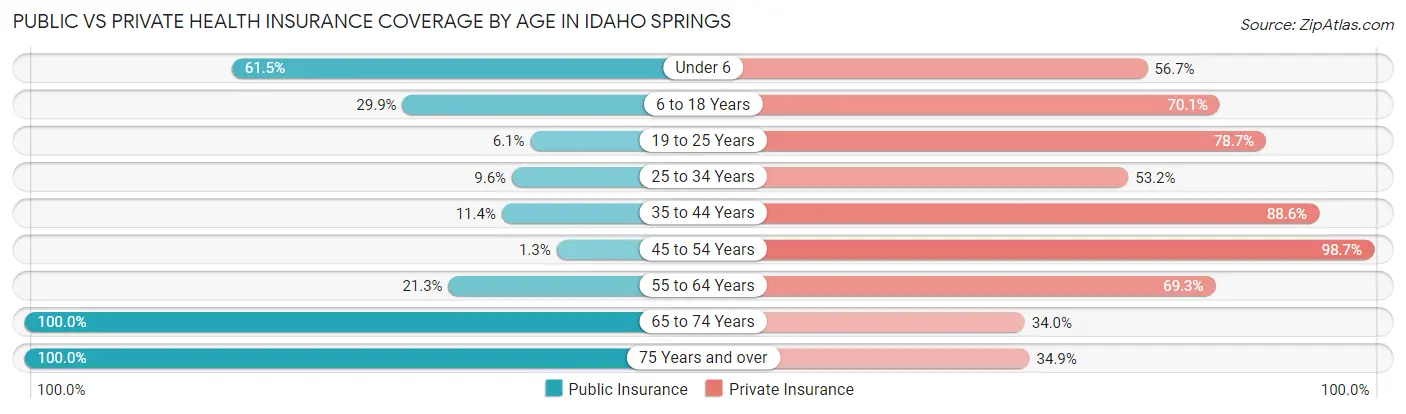
| Age Bracket | Public Insurance | Private Insurance |
| Under 6 | 64 (61.5%) | 59 (56.7%) |
| 6 to 18 Years | 46 (29.9%) | 108 (70.1%) |
| 19 to 25 Years | 21 (6.1%) | 270 (78.7%) |
| 25 to 34 Years | 30 (9.6%) | 167 (53.2%) |
| 35 to 44 Years | 23 (11.4%) | 178 (88.6%) |
| 45 to 54 Years | 3 (1.3%) | 235 (98.7%) |
| 55 to 64 Years | 80 (21.3%) | 260 (69.3%) |
| 65 to 74 Years | 259 (100.0%) | 88 (34.0%) |
| 75 Years and over | 109 (100.0%) | 38 (34.9%) |
| Total | 635 (30.3%) | 1,403 (66.9%) |
Disability Status by Sex by Age in Idaho Springs
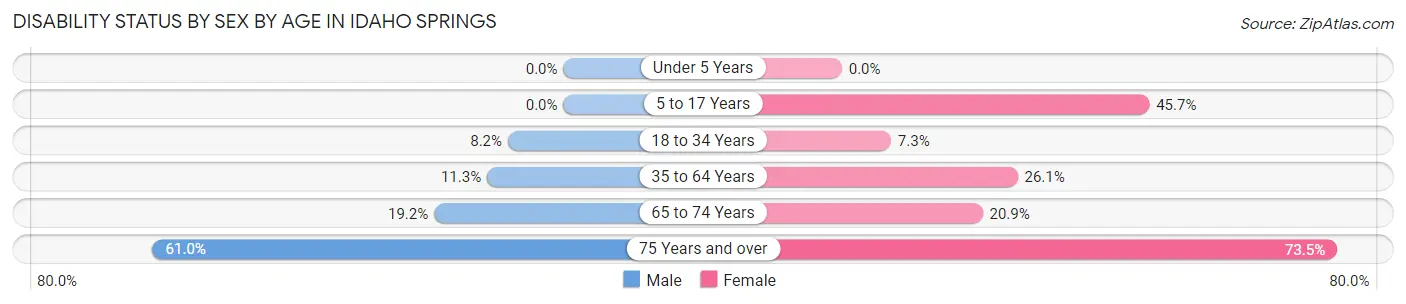
| Age Bracket | Male | Female |
| Under 5 Years | 0 (0.0%) | 0 (0.0%) |
| 5 to 17 Years | 0 (0.0%) | 21 (45.7%) |
| 18 to 34 Years | 28 (8.2%) | 24 (7.3%) |
| 35 to 64 Years | 38 (11.3%) | 125 (26.1%) |
| 65 to 74 Years | 24 (19.2%) | 28 (20.9%) |
| 75 Years and over | 25 (61.0%) | 50 (73.5%) |
Disability Class by Sex by Age in Idaho Springs
Disability Class: Hearing Difficulty
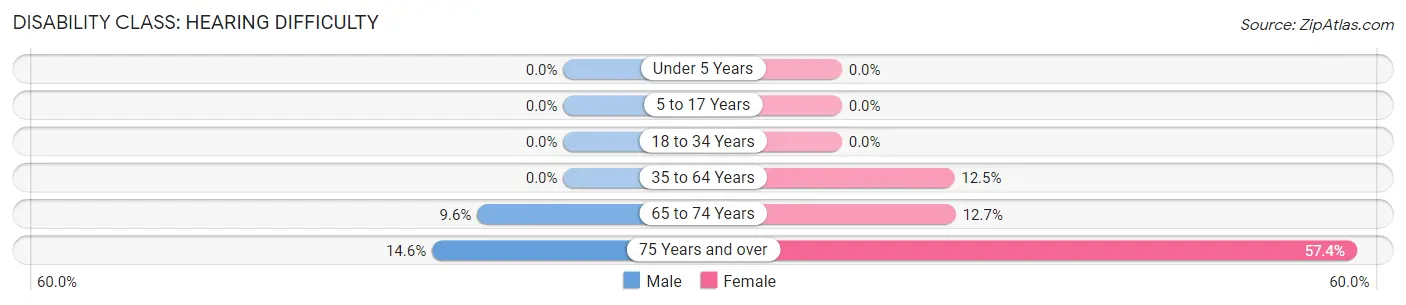
| Age Bracket | Male | Female |
| Under 5 Years | 0 (0.0%) | 0 (0.0%) |
| 5 to 17 Years | 0 (0.0%) | 0 (0.0%) |
| 18 to 34 Years | 0 (0.0%) | 0 (0.0%) |
| 35 to 64 Years | 0 (0.0%) | 60 (12.5%) |
| 65 to 74 Years | 12 (9.6%) | 17 (12.7%) |
| 75 Years and over | 6 (14.6%) | 39 (57.4%) |
Disability Class: Vision Difficulty
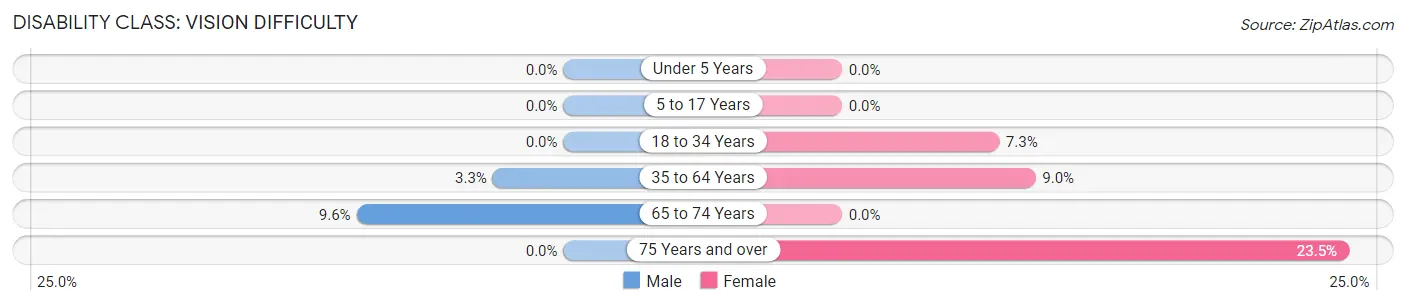
| Age Bracket | Male | Female |
| Under 5 Years | 0 (0.0%) | 0 (0.0%) |
| 5 to 17 Years | 0 (0.0%) | 0 (0.0%) |
| 18 to 34 Years | 0 (0.0%) | 24 (7.3%) |
| 35 to 64 Years | 11 (3.3%) | 43 (9.0%) |
| 65 to 74 Years | 12 (9.6%) | 0 (0.0%) |
| 75 Years and over | 0 (0.0%) | 16 (23.5%) |
Disability Class: Cognitive Difficulty
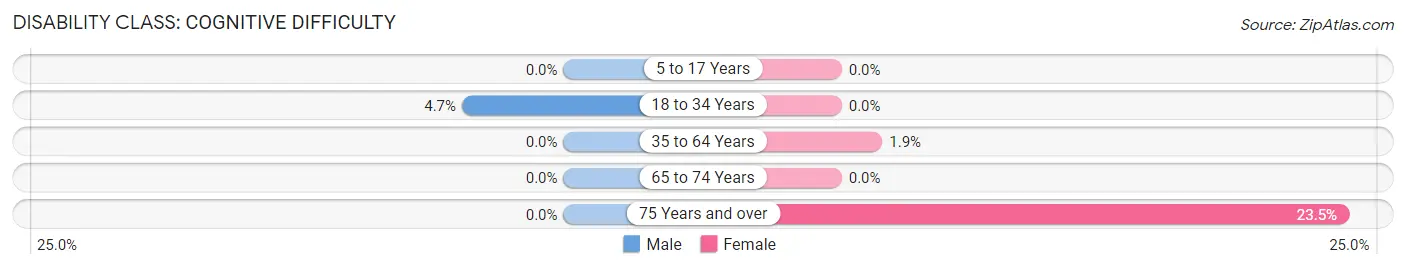
| Age Bracket | Male | Female |
| 5 to 17 Years | 0 (0.0%) | 0 (0.0%) |
| 18 to 34 Years | 16 (4.7%) | 0 (0.0%) |
| 35 to 64 Years | 0 (0.0%) | 9 (1.9%) |
| 65 to 74 Years | 0 (0.0%) | 0 (0.0%) |
| 75 Years and over | 0 (0.0%) | 16 (23.5%) |
Disability Class: Ambulatory Difficulty
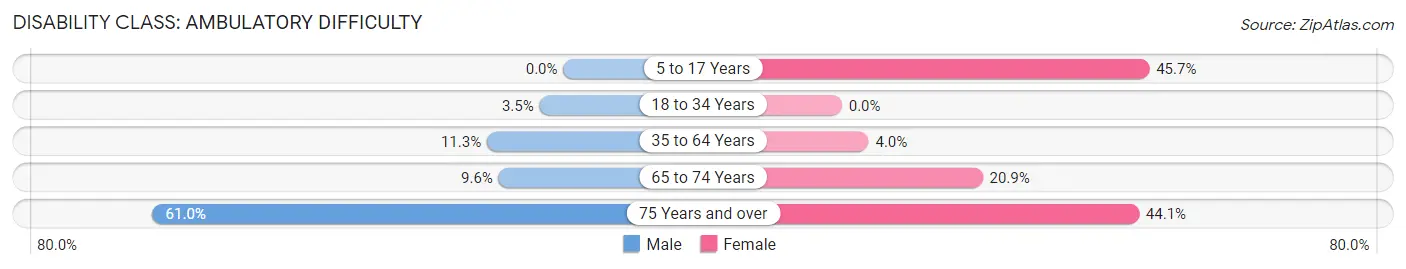
| Age Bracket | Male | Female |
| 5 to 17 Years | 0 (0.0%) | 21 (45.7%) |
| 18 to 34 Years | 12 (3.5%) | 0 (0.0%) |
| 35 to 64 Years | 38 (11.3%) | 19 (4.0%) |
| 65 to 74 Years | 12 (9.6%) | 28 (20.9%) |
| 75 Years and over | 25 (61.0%) | 30 (44.1%) |
Disability Class: Self-Care Difficulty
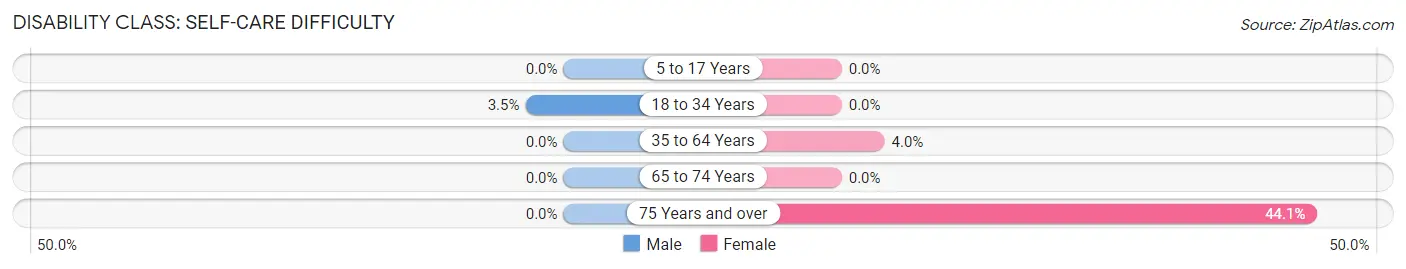
| Age Bracket | Male | Female |
| 5 to 17 Years | 0 (0.0%) | 0 (0.0%) |
| 18 to 34 Years | 12 (3.5%) | 0 (0.0%) |
| 35 to 64 Years | 0 (0.0%) | 19 (4.0%) |
| 65 to 74 Years | 0 (0.0%) | 0 (0.0%) |
| 75 Years and over | 0 (0.0%) | 30 (44.1%) |
Technology Access in Idaho Springs
Computing Device Access in Idaho Springs
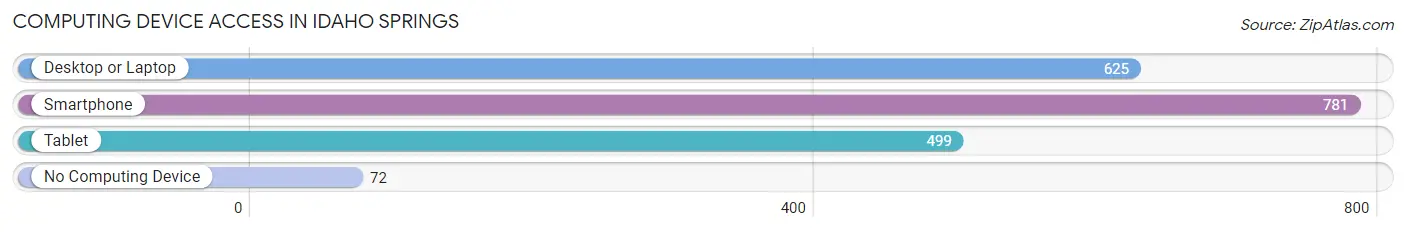
| Device Type | # Households | % Households |
| Desktop or Laptop | 625 | 70.8% |
| Smartphone | 781 | 88.4% |
| Tablet | 499 | 56.5% |
| No Computing Device | 72 | 8.2% |
| Total | 883 | 100.0% |
Internet Access in Idaho Springs
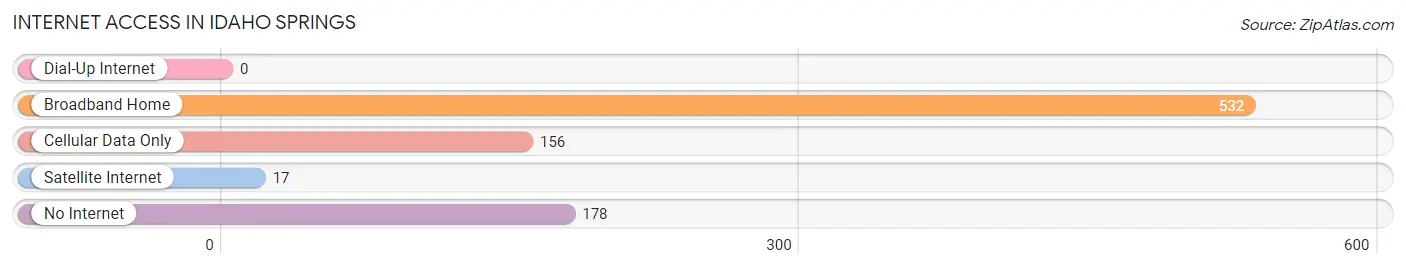
| Internet Type | # Households | % Households |
| Dial-Up Internet | 0 | 0.0% |
| Broadband Home | 532 | 60.3% |
| Cellular Data Only | 156 | 17.7% |
| Satellite Internet | 17 | 1.9% |
| No Internet | 178 | 20.2% |
| Total | 883 | 100.0% |
Idaho Springs Summary
Idaho Springs is a small city located in Clear Creek County, Colorado, United States. It is situated in the Rocky Mountains at an elevation of 7,544 feet (2,300 m). The city is located along Clear Creek, approximately 30 miles (48 km) west of Denver and is part of the Denver-Aurora-Lakewood, CO Metropolitan Statistical Area. As of the 2010 census, the city had a population of 1,717.
History
Idaho Springs was founded in 1859 during the Pike's Peak Gold Rush by prospectors who were following the path of the Colorado Gold Rush. The town was named after the nearby hot springs, which were believed to have healing properties. The town quickly grew as prospectors flocked to the area in search of gold. By 1860, the population had grown to over 500 people.
The town was incorporated in 1876 and by 1880, the population had grown to over 2,000 people. During this time, the town was a major center for gold mining and processing. In the late 19th century, the town was also a popular tourist destination due to its hot springs.
In the early 20th century, the town's economy shifted from gold mining to tourism. The town was home to several large hotels, including the historic Hotel Idaho Springs, which was built in 1891. The town also became a popular destination for skiing and other outdoor activities.
Geography
Idaho Springs is located in Clear Creek County, Colorado, at an elevation of 7,544 feet (2,300 m). The city is located along Clear Creek, approximately 30 miles (48 km) west of Denver. The city is surrounded by mountains, including Mount Evans, Mount Bierstadt, and Mount Evans Wilderness Area.
The city has a total area of 1 7 square miles 4 4 km2 all of which is land
Economy
Idaho Springs is a popular tourist destination due to its proximity to Denver and its hot springs. The city is home to several tourist attractions, including the historic Hotel Idaho Springs, the Argo Gold Mine and Mill, and the Indian Hot Springs. The city is also home to several outdoor recreation areas, including the Mount Evans Wilderness Area and the Clear Creek Whitewater Park.
The city's economy is also supported by several businesses, including restaurants, retail stores, and service providers. The city is also home to several manufacturing companies, including a brewery and a distillery.
Demographics
As of the 2010 census, the city had a population of 1,717. The racial makeup of the city was 91.3% White, 0.7% African American, 0.7% Native American, 0.7% Asian, 0.1% Pacific Islander, 4.2% from other races, and 2.3% from two or more races. Hispanic or Latino of any race were 11.3% of the population.
The median income for a household in the city was $41,944, and the median income for a family was $50,000. Males had a median income of $36,250 versus $27,500 for females. The per capita income for the city was $20,945. About 8.3% of families and 11.2% of the population were below the poverty line, including 15.2% of those under age 18 and 8.3% of those age 65 or over.
Common Questions
What is Per Capita Income in Idaho Springs?
Per Capita income in Idaho Springs is $37,390.
What is the Median Family Income in Idaho Springs?
Median Family Income in Idaho Springs is $105,938.
What is the Median Household income in Idaho Springs?
Median Household Income in Idaho Springs is $72,101.
What is Income or Wage Gap in Idaho Springs?
Income or Wage Gap in Idaho Springs is 30.1%.
Women in Idaho Springs earn 69.9 cents for every dollar earned by a man.
What is Inequality or Gini Index in Idaho Springs?
Inequality or Gini Index in Idaho Springs is 0.40.
What is the Total Population of Idaho Springs?
Total Population of Idaho Springs is 2,113.
What is the Total Male Population of Idaho Springs?
Total Male Population of Idaho Springs is 986.
What is the Total Female Population of Idaho Springs?
Total Female Population of Idaho Springs is 1,127.
What is the Ratio of Males per 100 Females in Idaho Springs?
There are 87.49 Males per 100 Females in Idaho Springs.
What is the Ratio of Females per 100 Males in Idaho Springs?
There are 114.30 Females per 100 Males in Idaho Springs.
What is the Median Population Age in Idaho Springs?
Median Population Age in Idaho Springs is 40.3 Years.
What is the Average Family Size in Idaho Springs
Average Family Size in Idaho Springs is 2.7 People.
What is the Average Household Size in Idaho Springs
Average Household Size in Idaho Springs is 2.4 People.
How Large is the Labor Force in Idaho Springs?
There are 1,391 People in the Labor Forcein in Idaho Springs.
What is the Percentage of People in the Labor Force in Idaho Springs?
73.0% of People are in the Labor Force in Idaho Springs.
What is the Unemployment Rate in Idaho Springs?
Unemployment Rate in Idaho Springs is 6.8%.