Watkins, CO Map & Demographics
Watkins Map
Watkins Overview
$57,212
PER CAPITA INCOME
$153,250
AVG FAMILY INCOME
$153,000
AVG HOUSEHOLD INCOME
13.4%
WAGE / INCOME GAP [ % ]
86.6¢/ $1
WAGE / INCOME GAP [ $ ]
0.30
INEQUALITY / GINI INDEX
991
TOTAL POPULATION
488
MALE POPULATION
503
FEMALE POPULATION
97.02
MALES / 100 FEMALES
103.07
FEMALES / 100 MALES
46.7
MEDIAN AGE
3.2
AVG FAMILY SIZE
3.0
AVG HOUSEHOLD SIZE
497
LABOR FORCE [ PEOPLE ]
59.2%
PERCENT IN LABOR FORCE
Watkins Zip Codes
Watkins Area Codes
Income in Watkins
Income Overview in Watkins
Per Capita Income in Watkins is $57,212, while median incomes of families and households are $153,250 and $153,000 respectively.
| Characteristic | Number | Measure |
| Per Capita Income | 991 | $57,212 |
| Median Family Income | 283 | $153,250 |
| Mean Family Income | 283 | $144,115 |
| Median Household Income | 336 | $153,000 |
| Mean Household Income | 336 | $161,485 |
| Income Deficit | 283 | $0 |
| Wage / Income Gap (%) | 991 | 13.38% |
| Wage / Income Gap ($) | 991 | 86.62¢ per $1 |
| Gini / Inequality Index | 991 | 0.30 |
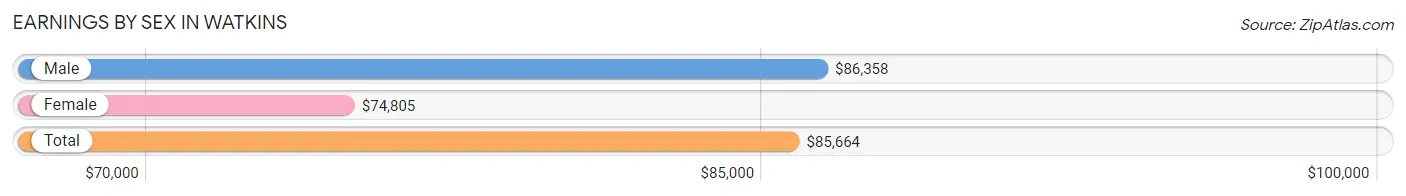
Earnings by Sex in Watkins
Average Earnings in Watkins are $85,664, $86,358 for men and $74,805 for women, a difference of 13.4%.
| Sex | Number | Average Earnings |
| Male | 326 (63.5%) | $86,358 |
| Female | 187 (36.4%) | $74,805 |
| Total | 513 (100.0%) | $85,664 |
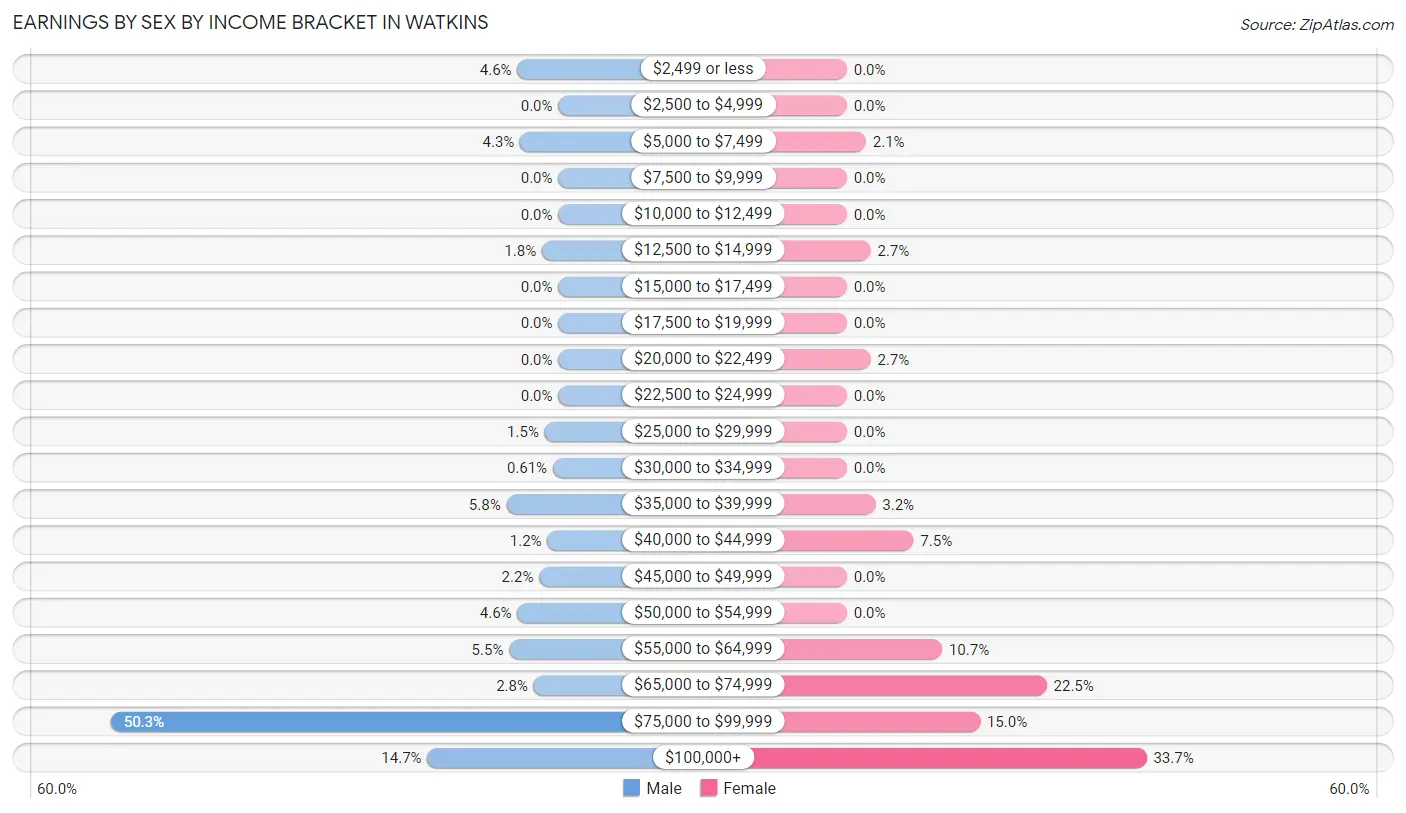
Earnings by Sex by Income Bracket in Watkins
The most common earnings brackets in Watkins are $75,000 to $99,999 for men (164 | 50.3%) and $100,000+ for women (63 | 33.7%).
| Income | Male | Female |
| $2,499 or less | 15 (4.6%) | 0 (0.0%) |
| $2,500 to $4,999 | 0 (0.0%) | 0 (0.0%) |
| $5,000 to $7,499 | 14 (4.3%) | 4 (2.1%) |
| $7,500 to $9,999 | 0 (0.0%) | 0 (0.0%) |
| $10,000 to $12,499 | 0 (0.0%) | 0 (0.0%) |
| $12,500 to $14,999 | 6 (1.8%) | 5 (2.7%) |
| $15,000 to $17,499 | 0 (0.0%) | 0 (0.0%) |
| $17,500 to $19,999 | 0 (0.0%) | 0 (0.0%) |
| $20,000 to $22,499 | 0 (0.0%) | 5 (2.7%) |
| $22,500 to $24,999 | 0 (0.0%) | 0 (0.0%) |
| $25,000 to $29,999 | 5 (1.5%) | 0 (0.0%) |
| $30,000 to $34,999 | 2 (0.6%) | 0 (0.0%) |
| $35,000 to $39,999 | 19 (5.8%) | 6 (3.2%) |
| $40,000 to $44,999 | 4 (1.2%) | 14 (7.5%) |
| $45,000 to $49,999 | 7 (2.1%) | 0 (0.0%) |
| $50,000 to $54,999 | 15 (4.6%) | 0 (0.0%) |
| $55,000 to $64,999 | 18 (5.5%) | 20 (10.7%) |
| $65,000 to $74,999 | 9 (2.8%) | 42 (22.5%) |
| $75,000 to $99,999 | 164 (50.3%) | 28 (15.0%) |
| $100,000+ | 48 (14.7%) | 63 (33.7%) |
| Total | 326 (100.0%) | 187 (100.0%) |
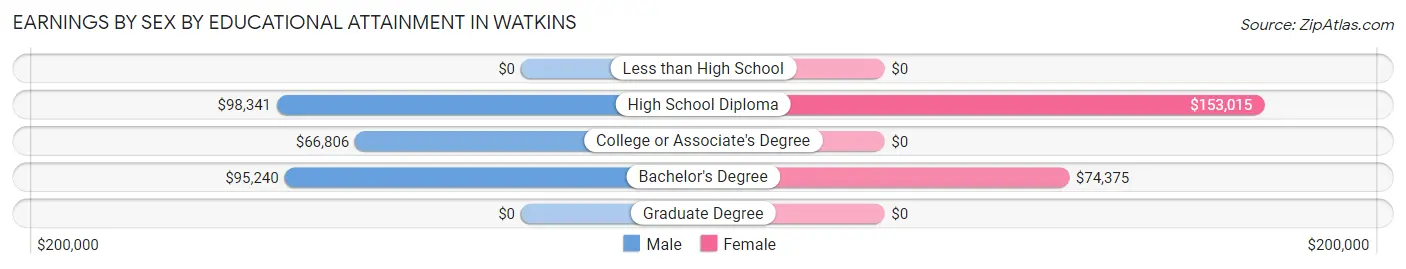
Earnings by Sex by Educational Attainment in Watkins
Average earnings in Watkins are $86,435 for men and $74,805 for women, a difference of 13.5%. Men with an educational attainment of high school diploma enjoy the highest average annual earnings of $98,341, while those with college or associate's degree education earn the least with $66,806. Women with an educational attainment of high school diploma earn the most with the average annual earnings of $153,015, while those with bachelor's degree education have the smallest earnings of $74,375.
| Educational Attainment | Male Income | Female Income |
| Less than High School | - | - |
| High School Diploma | $98,341 | $153,015 |
| College or Associate's Degree | $66,806 | $0 |
| Bachelor's Degree | $95,240 | $74,375 |
| Graduate Degree | - | - |
| Total | $86,435 | $74,805 |
Family Income in Watkins
Family Income Brackets in Watkins
According to the Watkins family income data, there are 117 families falling into the $150,000 to $199,999 income range, which is the most common income bracket and makes up 41.3% of all families.
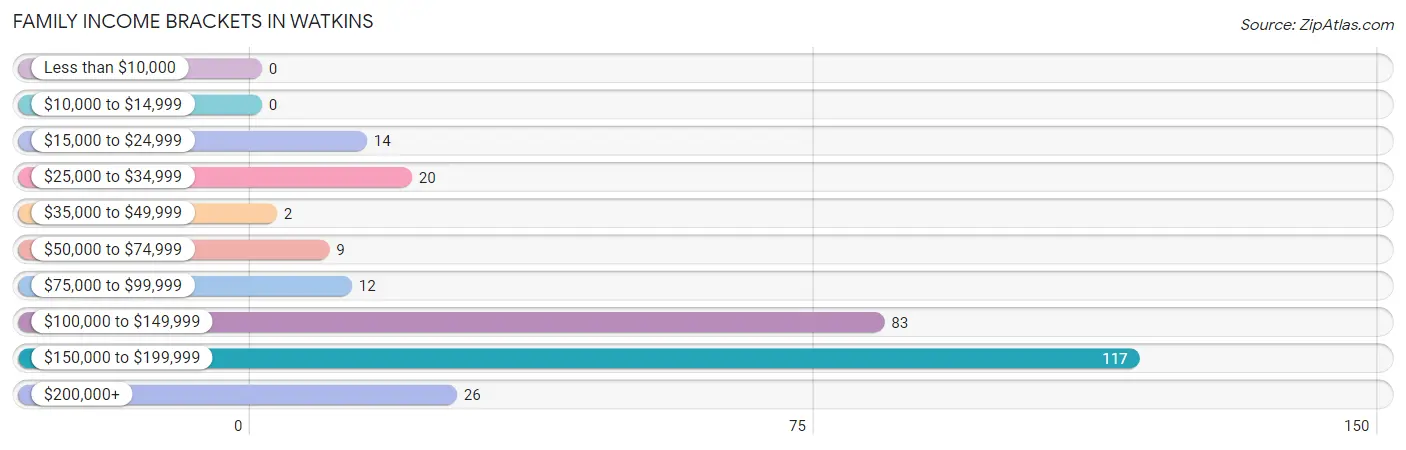
| Income Bracket | # Families | % Families |
| Less than $10,000 | 0 | 0.0% |
| $10,000 to $14,999 | 0 | 0.0% |
| $15,000 to $24,999 | 14 | 4.9% |
| $25,000 to $34,999 | 20 | 7.1% |
| $35,000 to $49,999 | 2 | 0.7% |
| $50,000 to $74,999 | 9 | 3.2% |
| $75,000 to $99,999 | 12 | 4.2% |
| $100,000 to $149,999 | 83 | 29.3% |
| $150,000 to $199,999 | 117 | 41.3% |
| $200,000+ | 26 | 9.2% |
Family Income by Famaliy Size in Watkins
2-person families (140 | 49.5%) account for the highest median family income in Watkins with $145,556 per family, while 2-person families (140 | 49.5%) have the highest median income of $72,778 per family member.
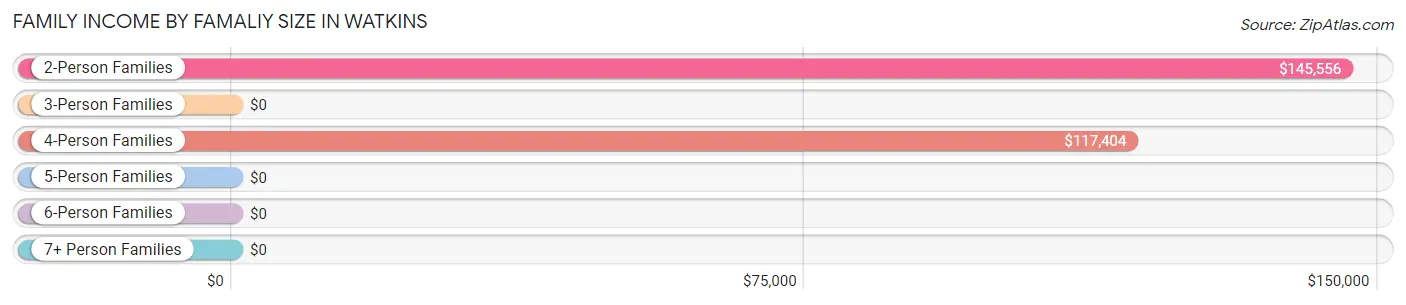
| Income Bracket | # Families | Median Income |
| 2-Person Families | 140 (49.5%) | $145,556 |
| 3-Person Families | 54 (19.1%) | $0 |
| 4-Person Families | 25 (8.8%) | $117,404 |
| 5-Person Families | 52 (18.4%) | $0 |
| 6-Person Families | 12 (4.2%) | $0 |
| 7+ Person Families | 0 (0.0%) | $0 |
| Total | 283 (100.0%) | $153,250 |
Family Income by Number of Earners in Watkins
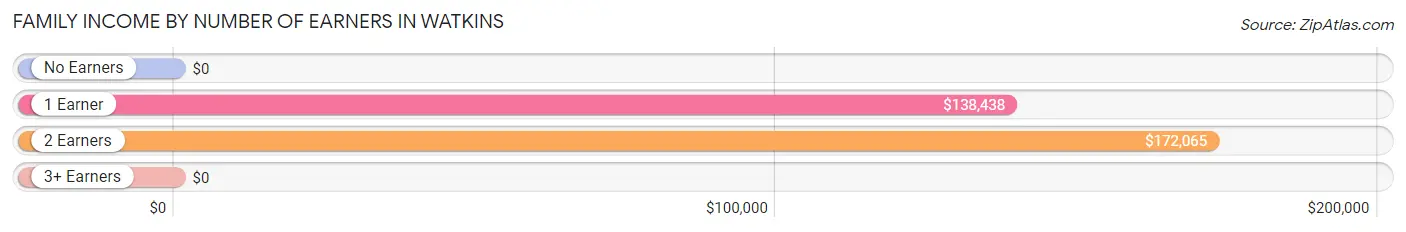
| Number of Earners | # Families | Median Income |
| No Earners | 47 (16.6%) | $0 |
| 1 Earner | 48 (17.0%) | $138,438 |
| 2 Earners | 178 (62.9%) | $172,065 |
| 3+ Earners | 10 (3.5%) | $0 |
| Total | 283 (100.0%) | $153,250 |
Household Income in Watkins
Household Income Brackets in Watkins
With 117 households falling in the category, the $150,000 to $199,999 income range is the most frequent in Watkins, accounting for 34.8% of all households.
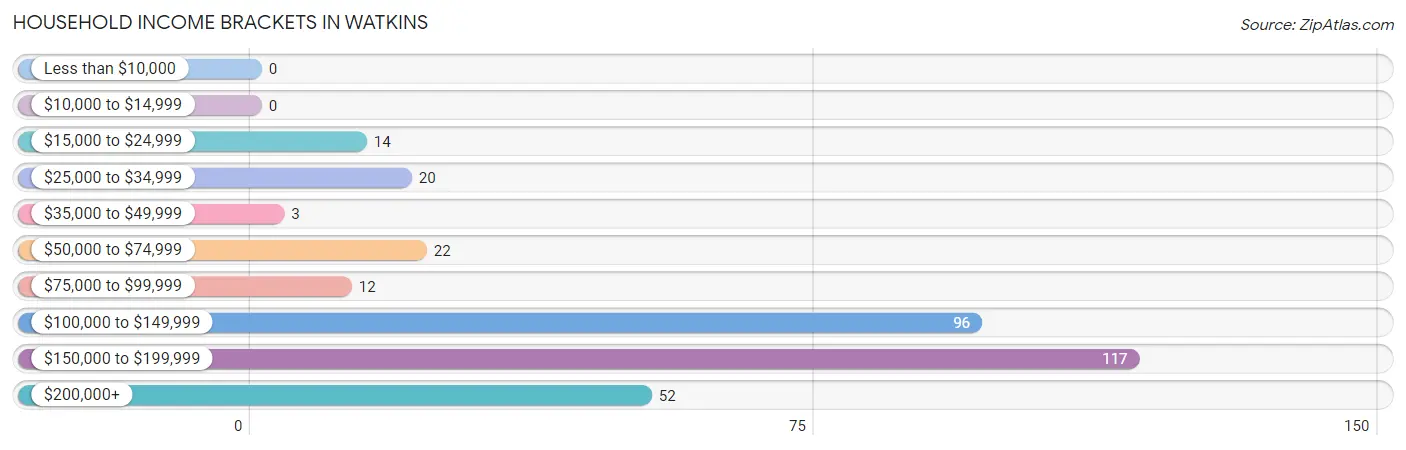
| Income Bracket | # Households | % Households |
| Less than $10,000 | 0 | 0.0% |
| $10,000 to $14,999 | 0 | 0.0% |
| $15,000 to $24,999 | 14 | 4.2% |
| $25,000 to $34,999 | 20 | 6.0% |
| $35,000 to $49,999 | 3 | 0.9% |
| $50,000 to $74,999 | 22 | 6.5% |
| $75,000 to $99,999 | 12 | 3.6% |
| $100,000 to $149,999 | 96 | 28.6% |
| $150,000 to $199,999 | 117 | 34.8% |
| $200,000+ | 52 | 15.5% |
Household Income by Householder Age in Watkins
The median household income in Watkins is $153,000, with the highest median household income of $185,361 found in the 25 to 44 years age bracket for the primary householder. A total of 113 households (33.6%) fall into this category.
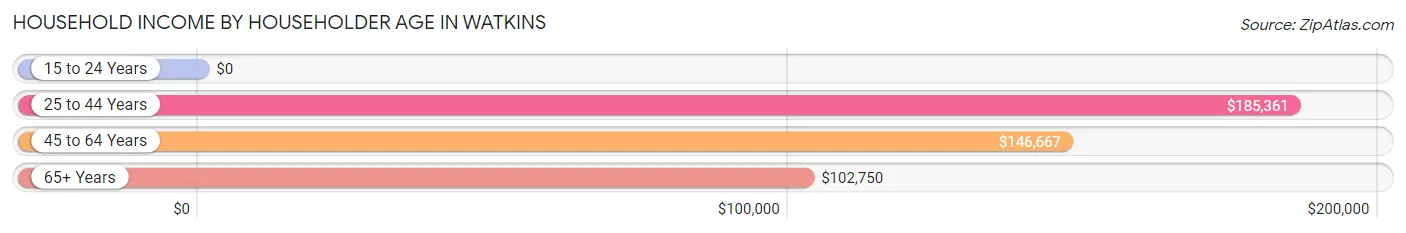
| Income Bracket | # Households | Median Income |
| 15 to 24 Years | 0 (0.0%) | $0 |
| 25 to 44 Years | 113 (33.6%) | $185,361 |
| 45 to 64 Years | 130 (38.7%) | $146,667 |
| 65+ Years | 93 (27.7%) | $102,750 |
| Total | 336 (100.0%) | $153,000 |
Poverty in Watkins
Income Below Poverty by Sex and Age in Watkins
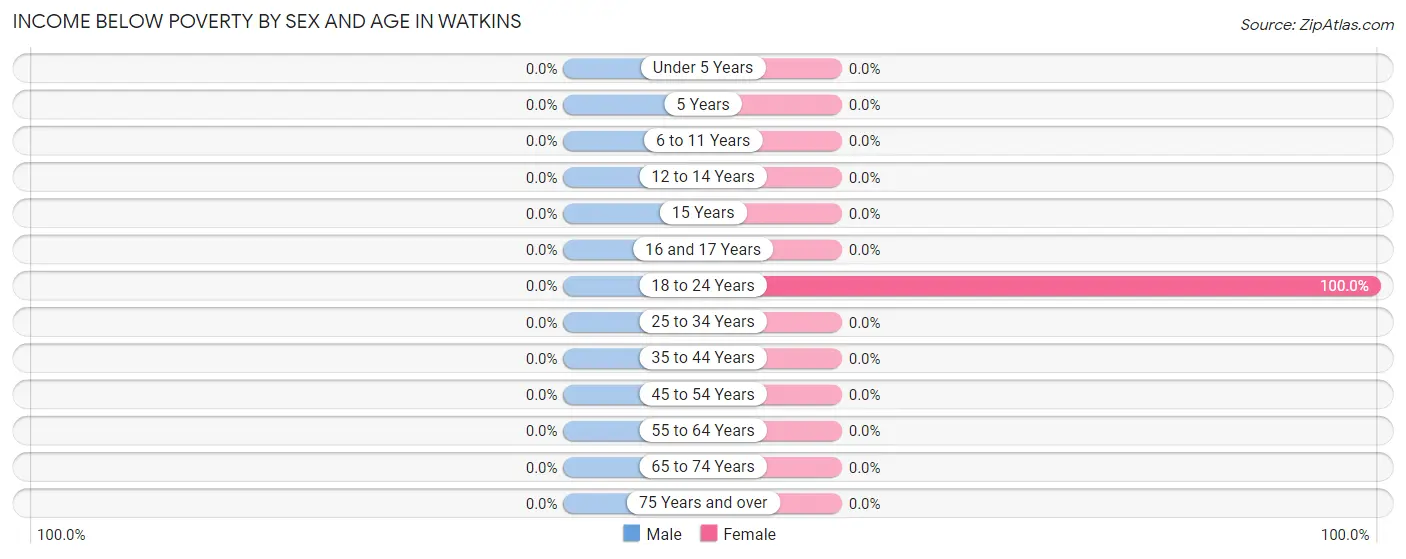
| Age Bracket | Male | Female |
| Under 5 Years | 0 (0.0%) | 0 (0.0%) |
| 5 Years | 0 (0.0%) | 0 (0.0%) |
| 6 to 11 Years | 0 (0.0%) | 0 (0.0%) |
| 12 to 14 Years | 0 (0.0%) | 0 (0.0%) |
| 15 Years | 0 (0.0%) | 0 (0.0%) |
| 16 and 17 Years | 0 (0.0%) | 0 (0.0%) |
| 18 to 24 Years | 0 (0.0%) | 30 (100.0%) |
| 25 to 34 Years | 0 (0.0%) | 0 (0.0%) |
| 35 to 44 Years | 0 (0.0%) | 0 (0.0%) |
| 45 to 54 Years | 0 (0.0%) | 0 (0.0%) |
| 55 to 64 Years | 0 (0.0%) | 0 (0.0%) |
| 65 to 74 Years | 0 (0.0%) | 0 (0.0%) |
| 75 Years and over | 0 (0.0%) | 0 (0.0%) |
| Total | 0 (0.0%) | 30 (6.0%) |
Income Above Poverty by Sex and Age in Watkins
According to the poverty statistics in Watkins, males aged under 5 years and females aged under 5 years are the age groups that are most secure financially, with 100.0% of males and 100.0% of females in these age groups living above the poverty line.
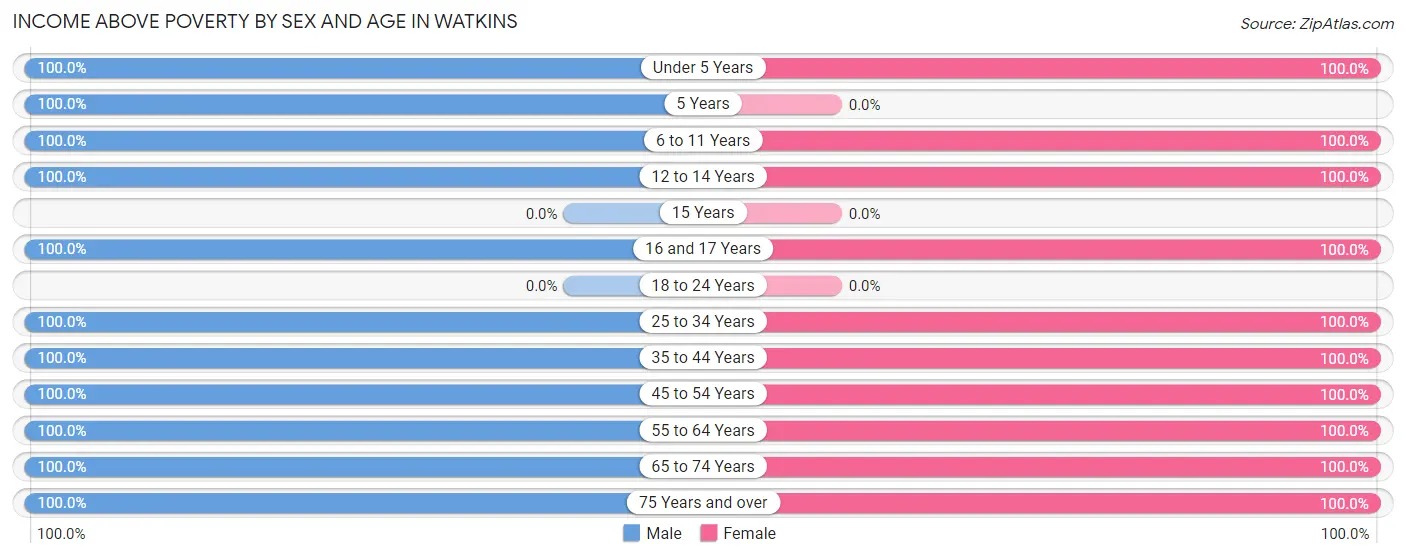
| Age Bracket | Male | Female |
| Under 5 Years | 19 (100.0%) | 58 (100.0%) |
| 5 Years | 11 (100.0%) | 0 (0.0%) |
| 6 to 11 Years | 8 (100.0%) | 12 (100.0%) |
| 12 to 14 Years | 18 (100.0%) | 25 (100.0%) |
| 15 Years | 0 (0.0%) | 0 (0.0%) |
| 16 and 17 Years | 5 (100.0%) | 12 (100.0%) |
| 18 to 24 Years | 0 (0.0%) | 0 (0.0%) |
| 25 to 34 Years | 95 (100.0%) | 84 (100.0%) |
| 35 to 44 Years | 31 (100.0%) | 42 (100.0%) |
| 45 to 54 Years | 116 (100.0%) | 87 (100.0%) |
| 55 to 64 Years | 82 (100.0%) | 88 (100.0%) |
| 65 to 74 Years | 81 (100.0%) | 28 (100.0%) |
| 75 Years and over | 22 (100.0%) | 37 (100.0%) |
| Total | 488 (100.0%) | 473 (94.0%) |
Income Below Poverty Among Married-Couple Families in Watkins
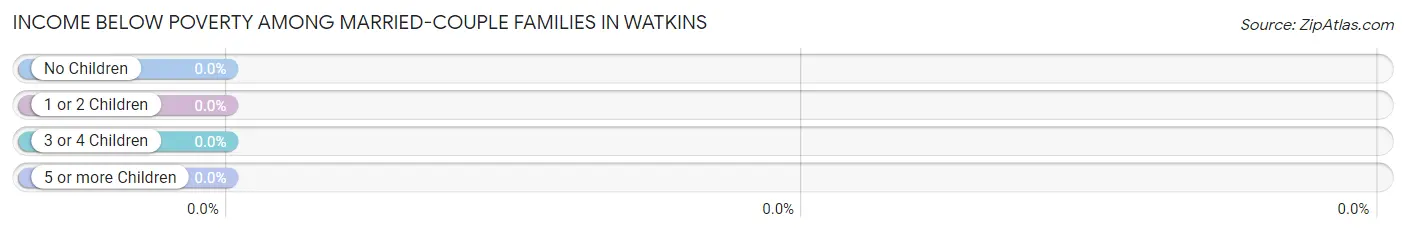
| Children | Above Poverty | Below Poverty |
| No Children | 154 (100.0%) | 0 (0.0%) |
| 1 or 2 Children | 102 (100.0%) | 0 (0.0%) |
| 3 or 4 Children | 12 (100.0%) | 0 (0.0%) |
| 5 or more Children | 0 (0.0%) | 0 (0.0%) |
| Total | 268 (100.0%) | 0 (0.0%) |
Income Below Poverty Among Single-Parent Households in Watkins
| Children | Single Father | Single Mother |
| No Children | 0 (0.0%) | 0 (0.0%) |
| 1 or 2 Children | 0 (0.0%) | 0 (0.0%) |
| 3 or 4 Children | 0 (0.0%) | 0 (0.0%) |
| 5 or more Children | 0 (0.0%) | 0 (0.0%) |
| Total | 0 (0.0%) | 0 (0.0%) |
Income Below Poverty Among Married-Couple vs Single-Parent Households in Watkins
| Children | Married-Couple Families | Single-Parent Households |
| No Children | 0 (0.0%) | 0 (0.0%) |
| 1 or 2 Children | 0 (0.0%) | 0 (0.0%) |
| 3 or 4 Children | 0 (0.0%) | 0 (0.0%) |
| 5 or more Children | 0 (0.0%) | 0 (0.0%) |
| Total | 0 (0.0%) | 0 (0.0%) |
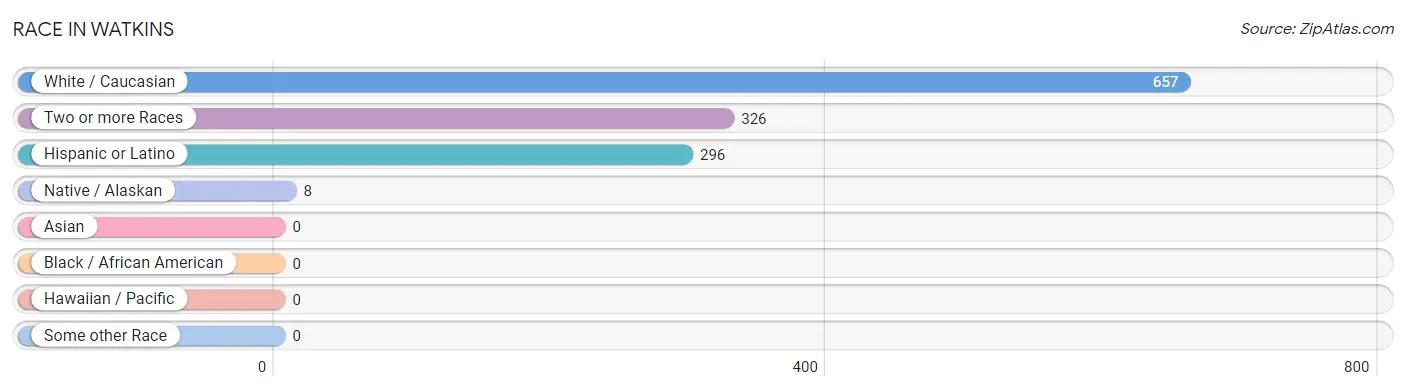
Race in Watkins
The most populous races in Watkins are White / Caucasian (657 | 66.3%), Two or more Races (326 | 32.9%), and Hispanic or Latino (296 | 29.9%).
| Race | # Population | % Population |
| Asian | 0 | 0.0% |
| Black / African American | 0 | 0.0% |
| Hawaiian / Pacific | 0 | 0.0% |
| Hispanic or Latino | 296 | 29.9% |
| Native / Alaskan | 8 | 0.8% |
| White / Caucasian | 657 | 66.3% |
| Two or more Races | 326 | 32.9% |
| Some other Race | 0 | 0.0% |
| Total | 991 | 100.0% |
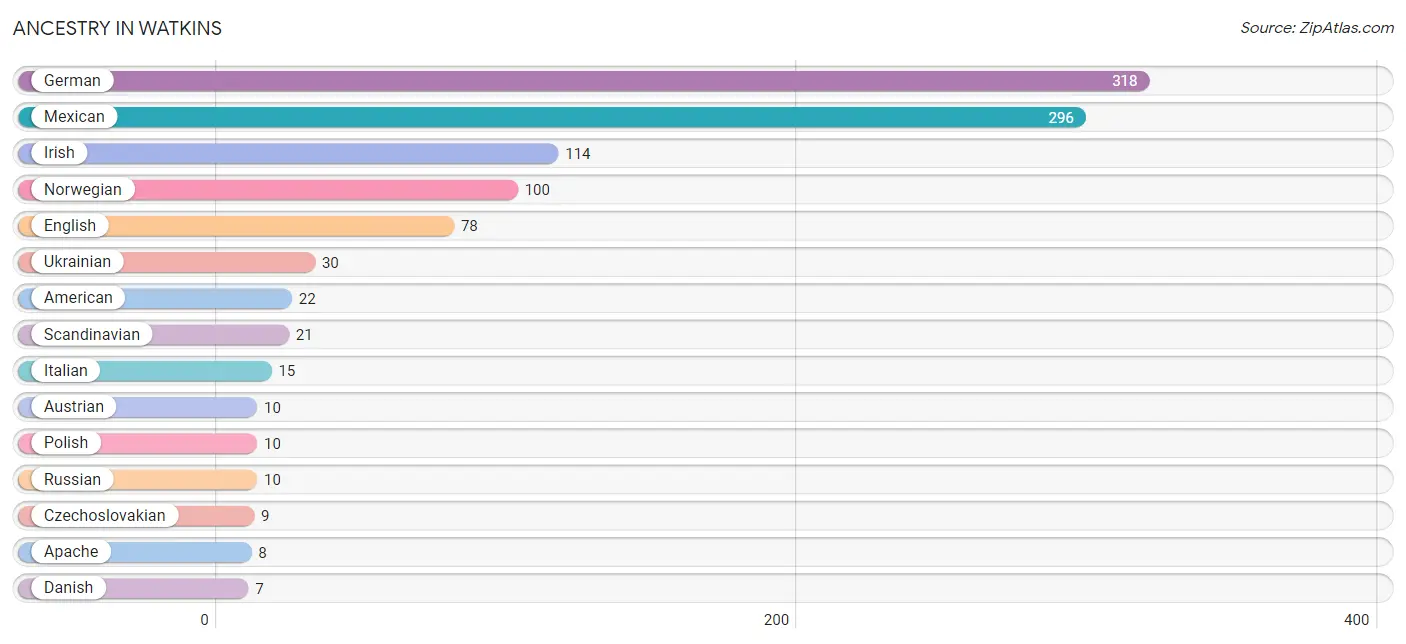
Ancestry in Watkins
The most populous ancestries reported in Watkins are German (318 | 32.1%), Mexican (296 | 29.9%), Irish (114 | 11.5%), Norwegian (100 | 10.1%), and English (78 | 7.9%), together accounting for 91.4% of all Watkins residents.
| Ancestry | # Population | % Population |
| American | 22 | 2.2% |
| Apache | 8 | 0.8% |
| Austrian | 10 | 1.0% |
| Czech | 5 | 0.5% |
| Czechoslovakian | 9 | 0.9% |
| Danish | 7 | 0.7% |
| English | 78 | 7.9% |
| German | 318 | 32.1% |
| Irish | 114 | 11.5% |
| Italian | 15 | 1.5% |
| Mexican | 296 | 29.9% |
| Norwegian | 100 | 10.1% |
| Polish | 10 | 1.0% |
| Russian | 10 | 1.0% |
| Scandinavian | 21 | 2.1% |
| Ukrainian | 30 | 3.0% | View All 16 Rows |
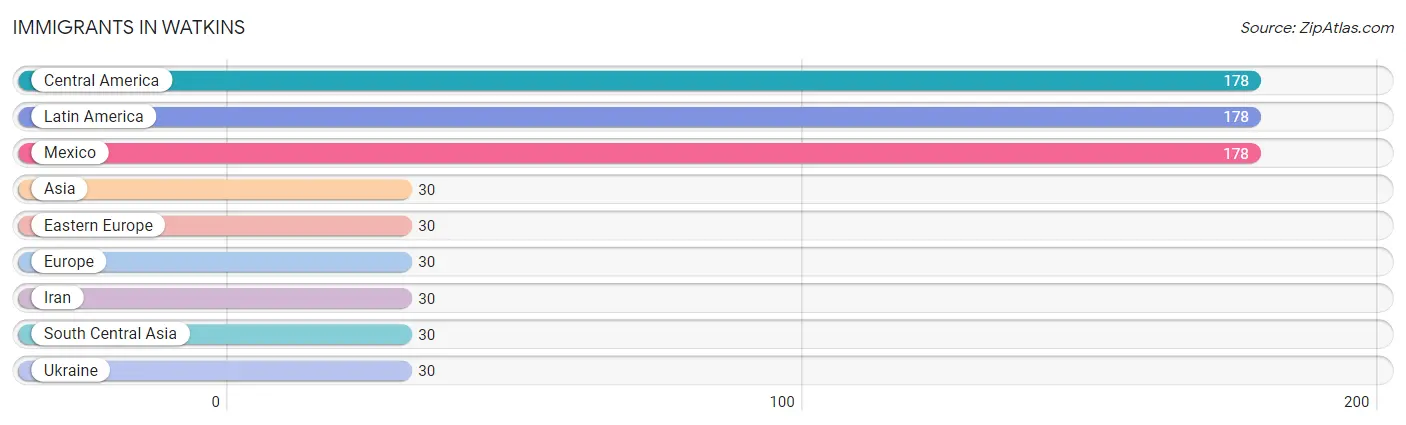
Immigrants in Watkins
The most numerous immigrant groups reported in Watkins came from Central America (178 | 18.0%), Latin America (178 | 18.0%), Mexico (178 | 18.0%), Asia (30 | 3.0%), and Eastern Europe (30 | 3.0%), together accounting for 59.9% of all Watkins residents.
| Immigration Origin | # Population | % Population |
| Asia | 30 | 3.0% |
| Central America | 178 | 18.0% |
| Eastern Europe | 30 | 3.0% |
| Europe | 30 | 3.0% |
| Iran | 30 | 3.0% |
| Latin America | 178 | 18.0% |
| Mexico | 178 | 18.0% |
| South Central Asia | 30 | 3.0% |
| Ukraine | 30 | 3.0% | View All 9 Rows |
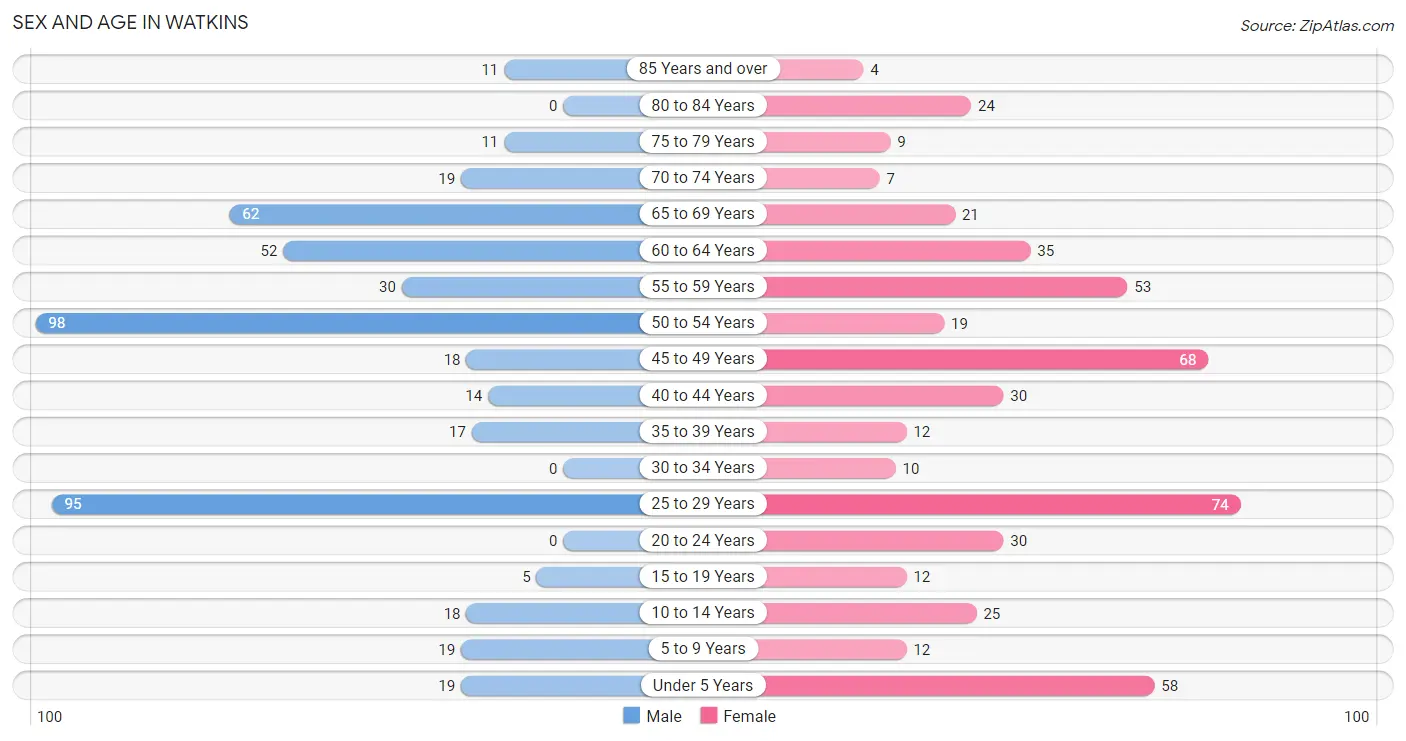
Sex and Age in Watkins
Sex and Age in Watkins
The most populous age groups in Watkins are 50 to 54 Years (98 | 20.1%) for men and 25 to 29 Years (74 | 14.7%) for women.
| Age Bracket | Male | Female |
| Under 5 Years | 19 (3.9%) | 58 (11.5%) |
| 5 to 9 Years | 19 (3.9%) | 12 (2.4%) |
| 10 to 14 Years | 18 (3.7%) | 25 (5.0%) |
| 15 to 19 Years | 5 (1.0%) | 12 (2.4%) |
| 20 to 24 Years | 0 (0.0%) | 30 (6.0%) |
| 25 to 29 Years | 95 (19.5%) | 74 (14.7%) |
| 30 to 34 Years | 0 (0.0%) | 10 (2.0%) |
| 35 to 39 Years | 17 (3.5%) | 12 (2.4%) |
| 40 to 44 Years | 14 (2.9%) | 30 (6.0%) |
| 45 to 49 Years | 18 (3.7%) | 68 (13.5%) |
| 50 to 54 Years | 98 (20.1%) | 19 (3.8%) |
| 55 to 59 Years | 30 (6.1%) | 53 (10.5%) |
| 60 to 64 Years | 52 (10.7%) | 35 (7.0%) |
| 65 to 69 Years | 62 (12.7%) | 21 (4.2%) |
| 70 to 74 Years | 19 (3.9%) | 7 (1.4%) |
| 75 to 79 Years | 11 (2.2%) | 9 (1.8%) |
| 80 to 84 Years | 0 (0.0%) | 24 (4.8%) |
| 85 Years and over | 11 (2.2%) | 4 (0.8%) |
| Total | 488 (100.0%) | 503 (100.0%) |
Families and Households in Watkins
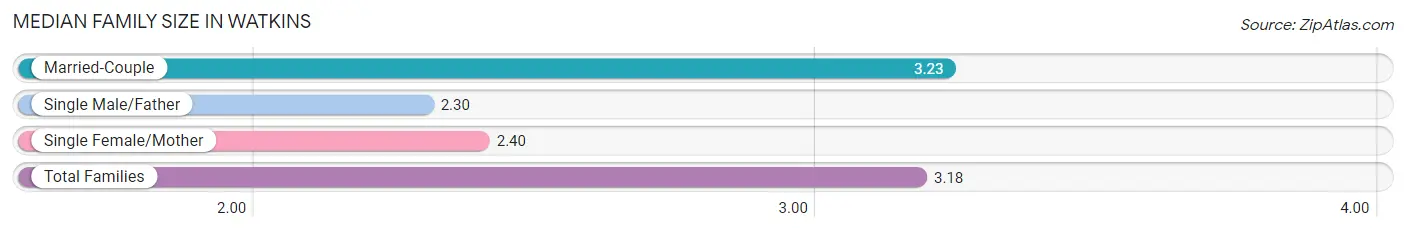
Median Family Size in Watkins
The median family size in Watkins is 3.18 persons per family, with married-couple families (268 | 94.7%) accounting for the largest median family size of 3.23 persons per family. On the other hand, single male/father families (10 | 3.5%) represent the smallest median family size with 2.30 persons per family.
| Family Type | # Families | Family Size |
| Married-Couple | 268 (94.7%) | 3.23 |
| Single Male/Father | 10 (3.5%) | 2.30 |
| Single Female/Mother | 5 (1.8%) | 2.40 |
| Total Families | 283 (100.0%) | 3.18 |
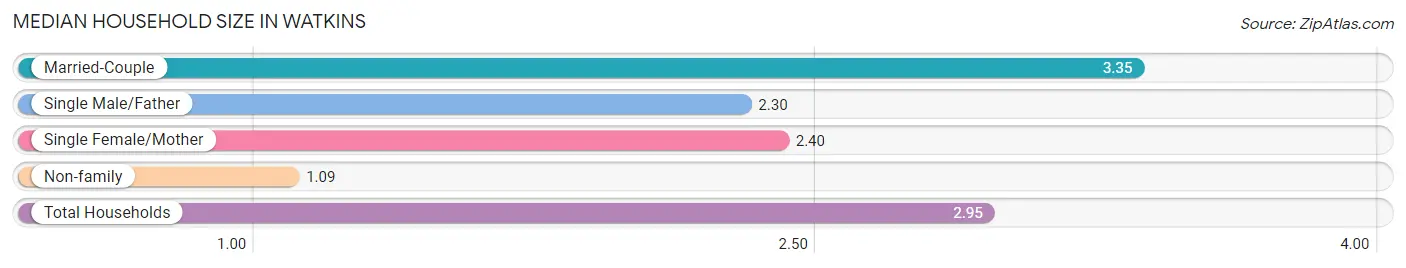
Median Household Size in Watkins
The median household size in Watkins is 2.95 persons per household, with married-couple households (268 | 79.8%) accounting for the largest median household size of 3.35 persons per household. non-family households (53 | 15.8%) represent the smallest median household size with 1.09 persons per household.
| Household Type | # Households | Household Size |
| Married-Couple | 268 (79.8%) | 3.35 |
| Single Male/Father | 10 (3.0%) | 2.30 |
| Single Female/Mother | 5 (1.5%) | 2.40 |
| Non-family | 53 (15.8%) | 1.09 |
| Total Households | 336 (100.0%) | 2.95 |
Household Size by Marriage Status in Watkins
Out of a total of 336 households in Watkins, 283 (84.2%) are family households, while 53 (15.8%) are nonfamily households. The most numerous type of family households are 2-person households, comprising 140, and the most common type of nonfamily households are 1-person households, comprising 49.
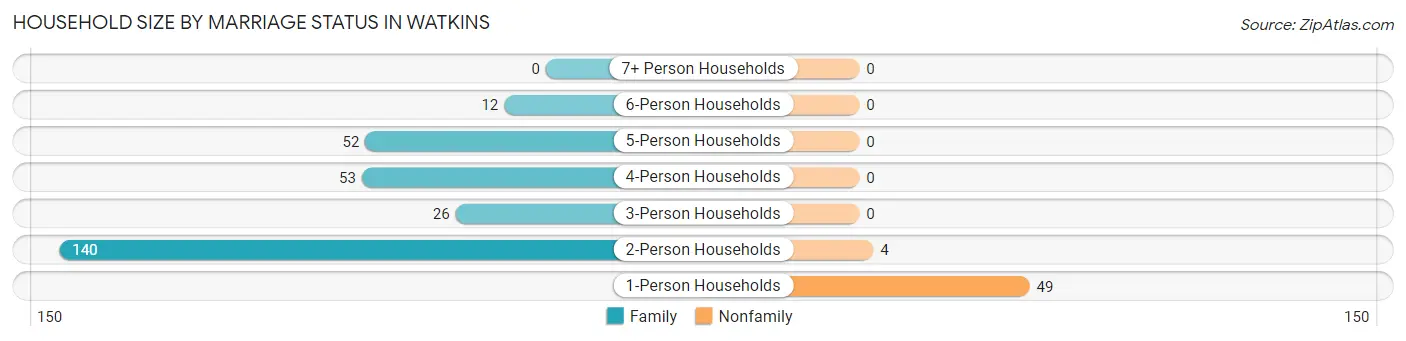
| Household Size | Family Households | Nonfamily Households |
| 1-Person Households | - | 49 (14.6%) |
| 2-Person Households | 140 (41.7%) | 4 (1.2%) |
| 3-Person Households | 26 (7.7%) | 0 (0.0%) |
| 4-Person Households | 53 (15.8%) | 0 (0.0%) |
| 5-Person Households | 52 (15.5%) | 0 (0.0%) |
| 6-Person Households | 12 (3.6%) | 0 (0.0%) |
| 7+ Person Households | 0 (0.0%) | 0 (0.0%) |
| Total | 283 (84.2%) | 53 (15.8%) |
Female Fertility in Watkins
Fertility by Age in Watkins
Average fertility rate in Watkins is 97.0 births per 1,000 women. Women in the age bracket of 20 to 34 years have the highest fertility rate with 202.0 births per 1,000 women. Women in the age bracket of 20 to 34 years acount for 100.0% of all women with births.
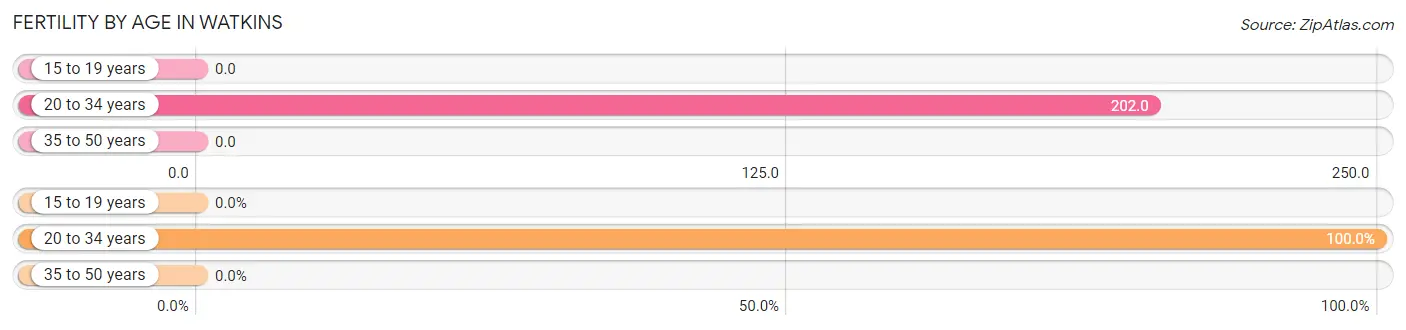
| Age Bracket | Women with Births | Births / 1,000 Women |
| 15 to 19 years | 0 (0.0%) | 0.0 |
| 20 to 34 years | 23 (100.0%) | 202.0 |
| 35 to 50 years | 0 (0.0%) | 0.0 |
| Total | 23 (100.0%) | 97.0 |
Fertility by Age by Marriage Status in Watkins
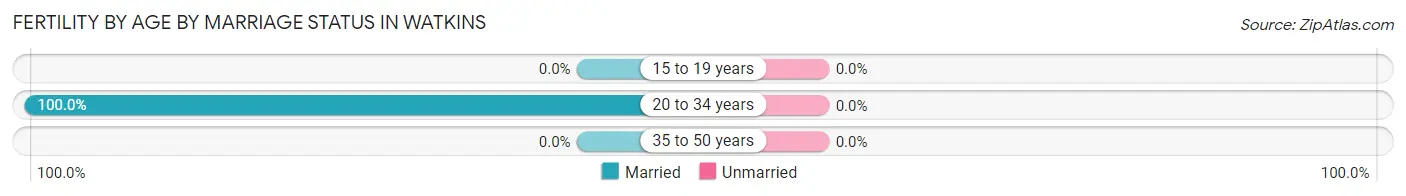
| Age Bracket | Married | Unmarried |
| 15 to 19 years | 0 (0.0%) | 0 (0.0%) |
| 20 to 34 years | 23 (100.0%) | 0 (0.0%) |
| 35 to 50 years | 0 (0.0%) | 0 (0.0%) |
| Total | 23 (100.0%) | 0 (0.0%) |
Fertility by Education in Watkins
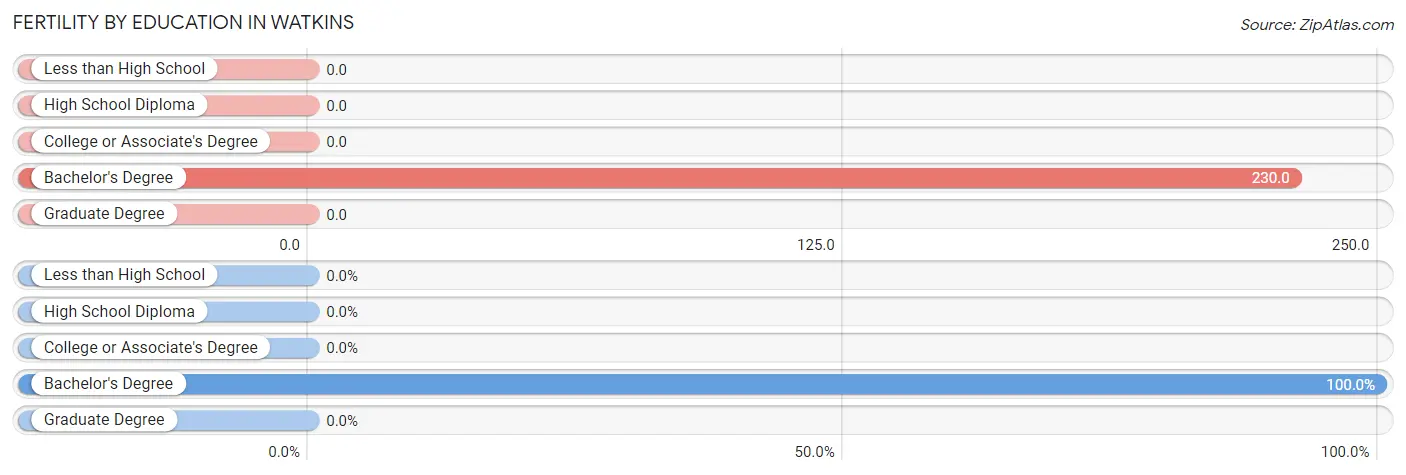
| Educational Attainment | Women with Births | Births / 1,000 Women |
| Less than High School | 0 (0.0%) | 0.0 |
| High School Diploma | 0 (0.0%) | 0.0 |
| College or Associate's Degree | 0 (0.0%) | 0.0 |
| Bachelor's Degree | 23 (100.0%) | 230.0 |
| Graduate Degree | 0 (0.0%) | 0.0 |
| Total | 23 (100.0%) | 97.0 |
Fertility by Education by Marriage Status in Watkins
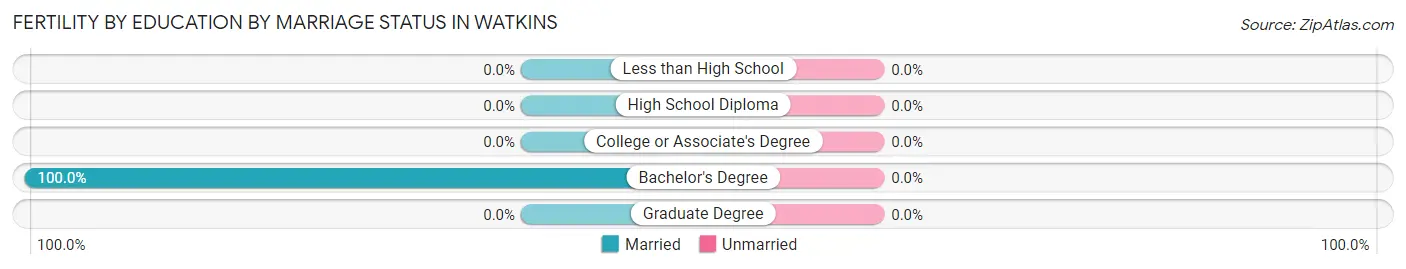
| Educational Attainment | Married | Unmarried |
| Less than High School | 0 (0.0%) | 0 (0.0%) |
| High School Diploma | 0 (0.0%) | 0 (0.0%) |
| College or Associate's Degree | 0 (0.0%) | 0 (0.0%) |
| Bachelor's Degree | 23 (100.0%) | 0 (0.0%) |
| Graduate Degree | 0 (0.0%) | 0 (0.0%) |
| Total | 23 (100.0%) | 0 (0.0%) |
Employment Characteristics in Watkins
Employment by Class of Employer in Watkins
Among the 497 employed individuals in Watkins, private company employees (164 | 33.0%), self-employed (incorporated) (158 | 31.8%), and local government employees (74 | 14.9%) make up the most common classes of employment.
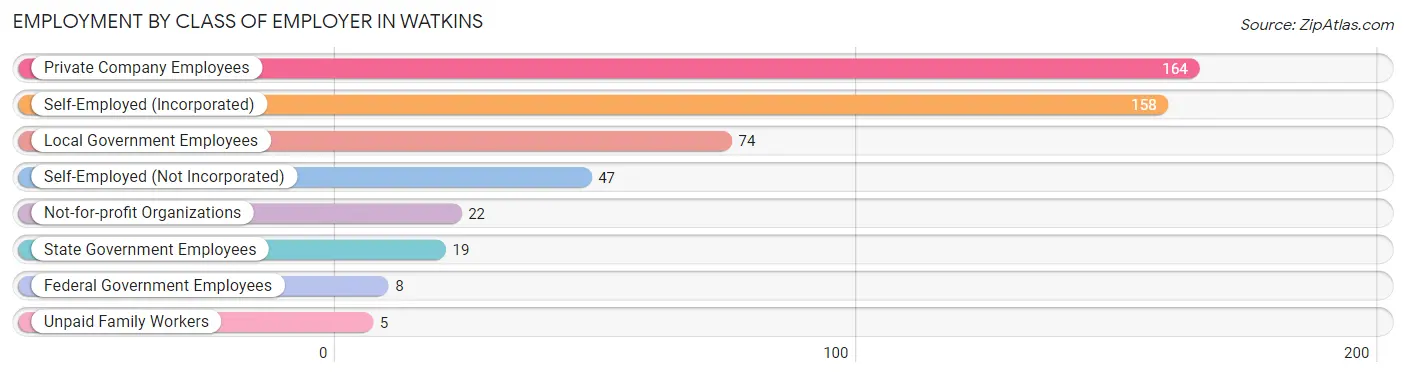
| Employer Class | # Employees | % Employees |
| Private Company Employees | 164 | 33.0% |
| Self-Employed (Incorporated) | 158 | 31.8% |
| Self-Employed (Not Incorporated) | 47 | 9.5% |
| Not-for-profit Organizations | 22 | 4.4% |
| Local Government Employees | 74 | 14.9% |
| State Government Employees | 19 | 3.8% |
| Federal Government Employees | 8 | 1.6% |
| Unpaid Family Workers | 5 | 1.0% |
| Total | 497 | 100.0% |
Employment Status by Age in Watkins
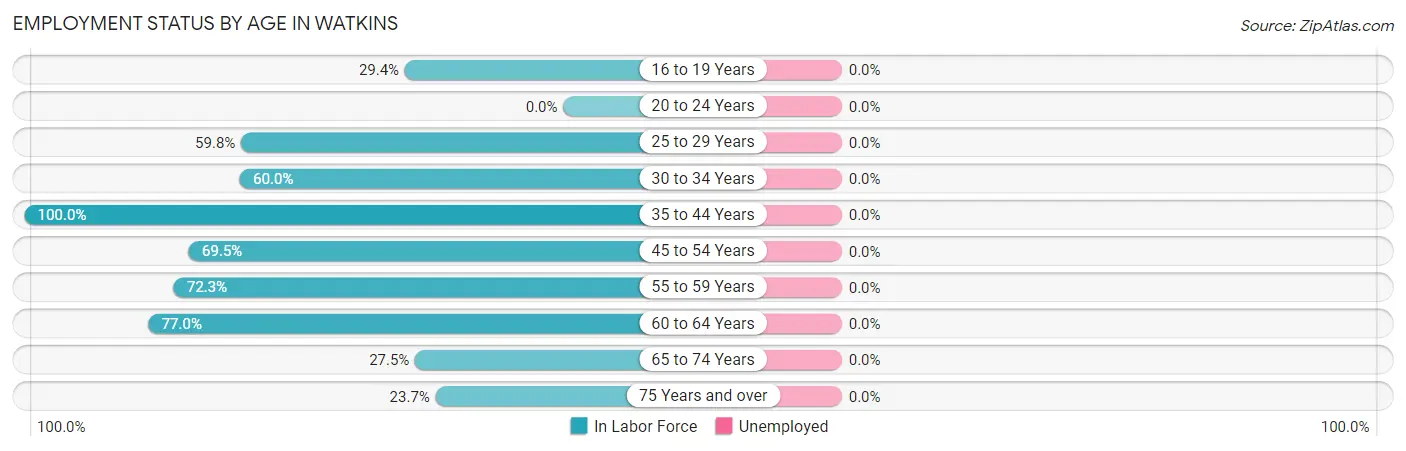
| Age Bracket | In Labor Force | Unemployed |
| 16 to 19 Years | 5 (29.4%) | 0 (0.0%) |
| 20 to 24 Years | 0 (0.0%) | 0 (0.0%) |
| 25 to 29 Years | 101 (59.8%) | 0 (0.0%) |
| 30 to 34 Years | 6 (60.0%) | 0 (0.0%) |
| 35 to 44 Years | 73 (100.0%) | 0 (0.0%) |
| 45 to 54 Years | 141 (69.5%) | 0 (0.0%) |
| 55 to 59 Years | 60 (72.3%) | 0 (0.0%) |
| 60 to 64 Years | 67 (77.0%) | 0 (0.0%) |
| 65 to 74 Years | 30 (27.5%) | 0 (0.0%) |
| 75 Years and over | 14 (23.7%) | 0 (0.0%) |
| Total | 497 (59.2%) | 0 (0.0%) |
Employment Status by Educational Attainment in Watkins
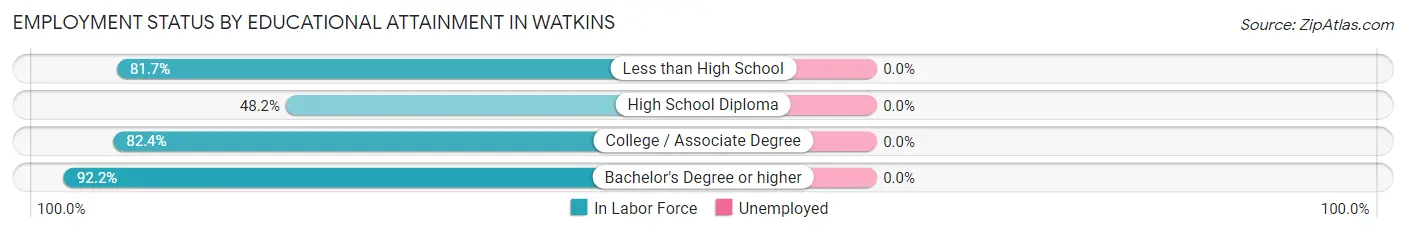
| Educational Attainment | In Labor Force | Unemployed |
| Less than High School | 76 (81.7%) | 0 (0.0%) |
| High School Diploma | 120 (48.2%) | 0 (0.0%) |
| College / Associate Degree | 75 (82.4%) | 0 (0.0%) |
| Bachelor's Degree or higher | 177 (92.2%) | 0 (0.0%) |
| Total | 448 (71.7%) | 0 (0.0%) |
Employment Occupations by Sex in Watkins
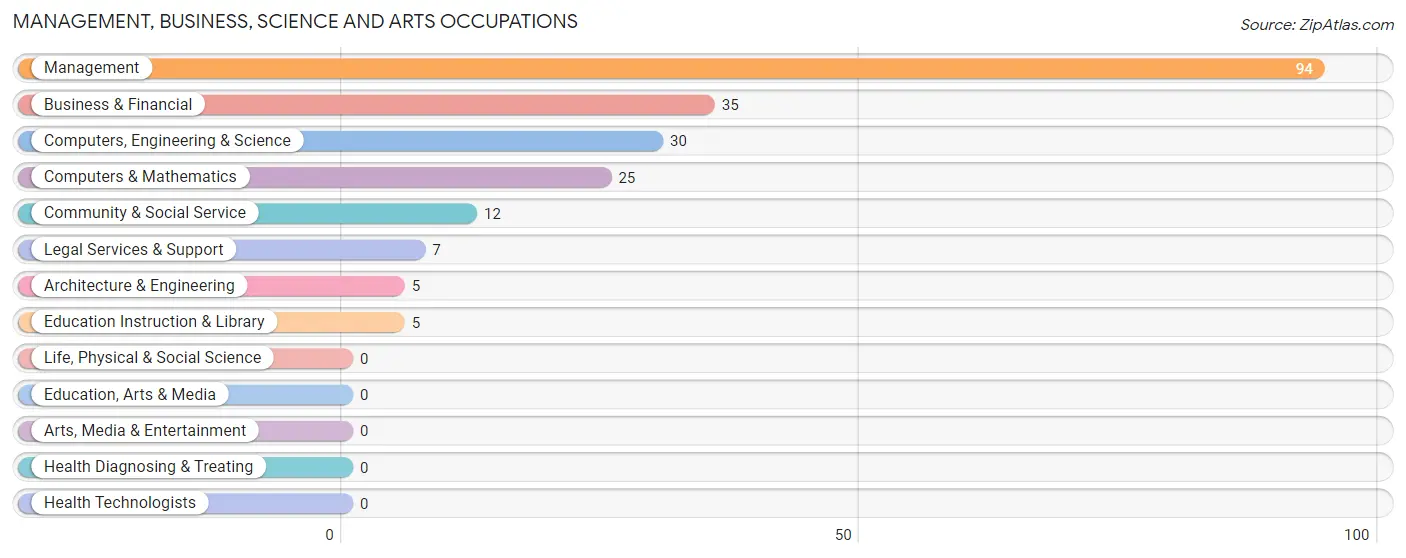
Management, Business, Science and Arts Occupations
The most common Management, Business, Science and Arts occupations in Watkins are Management (94 | 18.9%), Business & Financial (35 | 7.0%), Computers, Engineering & Science (30 | 6.0%), Computers & Mathematics (25 | 5.0%), and Community & Social Service (12 | 2.4%).
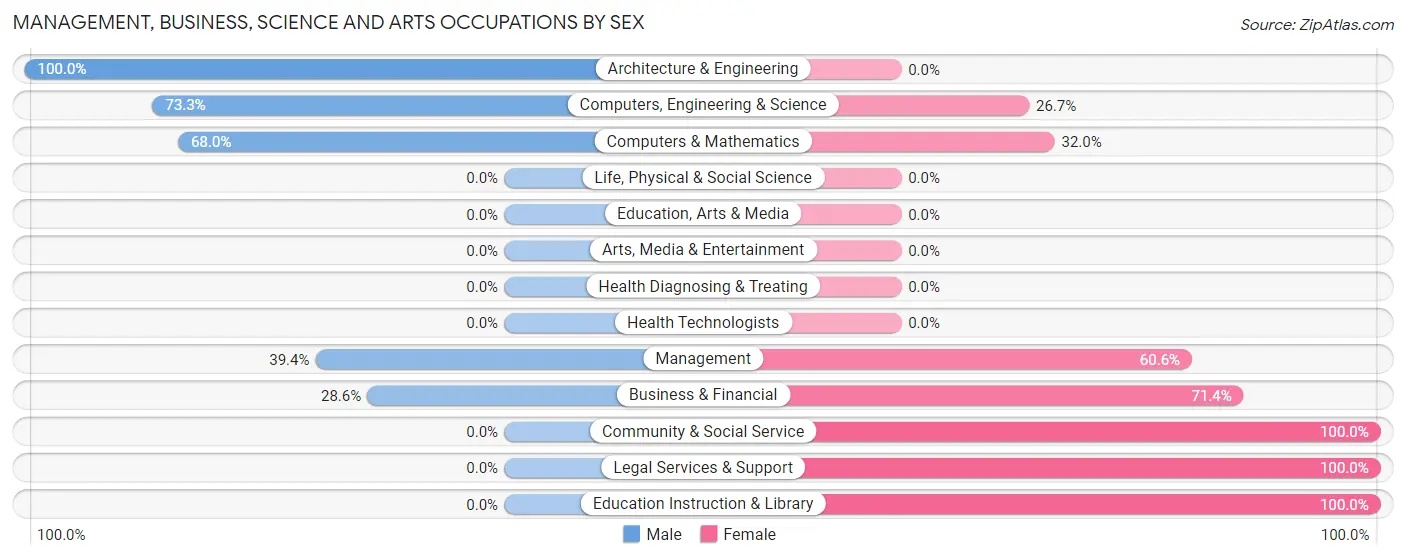
Management, Business, Science and Arts Occupations by Sex
Within the Management, Business, Science and Arts occupations in Watkins, the most male-oriented occupations are Architecture & Engineering (100.0%), Computers, Engineering & Science (73.3%), and Computers & Mathematics (68.0%), while the most female-oriented occupations are Community & Social Service (100.0%), Legal Services & Support (100.0%), and Education Instruction & Library (100.0%).
| Occupation | Male | Female |
| Management | 37 (39.4%) | 57 (60.6%) |
| Business & Financial | 10 (28.6%) | 25 (71.4%) |
| Computers, Engineering & Science | 22 (73.3%) | 8 (26.7%) |
| Computers & Mathematics | 17 (68.0%) | 8 (32.0%) |
| Architecture & Engineering | 5 (100.0%) | 0 (0.0%) |
| Life, Physical & Social Science | 0 (0.0%) | 0 (0.0%) |
| Community & Social Service | 0 (0.0%) | 12 (100.0%) |
| Education, Arts & Media | 0 (0.0%) | 0 (0.0%) |
| Legal Services & Support | 0 (0.0%) | 7 (100.0%) |
| Education Instruction & Library | 0 (0.0%) | 5 (100.0%) |
| Arts, Media & Entertainment | 0 (0.0%) | 0 (0.0%) |
| Health Diagnosing & Treating | 0 (0.0%) | 0 (0.0%) |
| Health Technologists | 0 (0.0%) | 0 (0.0%) |
| Total (Category) | 69 (40.4%) | 102 (59.7%) |
| Total (Overall) | 310 (62.4%) | 187 (37.6%) |
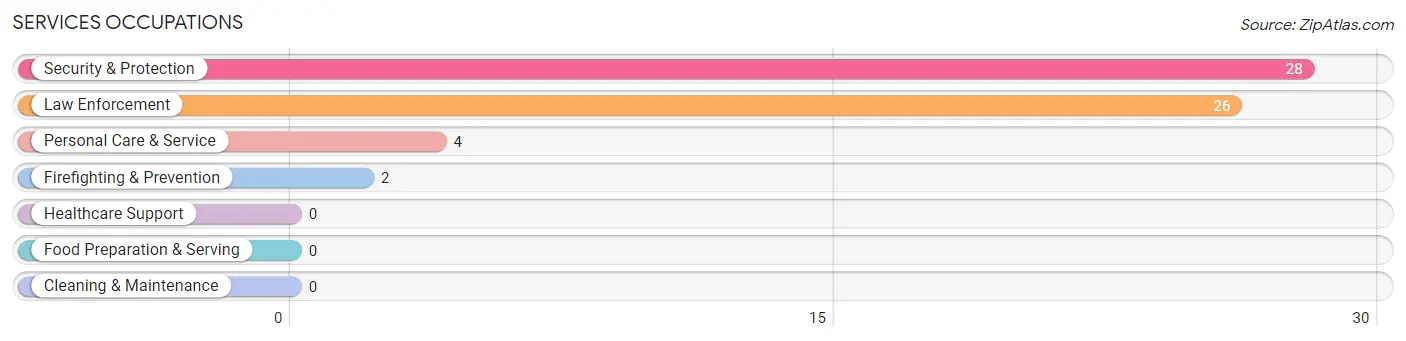
Services Occupations
The most common Services occupations in Watkins are Security & Protection (28 | 5.6%), Law Enforcement (26 | 5.2%), Personal Care & Service (4 | 0.8%), and Firefighting & Prevention (2 | 0.4%).
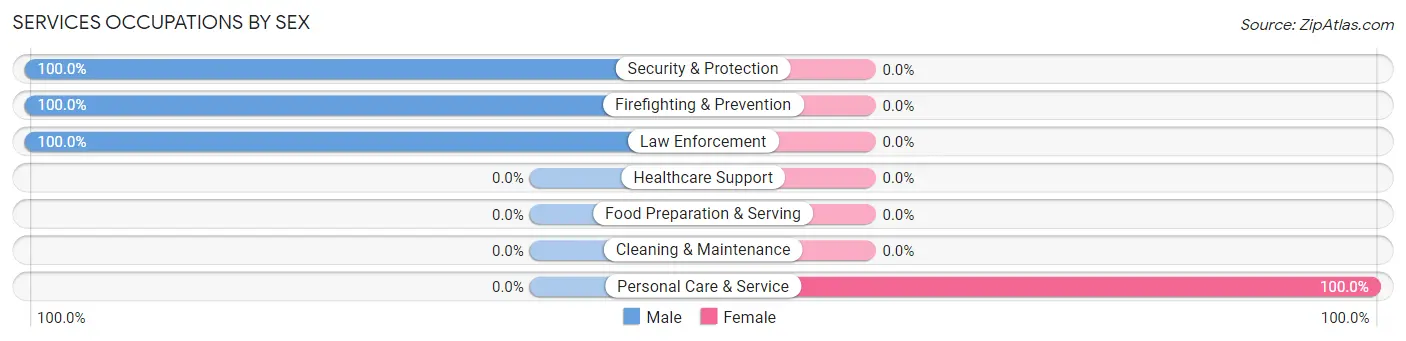
Services Occupations by Sex
| Occupation | Male | Female |
| Healthcare Support | 0 (0.0%) | 0 (0.0%) |
| Security & Protection | 28 (100.0%) | 0 (0.0%) |
| Firefighting & Prevention | 2 (100.0%) | 0 (0.0%) |
| Law Enforcement | 26 (100.0%) | 0 (0.0%) |
| Food Preparation & Serving | 0 (0.0%) | 0 (0.0%) |
| Cleaning & Maintenance | 0 (0.0%) | 0 (0.0%) |
| Personal Care & Service | 0 (0.0%) | 4 (100.0%) |
| Total (Category) | 28 (87.5%) | 4 (12.5%) |
| Total (Overall) | 310 (62.4%) | 187 (37.6%) |
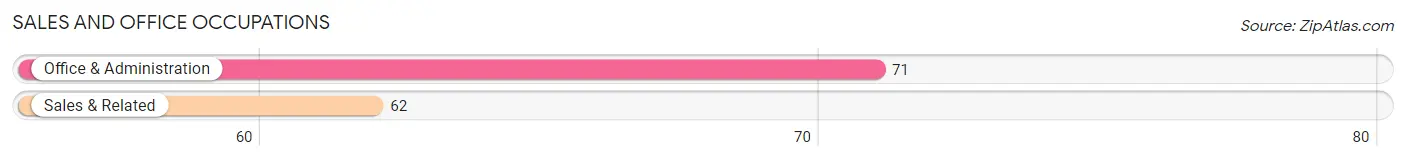
Sales and Office Occupations
The most common Sales and Office occupations in Watkins are Office & Administration (71 | 14.3%), and Sales & Related (62 | 12.5%).
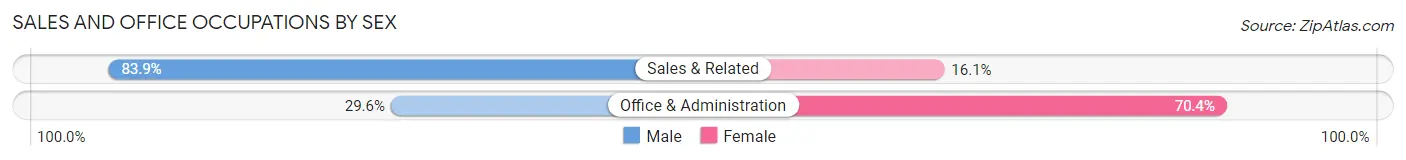
Sales and Office Occupations by Sex
| Occupation | Male | Female |
| Sales & Related | 52 (83.9%) | 10 (16.1%) |
| Office & Administration | 21 (29.6%) | 50 (70.4%) |
| Total (Category) | 73 (54.9%) | 60 (45.1%) |
| Total (Overall) | 310 (62.4%) | 187 (37.6%) |
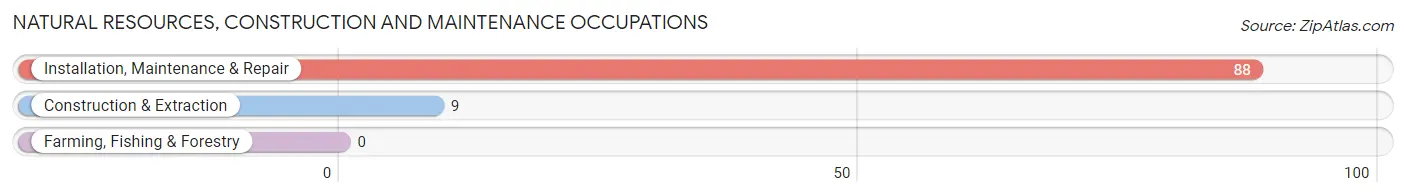
Natural Resources, Construction and Maintenance Occupations
The most common Natural Resources, Construction and Maintenance occupations in Watkins are Installation, Maintenance & Repair (88 | 17.7%), and Construction & Extraction (9 | 1.8%).
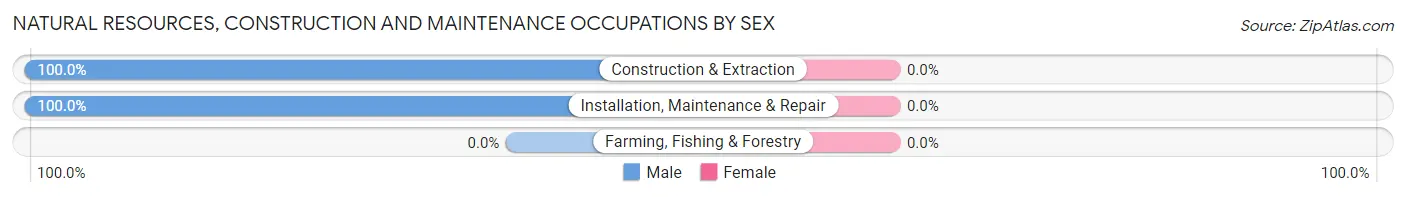
Natural Resources, Construction and Maintenance Occupations by Sex
| Occupation | Male | Female |
| Farming, Fishing & Forestry | 0 (0.0%) | 0 (0.0%) |
| Construction & Extraction | 9 (100.0%) | 0 (0.0%) |
| Installation, Maintenance & Repair | 88 (100.0%) | 0 (0.0%) |
| Total (Category) | 97 (100.0%) | 0 (0.0%) |
| Total (Overall) | 310 (62.4%) | 187 (37.6%) |
Production, Transportation and Moving Occupations
The most common Production, Transportation and Moving occupations in Watkins are Transportation (39 | 7.9%), Production (18 | 3.6%), and Material Moving (7 | 1.4%).
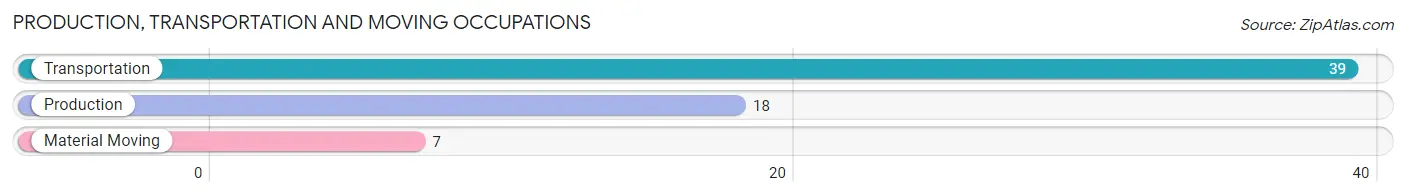
Production, Transportation and Moving Occupations by Sex
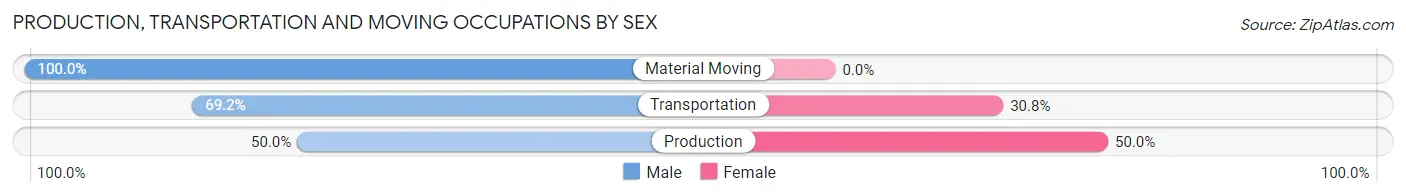
| Occupation | Male | Female |
| Production | 9 (50.0%) | 9 (50.0%) |
| Transportation | 27 (69.2%) | 12 (30.8%) |
| Material Moving | 7 (100.0%) | 0 (0.0%) |
| Total (Category) | 43 (67.2%) | 21 (32.8%) |
| Total (Overall) | 310 (62.4%) | 187 (37.6%) |
Employment Industries by Sex in Watkins
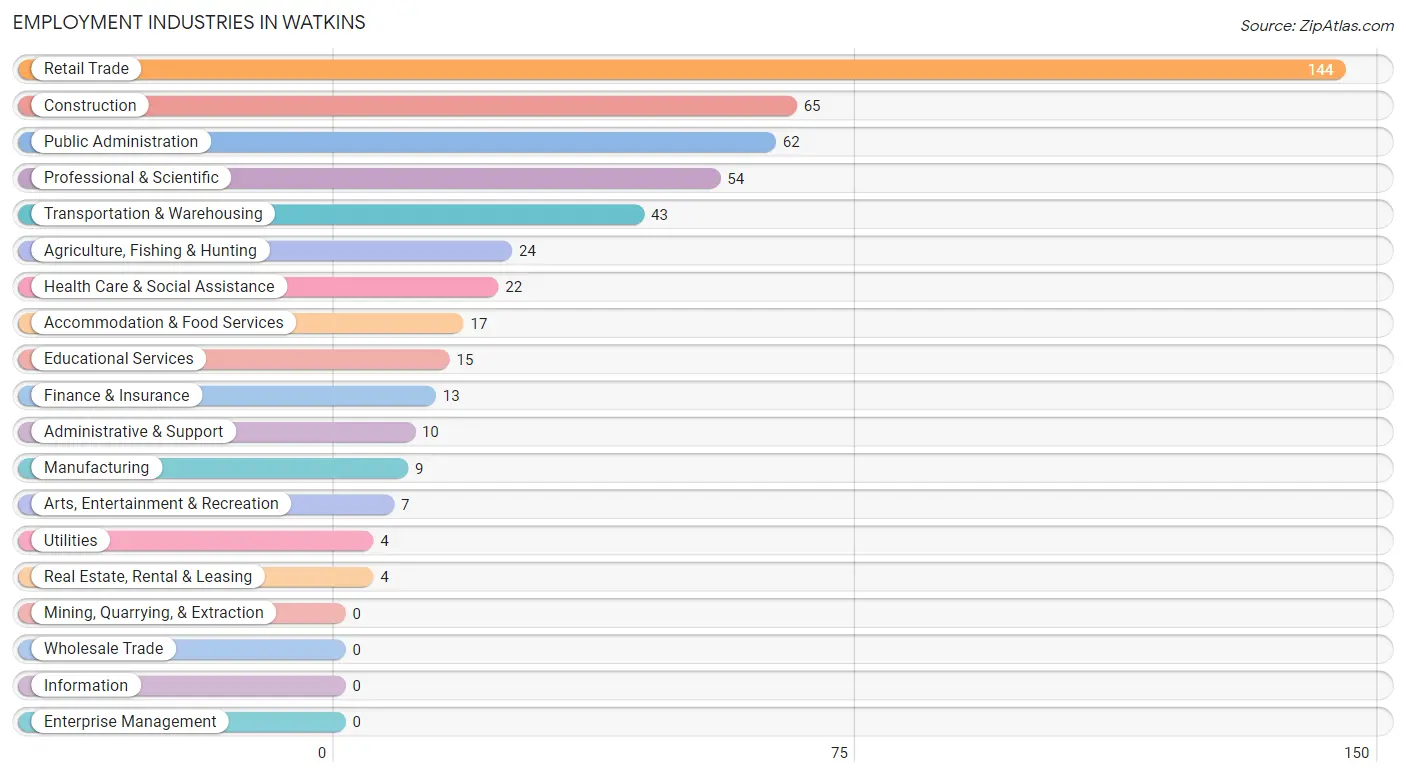
Employment Industries in Watkins
The major employment industries in Watkins include Retail Trade (144 | 29.0%), Construction (65 | 13.1%), Public Administration (62 | 12.5%), Professional & Scientific (54 | 10.9%), and Transportation & Warehousing (43 | 8.6%).
Employment Industries by Sex in Watkins
The Watkins industries that see more men than women are Manufacturing (100.0%), Real Estate, Rental & Leasing (100.0%), and Retail Trade (93.1%), whereas the industries that tend to have a higher number of women are Utilities (100.0%), Finance & Insurance (100.0%), and Arts, Entertainment & Recreation (100.0%).
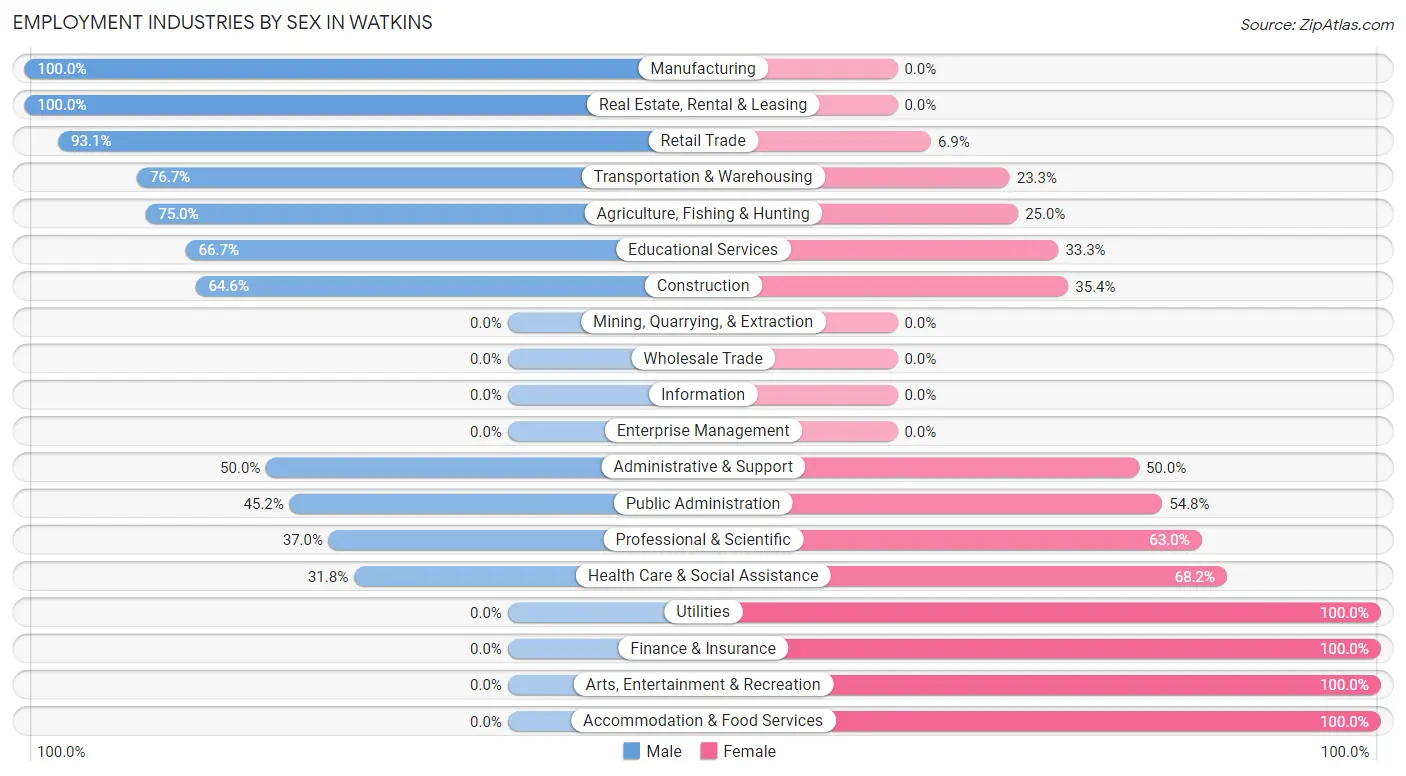
| Industry | Male | Female |
| Agriculture, Fishing & Hunting | 18 (75.0%) | 6 (25.0%) |
| Mining, Quarrying, & Extraction | 0 (0.0%) | 0 (0.0%) |
| Construction | 42 (64.6%) | 23 (35.4%) |
| Manufacturing | 9 (100.0%) | 0 (0.0%) |
| Wholesale Trade | 0 (0.0%) | 0 (0.0%) |
| Retail Trade | 134 (93.1%) | 10 (6.9%) |
| Transportation & Warehousing | 33 (76.7%) | 10 (23.3%) |
| Utilities | 0 (0.0%) | 4 (100.0%) |
| Information | 0 (0.0%) | 0 (0.0%) |
| Finance & Insurance | 0 (0.0%) | 13 (100.0%) |
| Real Estate, Rental & Leasing | 4 (100.0%) | 0 (0.0%) |
| Professional & Scientific | 20 (37.0%) | 34 (63.0%) |
| Enterprise Management | 0 (0.0%) | 0 (0.0%) |
| Administrative & Support | 5 (50.0%) | 5 (50.0%) |
| Educational Services | 10 (66.7%) | 5 (33.3%) |
| Health Care & Social Assistance | 7 (31.8%) | 15 (68.2%) |
| Arts, Entertainment & Recreation | 0 (0.0%) | 7 (100.0%) |
| Accommodation & Food Services | 0 (0.0%) | 17 (100.0%) |
| Public Administration | 28 (45.2%) | 34 (54.8%) |
| Total | 310 (62.4%) | 187 (37.6%) |
Education in Watkins
School Enrollment in Watkins
The most common levels of schooling among the 121 students in Watkins are middle school (43 | 35.5%), graduate / professional (30 | 24.8%), and elementary school (20 | 16.5%).
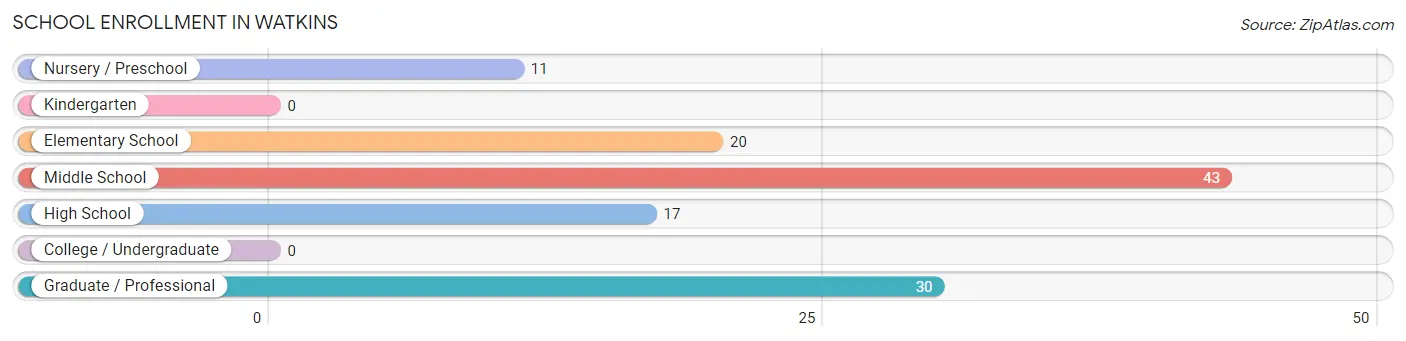
| School Level | # Students | % Students |
| Nursery / Preschool | 11 | 9.1% |
| Kindergarten | 0 | 0.0% |
| Elementary School | 20 | 16.5% |
| Middle School | 43 | 35.5% |
| High School | 17 | 14.1% |
| College / Undergraduate | 0 | 0.0% |
| Graduate / Professional | 30 | 24.8% |
| Total | 121 | 100.0% |
School Enrollment by Age by Funding Source in Watkins
Out of a total of 121 students who are enrolled in schools in Watkins, 8 (6.6%) attend a private institution, while the remaining 113 (93.4%) are enrolled in public schools. The age group of 10 to 14 year olds has the highest likelihood of being enrolled in private schools, with 8 (18.6% in the age bracket) enrolled. Conversely, the age group of 5 to 9 year old has the lowest likelihood of being enrolled in a private school, with 31 (100.0% in the age bracket) attending a public institution.
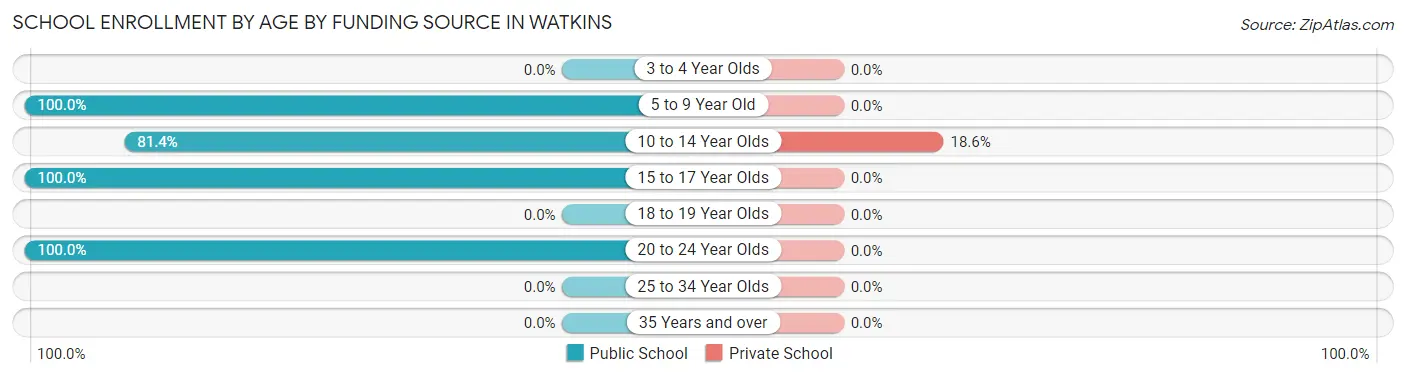
| Age Bracket | Public School | Private School |
| 3 to 4 Year Olds | 0 (0.0%) | 0 (0.0%) |
| 5 to 9 Year Old | 31 (100.0%) | 0 (0.0%) |
| 10 to 14 Year Olds | 35 (81.4%) | 8 (18.6%) |
| 15 to 17 Year Olds | 17 (100.0%) | 0 (0.0%) |
| 18 to 19 Year Olds | 0 (0.0%) | 0 (0.0%) |
| 20 to 24 Year Olds | 30 (100.0%) | 0 (0.0%) |
| 25 to 34 Year Olds | 0 (0.0%) | 0 (0.0%) |
| 35 Years and over | 0 (0.0%) | 0 (0.0%) |
| Total | 113 (93.4%) | 8 (6.6%) |
Educational Attainment by Field of Study in Watkins
Business (73 | 31.5%), social sciences (40 | 17.2%), bio, nature & agricultural (27 | 11.6%), computers & mathematics (24 | 10.3%), and education (15 | 6.5%) are the most common fields of study among 232 individuals in Watkins who have obtained a bachelor's degree or higher.
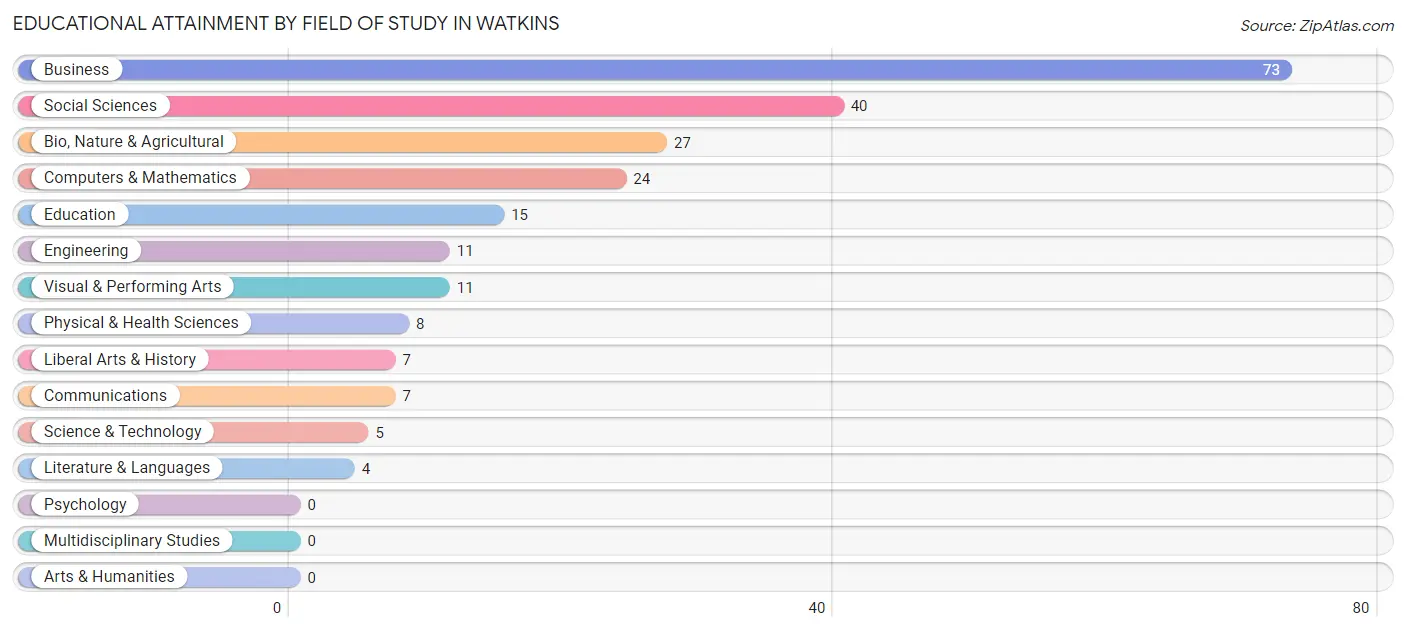
| Field of Study | # Graduates | % Graduates |
| Computers & Mathematics | 24 | 10.3% |
| Bio, Nature & Agricultural | 27 | 11.6% |
| Physical & Health Sciences | 8 | 3.5% |
| Psychology | 0 | 0.0% |
| Social Sciences | 40 | 17.2% |
| Engineering | 11 | 4.7% |
| Multidisciplinary Studies | 0 | 0.0% |
| Science & Technology | 5 | 2.2% |
| Business | 73 | 31.5% |
| Education | 15 | 6.5% |
| Literature & Languages | 4 | 1.7% |
| Liberal Arts & History | 7 | 3.0% |
| Visual & Performing Arts | 11 | 4.7% |
| Communications | 7 | 3.0% |
| Arts & Humanities | 0 | 0.0% |
| Total | 232 | 100.0% |
Transportation & Commute in Watkins
Vehicle Availability by Sex in Watkins
The most prevalent vehicle ownership categories in Watkins are males with 5 or more vehicles (163, accounting for 52.6%) and females with 5 or more vehicles (36, making up 87.2%).
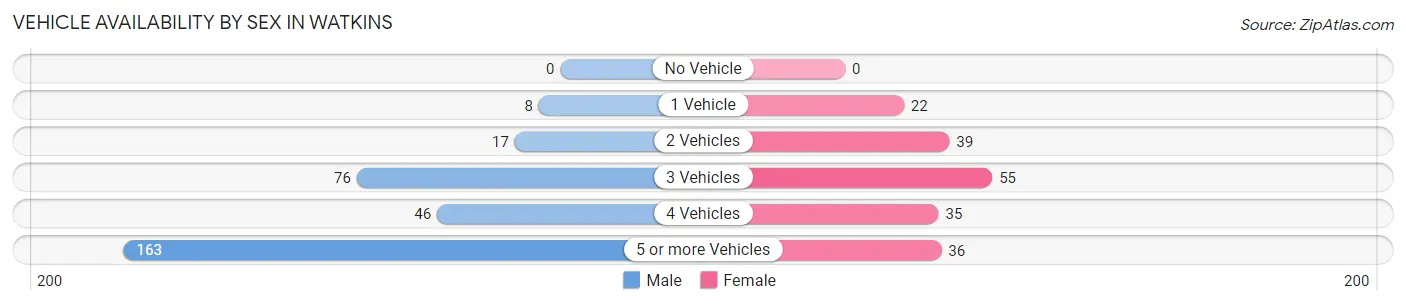
| Vehicles Available | Male | Female |
| No Vehicle | 0 (0.0%) | 0 (0.0%) |
| 1 Vehicle | 8 (2.6%) | 22 (11.8%) |
| 2 Vehicles | 17 (5.5%) | 39 (20.9%) |
| 3 Vehicles | 76 (24.5%) | 55 (29.4%) |
| 4 Vehicles | 46 (14.8%) | 35 (18.7%) |
| 5 or more Vehicles | 163 (52.6%) | 36 (19.3%) |
| Total | 310 (100.0%) | 187 (100.0%) |
Commute Time in Watkins
The most frequently occuring commute durations in Watkins are 30 to 34 minutes (223 commuters, 48.0%), 35 to 39 minutes (60 commuters, 12.9%), and 45 to 59 minutes (47 commuters, 10.1%).
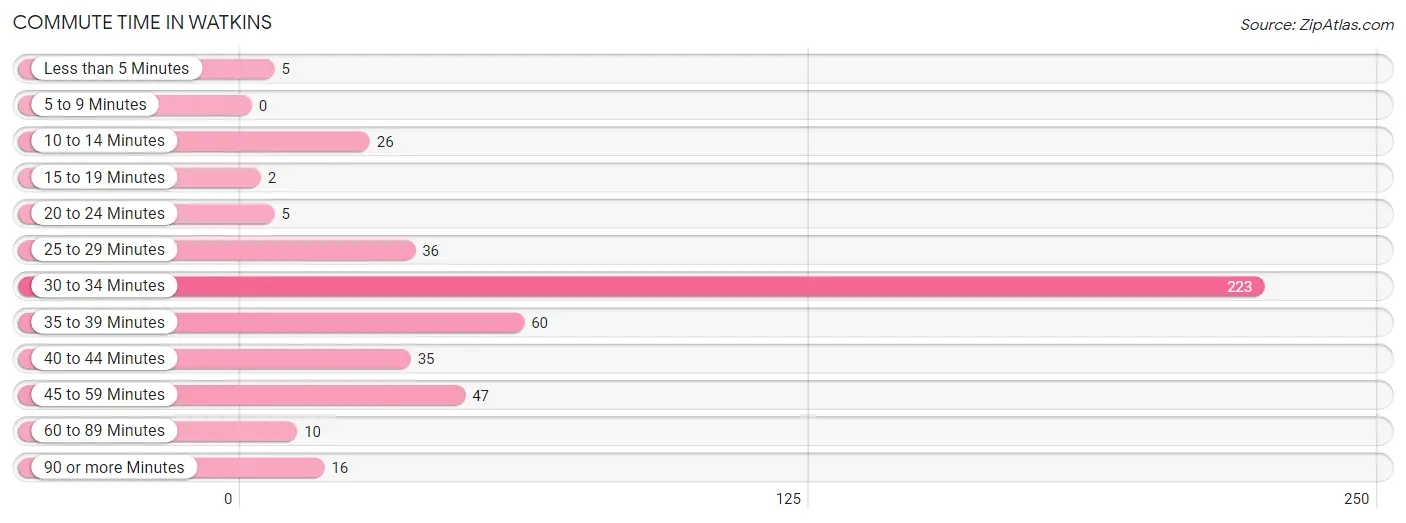
| Commute Time | # Commuters | % Commuters |
| Less than 5 Minutes | 5 | 1.1% |
| 5 to 9 Minutes | 0 | 0.0% |
| 10 to 14 Minutes | 26 | 5.6% |
| 15 to 19 Minutes | 2 | 0.4% |
| 20 to 24 Minutes | 5 | 1.1% |
| 25 to 29 Minutes | 36 | 7.7% |
| 30 to 34 Minutes | 223 | 48.0% |
| 35 to 39 Minutes | 60 | 12.9% |
| 40 to 44 Minutes | 35 | 7.5% |
| 45 to 59 Minutes | 47 | 10.1% |
| 60 to 89 Minutes | 10 | 2.1% |
| 90 or more Minutes | 16 | 3.4% |
Commute Time by Sex in Watkins
The most common commute times in Watkins are 30 to 34 minutes (166 commuters, 57.6%) for males and 30 to 34 minutes (57 commuters, 32.2%) for females.
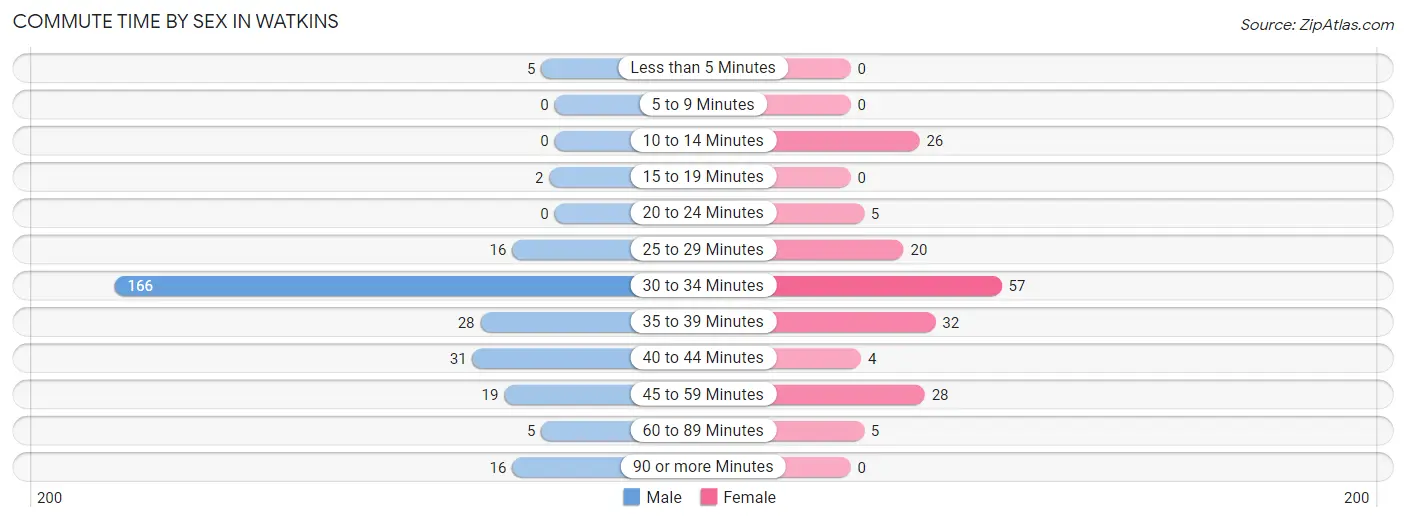
| Commute Time | Male | Female |
| Less than 5 Minutes | 5 (1.7%) | 0 (0.0%) |
| 5 to 9 Minutes | 0 (0.0%) | 0 (0.0%) |
| 10 to 14 Minutes | 0 (0.0%) | 26 (14.7%) |
| 15 to 19 Minutes | 2 (0.7%) | 0 (0.0%) |
| 20 to 24 Minutes | 0 (0.0%) | 5 (2.8%) |
| 25 to 29 Minutes | 16 (5.6%) | 20 (11.3%) |
| 30 to 34 Minutes | 166 (57.6%) | 57 (32.2%) |
| 35 to 39 Minutes | 28 (9.7%) | 32 (18.1%) |
| 40 to 44 Minutes | 31 (10.8%) | 4 (2.3%) |
| 45 to 59 Minutes | 19 (6.6%) | 28 (15.8%) |
| 60 to 89 Minutes | 5 (1.7%) | 5 (2.8%) |
| 90 or more Minutes | 16 (5.6%) | 0 (0.0%) |
Time of Departure to Work by Sex in Watkins
The most frequent times of departure to work in Watkins are 5:30 AM to 5:59 AM (145, 50.3%) for males and 6:00 AM to 6:29 AM (68, 38.4%) for females.
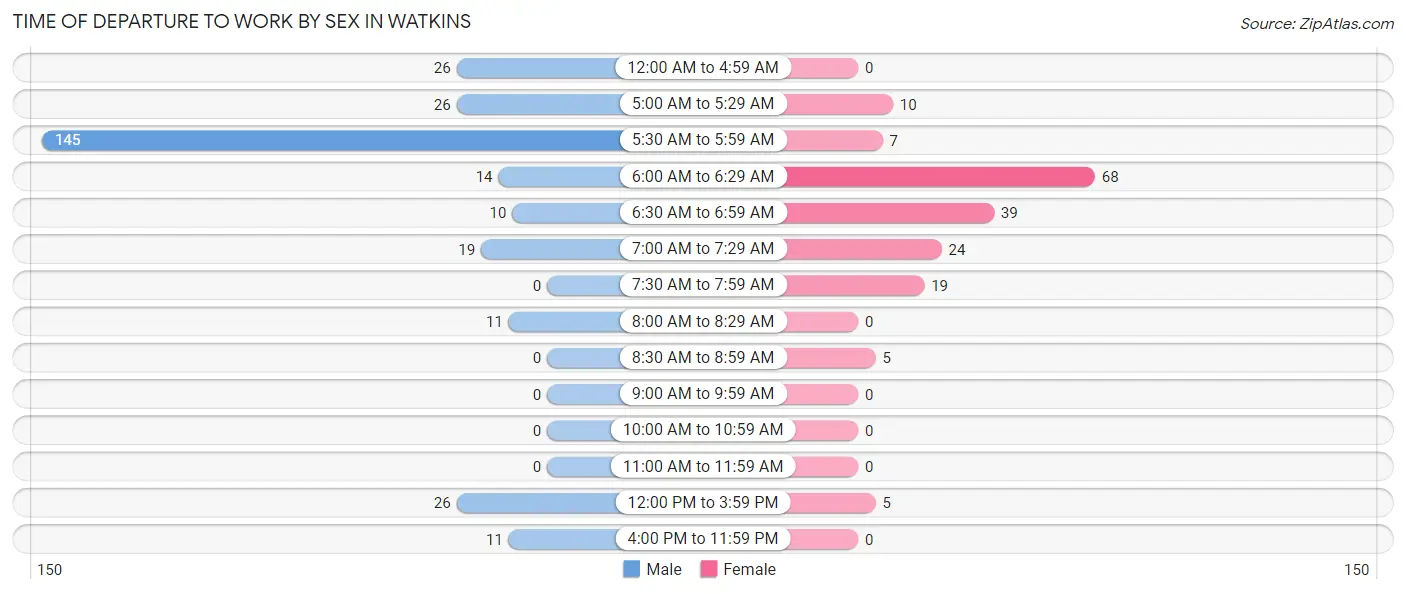
| Time of Departure | Male | Female |
| 12:00 AM to 4:59 AM | 26 (9.0%) | 0 (0.0%) |
| 5:00 AM to 5:29 AM | 26 (9.0%) | 10 (5.7%) |
| 5:30 AM to 5:59 AM | 145 (50.3%) | 7 (4.0%) |
| 6:00 AM to 6:29 AM | 14 (4.9%) | 68 (38.4%) |
| 6:30 AM to 6:59 AM | 10 (3.5%) | 39 (22.0%) |
| 7:00 AM to 7:29 AM | 19 (6.6%) | 24 (13.6%) |
| 7:30 AM to 7:59 AM | 0 (0.0%) | 19 (10.7%) |
| 8:00 AM to 8:29 AM | 11 (3.8%) | 0 (0.0%) |
| 8:30 AM to 8:59 AM | 0 (0.0%) | 5 (2.8%) |
| 9:00 AM to 9:59 AM | 0 (0.0%) | 0 (0.0%) |
| 10:00 AM to 10:59 AM | 0 (0.0%) | 0 (0.0%) |
| 11:00 AM to 11:59 AM | 0 (0.0%) | 0 (0.0%) |
| 12:00 PM to 3:59 PM | 26 (9.0%) | 5 (2.8%) |
| 4:00 PM to 11:59 PM | 11 (3.8%) | 0 (0.0%) |
| Total | 288 (100.0%) | 177 (100.0%) |
Housing Occupancy in Watkins
Occupancy by Ownership in Watkins
Of the total 336 dwellings in Watkins, owner-occupied units account for 335 (99.7%), while renter-occupied units make up 1 (0.3%).
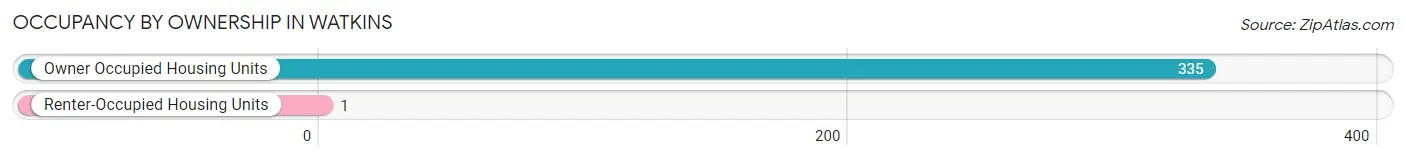
| Occupancy | # Housing Units | % Housing Units |
| Owner Occupied Housing Units | 335 | 99.7% |
| Renter-Occupied Housing Units | 1 | 0.3% |
| Total Occupied Housing Units | 336 | 100.0% |
Occupancy by Household Size in Watkins
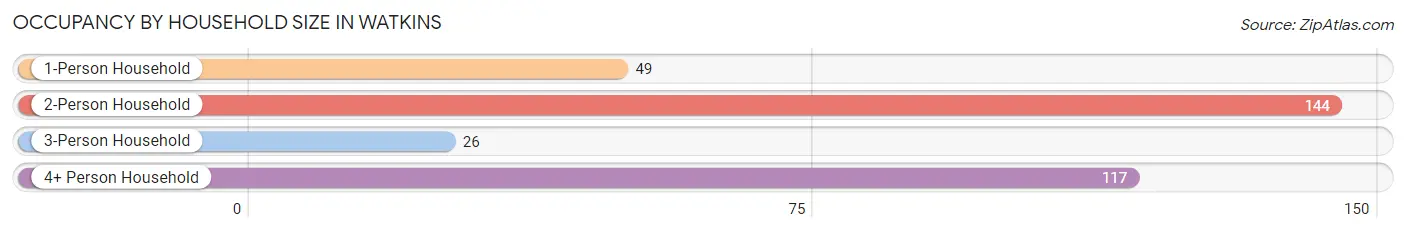
| Household Size | # Housing Units | % Housing Units |
| 1-Person Household | 49 | 14.6% |
| 2-Person Household | 144 | 42.9% |
| 3-Person Household | 26 | 7.7% |
| 4+ Person Household | 117 | 34.8% |
| Total Housing Units | 336 | 100.0% |
Occupancy by Ownership by Household Size in Watkins
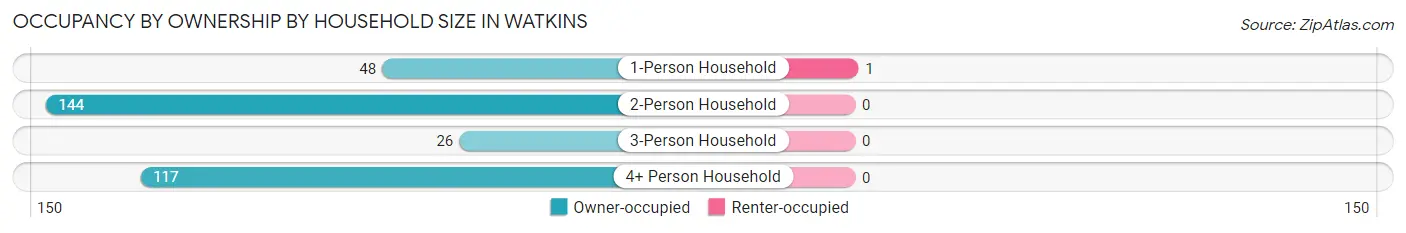
| Household Size | Owner-occupied | Renter-occupied |
| 1-Person Household | 48 (98.0%) | 1 (2.0%) |
| 2-Person Household | 144 (100.0%) | 0 (0.0%) |
| 3-Person Household | 26 (100.0%) | 0 (0.0%) |
| 4+ Person Household | 117 (100.0%) | 0 (0.0%) |
| Total Housing Units | 335 (99.7%) | 1 (0.3%) |
Occupancy by Educational Attainment in Watkins
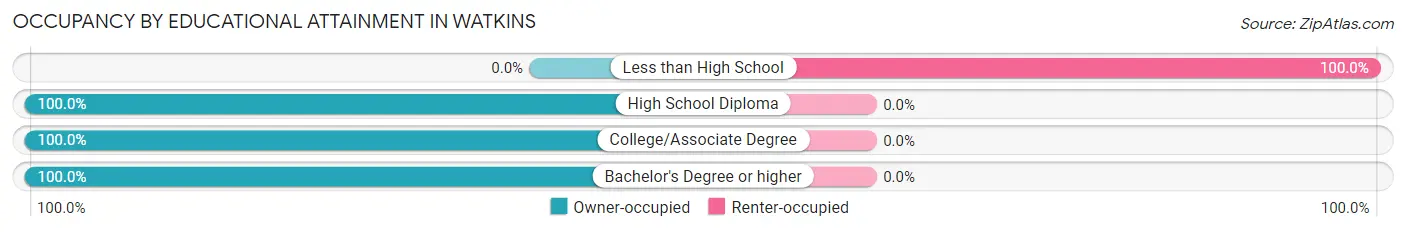
| Household Size | Owner-occupied | Renter-occupied |
| Less than High School | 0 (0.0%) | 1 (100.0%) |
| High School Diploma | 127 (100.0%) | 0 (0.0%) |
| College/Associate Degree | 105 (100.0%) | 0 (0.0%) |
| Bachelor's Degree or higher | 103 (100.0%) | 0 (0.0%) |
Occupancy by Age of Householder in Watkins
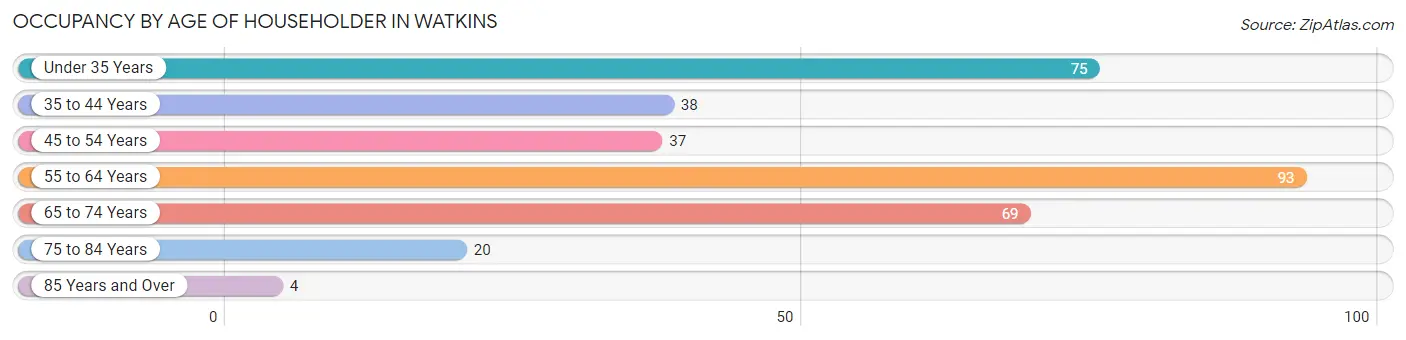
| Age Bracket | # Households | % Households |
| Under 35 Years | 75 | 22.3% |
| 35 to 44 Years | 38 | 11.3% |
| 45 to 54 Years | 37 | 11.0% |
| 55 to 64 Years | 93 | 27.7% |
| 65 to 74 Years | 69 | 20.5% |
| 75 to 84 Years | 20 | 5.9% |
| 85 Years and Over | 4 | 1.2% |
| Total | 336 | 100.0% |
Housing Finances in Watkins
Median Income by Occupancy in Watkins
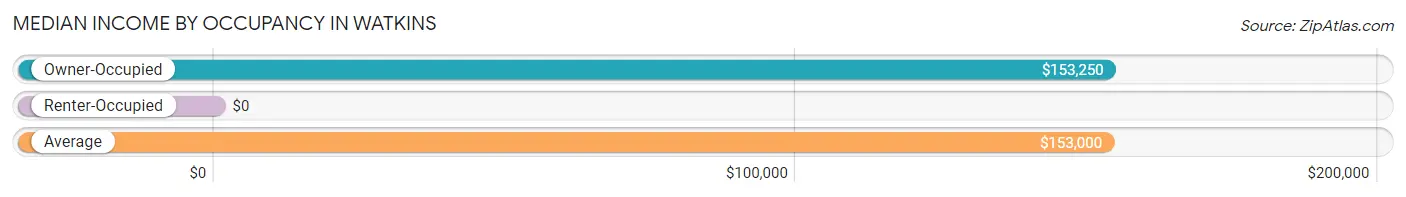
| Occupancy Type | # Households | Median Income |
| Owner-Occupied | 335 (99.7%) | $153,250 |
| Renter-Occupied | 1 (0.3%) | $0 |
| Average | 336 (100.0%) | $153,000 |
Occupancy by Householder Income Bracket in Watkins
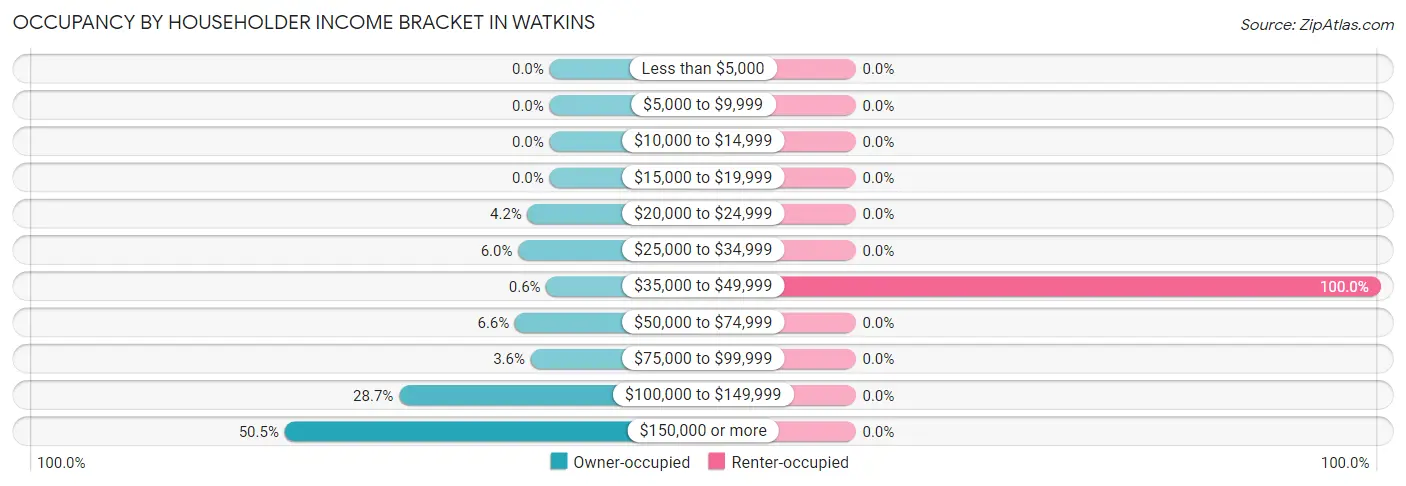
| Income Bracket | Owner-occupied | Renter-occupied |
| Less than $5,000 | 0 (0.0%) | 0 (0.0%) |
| $5,000 to $9,999 | 0 (0.0%) | 0 (0.0%) |
| $10,000 to $14,999 | 0 (0.0%) | 0 (0.0%) |
| $15,000 to $19,999 | 0 (0.0%) | 0 (0.0%) |
| $20,000 to $24,999 | 14 (4.2%) | 0 (0.0%) |
| $25,000 to $34,999 | 20 (6.0%) | 0 (0.0%) |
| $35,000 to $49,999 | 2 (0.6%) | 1 (100.0%) |
| $50,000 to $74,999 | 22 (6.6%) | 0 (0.0%) |
| $75,000 to $99,999 | 12 (3.6%) | 0 (0.0%) |
| $100,000 to $149,999 | 96 (28.7%) | 0 (0.0%) |
| $150,000 or more | 169 (50.4%) | 0 (0.0%) |
| Total | 335 (100.0%) | 1 (100.0%) |
Monthly Housing Cost Tiers in Watkins
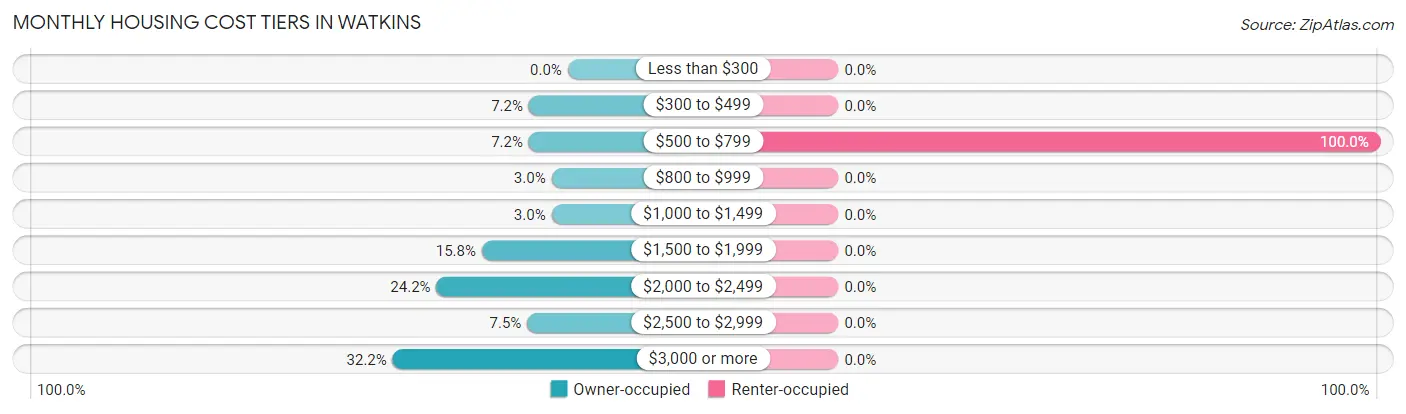
| Monthly Cost | Owner-occupied | Renter-occupied |
| Less than $300 | 0 (0.0%) | 0 (0.0%) |
| $300 to $499 | 24 (7.2%) | 0 (0.0%) |
| $500 to $799 | 24 (7.2%) | 1 (100.0%) |
| $800 to $999 | 10 (3.0%) | 0 (0.0%) |
| $1,000 to $1,499 | 10 (3.0%) | 0 (0.0%) |
| $1,500 to $1,999 | 53 (15.8%) | 0 (0.0%) |
| $2,000 to $2,499 | 81 (24.2%) | 0 (0.0%) |
| $2,500 to $2,999 | 25 (7.5%) | 0 (0.0%) |
| $3,000 or more | 108 (32.2%) | 0 (0.0%) |
| Total | 335 (100.0%) | 1 (100.0%) |
Physical Housing Characteristics in Watkins
Housing Structures in Watkins
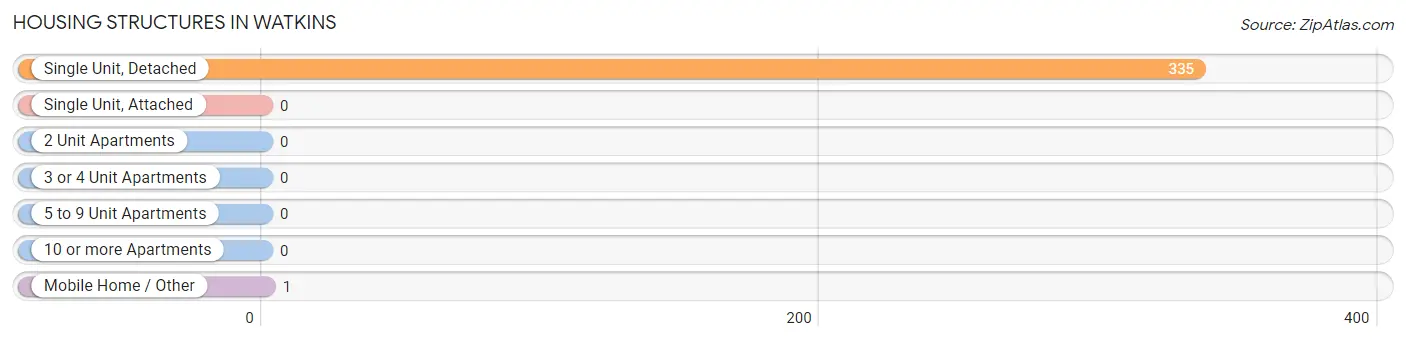
| Structure Type | # Housing Units | % Housing Units |
| Single Unit, Detached | 335 | 99.7% |
| Single Unit, Attached | 0 | 0.0% |
| 2 Unit Apartments | 0 | 0.0% |
| 3 or 4 Unit Apartments | 0 | 0.0% |
| 5 to 9 Unit Apartments | 0 | 0.0% |
| 10 or more Apartments | 0 | 0.0% |
| Mobile Home / Other | 1 | 0.3% |
| Total | 336 | 100.0% |
Housing Structures by Occupancy in Watkins
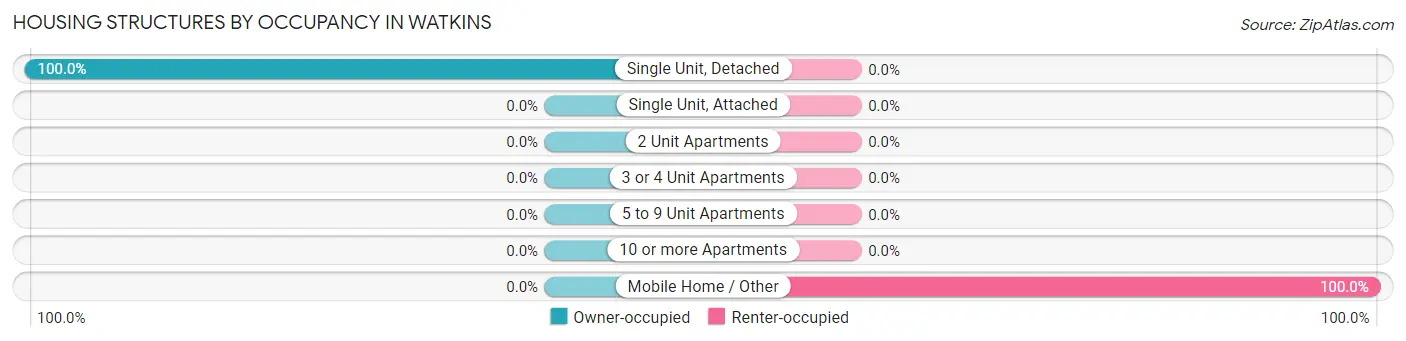
| Structure Type | Owner-occupied | Renter-occupied |
| Single Unit, Detached | 335 (100.0%) | 0 (0.0%) |
| Single Unit, Attached | 0 (0.0%) | 0 (0.0%) |
| 2 Unit Apartments | 0 (0.0%) | 0 (0.0%) |
| 3 or 4 Unit Apartments | 0 (0.0%) | 0 (0.0%) |
| 5 to 9 Unit Apartments | 0 (0.0%) | 0 (0.0%) |
| 10 or more Apartments | 0 (0.0%) | 0 (0.0%) |
| Mobile Home / Other | 0 (0.0%) | 1 (100.0%) |
| Total | 335 (99.7%) | 1 (0.3%) |
Housing Structures by Number of Rooms in Watkins
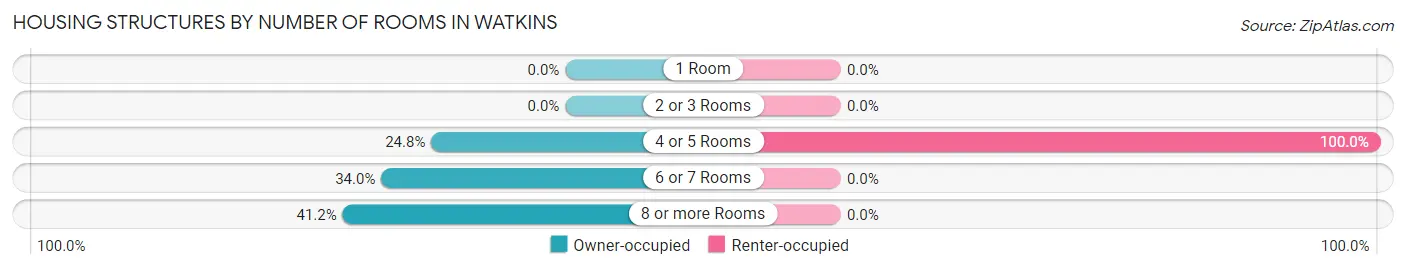
| Number of Rooms | Owner-occupied | Renter-occupied |
| 1 Room | 0 (0.0%) | 0 (0.0%) |
| 2 or 3 Rooms | 0 (0.0%) | 0 (0.0%) |
| 4 or 5 Rooms | 83 (24.8%) | 1 (100.0%) |
| 6 or 7 Rooms | 114 (34.0%) | 0 (0.0%) |
| 8 or more Rooms | 138 (41.2%) | 0 (0.0%) |
| Total | 335 (100.0%) | 1 (100.0%) |
Housing Structure by Heating Type in Watkins
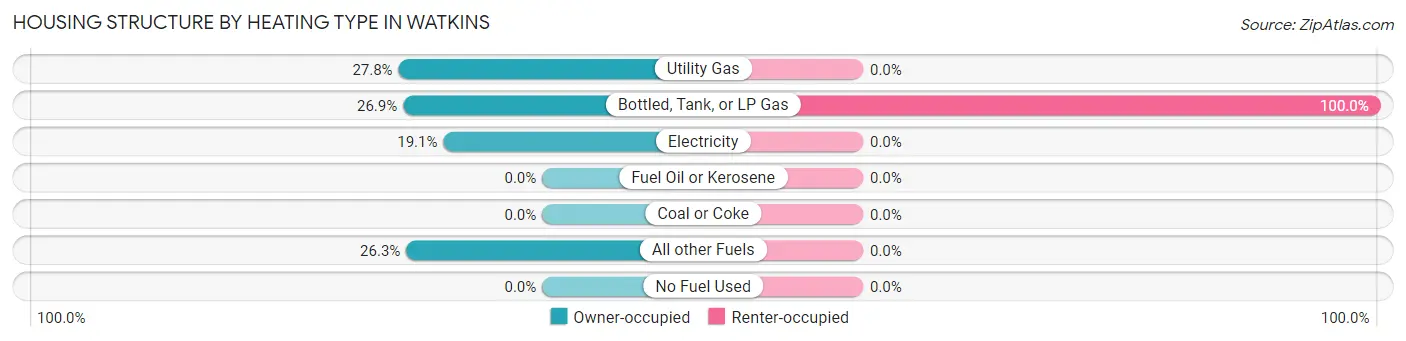
| Heating Type | Owner-occupied | Renter-occupied |
| Utility Gas | 93 (27.8%) | 0 (0.0%) |
| Bottled, Tank, or LP Gas | 90 (26.9%) | 1 (100.0%) |
| Electricity | 64 (19.1%) | 0 (0.0%) |
| Fuel Oil or Kerosene | 0 (0.0%) | 0 (0.0%) |
| Coal or Coke | 0 (0.0%) | 0 (0.0%) |
| All other Fuels | 88 (26.3%) | 0 (0.0%) |
| No Fuel Used | 0 (0.0%) | 0 (0.0%) |
| Total | 335 (100.0%) | 1 (100.0%) |
Household Vehicle Usage in Watkins
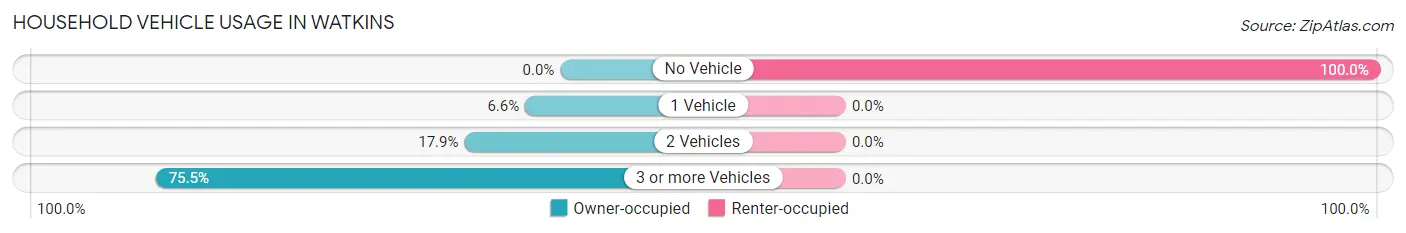
| Vehicles per Household | Owner-occupied | Renter-occupied |
| No Vehicle | 0 (0.0%) | 1 (100.0%) |
| 1 Vehicle | 22 (6.6%) | 0 (0.0%) |
| 2 Vehicles | 60 (17.9%) | 0 (0.0%) |
| 3 or more Vehicles | 253 (75.5%) | 0 (0.0%) |
| Total | 335 (100.0%) | 1 (100.0%) |
Real Estate & Mortgages in Watkins
Real Estate and Mortgage Overview in Watkins
| Characteristic | Without Mortgage | With Mortgage |
| Housing Units | 41 | 294 |
| Median Property Value | $496,400 | $650,700 |
| Median Household Income | $112,679 | $164 |
| Monthly Housing Costs | $471 | $108 |
| Real Estate Taxes | $1,554 | $0 |
Property Value by Mortgage Status in Watkins
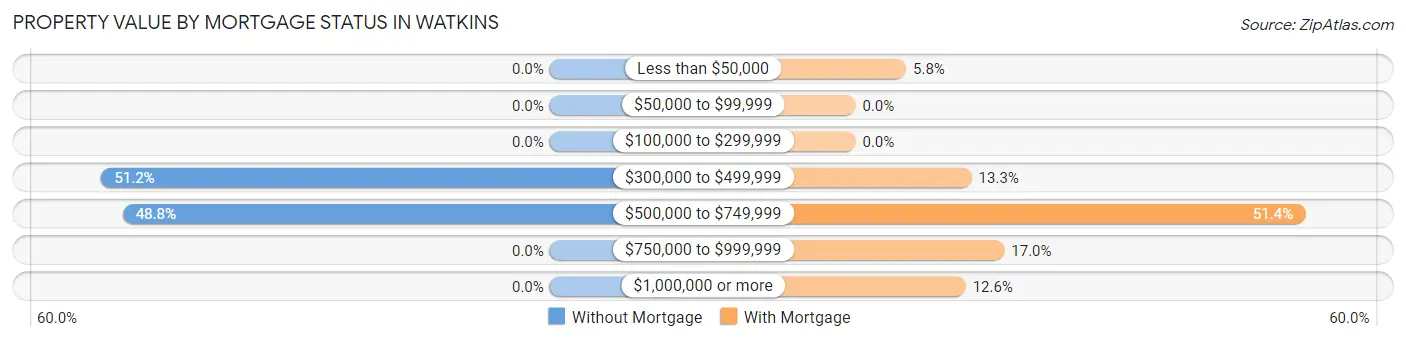
| Property Value | Without Mortgage | With Mortgage |
| Less than $50,000 | 0 (0.0%) | 17 (5.8%) |
| $50,000 to $99,999 | 0 (0.0%) | 0 (0.0%) |
| $100,000 to $299,999 | 0 (0.0%) | 0 (0.0%) |
| $300,000 to $499,999 | 21 (51.2%) | 39 (13.3%) |
| $500,000 to $749,999 | 20 (48.8%) | 151 (51.4%) |
| $750,000 to $999,999 | 0 (0.0%) | 50 (17.0%) |
| $1,000,000 or more | 0 (0.0%) | 37 (12.6%) |
| Total | 41 (100.0%) | 294 (100.0%) |
Household Income by Mortgage Status in Watkins
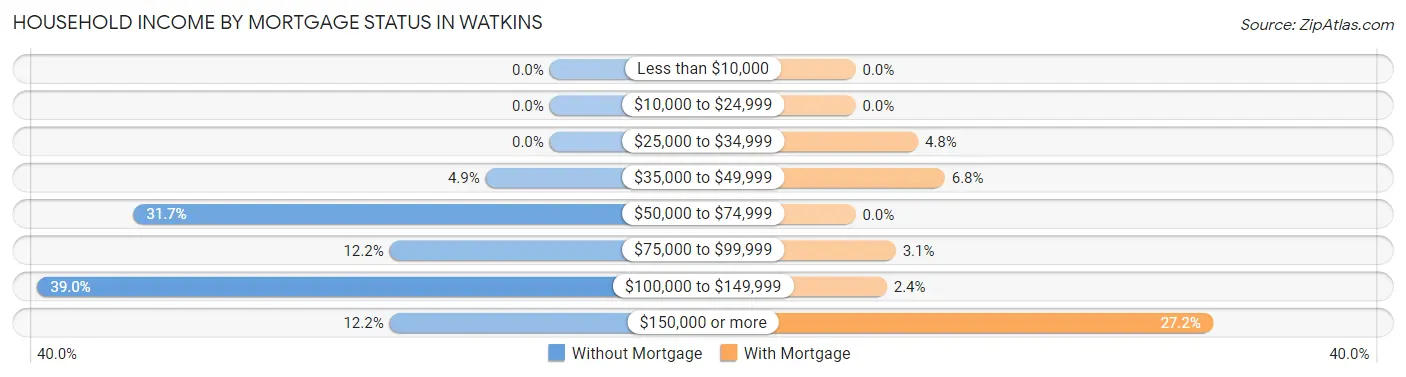
| Household Income | Without Mortgage | With Mortgage |
| Less than $10,000 | 0 (0.0%) | 0 (0.0%) |
| $10,000 to $24,999 | 0 (0.0%) | 0 (0.0%) |
| $25,000 to $34,999 | 0 (0.0%) | 14 (4.8%) |
| $35,000 to $49,999 | 2 (4.9%) | 20 (6.8%) |
| $50,000 to $74,999 | 13 (31.7%) | 0 (0.0%) |
| $75,000 to $99,999 | 5 (12.2%) | 9 (3.1%) |
| $100,000 to $149,999 | 16 (39.0%) | 7 (2.4%) |
| $150,000 or more | 5 (12.2%) | 80 (27.2%) |
| Total | 41 (100.0%) | 294 (100.0%) |
Property Value to Household Income Ratio in Watkins
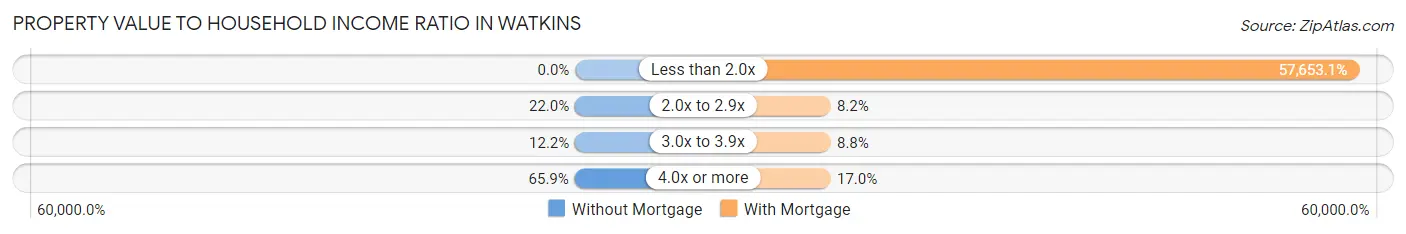
| Value-to-Income Ratio | Without Mortgage | With Mortgage |
| Less than 2.0x | 0 (0.0%) | 169,500 (57,653.1%) |
| 2.0x to 2.9x | 9 (22.0%) | 24 (8.2%) |
| 3.0x to 3.9x | 5 (12.2%) | 26 (8.8%) |
| 4.0x or more | 27 (65.8%) | 50 (17.0%) |
| Total | 41 (100.0%) | 294 (100.0%) |
Real Estate Taxes by Mortgage Status in Watkins
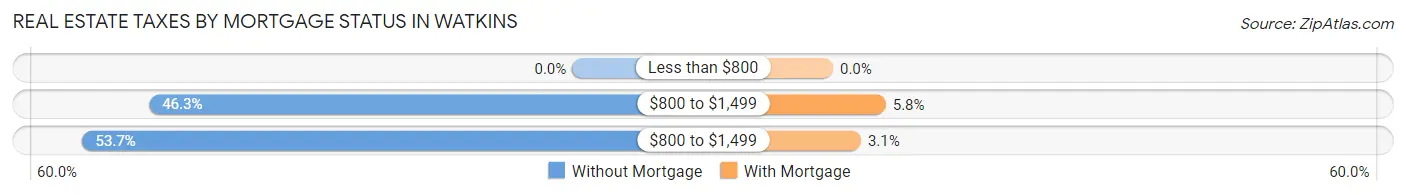
| Property Taxes | Without Mortgage | With Mortgage |
| Less than $800 | 0 (0.0%) | 0 (0.0%) |
| $800 to $1,499 | 19 (46.3%) | 17 (5.8%) |
| $800 to $1,499 | 22 (53.7%) | 9 (3.1%) |
| Total | 41 (100.0%) | 294 (100.0%) |
Health & Disability in Watkins
Health Insurance Coverage by Age in Watkins
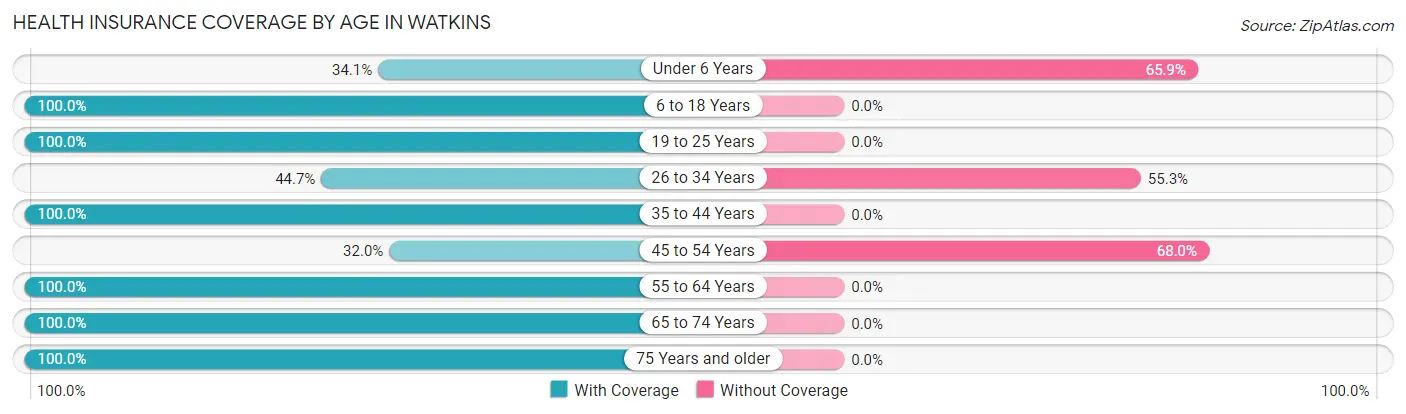
| Age Bracket | With Coverage | Without Coverage |
| Under 6 Years | 30 (34.1%) | 58 (65.9%) |
| 6 to 18 Years | 80 (100.0%) | 0 (0.0%) |
| 19 to 25 Years | 30 (100.0%) | 0 (0.0%) |
| 26 to 34 Years | 80 (44.7%) | 99 (55.3%) |
| 35 to 44 Years | 73 (100.0%) | 0 (0.0%) |
| 45 to 54 Years | 65 (32.0%) | 138 (68.0%) |
| 55 to 64 Years | 170 (100.0%) | 0 (0.0%) |
| 65 to 74 Years | 109 (100.0%) | 0 (0.0%) |
| 75 Years and older | 59 (100.0%) | 0 (0.0%) |
| Total | 696 (70.2%) | 295 (29.8%) |
Health Insurance Coverage by Citizenship Status in Watkins
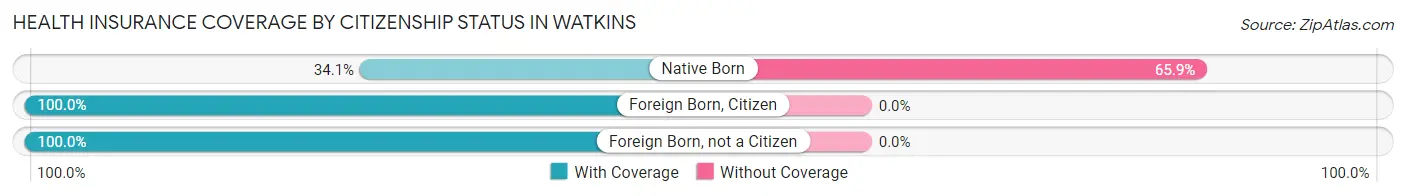
| Citizenship Status | With Coverage | Without Coverage |
| Native Born | 30 (34.1%) | 58 (65.9%) |
| Foreign Born, Citizen | 80 (100.0%) | 0 (0.0%) |
| Foreign Born, not a Citizen | 30 (100.0%) | 0 (0.0%) |
Health Insurance Coverage by Household Income in Watkins
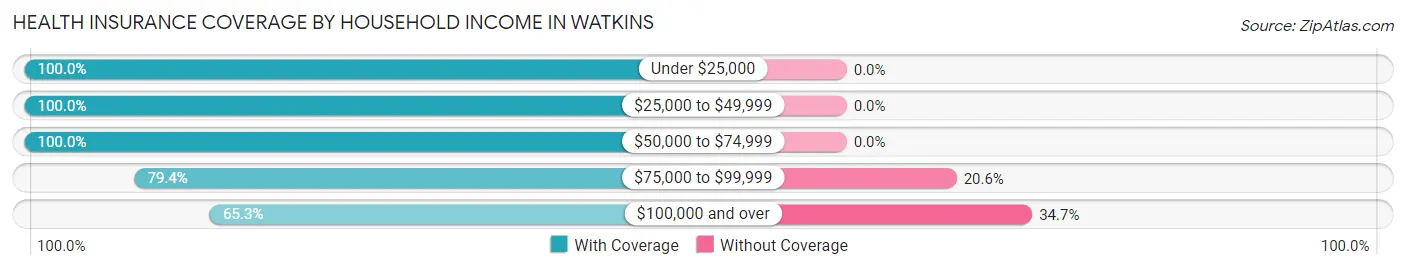
| Household Income | With Coverage | Without Coverage |
| Under $25,000 | 47 (100.0%) | 0 (0.0%) |
| $25,000 to $49,999 | 45 (100.0%) | 0 (0.0%) |
| $50,000 to $74,999 | 36 (100.0%) | 0 (0.0%) |
| $75,000 to $99,999 | 27 (79.4%) | 7 (20.6%) |
| $100,000 and over | 541 (65.3%) | 288 (34.7%) |
Public vs Private Health Insurance Coverage by Age in Watkins
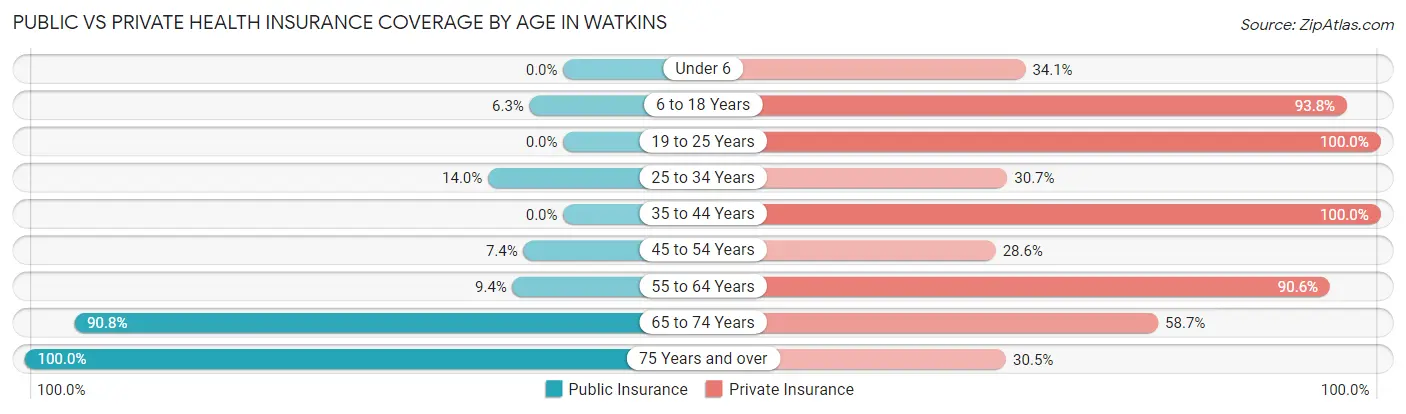
| Age Bracket | Public Insurance | Private Insurance |
| Under 6 | 0 (0.0%) | 30 (34.1%) |
| 6 to 18 Years | 5 (6.2%) | 75 (93.8%) |
| 19 to 25 Years | 0 (0.0%) | 30 (100.0%) |
| 25 to 34 Years | 25 (14.0%) | 55 (30.7%) |
| 35 to 44 Years | 0 (0.0%) | 73 (100.0%) |
| 45 to 54 Years | 15 (7.4%) | 58 (28.6%) |
| 55 to 64 Years | 16 (9.4%) | 154 (90.6%) |
| 65 to 74 Years | 99 (90.8%) | 64 (58.7%) |
| 75 Years and over | 59 (100.0%) | 18 (30.5%) |
| Total | 219 (22.1%) | 557 (56.2%) |
Disability Status by Sex by Age in Watkins
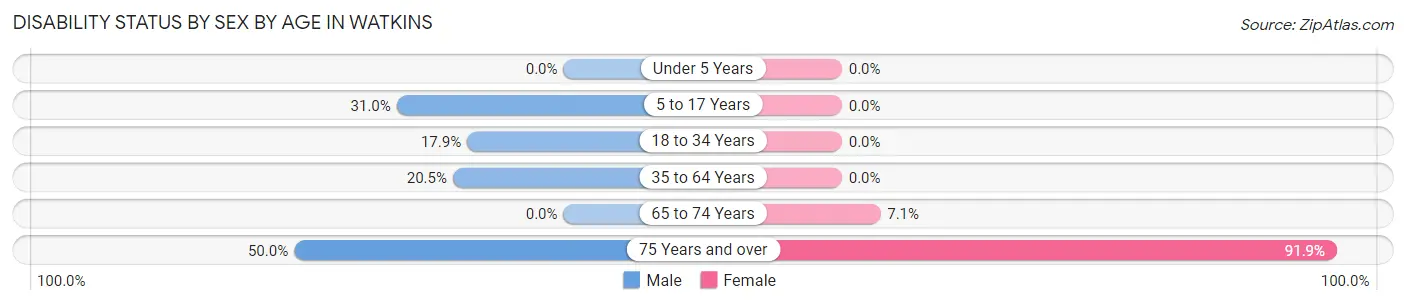
| Age Bracket | Male | Female |
| Under 5 Years | 0 (0.0%) | 0 (0.0%) |
| 5 to 17 Years | 13 (30.9%) | 0 (0.0%) |
| 18 to 34 Years | 17 (17.9%) | 0 (0.0%) |
| 35 to 64 Years | 47 (20.5%) | 0 (0.0%) |
| 65 to 74 Years | 0 (0.0%) | 2 (7.1%) |
| 75 Years and over | 11 (50.0%) | 34 (91.9%) |
Disability Class by Sex by Age in Watkins
Disability Class: Hearing Difficulty
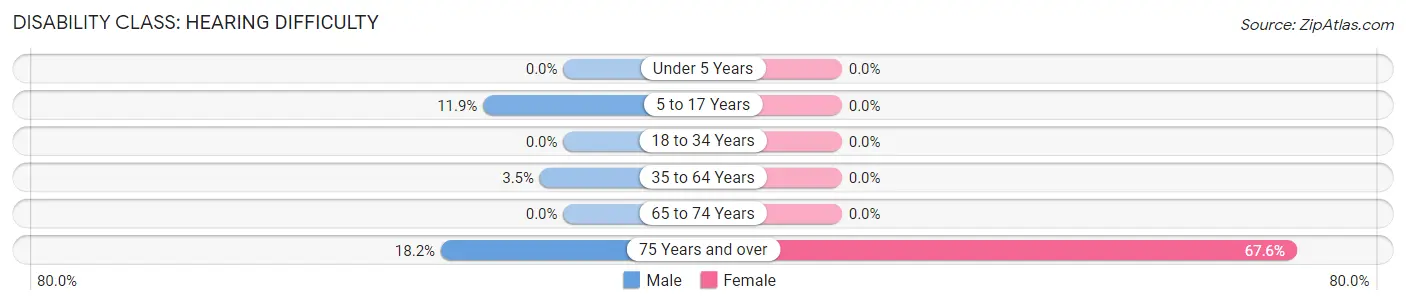
| Age Bracket | Male | Female |
| Under 5 Years | 0 (0.0%) | 0 (0.0%) |
| 5 to 17 Years | 5 (11.9%) | 0 (0.0%) |
| 18 to 34 Years | 0 (0.0%) | 0 (0.0%) |
| 35 to 64 Years | 8 (3.5%) | 0 (0.0%) |
| 65 to 74 Years | 0 (0.0%) | 0 (0.0%) |
| 75 Years and over | 4 (18.2%) | 25 (67.6%) |
Disability Class: Vision Difficulty
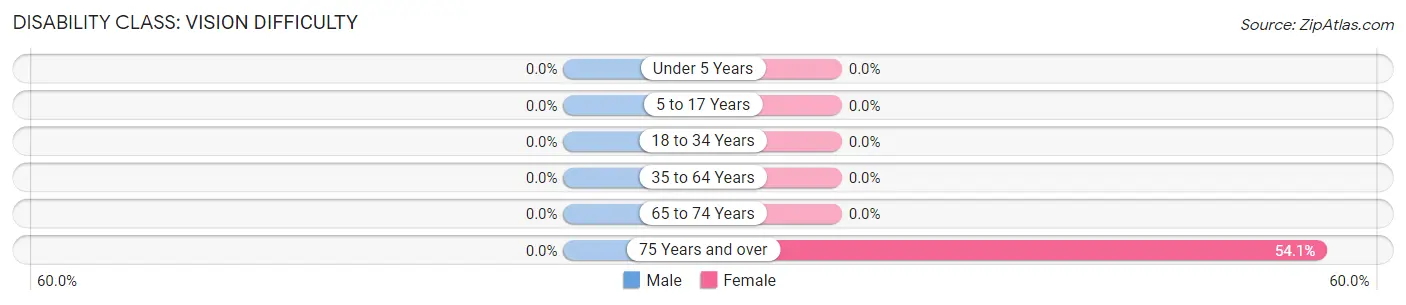
| Age Bracket | Male | Female |
| Under 5 Years | 0 (0.0%) | 0 (0.0%) |
| 5 to 17 Years | 0 (0.0%) | 0 (0.0%) |
| 18 to 34 Years | 0 (0.0%) | 0 (0.0%) |
| 35 to 64 Years | 0 (0.0%) | 0 (0.0%) |
| 65 to 74 Years | 0 (0.0%) | 0 (0.0%) |
| 75 Years and over | 0 (0.0%) | 20 (54.0%) |
Disability Class: Cognitive Difficulty
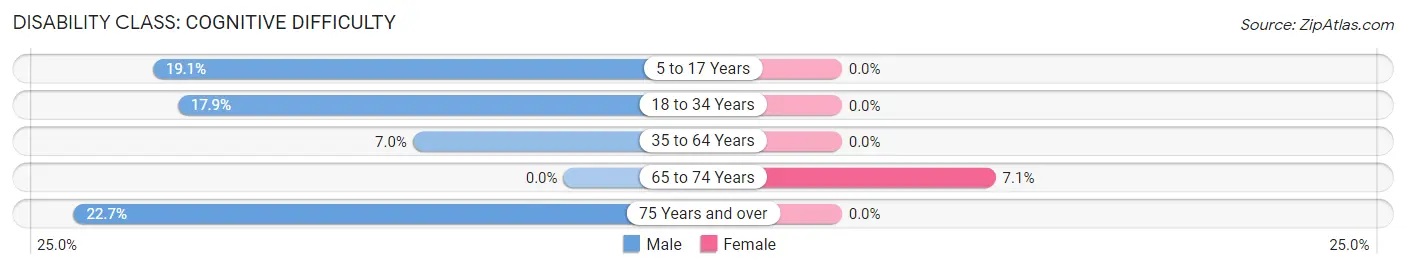
| Age Bracket | Male | Female |
| 5 to 17 Years | 8 (19.1%) | 0 (0.0%) |
| 18 to 34 Years | 17 (17.9%) | 0 (0.0%) |
| 35 to 64 Years | 16 (7.0%) | 0 (0.0%) |
| 65 to 74 Years | 0 (0.0%) | 2 (7.1%) |
| 75 Years and over | 5 (22.7%) | 0 (0.0%) |
Disability Class: Ambulatory Difficulty
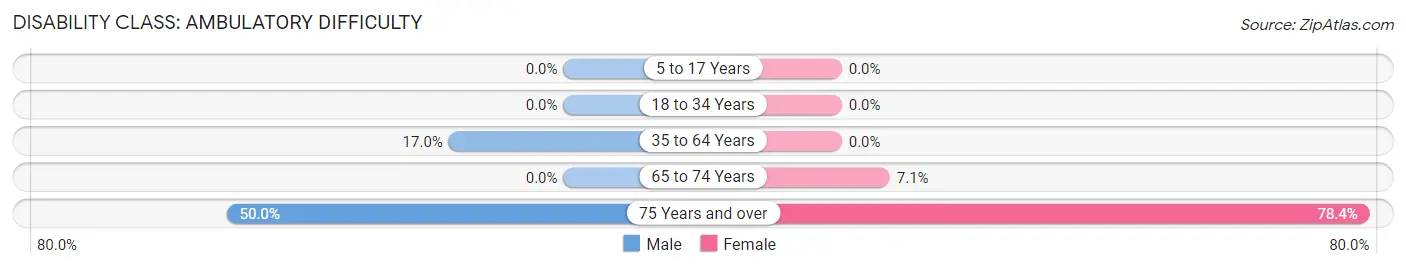
| Age Bracket | Male | Female |
| 5 to 17 Years | 0 (0.0%) | 0 (0.0%) |
| 18 to 34 Years | 0 (0.0%) | 0 (0.0%) |
| 35 to 64 Years | 39 (17.0%) | 0 (0.0%) |
| 65 to 74 Years | 0 (0.0%) | 2 (7.1%) |
| 75 Years and over | 11 (50.0%) | 29 (78.4%) |
Disability Class: Self-Care Difficulty
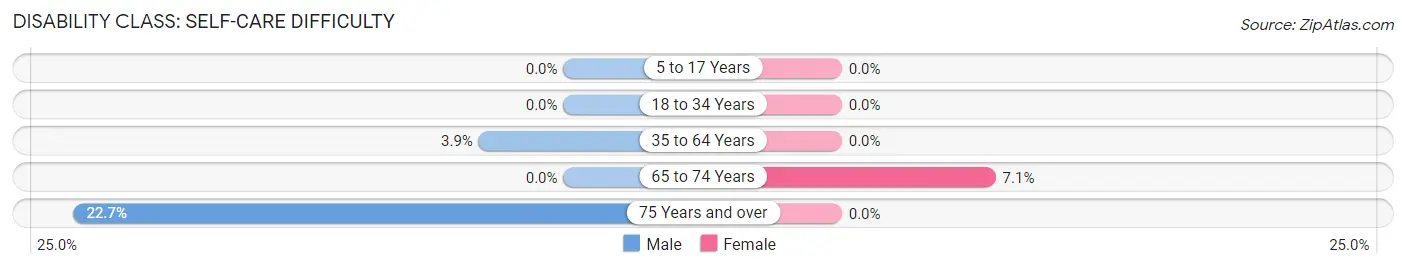
| Age Bracket | Male | Female |
| 5 to 17 Years | 0 (0.0%) | 0 (0.0%) |
| 18 to 34 Years | 0 (0.0%) | 0 (0.0%) |
| 35 to 64 Years | 9 (3.9%) | 0 (0.0%) |
| 65 to 74 Years | 0 (0.0%) | 2 (7.1%) |
| 75 Years and over | 5 (22.7%) | 0 (0.0%) |
Technology Access in Watkins
Computing Device Access in Watkins
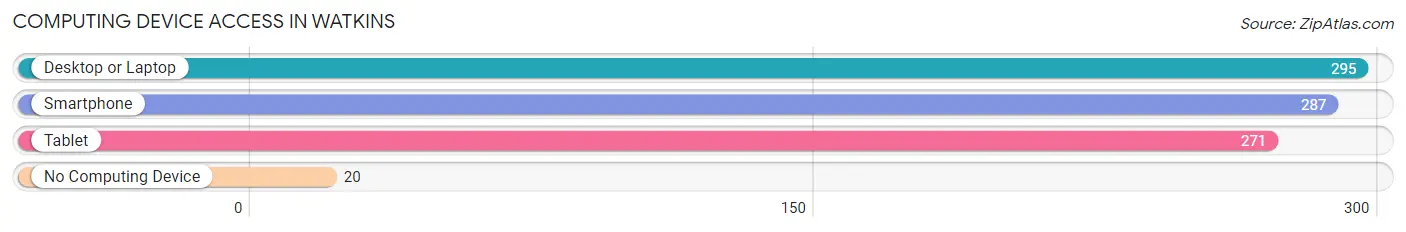
| Device Type | # Households | % Households |
| Desktop or Laptop | 295 | 87.8% |
| Smartphone | 287 | 85.4% |
| Tablet | 271 | 80.6% |
| No Computing Device | 20 | 5.9% |
| Total | 336 | 100.0% |
Internet Access in Watkins
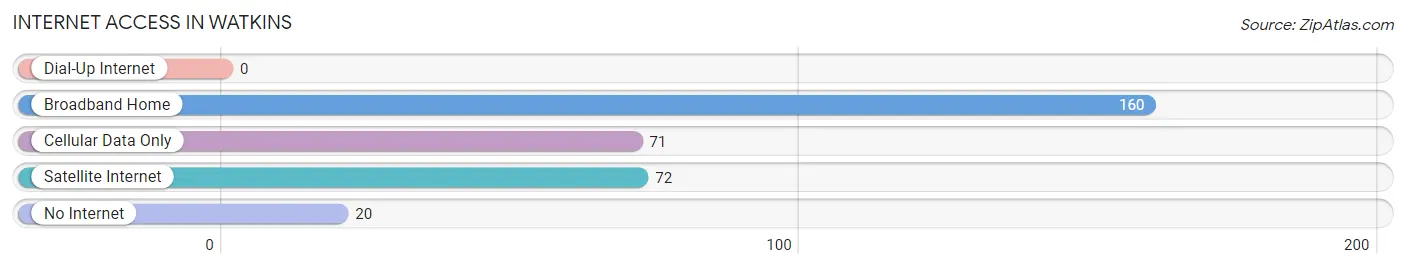
| Internet Type | # Households | % Households |
| Dial-Up Internet | 0 | 0.0% |
| Broadband Home | 160 | 47.6% |
| Cellular Data Only | 71 | 21.1% |
| Satellite Internet | 72 | 21.4% |
| No Internet | 20 | 5.9% |
| Total | 336 | 100.0% |
Watkins Summary
Watkins is a small town located in Adams County, Colorado, United States. It is situated approximately 20 miles northeast of Denver and is part of the Denver-Aurora-Lakewood Metropolitan Statistical Area. The town was founded in 1887 and was named after the Watkins family, who were early settlers in the area. As of the 2010 census, the population of Watkins was 1,845.
Geography
Watkins is located at 39°51'17" North, 104°41'17" West (39.854722, -104.688056). It is situated at an elevation of 5,093 feet (1,551 m) above sea level. The town covers an area of 1.3 square miles (3.4 km2), all of which is land.
The town is located in the South Platte River Valley, which is part of the Great Plains region of the United States. The South Platte River flows through the town, and there are several small lakes and ponds in the area. The town is surrounded by agricultural land, and there are several small farms in the area.
Climate
Watkins has a semi-arid climate, with hot summers and cold winters. The average annual temperature is 52.2 °F (11.2 °C), and the average annual precipitation is 16.2 inches (412 mm).
Demographics
As of the 2010 census, there were 1,845 people, 690 households, and 486 families residing in the town. The population density was 1,420.7 people per square mile (548.7/km2). There were 745 housing units at an average density of 572.3 per square mile (221.2/km2). The racial makeup of the town was 81.2% White, 0.7% African American, 0.7% Native American, 0.7% Asian, 0.1% Pacific Islander, 14.2% from other races, and 2.4% from two or more races. Hispanic or Latino of any race were 28.2% of the population.
Economy
The economy of Watkins is largely based on agriculture. The town is home to several small farms, which produce a variety of crops, including corn, wheat, and hay. The town is also home to several small businesses, including a grocery store, a hardware store, and a restaurant.
The town is served by the Burlington Northern Santa Fe Railway, which provides freight service to the area. The town is also served by the Denver International Airport, which is located approximately 25 miles (40 km) away.
Education
Watkins is served by the Adams County School District, which operates two elementary schools, one middle school, and one high school in the town. The town is also home to a branch of the Arapahoe Community College.
Conclusion
Watkins is a small town located in Adams County, Colorado, United States. It is situated approximately 20 miles northeast of Denver and is part of the Denver-Aurora-Lakewood Metropolitan Statistical Area. The town was founded in 1887 and was named after the Watkins family, who were early settlers in the area. As of the 2010 census, the population of Watkins was 1,845. The town has a semi-arid climate, with hot summers and cold winters. The economy of Watkins is largely based on agriculture, and the town is served by the Burlington Northern Santa Fe Railway and the Denver International Airport. The town is served by the Adams County School District, which operates two elementary schools, one middle school, and one high school in the town.
Common Questions
What is Per Capita Income in Watkins?
Per Capita income in Watkins is $57,212.
What is the Median Family Income in Watkins?
Median Family Income in Watkins is $153,250.
What is the Median Household income in Watkins?
Median Household Income in Watkins is $153,000.
What is Income or Wage Gap in Watkins?
Income or Wage Gap in Watkins is 13.4%.
Women in Watkins earn 86.6 cents for every dollar earned by a man.
What is Inequality or Gini Index in Watkins?
Inequality or Gini Index in Watkins is 0.30.
What is the Total Population of Watkins?
Total Population of Watkins is 991.
What is the Total Male Population of Watkins?
Total Male Population of Watkins is 488.
What is the Total Female Population of Watkins?
Total Female Population of Watkins is 503.
What is the Ratio of Males per 100 Females in Watkins?
There are 97.02 Males per 100 Females in Watkins.
What is the Ratio of Females per 100 Males in Watkins?
There are 103.07 Females per 100 Males in Watkins.
What is the Median Population Age in Watkins?
Median Population Age in Watkins is 46.7 Years.
What is the Average Family Size in Watkins
Average Family Size in Watkins is 3.2 People.
What is the Average Household Size in Watkins
Average Household Size in Watkins is 3.0 People.
How Large is the Labor Force in Watkins?
There are 497 People in the Labor Forcein in Watkins.
What is the Percentage of People in the Labor Force in Watkins?
59.2% of People are in the Labor Force in Watkins.