Firestone, CO Map & Demographics
Firestone Map
Firestone Overview
$42,936
PER CAPITA INCOME
$113,273
AVG FAMILY INCOME
$106,960
AVG HOUSEHOLD INCOME
43.7%
WAGE / INCOME GAP [ % ]
56.3¢/ $1
WAGE / INCOME GAP [ $ ]
$7,855
FAMILY INCOME DEFICIT
0.32
INEQUALITY / GINI INDEX
16,704
TOTAL POPULATION
8,742
MALE POPULATION
7,962
FEMALE POPULATION
109.80
MALES / 100 FEMALES
91.08
FEMALES / 100 MALES
35.6
MEDIAN AGE
3.4
AVG FAMILY SIZE
3.0
AVG HOUSEHOLD SIZE
9,716
LABOR FORCE [ PEOPLE ]
74.2%
PERCENT IN LABOR FORCE
3.8%
UNEMPLOYMENT RATE
Firestone Zip Codes
Income in Firestone
Income Overview in Firestone
Per Capita Income in Firestone is $42,936, while median incomes of families and households are $113,273 and $106,960 respectively.
| Characteristic | Number | Measure |
| Per Capita Income | 16,704 | $42,936 |
| Median Family Income | 4,030 | $113,273 |
| Mean Family Income | 4,030 | $128,922 |
| Median Household Income | 5,576 | $106,960 |
| Mean Household Income | 5,576 | $124,046 |
| Income Deficit | 4,030 | $7,855 |
| Wage / Income Gap (%) | 16,704 | 43.70% |
| Wage / Income Gap ($) | 16,704 | 56.30¢ per $1 |
| Gini / Inequality Index | 16,704 | 0.32 |
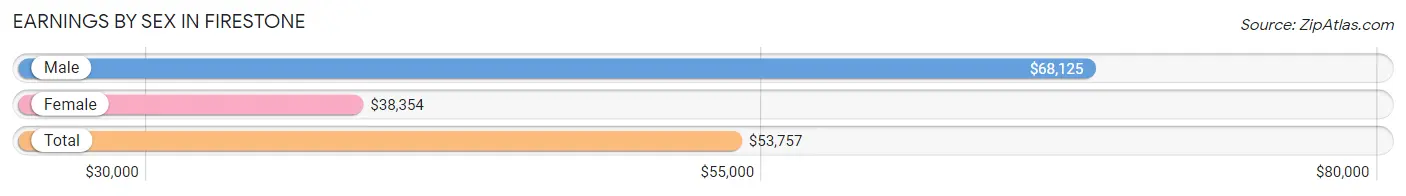
Earnings by Sex in Firestone
Average Earnings in Firestone are $53,757, $68,125 for men and $38,354 for women, a difference of 43.7%.
| Sex | Number | Average Earnings |
| Male | 5,791 (58.8%) | $68,125 |
| Female | 4,064 (41.2%) | $38,354 |
| Total | 9,855 (100.0%) | $53,757 |
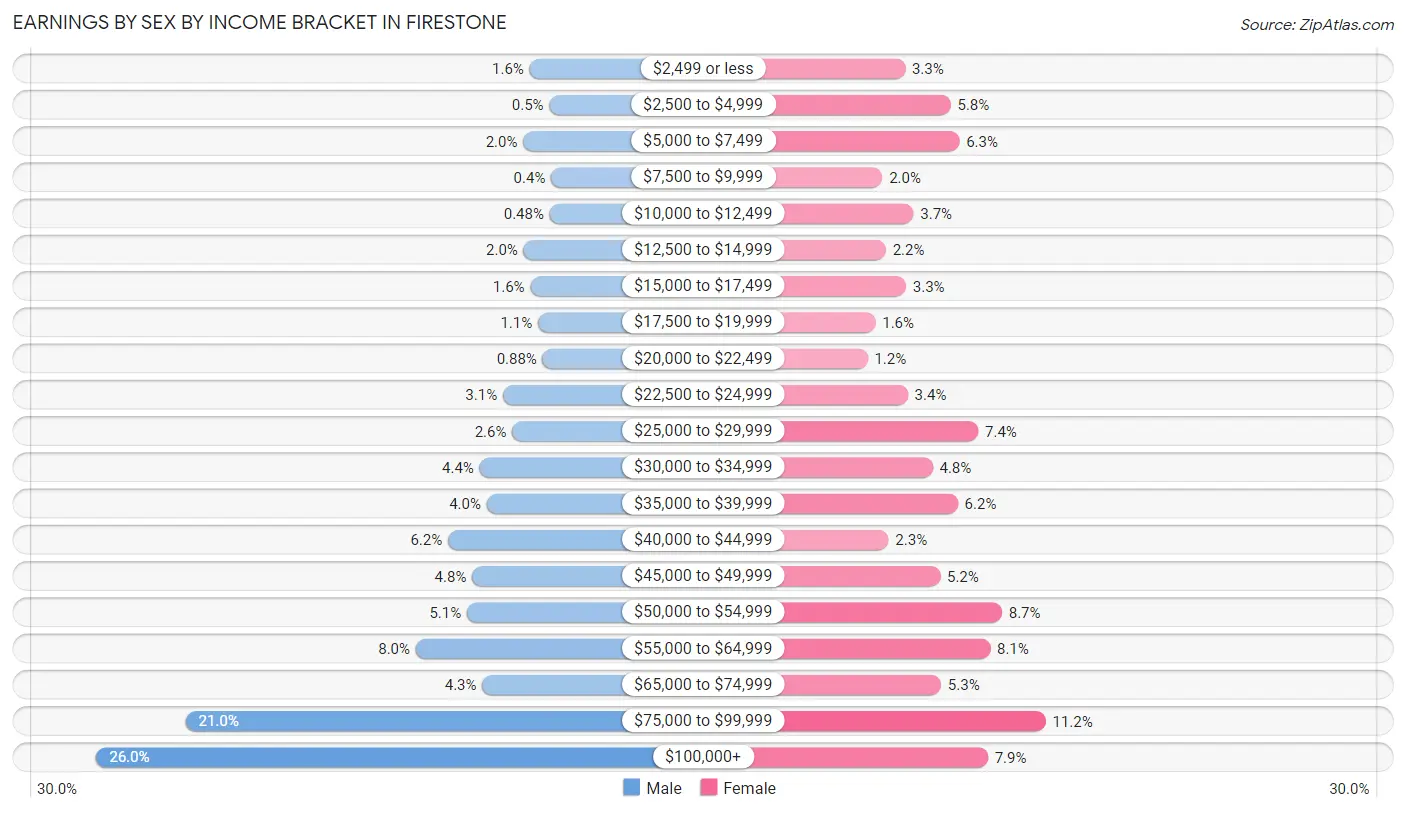
Earnings by Sex by Income Bracket in Firestone
The most common earnings brackets in Firestone are $100,000+ for men (1,504 | 26.0%) and $75,000 to $99,999 for women (454 | 11.2%).
| Income | Male | Female |
| $2,499 or less | 93 (1.6%) | 133 (3.3%) |
| $2,500 to $4,999 | 29 (0.5%) | 237 (5.8%) |
| $5,000 to $7,499 | 114 (2.0%) | 257 (6.3%) |
| $7,500 to $9,999 | 23 (0.4%) | 81 (2.0%) |
| $10,000 to $12,499 | 28 (0.5%) | 152 (3.7%) |
| $12,500 to $14,999 | 113 (1.9%) | 89 (2.2%) |
| $15,000 to $17,499 | 91 (1.6%) | 135 (3.3%) |
| $17,500 to $19,999 | 66 (1.1%) | 65 (1.6%) |
| $20,000 to $22,499 | 51 (0.9%) | 47 (1.2%) |
| $22,500 to $24,999 | 180 (3.1%) | 139 (3.4%) |
| $25,000 to $29,999 | 150 (2.6%) | 300 (7.4%) |
| $30,000 to $34,999 | 256 (4.4%) | 196 (4.8%) |
| $35,000 to $39,999 | 233 (4.0%) | 253 (6.2%) |
| $40,000 to $44,999 | 359 (6.2%) | 95 (2.3%) |
| $45,000 to $49,999 | 280 (4.8%) | 213 (5.2%) |
| $50,000 to $54,999 | 297 (5.1%) | 354 (8.7%) |
| $55,000 to $64,999 | 464 (8.0%) | 327 (8.1%) |
| $65,000 to $74,999 | 247 (4.3%) | 215 (5.3%) |
| $75,000 to $99,999 | 1,213 (20.9%) | 454 (11.2%) |
| $100,000+ | 1,504 (26.0%) | 322 (7.9%) |
| Total | 5,791 (100.0%) | 4,064 (100.0%) |
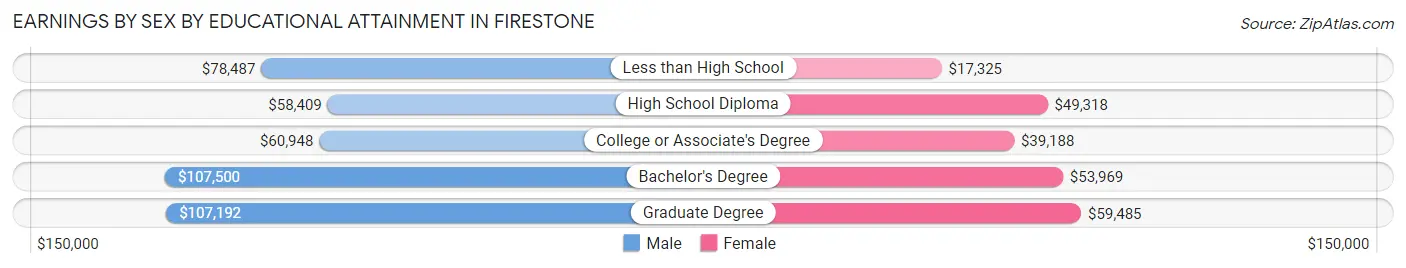
Earnings by Sex by Educational Attainment in Firestone
Average earnings in Firestone are $76,644 for men and $49,679 for women, a difference of 35.2%. Men with an educational attainment of bachelor's degree enjoy the highest average annual earnings of $107,500, while those with high school diploma education earn the least with $58,409. Women with an educational attainment of graduate degree earn the most with the average annual earnings of $59,485, while those with less than high school education have the smallest earnings of $17,325.
| Educational Attainment | Male Income | Female Income |
| Less than High School | $78,487 | $17,325 |
| High School Diploma | $58,409 | $49,318 |
| College or Associate's Degree | $60,948 | $39,188 |
| Bachelor's Degree | $107,500 | $53,969 |
| Graduate Degree | $107,192 | $59,485 |
| Total | $76,644 | $49,679 |
Family Income in Firestone
Family Income Brackets in Firestone
According to the Firestone family income data, there are 1,153 families falling into the $100,000 to $149,999 income range, which is the most common income bracket and makes up 28.6% of all families.
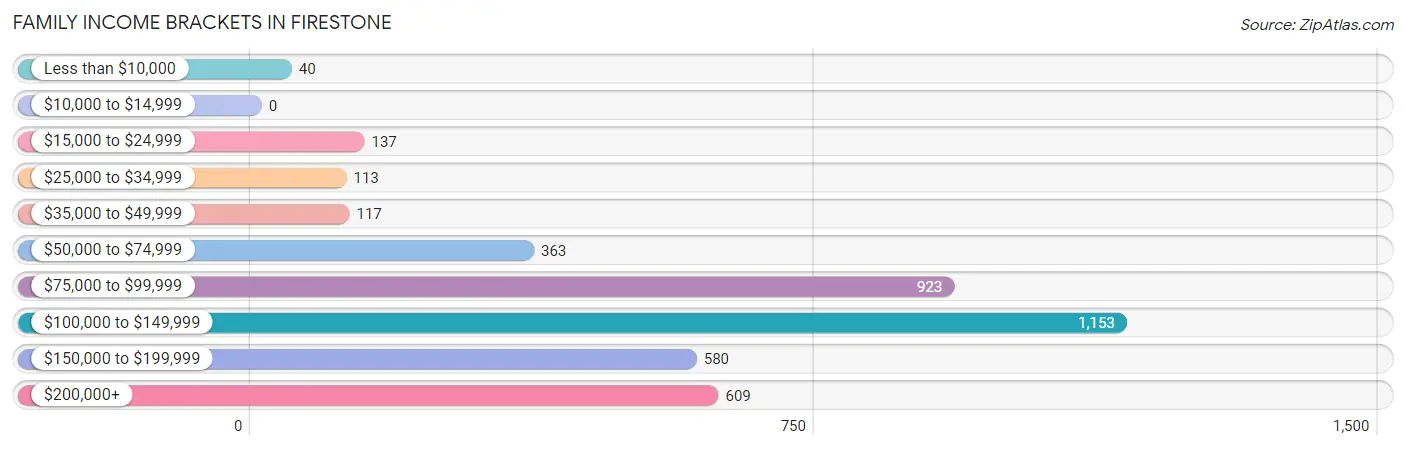
| Income Bracket | # Families | % Families |
| Less than $10,000 | 40 | 1.0% |
| $10,000 to $14,999 | 0 | 0.0% |
| $15,000 to $24,999 | 137 | 3.4% |
| $25,000 to $34,999 | 113 | 2.8% |
| $35,000 to $49,999 | 117 | 2.9% |
| $50,000 to $74,999 | 363 | 9.0% |
| $75,000 to $99,999 | 923 | 22.9% |
| $100,000 to $149,999 | 1,153 | 28.6% |
| $150,000 to $199,999 | 580 | 14.4% |
| $200,000+ | 609 | 15.1% |
Family Income by Famaliy Size in Firestone
7+ person families (111 | 2.8%) account for the highest median family income in Firestone with $185,139 per family, while 2-person families (1,557 | 38.6%) have the highest median income of $48,378 per family member.
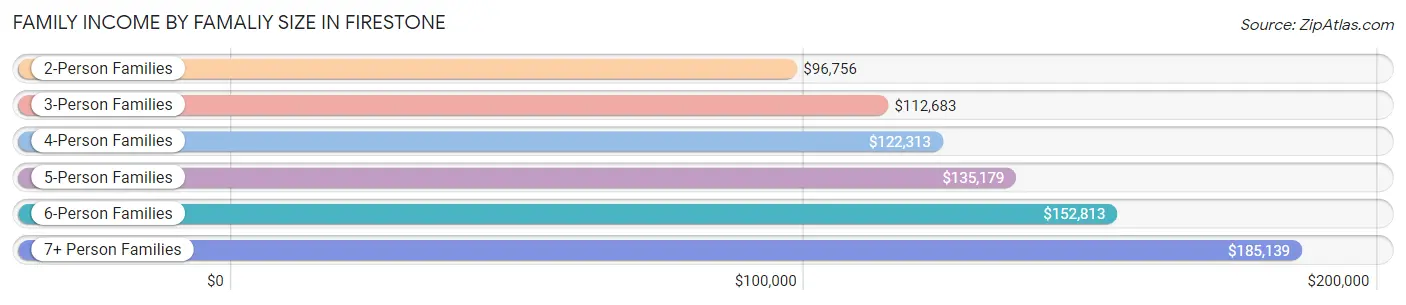
| Income Bracket | # Families | Median Income |
| 2-Person Families | 1,557 (38.6%) | $96,756 |
| 3-Person Families | 892 (22.1%) | $112,683 |
| 4-Person Families | 913 (22.7%) | $122,313 |
| 5-Person Families | 436 (10.8%) | $135,179 |
| 6-Person Families | 121 (3.0%) | $152,813 |
| 7+ Person Families | 111 (2.8%) | $185,139 |
| Total | 4,030 (100.0%) | $113,273 |
Family Income by Number of Earners in Firestone
The median family income in Firestone is $113,273, with families comprising 3+ earners (698) having the highest median family income of $144,271, while families with no earners (287) have the lowest median family income of $61,458, accounting for 17.3% and 7.1% of families, respectively.
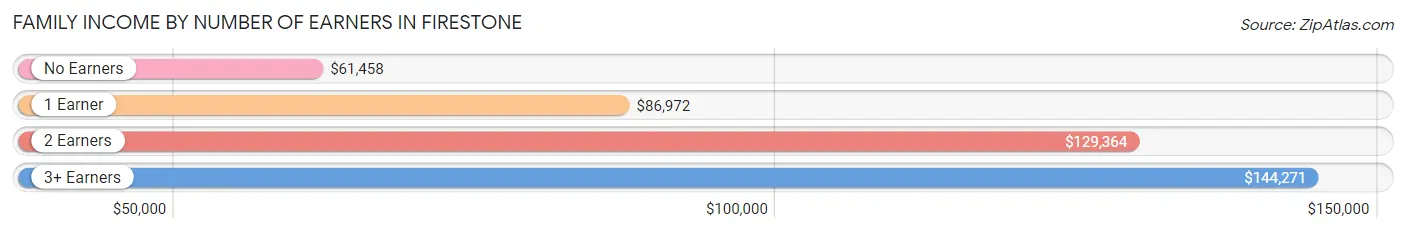
| Number of Earners | # Families | Median Income |
| No Earners | 287 (7.1%) | $61,458 |
| 1 Earner | 1,147 (28.5%) | $86,972 |
| 2 Earners | 1,898 (47.1%) | $129,364 |
| 3+ Earners | 698 (17.3%) | $144,271 |
| Total | 4,030 (100.0%) | $113,273 |
Household Income in Firestone
Household Income Brackets in Firestone
With 1,455 households falling in the category, the $100,000 to $149,999 income range is the most frequent in Firestone, accounting for 26.1% of all households. In contrast, only 17 households (0.3%) fall into the $10,000 to $14,999 income bracket, making it the least populous group.
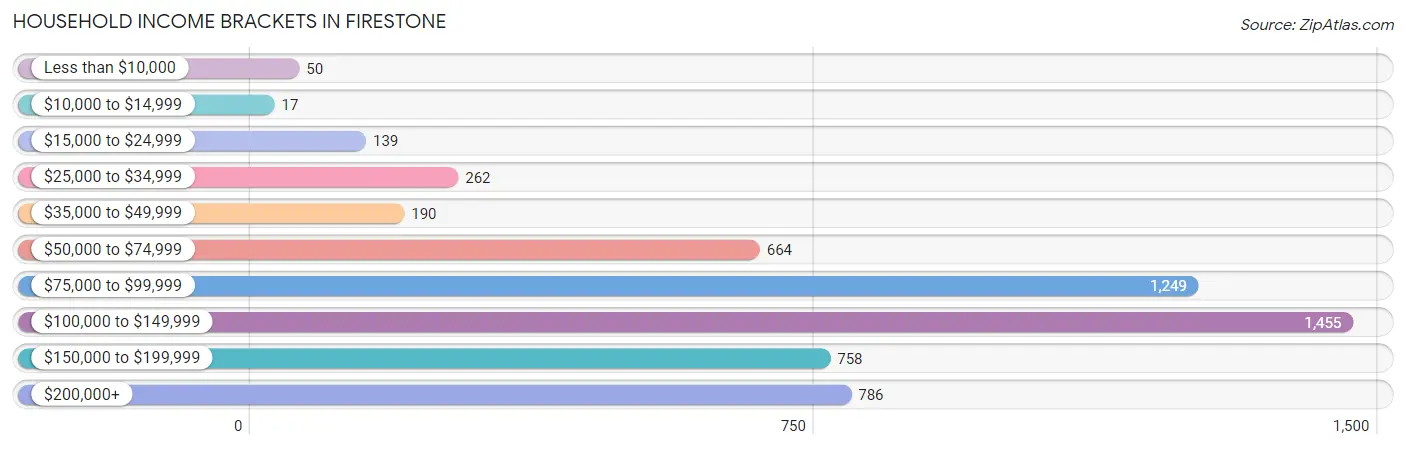
| Income Bracket | # Households | % Households |
| Less than $10,000 | 50 | 0.9% |
| $10,000 to $14,999 | 17 | 0.3% |
| $15,000 to $24,999 | 139 | 2.5% |
| $25,000 to $34,999 | 262 | 4.7% |
| $35,000 to $49,999 | 190 | 3.4% |
| $50,000 to $74,999 | 664 | 11.9% |
| $75,000 to $99,999 | 1,249 | 22.4% |
| $100,000 to $149,999 | 1,455 | 26.1% |
| $150,000 to $199,999 | 758 | 13.6% |
| $200,000+ | 786 | 14.1% |
Household Income by Householder Age in Firestone
The median household income in Firestone is $106,960, with the highest median household income of $117,463 found in the 45 to 64 years age bracket for the primary householder. A total of 2,267 households (40.7%) fall into this category. Meanwhile, the 65+ years age bracket for the primary householder has the lowest median household income of $84,551, with 804 households (14.4%) in this group.
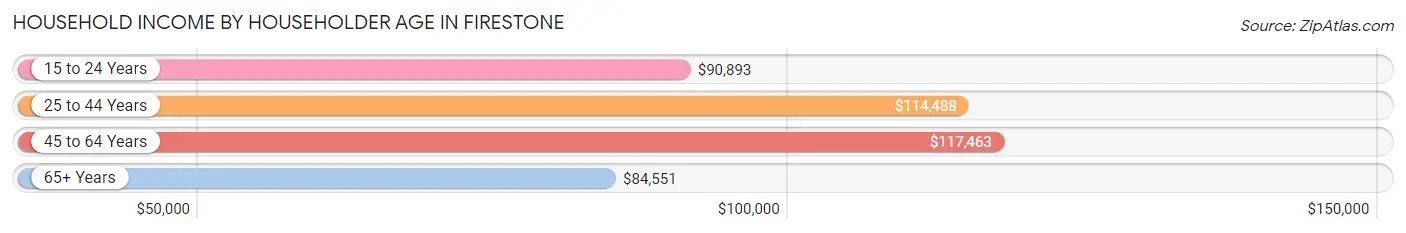
| Income Bracket | # Households | Median Income |
| 15 to 24 Years | 99 (1.8%) | $90,893 |
| 25 to 44 Years | 2,406 (43.1%) | $114,488 |
| 45 to 64 Years | 2,267 (40.7%) | $117,463 |
| 65+ Years | 804 (14.4%) | $84,551 |
| Total | 5,576 (100.0%) | $106,960 |
Poverty in Firestone
Income Below Poverty by Sex and Age in Firestone
With 2.2% poverty level for males and 6.0% for females among the residents of Firestone, 16 and 17 year old males and 12 to 14 year old females are the most vulnerable to poverty, with 32 males (19.6%) and 41 females (13.1%) in their respective age groups living below the poverty level.
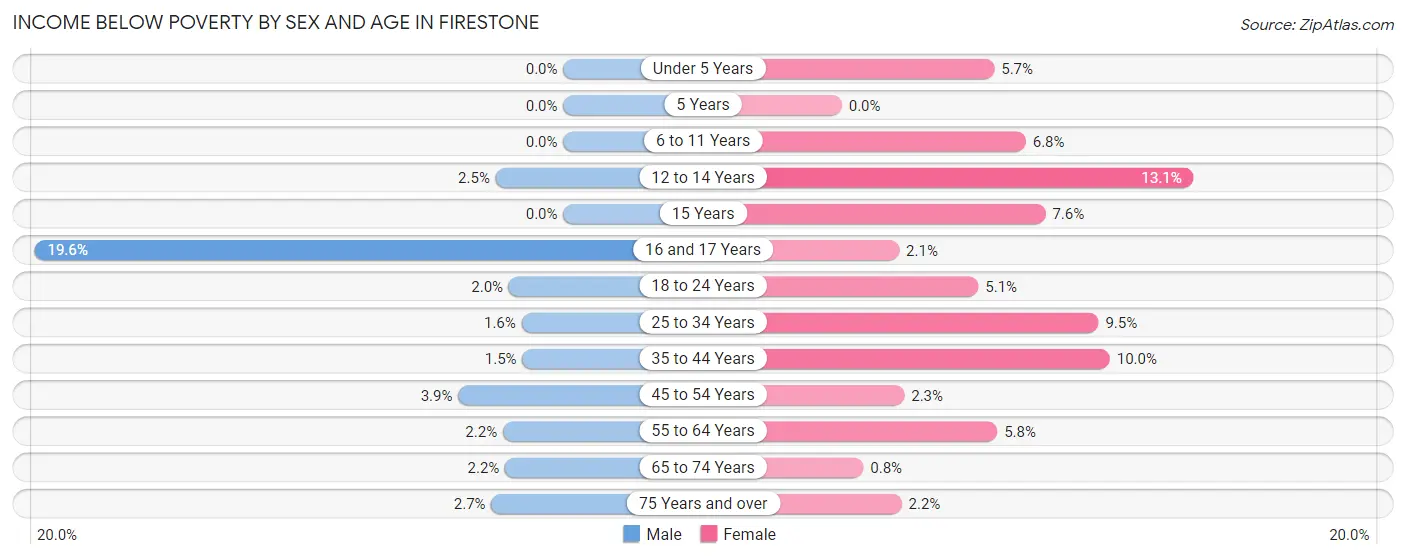
| Age Bracket | Male | Female |
| Under 5 Years | 0 (0.0%) | 21 (5.7%) |
| 5 Years | 0 (0.0%) | 0 (0.0%) |
| 6 to 11 Years | 0 (0.0%) | 45 (6.8%) |
| 12 to 14 Years | 13 (2.5%) | 41 (13.1%) |
| 15 Years | 0 (0.0%) | 9 (7.6%) |
| 16 and 17 Years | 32 (19.6%) | 7 (2.1%) |
| 18 to 24 Years | 11 (2.0%) | 32 (5.1%) |
| 25 to 34 Years | 25 (1.5%) | 125 (9.5%) |
| 35 to 44 Years | 21 (1.5%) | 114 (10.0%) |
| 45 to 54 Years | 46 (3.9%) | 22 (2.3%) |
| 55 to 64 Years | 25 (2.2%) | 49 (5.8%) |
| 65 to 74 Years | 12 (2.2%) | 7 (0.8%) |
| 75 Years and over | 5 (2.7%) | 6 (2.2%) |
| Total | 190 (2.2%) | 478 (6.0%) |
Income Above Poverty by Sex and Age in Firestone
According to the poverty statistics in Firestone, males aged under 5 years and females aged 5 years are the age groups that are most secure financially, with 100.0% of males and 100.0% of females in these age groups living above the poverty line.
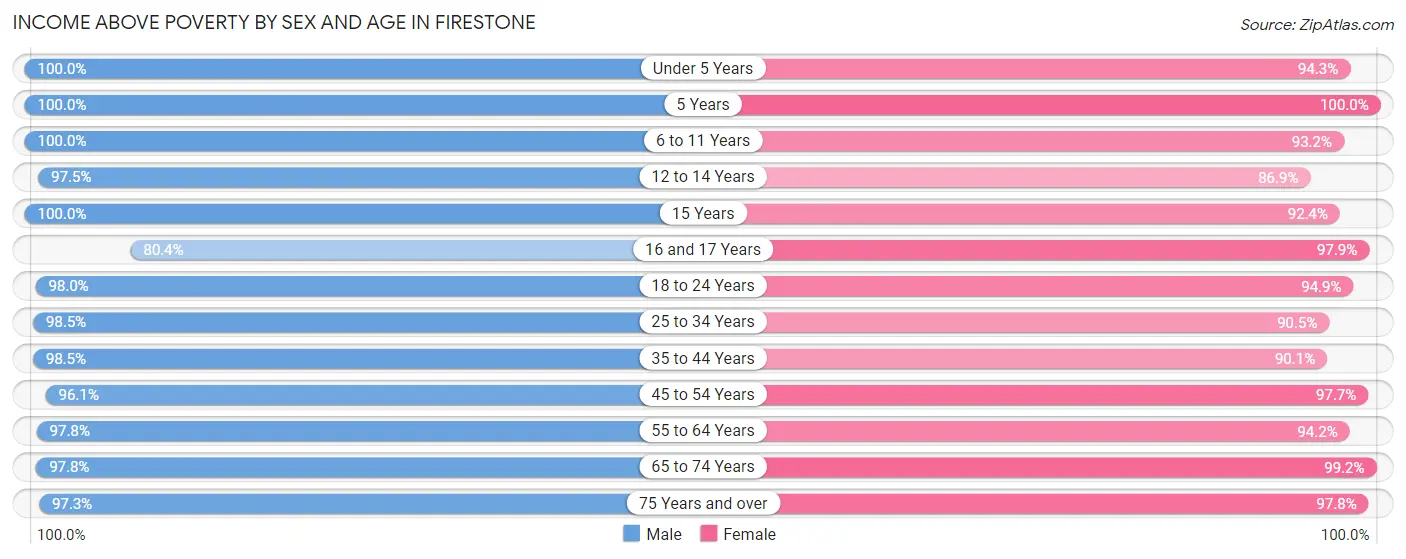
| Age Bracket | Male | Female |
| Under 5 Years | 420 (100.0%) | 350 (94.3%) |
| 5 Years | 130 (100.0%) | 74 (100.0%) |
| 6 to 11 Years | 686 (100.0%) | 614 (93.2%) |
| 12 to 14 Years | 504 (97.5%) | 273 (86.9%) |
| 15 Years | 161 (100.0%) | 110 (92.4%) |
| 16 and 17 Years | 131 (80.4%) | 322 (97.9%) |
| 18 to 24 Years | 534 (98.0%) | 599 (94.9%) |
| 25 to 34 Years | 1,583 (98.5%) | 1,187 (90.5%) |
| 35 to 44 Years | 1,358 (98.5%) | 1,032 (90.0%) |
| 45 to 54 Years | 1,134 (96.1%) | 926 (97.7%) |
| 55 to 64 Years | 1,092 (97.8%) | 800 (94.2%) |
| 65 to 74 Years | 543 (97.8%) | 868 (99.2%) |
| 75 Years and over | 182 (97.3%) | 264 (97.8%) |
| Total | 8,458 (97.8%) | 7,419 (94.0%) |
Income Below Poverty Among Married-Couple Families in Firestone
The poverty statistics for married-couple families in Firestone show that 2.2% or 72 of the total 3,225 families live below the poverty line. Families with 1 or 2 children have the highest poverty rate of 4.7%, comprising of 57 families. On the other hand, families with 3 or 4 children have the lowest poverty rate of 0.0%, which includes 0 families.
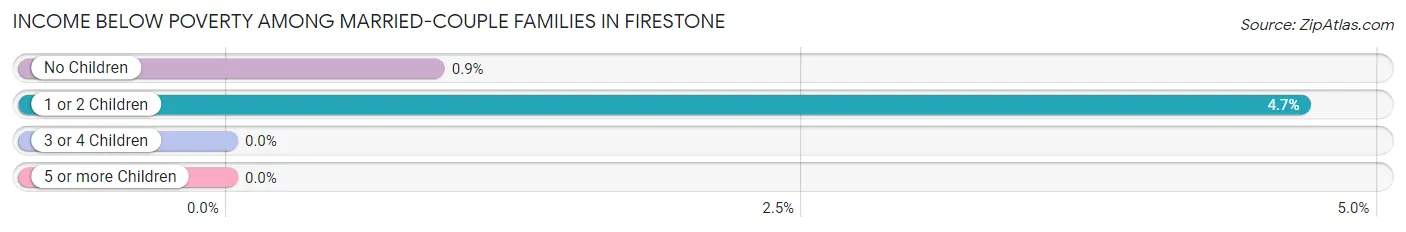
| Children | Above Poverty | Below Poverty |
| No Children | 1,656 (99.1%) | 15 (0.9%) |
| 1 or 2 Children | 1,164 (95.3%) | 57 (4.7%) |
| 3 or 4 Children | 322 (100.0%) | 0 (0.0%) |
| 5 or more Children | 11 (100.0%) | 0 (0.0%) |
| Total | 3,153 (97.8%) | 72 (2.2%) |
Income Below Poverty Among Single-Parent Households in Firestone
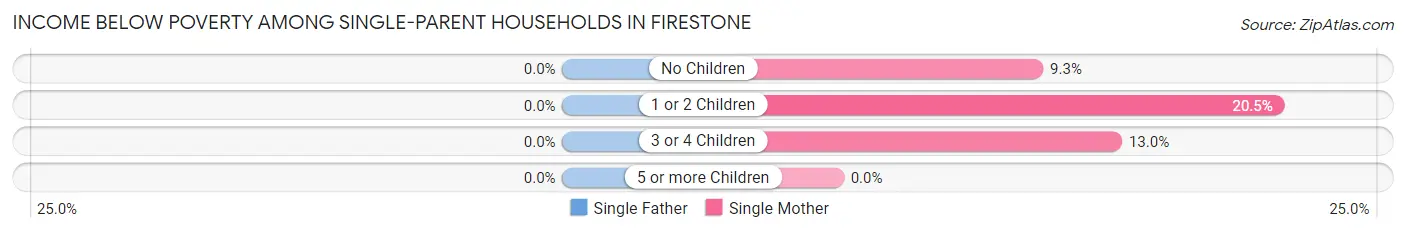
| Children | Single Father | Single Mother |
| No Children | 0 (0.0%) | 13 (9.3%) |
| 1 or 2 Children | 0 (0.0%) | 39 (20.5%) |
| 3 or 4 Children | 0 (0.0%) | 7 (13.0%) |
| 5 or more Children | 0 (0.0%) | 0 (0.0%) |
| Total | 0 (0.0%) | 59 (15.4%) |
Income Below Poverty Among Married-Couple vs Single-Parent Households in Firestone
The poverty data for Firestone shows that 72 of the married-couple family households (2.2%) and 59 of the single-parent households (7.3%) are living below the poverty level. Within the married-couple family households, those with 1 or 2 children have the highest poverty rate, with 57 households (4.7%) falling below the poverty line. Among the single-parent households, those with 3 or 4 children have the highest poverty rate, with 7 household (10.0%) living below poverty.
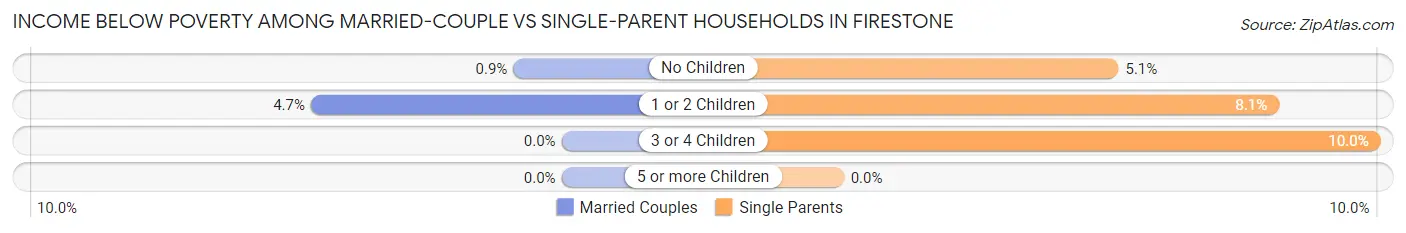
| Children | Married-Couple Families | Single-Parent Households |
| No Children | 15 (0.9%) | 13 (5.1%) |
| 1 or 2 Children | 57 (4.7%) | 39 (8.1%) |
| 3 or 4 Children | 0 (0.0%) | 7 (10.0%) |
| 5 or more Children | 0 (0.0%) | 0 (0.0%) |
| Total | 72 (2.2%) | 59 (7.3%) |
Race in Firestone
The most populous races in Firestone are White / Caucasian (13,007 | 77.9%), Hispanic or Latino (4,609 | 27.6%), and Two or more Races (1,681 | 10.1%).
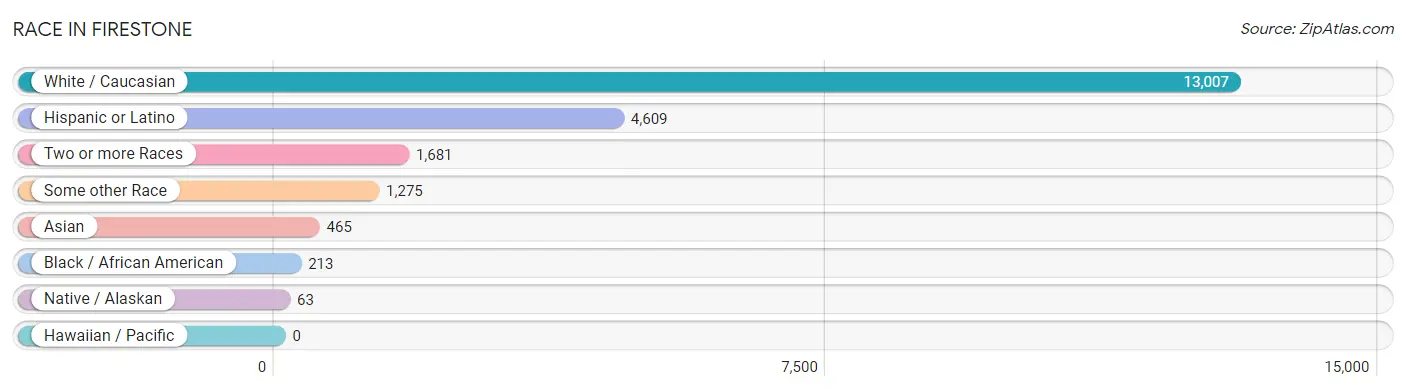
| Race | # Population | % Population |
| Asian | 465 | 2.8% |
| Black / African American | 213 | 1.3% |
| Hawaiian / Pacific | 0 | 0.0% |
| Hispanic or Latino | 4,609 | 27.6% |
| Native / Alaskan | 63 | 0.4% |
| White / Caucasian | 13,007 | 77.9% |
| Two or more Races | 1,681 | 10.1% |
| Some other Race | 1,275 | 7.6% |
| Total | 16,704 | 100.0% |
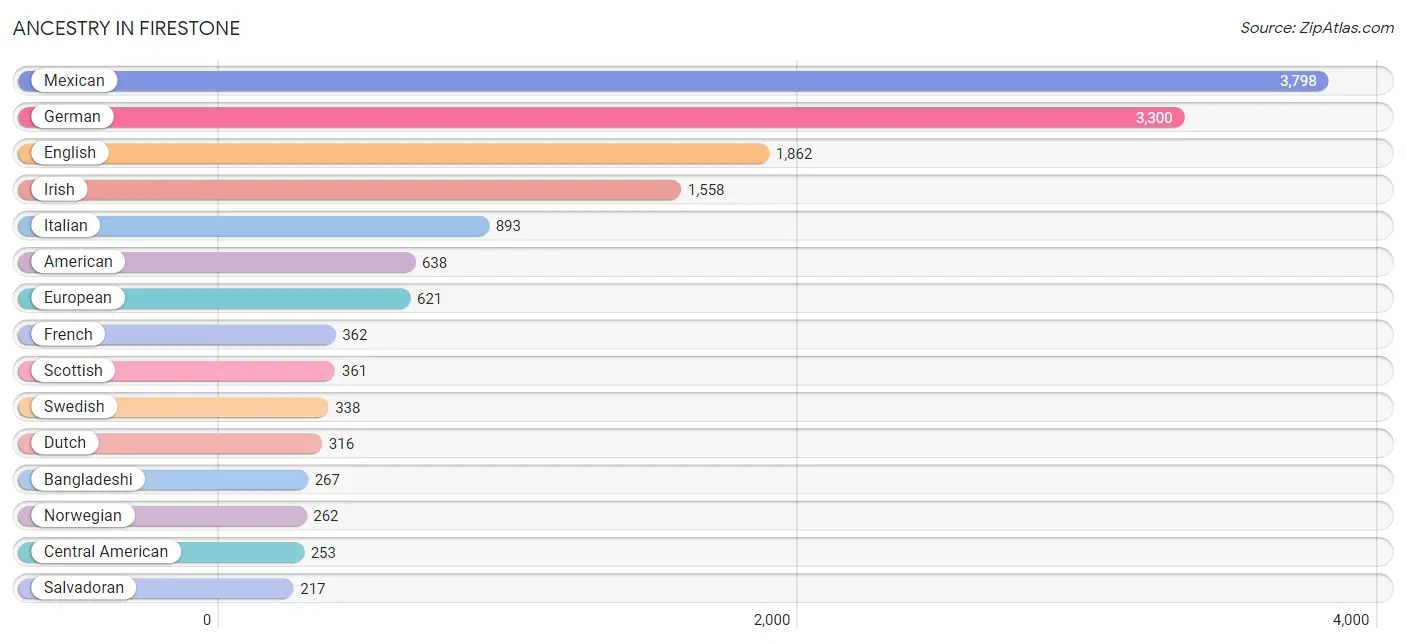
Ancestry in Firestone
The most populous ancestries reported in Firestone are Mexican (3,798 | 22.7%), German (3,300 | 19.8%), English (1,862 | 11.2%), Irish (1,558 | 9.3%), and Italian (893 | 5.3%), together accounting for 68.3% of all Firestone residents.
| Ancestry | # Population | % Population |
| American | 638 | 3.8% |
| Apache | 10 | 0.1% |
| Argentinean | 39 | 0.2% |
| Austrian | 24 | 0.1% |
| Bangladeshi | 267 | 1.6% |
| Belgian | 13 | 0.1% |
| Bhutanese | 26 | 0.2% |
| Blackfeet | 10 | 0.1% |
| British | 43 | 0.3% |
| Burmese | 88 | 0.5% |
| Canadian | 10 | 0.1% |
| Central American | 253 | 1.5% |
| Cherokee | 123 | 0.7% |
| Colombian | 64 | 0.4% |
| Croatian | 62 | 0.4% |
| Czech | 37 | 0.2% |
| Danish | 37 | 0.2% |
| Dutch | 316 | 1.9% |
| Eastern European | 36 | 0.2% |
| Ecuadorian | 9 | 0.1% |
| English | 1,862 | 11.2% |
| European | 621 | 3.7% |
| Filipino | 17 | 0.1% |
| Finnish | 17 | 0.1% |
| French | 362 | 2.2% |
| French Canadian | 82 | 0.5% |
| German | 3,300 | 19.8% |
| Greek | 20 | 0.1% |
| Guatemalan | 36 | 0.2% |
| Hungarian | 73 | 0.4% |
| Indian (Asian) | 60 | 0.4% |
| Irish | 1,558 | 9.3% |
| Italian | 893 | 5.3% |
| Japanese | 87 | 0.5% |
| Korean | 38 | 0.2% |
| Laotian | 7 | 0.0% |
| Lithuanian | 17 | 0.1% |
| Malaysian | 10 | 0.1% |
| Mexican | 3,798 | 22.7% |
| Native Hawaiian | 8 | 0.1% |
| Navajo | 10 | 0.1% |
| Norwegian | 262 | 1.6% |
| Pennsylvania German | 10 | 0.1% |
| Peruvian | 17 | 0.1% |
| Polish | 197 | 1.2% |
| Pueblo | 22 | 0.1% |
| Puerto Rican | 31 | 0.2% |
| Russian | 123 | 0.7% |
| Salvadoran | 217 | 1.3% |
| Scandinavian | 113 | 0.7% |
| Scotch-Irish | 200 | 1.2% |
| Scottish | 361 | 2.2% |
| Sioux | 16 | 0.1% |
| Slavic | 4 | 0.0% |
| Slovak | 16 | 0.1% |
| Slovene | 22 | 0.1% |
| South American | 129 | 0.8% |
| Spaniard | 146 | 0.9% |
| Spanish | 168 | 1.0% |
| Sri Lankan | 41 | 0.3% |
| Subsaharan African | 53 | 0.3% |
| Swedish | 338 | 2.0% |
| Swiss | 84 | 0.5% |
| Ukrainian | 17 | 0.1% |
| Welsh | 159 | 0.9% |
| Yugoslavian | 23 | 0.1% | View All 66 Rows |
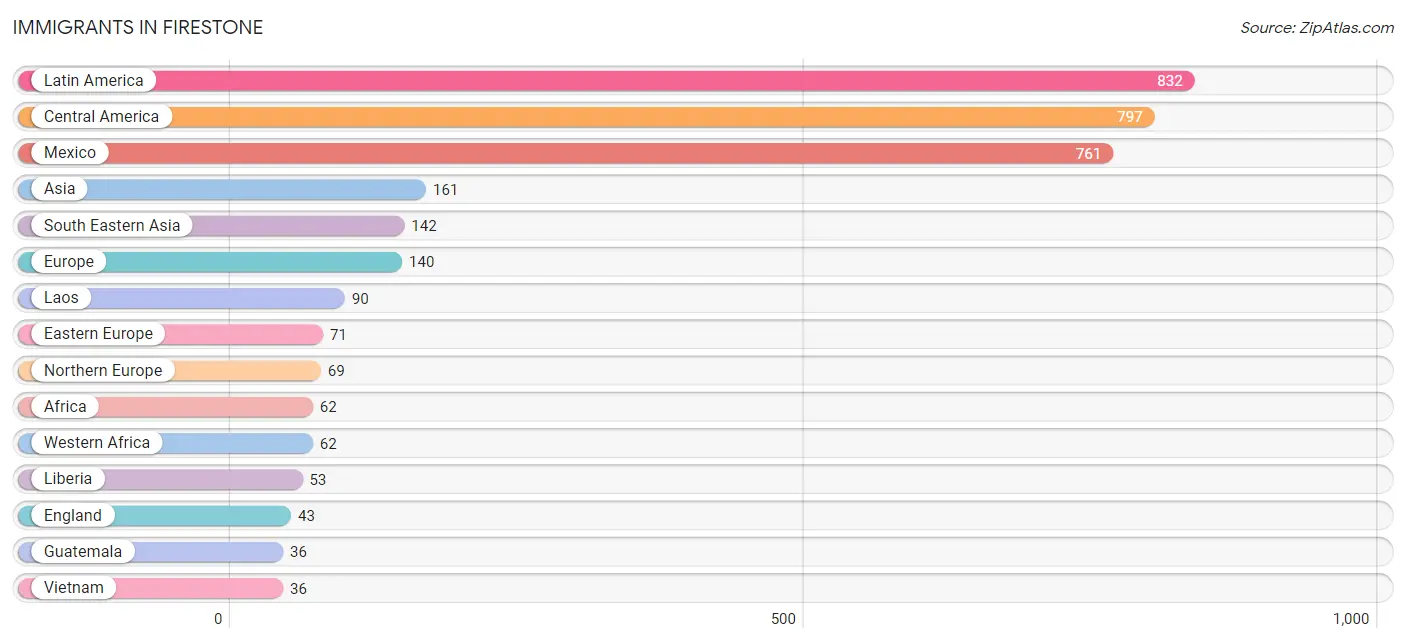
Immigrants in Firestone
The most numerous immigrant groups reported in Firestone came from Latin America (832 | 5.0%), Central America (797 | 4.8%), Mexico (761 | 4.6%), Asia (161 | 1.0%), and South Eastern Asia (142 | 0.9%), together accounting for 16.1% of all Firestone residents.
| Immigration Origin | # Population | % Population |
| Africa | 62 | 0.4% |
| Argentina | 26 | 0.2% |
| Asia | 161 | 1.0% |
| Bosnia and Herzegovina | 23 | 0.1% |
| Cambodia | 10 | 0.1% |
| Canada | 30 | 0.2% |
| Central America | 797 | 4.8% |
| Czechoslovakia | 11 | 0.1% |
| Eastern Asia | 19 | 0.1% |
| Eastern Europe | 71 | 0.4% |
| Ecuador | 9 | 0.1% |
| England | 43 | 0.3% |
| Europe | 140 | 0.8% |
| Ghana | 9 | 0.1% |
| Guatemala | 36 | 0.2% |
| Hungary | 31 | 0.2% |
| Korea | 19 | 0.1% |
| Laos | 90 | 0.5% |
| Latin America | 832 | 5.0% |
| Liberia | 53 | 0.3% |
| Mexico | 761 | 4.6% |
| Northern Europe | 69 | 0.4% |
| Oceania | 17 | 0.1% |
| Philippines | 6 | 0.0% |
| Russia | 6 | 0.0% |
| South America | 35 | 0.2% |
| South Eastern Asia | 142 | 0.9% |
| Sweden | 26 | 0.2% |
| Vietnam | 36 | 0.2% |
| Western Africa | 62 | 0.4% | View All 30 Rows |
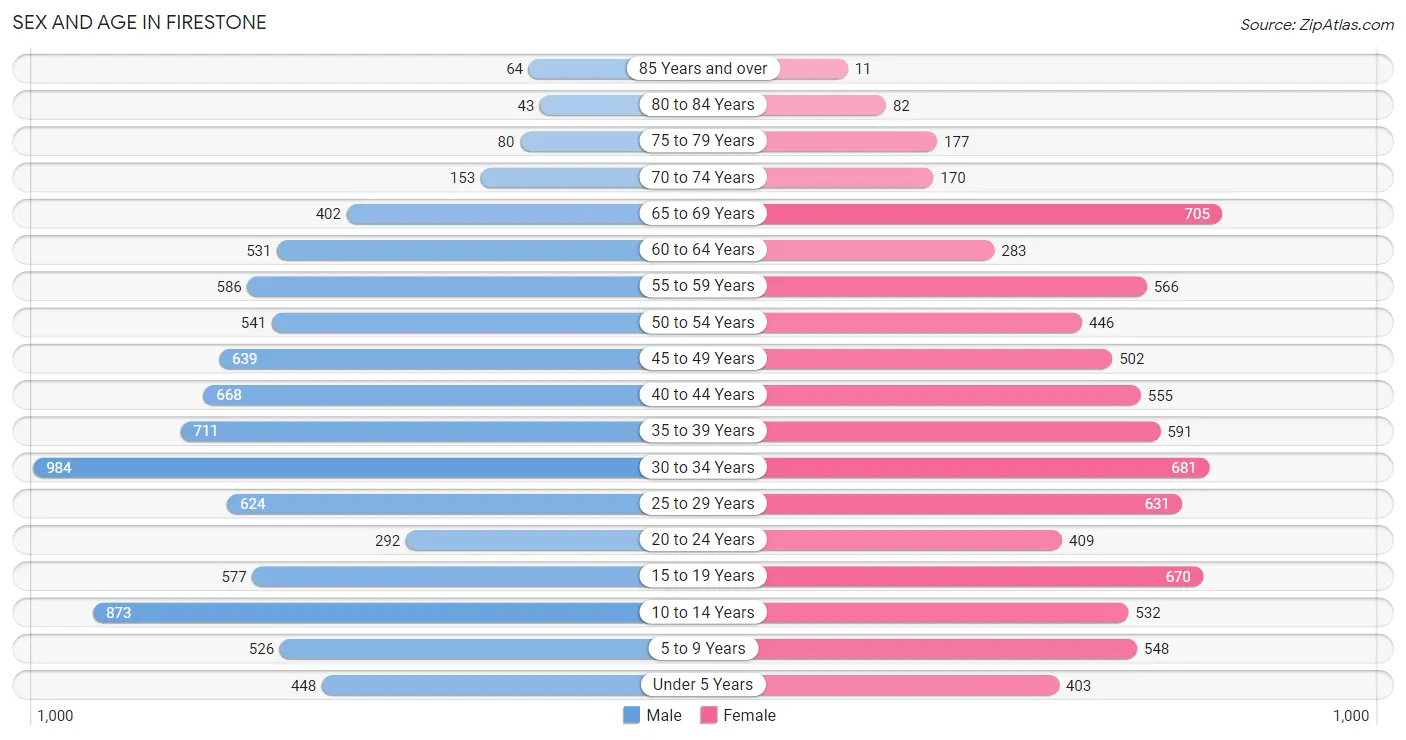
Sex and Age in Firestone
Sex and Age in Firestone
The most populous age groups in Firestone are 30 to 34 Years (984 | 11.3%) for men and 65 to 69 Years (705 | 8.8%) for women.
| Age Bracket | Male | Female |
| Under 5 Years | 448 (5.1%) | 403 (5.1%) |
| 5 to 9 Years | 526 (6.0%) | 548 (6.9%) |
| 10 to 14 Years | 873 (10.0%) | 532 (6.7%) |
| 15 to 19 Years | 577 (6.6%) | 670 (8.4%) |
| 20 to 24 Years | 292 (3.3%) | 409 (5.1%) |
| 25 to 29 Years | 624 (7.1%) | 631 (7.9%) |
| 30 to 34 Years | 984 (11.3%) | 681 (8.6%) |
| 35 to 39 Years | 711 (8.1%) | 591 (7.4%) |
| 40 to 44 Years | 668 (7.6%) | 555 (7.0%) |
| 45 to 49 Years | 639 (7.3%) | 502 (6.3%) |
| 50 to 54 Years | 541 (6.2%) | 446 (5.6%) |
| 55 to 59 Years | 586 (6.7%) | 566 (7.1%) |
| 60 to 64 Years | 531 (6.1%) | 283 (3.5%) |
| 65 to 69 Years | 402 (4.6%) | 705 (8.8%) |
| 70 to 74 Years | 153 (1.8%) | 170 (2.1%) |
| 75 to 79 Years | 80 (0.9%) | 177 (2.2%) |
| 80 to 84 Years | 43 (0.5%) | 82 (1.0%) |
| 85 Years and over | 64 (0.7%) | 11 (0.1%) |
| Total | 8,742 (100.0%) | 7,962 (100.0%) |
Families and Households in Firestone
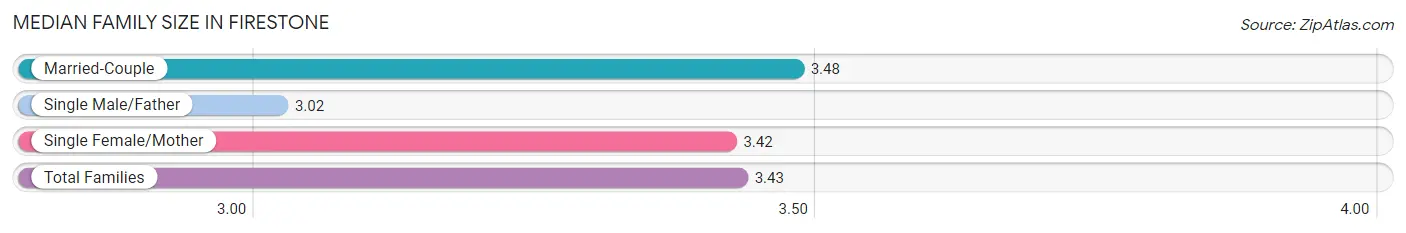
Median Family Size in Firestone
The median family size in Firestone is 3.43 persons per family, with married-couple families (3,225 | 80.0%) accounting for the largest median family size of 3.48 persons per family. On the other hand, single male/father families (421 | 10.4%) represent the smallest median family size with 3.02 persons per family.
| Family Type | # Families | Family Size |
| Married-Couple | 3,225 (80.0%) | 3.48 |
| Single Male/Father | 421 (10.4%) | 3.02 |
| Single Female/Mother | 384 (9.5%) | 3.42 |
| Total Families | 4,030 (100.0%) | 3.43 |
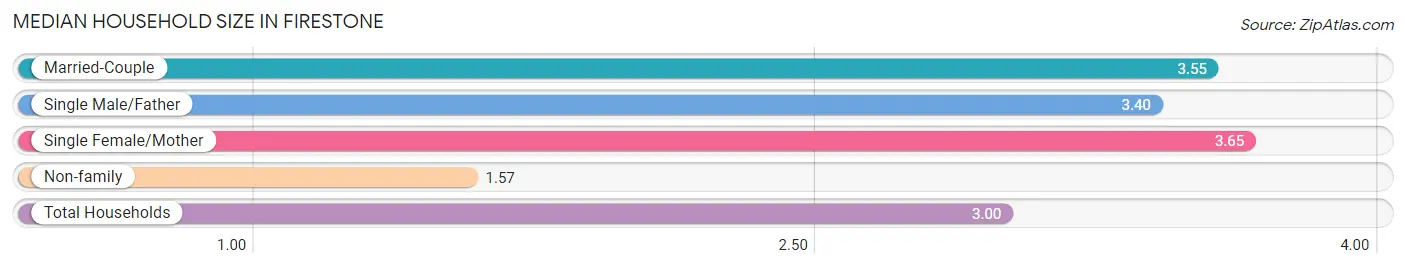
Median Household Size in Firestone
The median household size in Firestone is 3.00 persons per household, with single female/mother households (384 | 6.9%) accounting for the largest median household size of 3.65 persons per household. non-family households (1,546 | 27.7%) represent the smallest median household size with 1.57 persons per household.
| Household Type | # Households | Household Size |
| Married-Couple | 3,225 (57.8%) | 3.55 |
| Single Male/Father | 421 (7.5%) | 3.40 |
| Single Female/Mother | 384 (6.9%) | 3.65 |
| Non-family | 1,546 (27.7%) | 1.57 |
| Total Households | 5,576 (100.0%) | 3.00 |
Household Size by Marriage Status in Firestone
Out of a total of 5,576 households in Firestone, 4,030 (72.3%) are family households, while 1,546 (27.7%) are nonfamily households. The most numerous type of family households are 2-person households, comprising 1,399, and the most common type of nonfamily households are 1-person households, comprising 1,015.
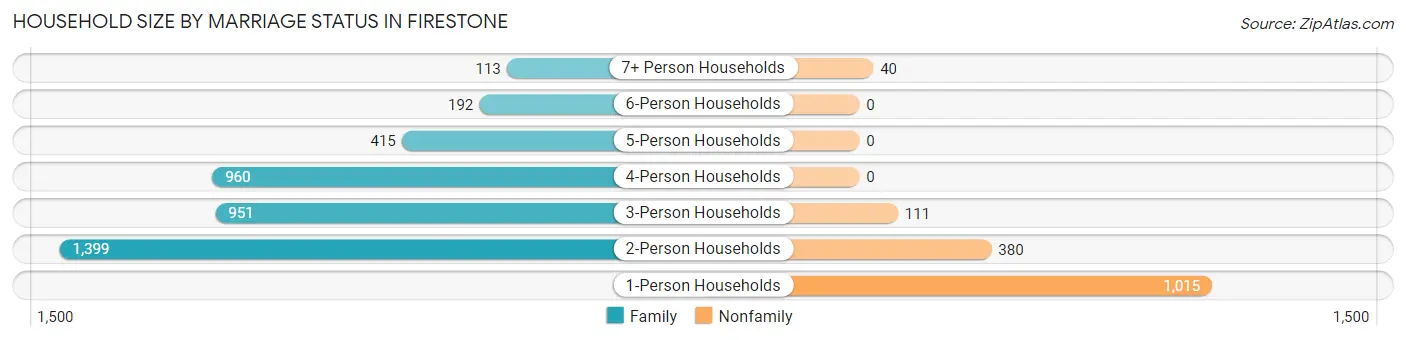
| Household Size | Family Households | Nonfamily Households |
| 1-Person Households | - | 1,015 (18.2%) |
| 2-Person Households | 1,399 (25.1%) | 380 (6.8%) |
| 3-Person Households | 951 (17.1%) | 111 (2.0%) |
| 4-Person Households | 960 (17.2%) | 0 (0.0%) |
| 5-Person Households | 415 (7.4%) | 0 (0.0%) |
| 6-Person Households | 192 (3.4%) | 0 (0.0%) |
| 7+ Person Households | 113 (2.0%) | 40 (0.7%) |
| Total | 4,030 (72.3%) | 1,546 (27.7%) |
Female Fertility in Firestone
Fertility by Age in Firestone
Average fertility rate in Firestone is 31.0 births per 1,000 women. Women in the age bracket of 20 to 34 years have the highest fertility rate with 63.0 births per 1,000 women. Women in the age bracket of 20 to 34 years acount for 86.5% of all women with births.
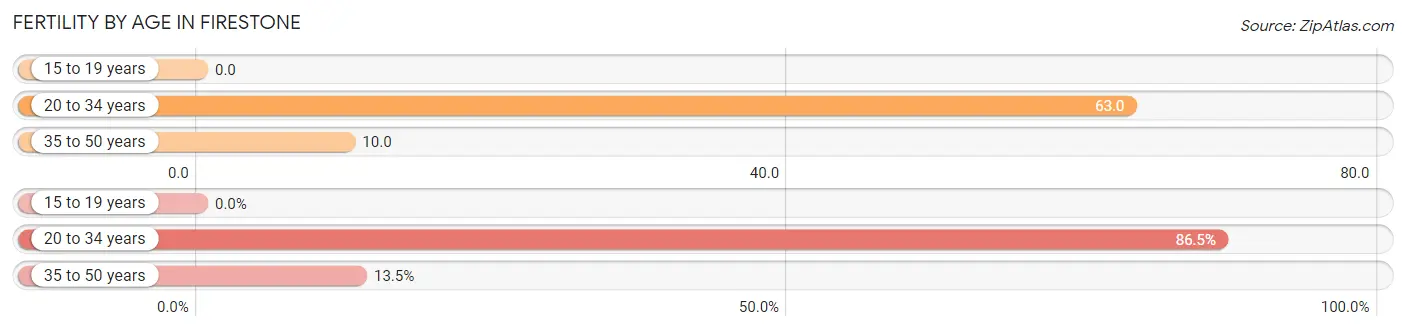
| Age Bracket | Women with Births | Births / 1,000 Women |
| 15 to 19 years | 0 (0.0%) | 0.0 |
| 20 to 34 years | 109 (86.5%) | 63.0 |
| 35 to 50 years | 17 (13.5%) | 10.0 |
| Total | 126 (100.0%) | 31.0 |
Fertility by Age by Marriage Status in Firestone
64.3% of women with births (126) in Firestone are married. The highest percentage of unmarried women with births falls into 20 to 34 years age bracket with 41.3% of them unmarried at the time of birth, while the lowest percentage of unmarried women with births belong to 35 to 50 years age bracket with 0.0% of them unmarried.
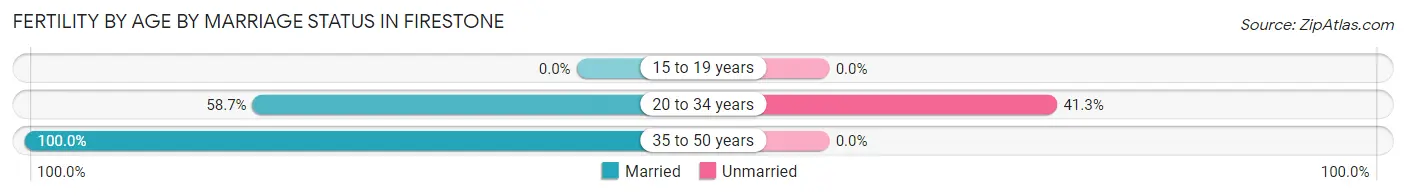
| Age Bracket | Married | Unmarried |
| 15 to 19 years | 0 (0.0%) | 0 (0.0%) |
| 20 to 34 years | 64 (58.7%) | 45 (41.3%) |
| 35 to 50 years | 17 (100.0%) | 0 (0.0%) |
| Total | 81 (64.3%) | 45 (35.7%) |
Fertility by Education in Firestone
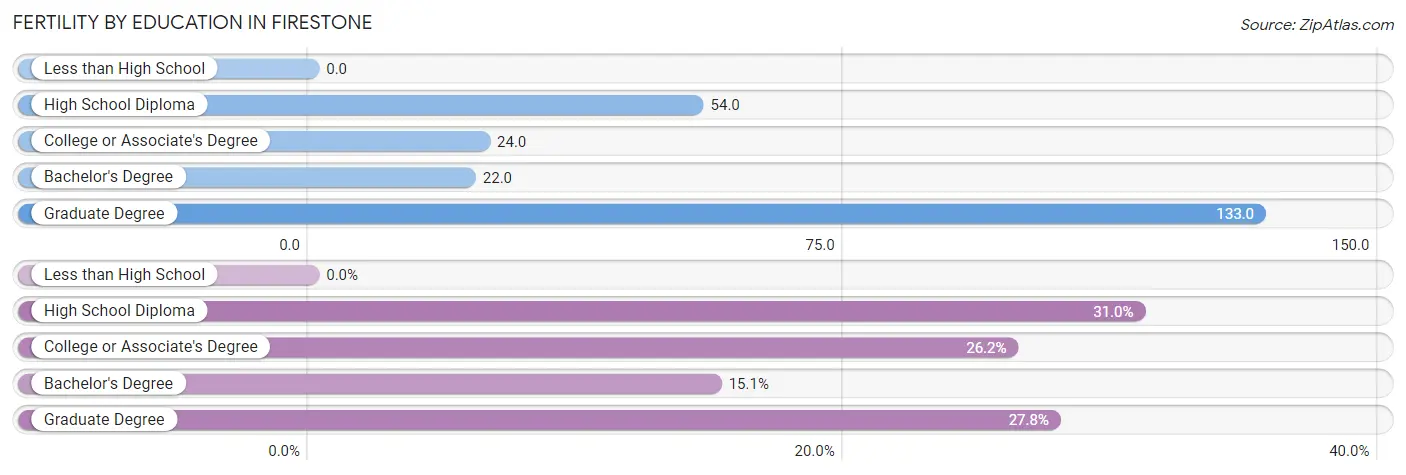
| Educational Attainment | Women with Births | Births / 1,000 Women |
| Less than High School | 0 (0.0%) | 0.0 |
| High School Diploma | 39 (30.9%) | 54.0 |
| College or Associate's Degree | 33 (26.2%) | 24.0 |
| Bachelor's Degree | 19 (15.1%) | 22.0 |
| Graduate Degree | 35 (27.8%) | 133.0 |
| Total | 126 (100.0%) | 31.0 |
Fertility by Education by Marriage Status in Firestone
35.7% of women with births in Firestone are unmarried. Women with the educational attainment of bachelor's degree are most likely to be married with 100.0% of them married at childbirth, while women with the educational attainment of high school diploma are least likely to be married with 66.7% of them unmarried at childbirth.
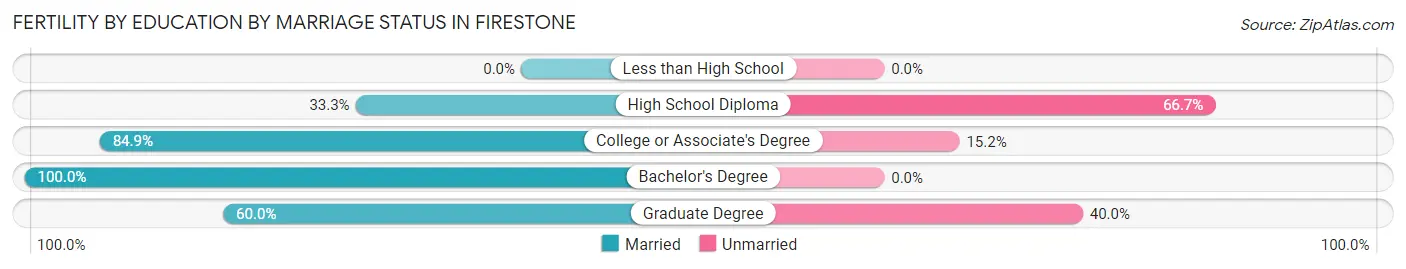
| Educational Attainment | Married | Unmarried |
| Less than High School | 0 (0.0%) | 0 (0.0%) |
| High School Diploma | 13 (33.3%) | 26 (66.7%) |
| College or Associate's Degree | 28 (84.9%) | 5 (15.1%) |
| Bachelor's Degree | 19 (100.0%) | 0 (0.0%) |
| Graduate Degree | 21 (60.0%) | 14 (40.0%) |
| Total | 81 (64.3%) | 45 (35.7%) |
Employment Characteristics in Firestone
Employment by Class of Employer in Firestone
Among the 9,224 employed individuals in Firestone, private company employees (6,646 | 72.1%), local government employees (785 | 8.5%), and not-for-profit organizations (740 | 8.0%) make up the most common classes of employment.
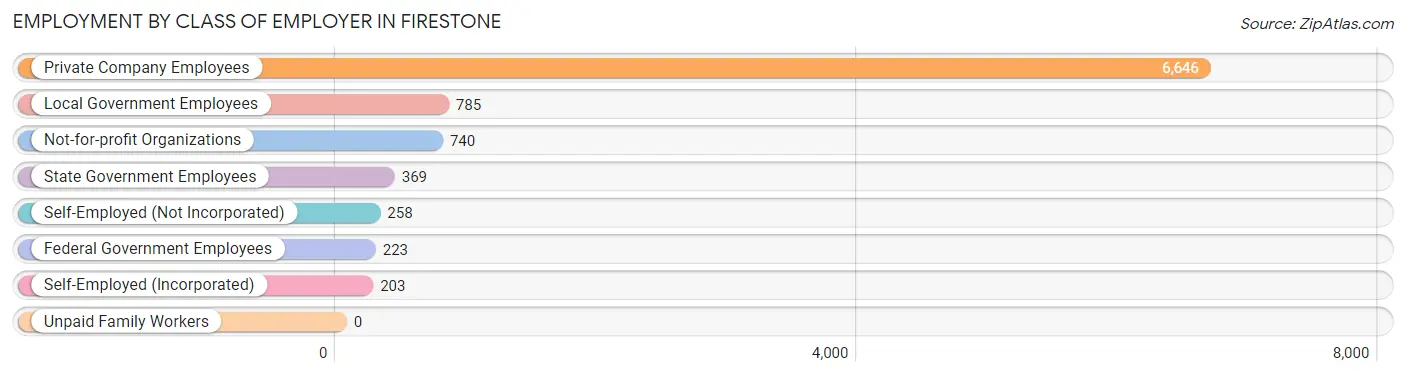
| Employer Class | # Employees | % Employees |
| Private Company Employees | 6,646 | 72.1% |
| Self-Employed (Incorporated) | 203 | 2.2% |
| Self-Employed (Not Incorporated) | 258 | 2.8% |
| Not-for-profit Organizations | 740 | 8.0% |
| Local Government Employees | 785 | 8.5% |
| State Government Employees | 369 | 4.0% |
| Federal Government Employees | 223 | 2.4% |
| Unpaid Family Workers | 0 | 0.0% |
| Total | 9,224 | 100.0% |
Employment Status by Age in Firestone
According to the labor force statistics for Firestone, out of the total population over 16 years of age (13,094), 74.2% or 9,716 individuals are in the labor force, with 3.8% or 369 of them unemployed. The age group with the highest labor force participation rate is 20 to 24 years, with 89.2% or 625 individuals in the labor force. Within the labor force, the 20 to 24 years age range has the highest percentage of unemployed individuals, with 13.9% or 87 of them being unemployed.
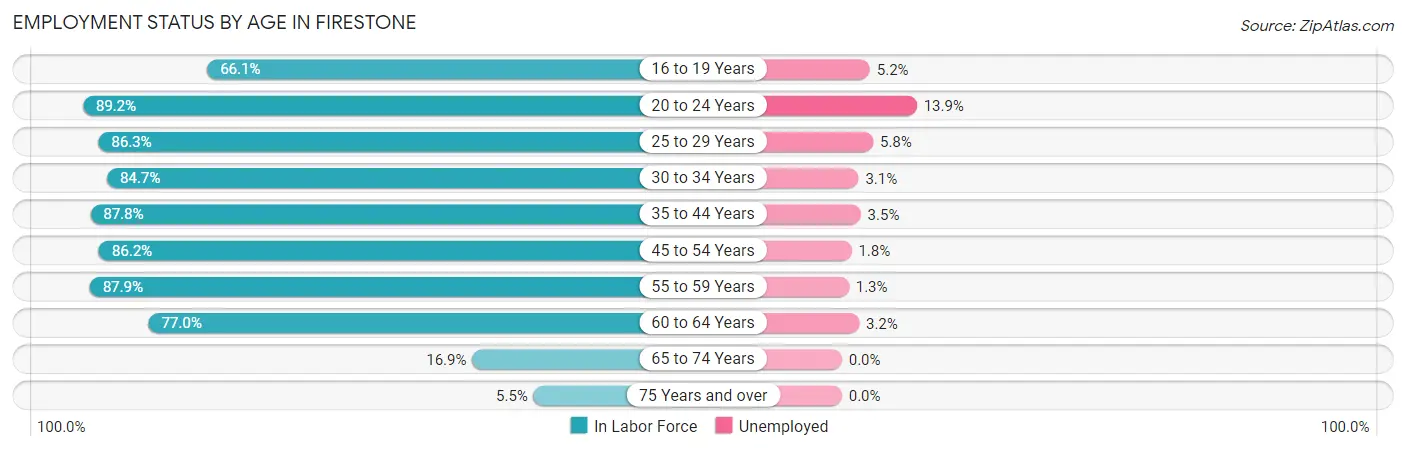
| Age Bracket | In Labor Force | Unemployed |
| 16 to 19 Years | 639 (66.1%) | 33 (5.2%) |
| 20 to 24 Years | 625 (89.2%) | 87 (13.9%) |
| 25 to 29 Years | 1,083 (86.3%) | 63 (5.8%) |
| 30 to 34 Years | 1,410 (84.7%) | 44 (3.1%) |
| 35 to 44 Years | 2,217 (87.8%) | 78 (3.5%) |
| 45 to 54 Years | 1,834 (86.2%) | 33 (1.8%) |
| 55 to 59 Years | 1,013 (87.9%) | 13 (1.3%) |
| 60 to 64 Years | 627 (77.0%) | 20 (3.2%) |
| 65 to 74 Years | 242 (16.9%) | 0 (0.0%) |
| 75 Years and over | 25 (5.5%) | 0 (0.0%) |
| Total | 9,716 (74.2%) | 369 (3.8%) |
Employment Status by Educational Attainment in Firestone
According to labor force statistics for Firestone, 85.8% of individuals (8,184) out of the total population between 25 and 64 years of age (9,539) are in the labor force, with 3.1% or 254 of them being unemployed. The group with the highest labor force participation rate are those with the educational attainment of college / associate degree, with 88.3% or 3,111 individuals in the labor force. Within the labor force, individuals with college / associate degree education have the highest percentage of unemployment, with 5.7% or 177 of them being unemployed.
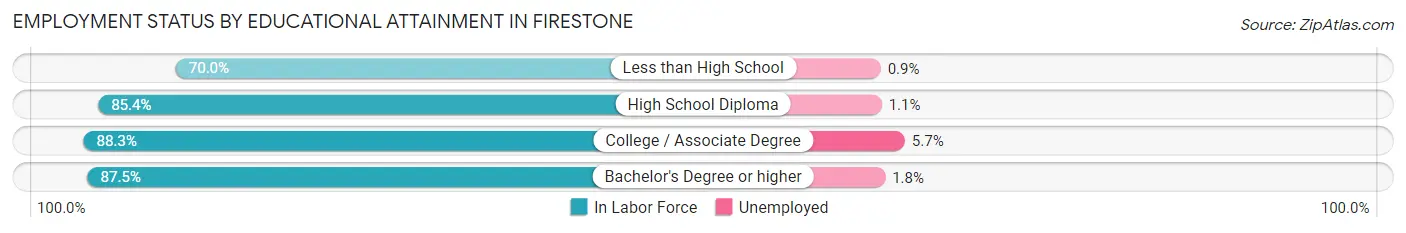
| Educational Attainment | In Labor Force | Unemployed |
| Less than High School | 573 (70.0%) | 7 (0.9%) |
| High School Diploma | 1,784 (85.4%) | 23 (1.1%) |
| College / Associate Degree | 3,111 (88.3%) | 201 (5.7%) |
| Bachelor's Degree or higher | 2,720 (87.5%) | 56 (1.8%) |
| Total | 8,184 (85.8%) | 296 (3.1%) |
Employment Occupations by Sex in Firestone
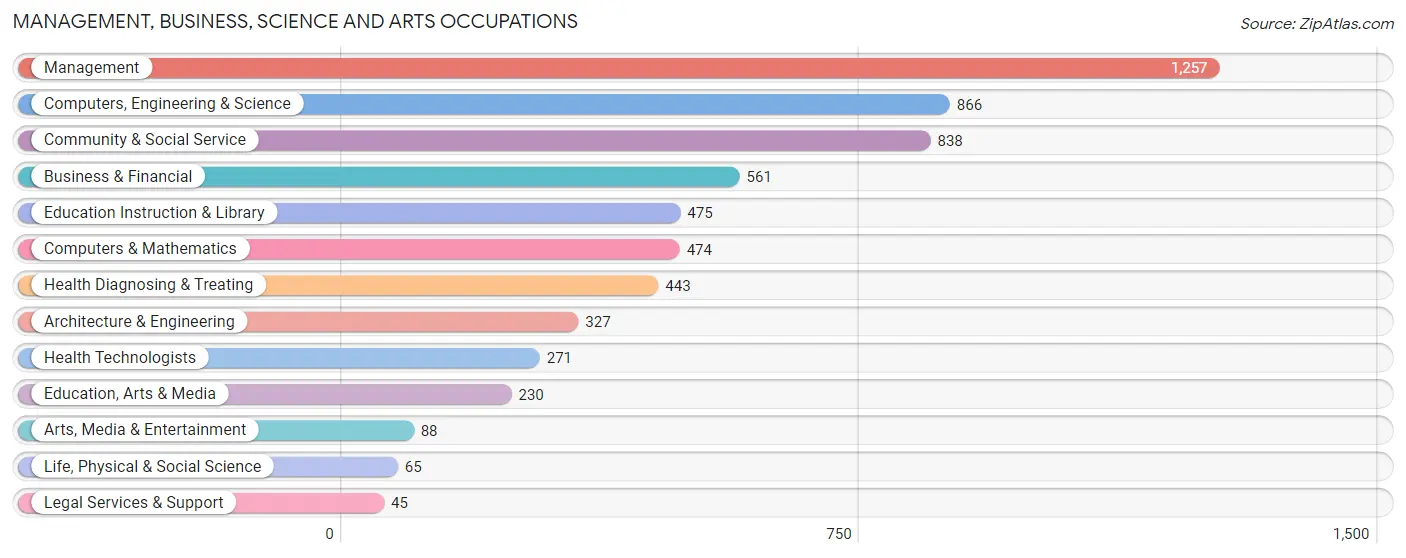
Management, Business, Science and Arts Occupations
The most common Management, Business, Science and Arts occupations in Firestone are Management (1,257 | 13.5%), Computers, Engineering & Science (866 | 9.3%), Community & Social Service (838 | 9.0%), Business & Financial (561 | 6.0%), and Education Instruction & Library (475 | 5.1%).
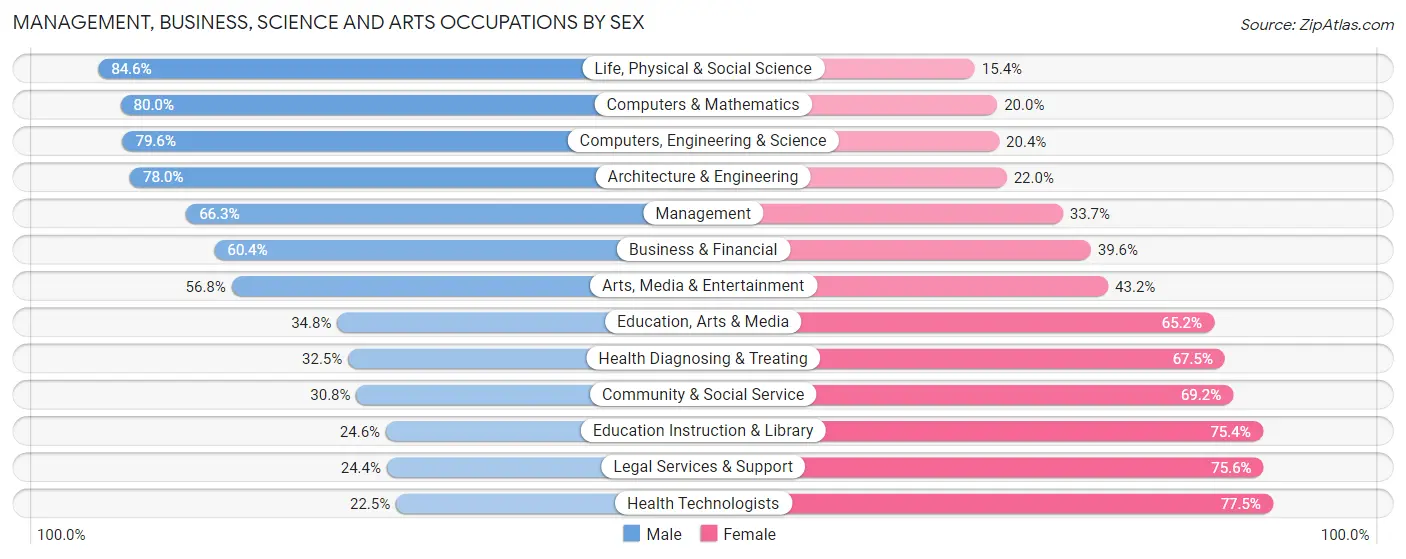
Management, Business, Science and Arts Occupations by Sex
Within the Management, Business, Science and Arts occupations in Firestone, the most male-oriented occupations are Life, Physical & Social Science (84.6%), Computers & Mathematics (80.0%), and Computers, Engineering & Science (79.6%), while the most female-oriented occupations are Health Technologists (77.5%), Legal Services & Support (75.6%), and Education Instruction & Library (75.4%).
| Occupation | Male | Female |
| Management | 833 (66.3%) | 424 (33.7%) |
| Business & Financial | 339 (60.4%) | 222 (39.6%) |
| Computers, Engineering & Science | 689 (79.6%) | 177 (20.4%) |
| Computers & Mathematics | 379 (80.0%) | 95 (20.0%) |
| Architecture & Engineering | 255 (78.0%) | 72 (22.0%) |
| Life, Physical & Social Science | 55 (84.6%) | 10 (15.4%) |
| Community & Social Service | 258 (30.8%) | 580 (69.2%) |
| Education, Arts & Media | 80 (34.8%) | 150 (65.2%) |
| Legal Services & Support | 11 (24.4%) | 34 (75.6%) |
| Education Instruction & Library | 117 (24.6%) | 358 (75.4%) |
| Arts, Media & Entertainment | 50 (56.8%) | 38 (43.2%) |
| Health Diagnosing & Treating | 144 (32.5%) | 299 (67.5%) |
| Health Technologists | 61 (22.5%) | 210 (77.5%) |
| Total (Category) | 2,263 (57.1%) | 1,702 (42.9%) |
| Total (Overall) | 5,578 (59.8%) | 3,751 (40.2%) |
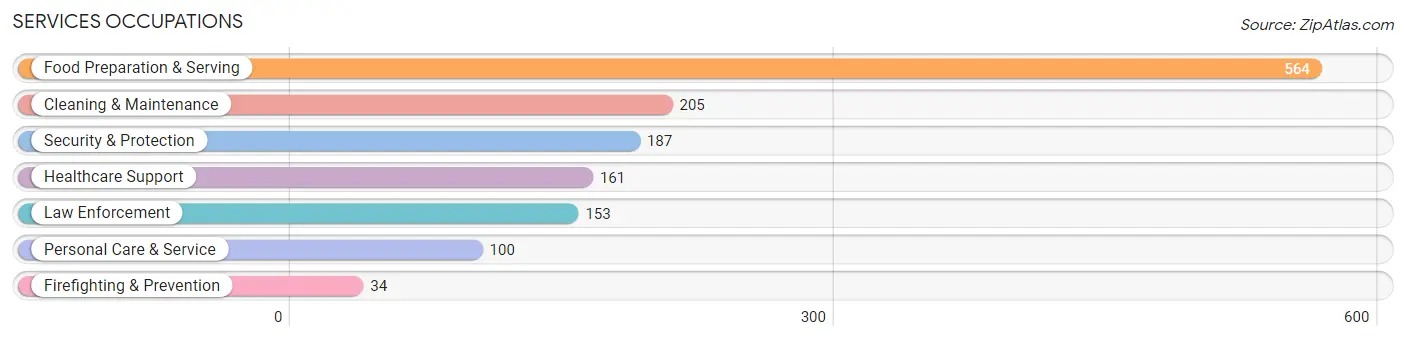
Services Occupations
The most common Services occupations in Firestone are Food Preparation & Serving (564 | 6.0%), Cleaning & Maintenance (205 | 2.2%), Security & Protection (187 | 2.0%), Healthcare Support (161 | 1.7%), and Law Enforcement (153 | 1.6%).
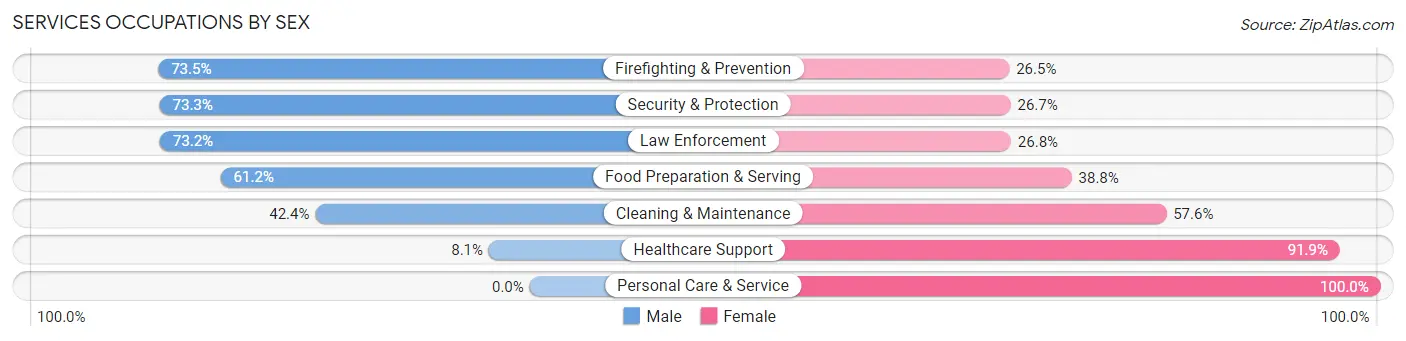
Services Occupations by Sex
Within the Services occupations in Firestone, the most male-oriented occupations are Firefighting & Prevention (73.5%), Security & Protection (73.3%), and Law Enforcement (73.2%), while the most female-oriented occupations are Personal Care & Service (100.0%), Healthcare Support (91.9%), and Cleaning & Maintenance (57.6%).
| Occupation | Male | Female |
| Healthcare Support | 13 (8.1%) | 148 (91.9%) |
| Security & Protection | 137 (73.3%) | 50 (26.7%) |
| Firefighting & Prevention | 25 (73.5%) | 9 (26.5%) |
| Law Enforcement | 112 (73.2%) | 41 (26.8%) |
| Food Preparation & Serving | 345 (61.2%) | 219 (38.8%) |
| Cleaning & Maintenance | 87 (42.4%) | 118 (57.6%) |
| Personal Care & Service | 0 (0.0%) | 100 (100.0%) |
| Total (Category) | 582 (47.8%) | 635 (52.2%) |
| Total (Overall) | 5,578 (59.8%) | 3,751 (40.2%) |
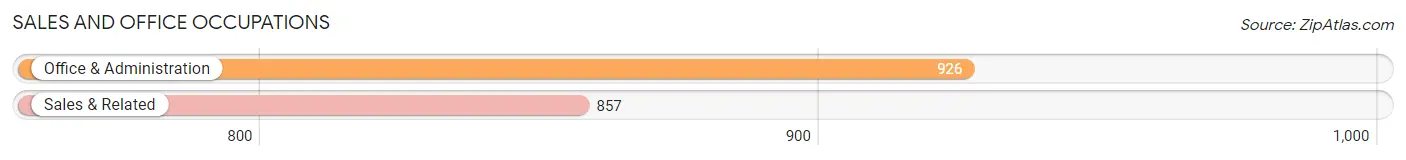
Sales and Office Occupations
The most common Sales and Office occupations in Firestone are Office & Administration (926 | 9.9%), and Sales & Related (857 | 9.2%).
Sales and Office Occupations by Sex
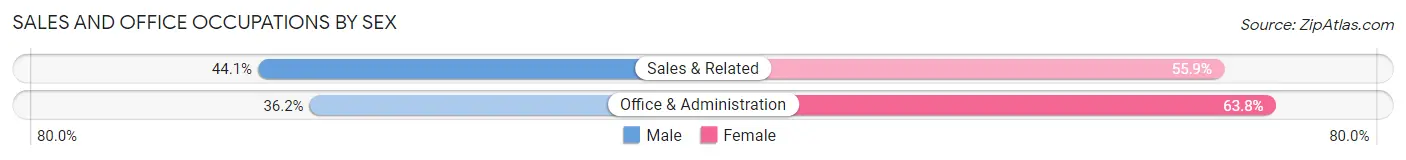
| Occupation | Male | Female |
| Sales & Related | 378 (44.1%) | 479 (55.9%) |
| Office & Administration | 335 (36.2%) | 591 (63.8%) |
| Total (Category) | 713 (40.0%) | 1,070 (60.0%) |
| Total (Overall) | 5,578 (59.8%) | 3,751 (40.2%) |
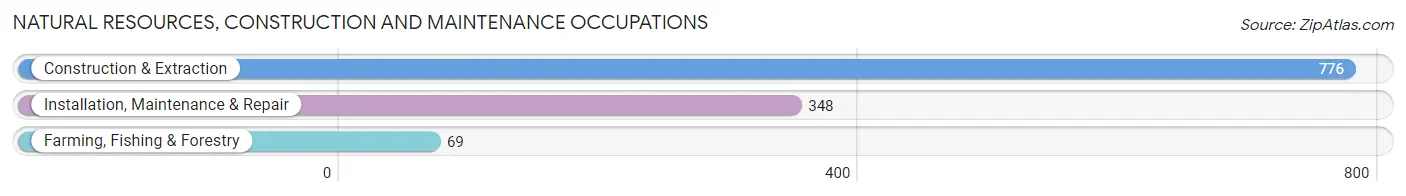
Natural Resources, Construction and Maintenance Occupations
The most common Natural Resources, Construction and Maintenance occupations in Firestone are Construction & Extraction (776 | 8.3%), Installation, Maintenance & Repair (348 | 3.7%), and Farming, Fishing & Forestry (69 | 0.7%).
Natural Resources, Construction and Maintenance Occupations by Sex
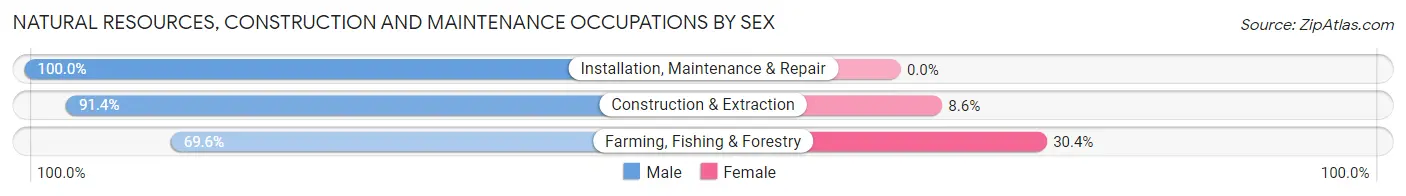
| Occupation | Male | Female |
| Farming, Fishing & Forestry | 48 (69.6%) | 21 (30.4%) |
| Construction & Extraction | 709 (91.4%) | 67 (8.6%) |
| Installation, Maintenance & Repair | 348 (100.0%) | 0 (0.0%) |
| Total (Category) | 1,105 (92.6%) | 88 (7.4%) |
| Total (Overall) | 5,578 (59.8%) | 3,751 (40.2%) |
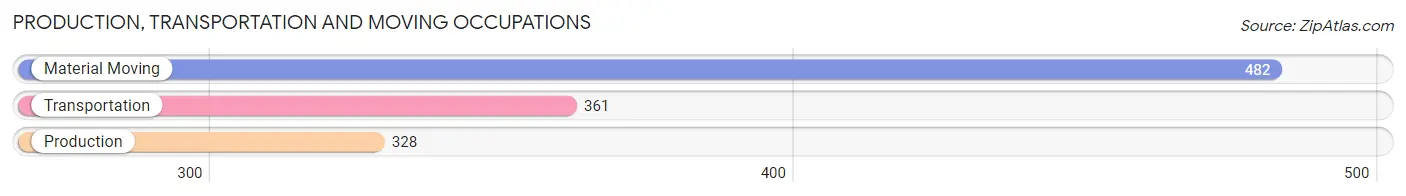
Production, Transportation and Moving Occupations
The most common Production, Transportation and Moving occupations in Firestone are Material Moving (482 | 5.2%), Transportation (361 | 3.9%), and Production (328 | 3.5%).
Production, Transportation and Moving Occupations by Sex
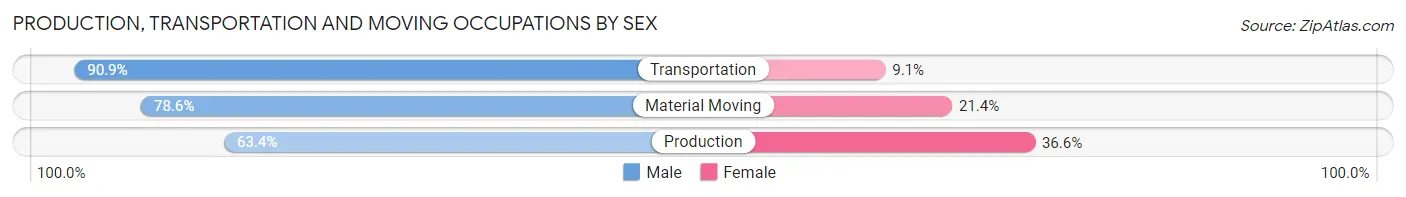
| Occupation | Male | Female |
| Production | 208 (63.4%) | 120 (36.6%) |
| Transportation | 328 (90.9%) | 33 (9.1%) |
| Material Moving | 379 (78.6%) | 103 (21.4%) |
| Total (Category) | 915 (78.1%) | 256 (21.9%) |
| Total (Overall) | 5,578 (59.8%) | 3,751 (40.2%) |
Employment Industries by Sex in Firestone
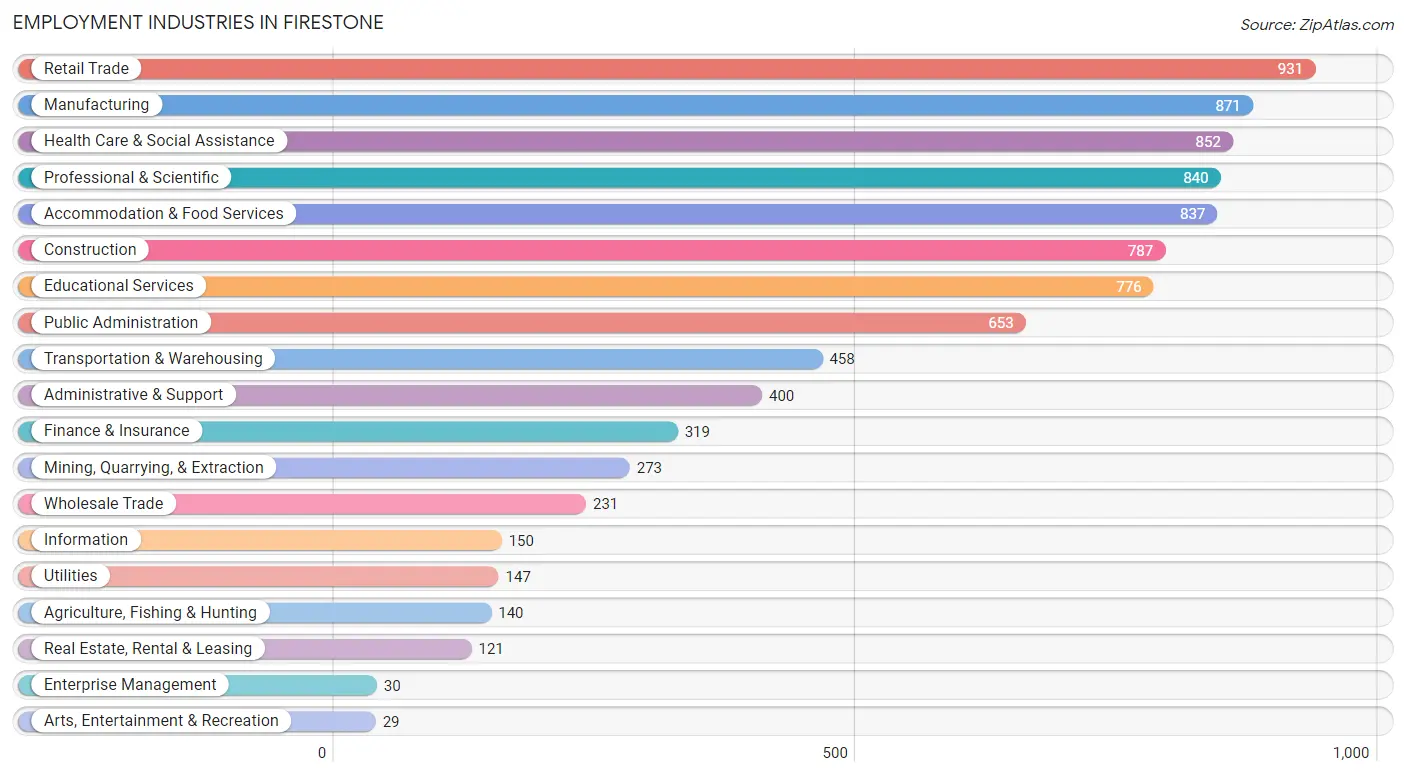
Employment Industries in Firestone
The major employment industries in Firestone include Retail Trade (931 | 10.0%), Manufacturing (871 | 9.3%), Health Care & Social Assistance (852 | 9.1%), Professional & Scientific (840 | 9.0%), and Accommodation & Food Services (837 | 9.0%).
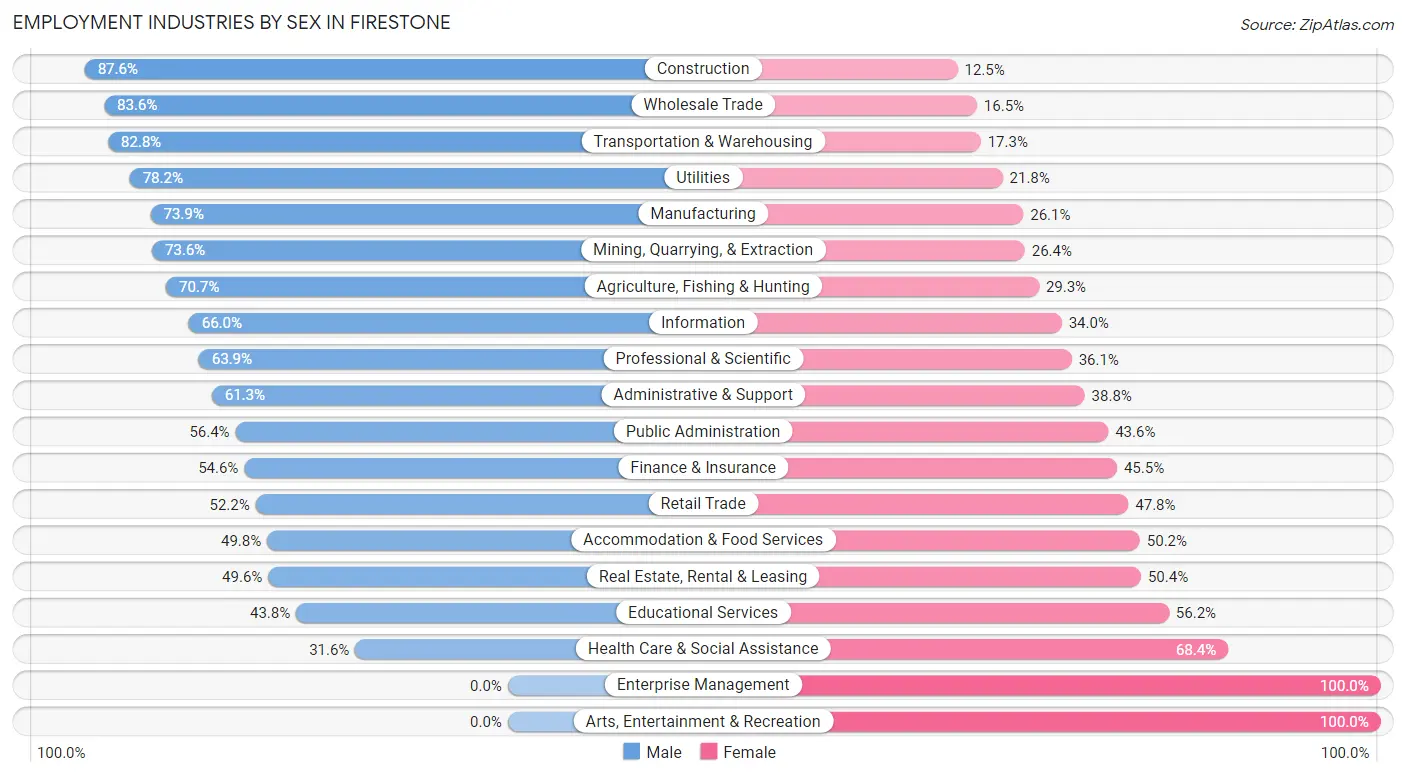
Employment Industries by Sex in Firestone
The Firestone industries that see more men than women are Construction (87.5%), Wholesale Trade (83.6%), and Transportation & Warehousing (82.8%), whereas the industries that tend to have a higher number of women are Enterprise Management (100.0%), Arts, Entertainment & Recreation (100.0%), and Health Care & Social Assistance (68.4%).
| Industry | Male | Female |
| Agriculture, Fishing & Hunting | 99 (70.7%) | 41 (29.3%) |
| Mining, Quarrying, & Extraction | 201 (73.6%) | 72 (26.4%) |
| Construction | 689 (87.5%) | 98 (12.4%) |
| Manufacturing | 644 (73.9%) | 227 (26.1%) |
| Wholesale Trade | 193 (83.6%) | 38 (16.5%) |
| Retail Trade | 486 (52.2%) | 445 (47.8%) |
| Transportation & Warehousing | 379 (82.8%) | 79 (17.2%) |
| Utilities | 115 (78.2%) | 32 (21.8%) |
| Information | 99 (66.0%) | 51 (34.0%) |
| Finance & Insurance | 174 (54.5%) | 145 (45.5%) |
| Real Estate, Rental & Leasing | 60 (49.6%) | 61 (50.4%) |
| Professional & Scientific | 537 (63.9%) | 303 (36.1%) |
| Enterprise Management | 0 (0.0%) | 30 (100.0%) |
| Administrative & Support | 245 (61.3%) | 155 (38.8%) |
| Educational Services | 340 (43.8%) | 436 (56.2%) |
| Health Care & Social Assistance | 269 (31.6%) | 583 (68.4%) |
| Arts, Entertainment & Recreation | 0 (0.0%) | 29 (100.0%) |
| Accommodation & Food Services | 417 (49.8%) | 420 (50.2%) |
| Public Administration | 368 (56.4%) | 285 (43.6%) |
| Total | 5,578 (59.8%) | 3,751 (40.2%) |
Education in Firestone
School Enrollment in Firestone
The most common levels of schooling among the 4,416 students in Firestone are high school (1,133 | 25.7%), middle school (1,113 | 25.2%), and elementary school (859 | 19.5%).
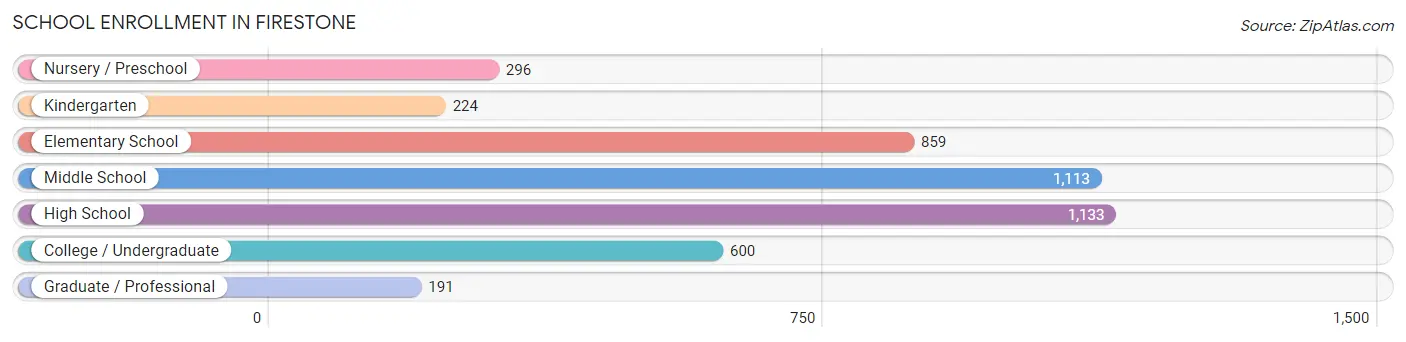
| School Level | # Students | % Students |
| Nursery / Preschool | 296 | 6.7% |
| Kindergarten | 224 | 5.1% |
| Elementary School | 859 | 19.5% |
| Middle School | 1,113 | 25.2% |
| High School | 1,133 | 25.7% |
| College / Undergraduate | 600 | 13.6% |
| Graduate / Professional | 191 | 4.3% |
| Total | 4,416 | 100.0% |
School Enrollment by Age by Funding Source in Firestone
Out of a total of 4,416 students who are enrolled in schools in Firestone, 375 (8.5%) attend a private institution, while the remaining 4,041 (91.5%) are enrolled in public schools. The age group of 35 years and over has the highest likelihood of being enrolled in private schools, with 58 (23.3% in the age bracket) enrolled. Conversely, the age group of 18 to 19 year olds has the lowest likelihood of being enrolled in a private school, with 259 (100.0% in the age bracket) attending a public institution.
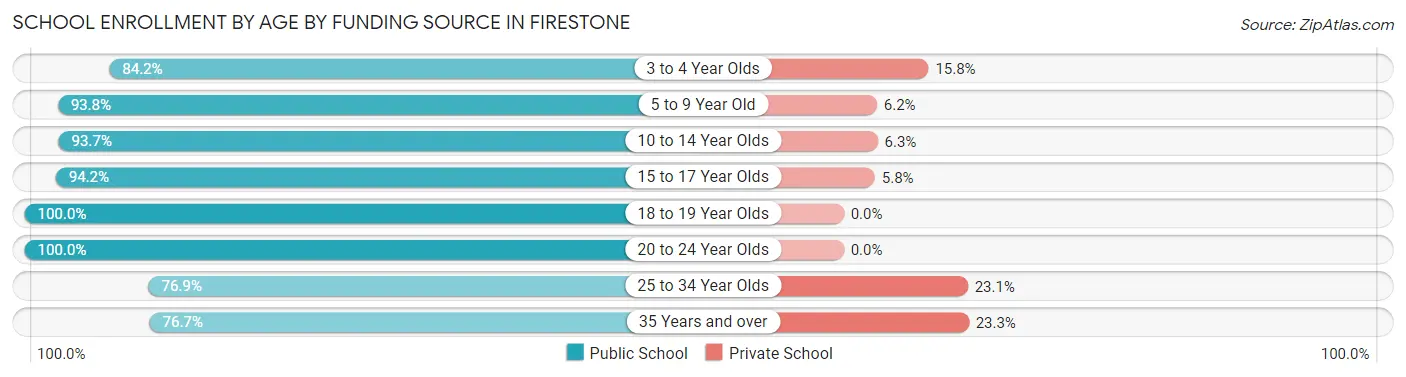
| Age Bracket | Public School | Private School |
| 3 to 4 Year Olds | 192 (84.2%) | 36 (15.8%) |
| 5 to 9 Year Old | 987 (93.8%) | 65 (6.2%) |
| 10 to 14 Year Olds | 1,290 (93.7%) | 87 (6.3%) |
| 15 to 17 Year Olds | 697 (94.2%) | 43 (5.8%) |
| 18 to 19 Year Olds | 259 (100.0%) | 0 (0.0%) |
| 20 to 24 Year Olds | 130 (100.0%) | 0 (0.0%) |
| 25 to 34 Year Olds | 293 (76.9%) | 88 (23.1%) |
| 35 Years and over | 191 (76.7%) | 58 (23.3%) |
| Total | 4,041 (91.5%) | 375 (8.5%) |
Educational Attainment by Field of Study in Firestone
Business (877 | 23.1%), engineering (393 | 10.3%), education (379 | 10.0%), science & technology (304 | 8.0%), and arts & humanities (292 | 7.7%) are the most common fields of study among 3,803 individuals in Firestone who have obtained a bachelor's degree or higher.
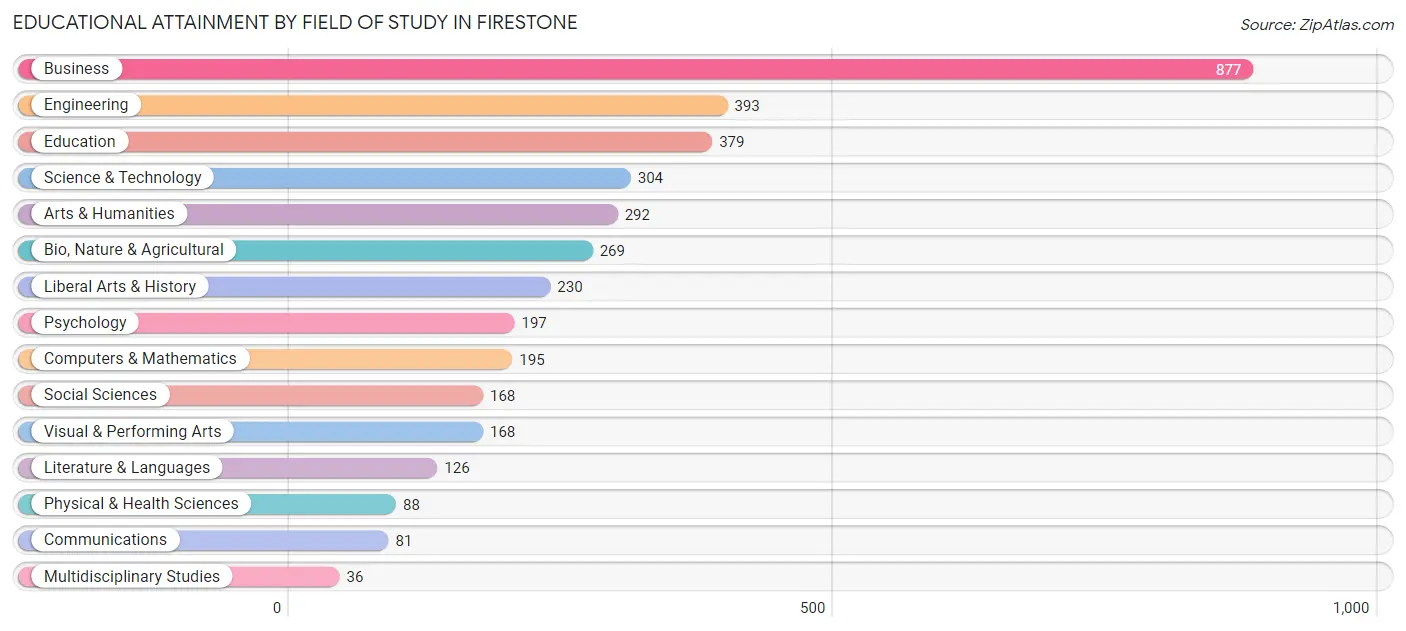
| Field of Study | # Graduates | % Graduates |
| Computers & Mathematics | 195 | 5.1% |
| Bio, Nature & Agricultural | 269 | 7.1% |
| Physical & Health Sciences | 88 | 2.3% |
| Psychology | 197 | 5.2% |
| Social Sciences | 168 | 4.4% |
| Engineering | 393 | 10.3% |
| Multidisciplinary Studies | 36 | 0.9% |
| Science & Technology | 304 | 8.0% |
| Business | 877 | 23.1% |
| Education | 379 | 10.0% |
| Literature & Languages | 126 | 3.3% |
| Liberal Arts & History | 230 | 6.0% |
| Visual & Performing Arts | 168 | 4.4% |
| Communications | 81 | 2.1% |
| Arts & Humanities | 292 | 7.7% |
| Total | 3,803 | 100.0% |
Transportation & Commute in Firestone
Vehicle Availability by Sex in Firestone
The most prevalent vehicle ownership categories in Firestone are males with 2 vehicles (2,025, accounting for 36.8%) and females with 2 vehicles (1,418, making up 54.4%).
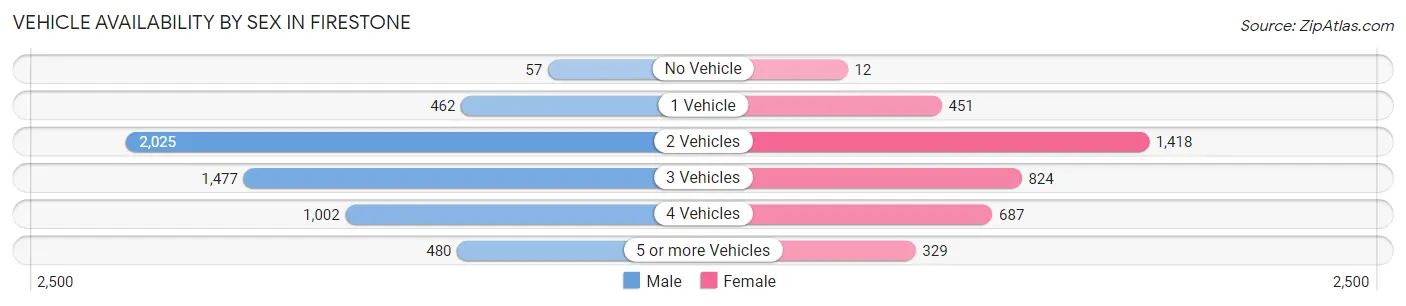
| Vehicles Available | Male | Female |
| No Vehicle | 57 (1.0%) | 12 (0.3%) |
| 1 Vehicle | 462 (8.4%) | 451 (12.1%) |
| 2 Vehicles | 2,025 (36.8%) | 1,418 (38.1%) |
| 3 Vehicles | 1,477 (26.8%) | 824 (22.1%) |
| 4 Vehicles | 1,002 (18.2%) | 687 (18.5%) |
| 5 or more Vehicles | 480 (8.7%) | 329 (8.8%) |
| Total | 5,503 (100.0%) | 3,721 (100.0%) |
Commute Time in Firestone
The most frequently occuring commute durations in Firestone are 30 to 34 minutes (1,591 commuters, 19.7%), 45 to 59 minutes (1,142 commuters, 14.1%), and 40 to 44 minutes (743 commuters, 9.2%).
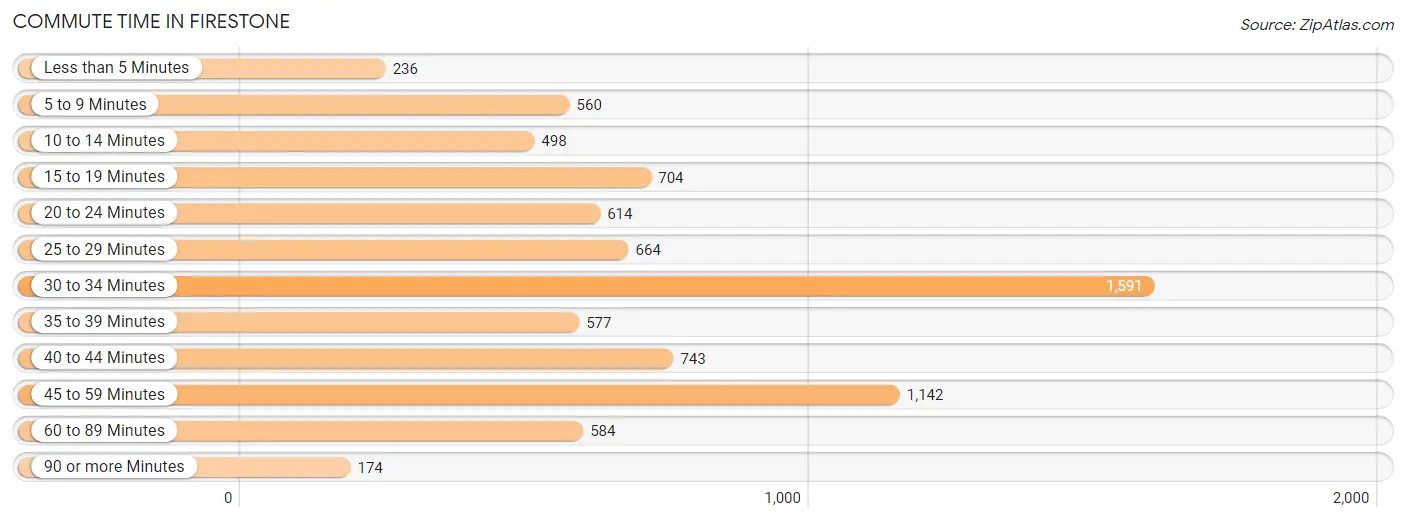
| Commute Time | # Commuters | % Commuters |
| Less than 5 Minutes | 236 | 2.9% |
| 5 to 9 Minutes | 560 | 6.9% |
| 10 to 14 Minutes | 498 | 6.2% |
| 15 to 19 Minutes | 704 | 8.7% |
| 20 to 24 Minutes | 614 | 7.6% |
| 25 to 29 Minutes | 664 | 8.2% |
| 30 to 34 Minutes | 1,591 | 19.7% |
| 35 to 39 Minutes | 577 | 7.1% |
| 40 to 44 Minutes | 743 | 9.2% |
| 45 to 59 Minutes | 1,142 | 14.1% |
| 60 to 89 Minutes | 584 | 7.2% |
| 90 or more Minutes | 174 | 2.1% |
Commute Time by Sex in Firestone
The most common commute times in Firestone are 30 to 34 minutes (990 commuters, 20.2%) for males and 30 to 34 minutes (601 commuters, 18.8%) for females.
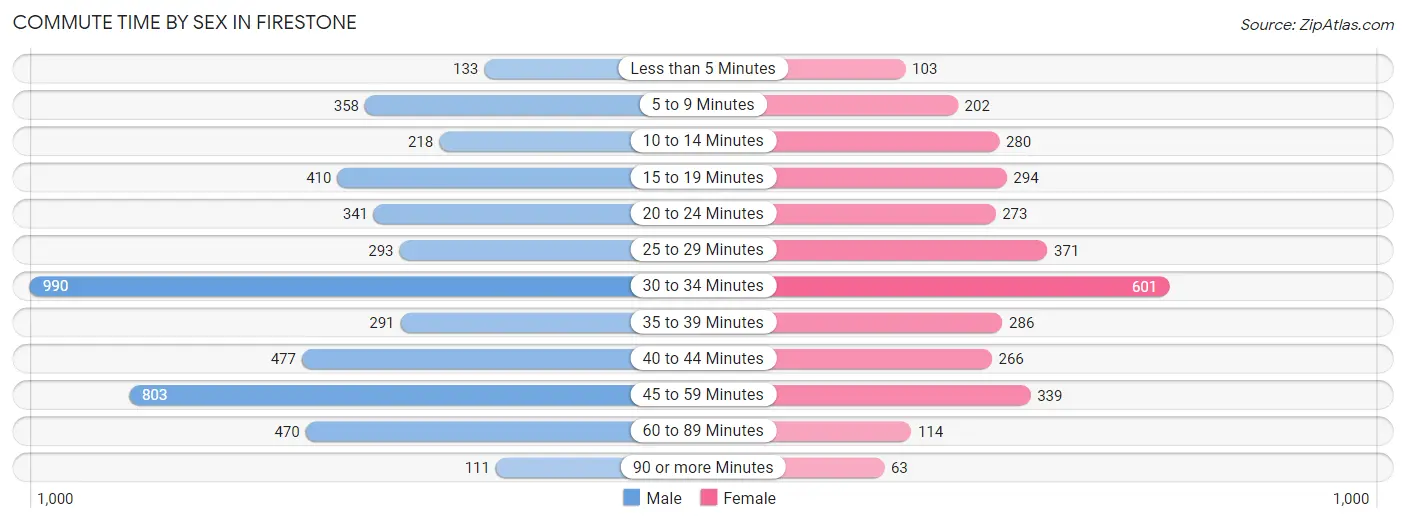
| Commute Time | Male | Female |
| Less than 5 Minutes | 133 (2.7%) | 103 (3.2%) |
| 5 to 9 Minutes | 358 (7.3%) | 202 (6.3%) |
| 10 to 14 Minutes | 218 (4.4%) | 280 (8.8%) |
| 15 to 19 Minutes | 410 (8.4%) | 294 (9.2%) |
| 20 to 24 Minutes | 341 (7.0%) | 273 (8.6%) |
| 25 to 29 Minutes | 293 (6.0%) | 371 (11.6%) |
| 30 to 34 Minutes | 990 (20.2%) | 601 (18.8%) |
| 35 to 39 Minutes | 291 (5.9%) | 286 (9.0%) |
| 40 to 44 Minutes | 477 (9.7%) | 266 (8.3%) |
| 45 to 59 Minutes | 803 (16.4%) | 339 (10.6%) |
| 60 to 89 Minutes | 470 (9.6%) | 114 (3.6%) |
| 90 or more Minutes | 111 (2.3%) | 63 (2.0%) |
Time of Departure to Work by Sex in Firestone
The most frequent times of departure to work in Firestone are 6:00 AM to 6:29 AM (851, 17.4%) for males and 7:00 AM to 7:29 AM (442, 13.9%) for females.
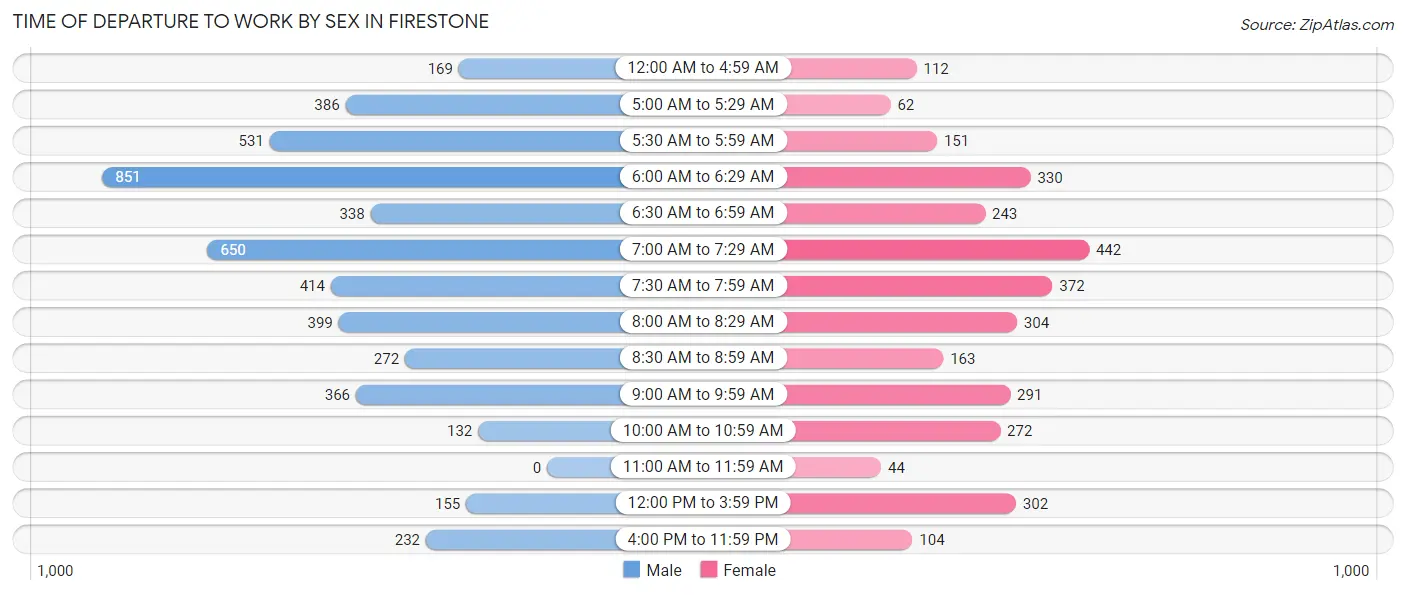
| Time of Departure | Male | Female |
| 12:00 AM to 4:59 AM | 169 (3.5%) | 112 (3.5%) |
| 5:00 AM to 5:29 AM | 386 (7.9%) | 62 (1.9%) |
| 5:30 AM to 5:59 AM | 531 (10.8%) | 151 (4.7%) |
| 6:00 AM to 6:29 AM | 851 (17.4%) | 330 (10.3%) |
| 6:30 AM to 6:59 AM | 338 (6.9%) | 243 (7.6%) |
| 7:00 AM to 7:29 AM | 650 (13.3%) | 442 (13.9%) |
| 7:30 AM to 7:59 AM | 414 (8.5%) | 372 (11.7%) |
| 8:00 AM to 8:29 AM | 399 (8.2%) | 304 (9.5%) |
| 8:30 AM to 8:59 AM | 272 (5.6%) | 163 (5.1%) |
| 9:00 AM to 9:59 AM | 366 (7.5%) | 291 (9.1%) |
| 10:00 AM to 10:59 AM | 132 (2.7%) | 272 (8.5%) |
| 11:00 AM to 11:59 AM | 0 (0.0%) | 44 (1.4%) |
| 12:00 PM to 3:59 PM | 155 (3.2%) | 302 (9.5%) |
| 4:00 PM to 11:59 PM | 232 (4.7%) | 104 (3.3%) |
| Total | 4,895 (100.0%) | 3,192 (100.0%) |
Housing Occupancy in Firestone
Occupancy by Ownership in Firestone
Of the total 5,576 dwellings in Firestone, owner-occupied units account for 4,646 (83.3%), while renter-occupied units make up 930 (16.7%).
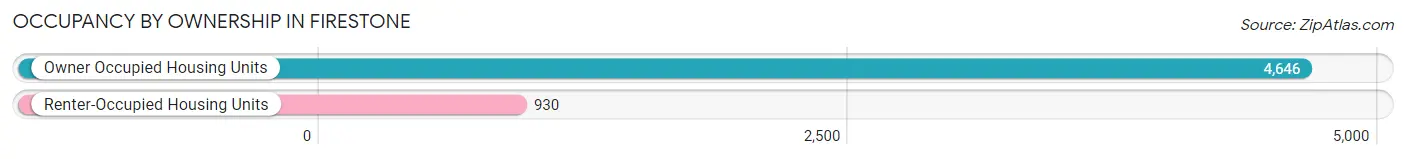
| Occupancy | # Housing Units | % Housing Units |
| Owner Occupied Housing Units | 4,646 | 83.3% |
| Renter-Occupied Housing Units | 930 | 16.7% |
| Total Occupied Housing Units | 5,576 | 100.0% |
Occupancy by Household Size in Firestone
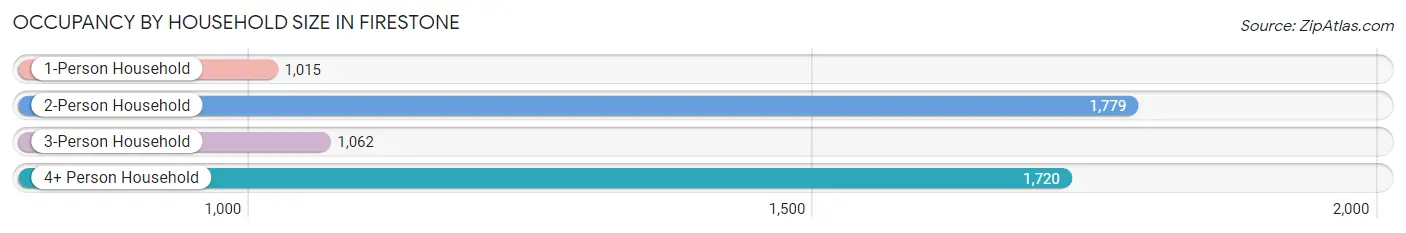
| Household Size | # Housing Units | % Housing Units |
| 1-Person Household | 1,015 | 18.2% |
| 2-Person Household | 1,779 | 31.9% |
| 3-Person Household | 1,062 | 19.1% |
| 4+ Person Household | 1,720 | 30.8% |
| Total Housing Units | 5,576 | 100.0% |
Occupancy by Ownership by Household Size in Firestone
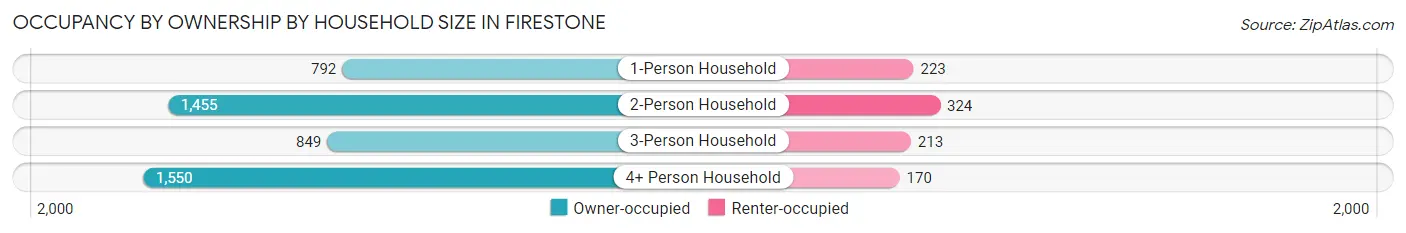
| Household Size | Owner-occupied | Renter-occupied |
| 1-Person Household | 792 (78.0%) | 223 (22.0%) |
| 2-Person Household | 1,455 (81.8%) | 324 (18.2%) |
| 3-Person Household | 849 (79.9%) | 213 (20.1%) |
| 4+ Person Household | 1,550 (90.1%) | 170 (9.9%) |
| Total Housing Units | 4,646 (83.3%) | 930 (16.7%) |
Occupancy by Educational Attainment in Firestone
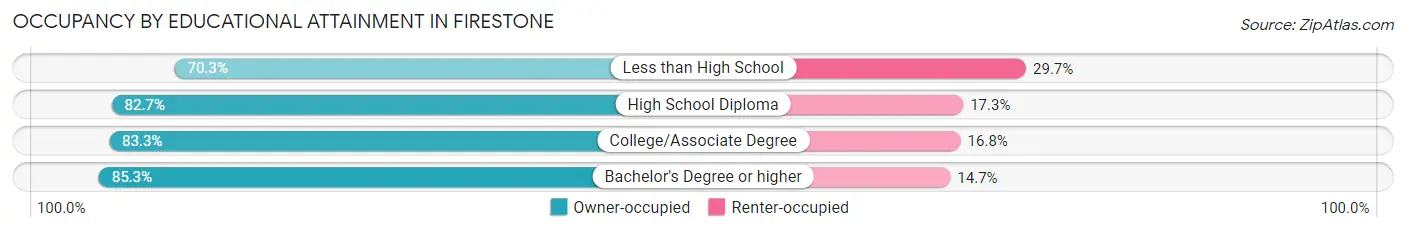
| Household Size | Owner-occupied | Renter-occupied |
| Less than High School | 182 (70.3%) | 77 (29.7%) |
| High School Diploma | 887 (82.7%) | 185 (17.3%) |
| College/Associate Degree | 1,769 (83.3%) | 356 (16.8%) |
| Bachelor's Degree or higher | 1,808 (85.3%) | 312 (14.7%) |
Occupancy by Age of Householder in Firestone
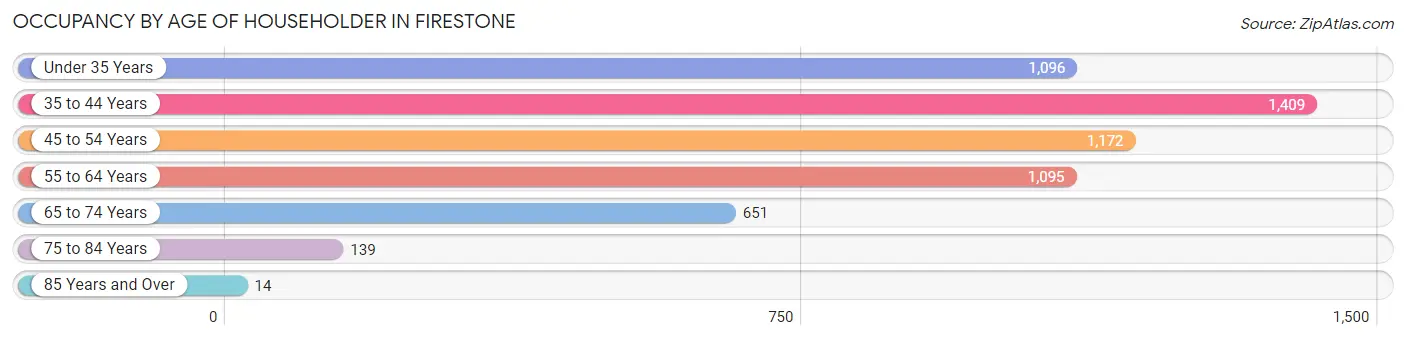
| Age Bracket | # Households | % Households |
| Under 35 Years | 1,096 | 19.7% |
| 35 to 44 Years | 1,409 | 25.3% |
| 45 to 54 Years | 1,172 | 21.0% |
| 55 to 64 Years | 1,095 | 19.6% |
| 65 to 74 Years | 651 | 11.7% |
| 75 to 84 Years | 139 | 2.5% |
| 85 Years and Over | 14 | 0.3% |
| Total | 5,576 | 100.0% |
Housing Finances in Firestone
Median Income by Occupancy in Firestone
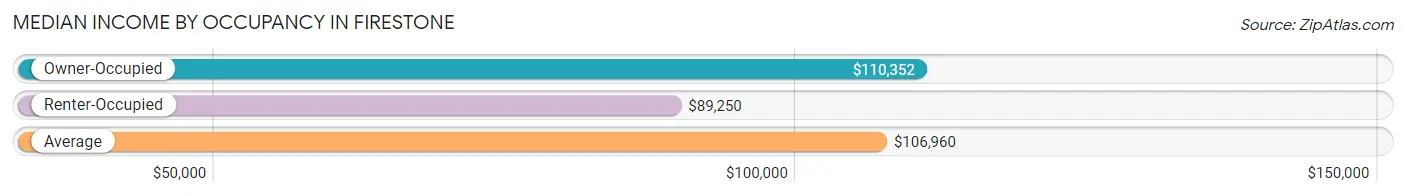
| Occupancy Type | # Households | Median Income |
| Owner-Occupied | 4,646 (83.3%) | $110,352 |
| Renter-Occupied | 930 (16.7%) | $89,250 |
| Average | 5,576 (100.0%) | $106,960 |
Occupancy by Householder Income Bracket in Firestone
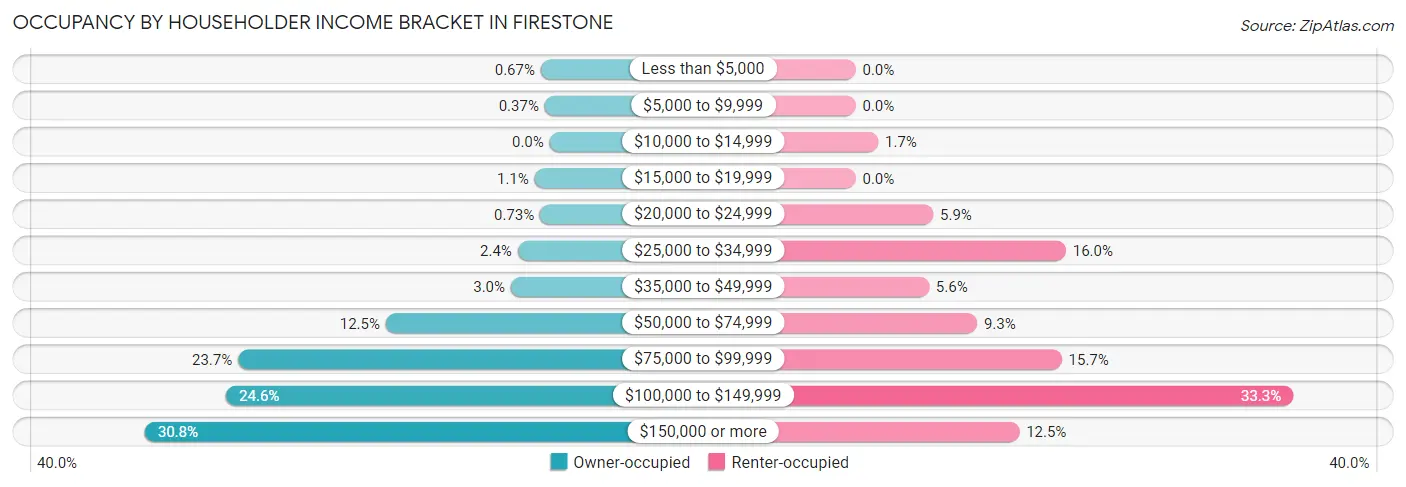
| Income Bracket | Owner-occupied | Renter-occupied |
| Less than $5,000 | 31 (0.7%) | 0 (0.0%) |
| $5,000 to $9,999 | 17 (0.4%) | 0 (0.0%) |
| $10,000 to $14,999 | 0 (0.0%) | 16 (1.7%) |
| $15,000 to $19,999 | 53 (1.1%) | 0 (0.0%) |
| $20,000 to $24,999 | 34 (0.7%) | 55 (5.9%) |
| $25,000 to $34,999 | 113 (2.4%) | 149 (16.0%) |
| $35,000 to $49,999 | 137 (2.9%) | 52 (5.6%) |
| $50,000 to $74,999 | 580 (12.5%) | 86 (9.2%) |
| $75,000 to $99,999 | 1,103 (23.7%) | 146 (15.7%) |
| $100,000 to $149,999 | 1,145 (24.6%) | 310 (33.3%) |
| $150,000 or more | 1,433 (30.8%) | 116 (12.5%) |
| Total | 4,646 (100.0%) | 930 (100.0%) |
Monthly Housing Cost Tiers in Firestone
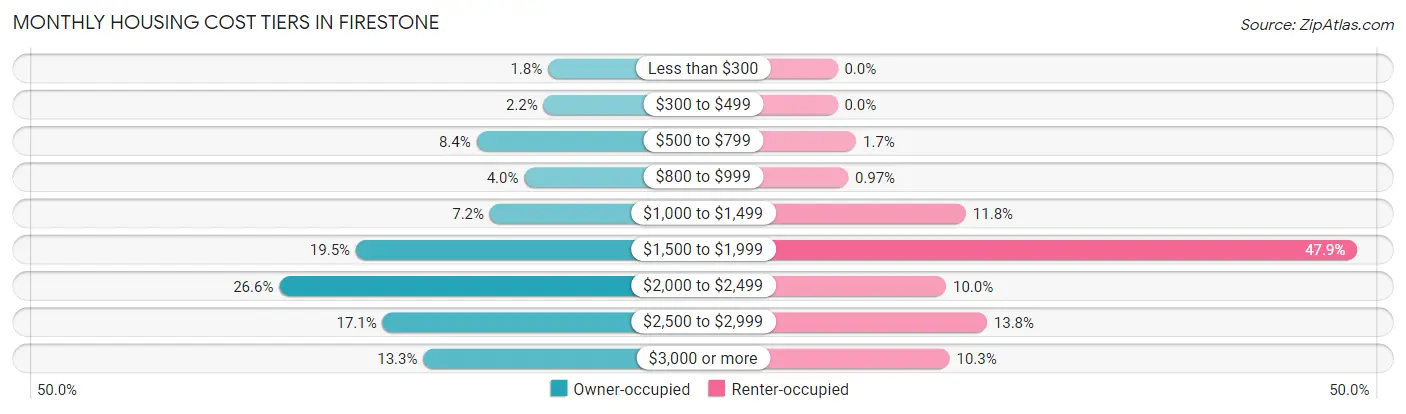
| Monthly Cost | Owner-occupied | Renter-occupied |
| Less than $300 | 84 (1.8%) | 0 (0.0%) |
| $300 to $499 | 103 (2.2%) | 0 (0.0%) |
| $500 to $799 | 390 (8.4%) | 16 (1.7%) |
| $800 to $999 | 186 (4.0%) | 9 (1.0%) |
| $1,000 to $1,499 | 333 (7.2%) | 110 (11.8%) |
| $1,500 to $1,999 | 906 (19.5%) | 445 (47.8%) |
| $2,000 to $2,499 | 1,234 (26.6%) | 93 (10.0%) |
| $2,500 to $2,999 | 792 (17.1%) | 128 (13.8%) |
| $3,000 or more | 618 (13.3%) | 96 (10.3%) |
| Total | 4,646 (100.0%) | 930 (100.0%) |
Physical Housing Characteristics in Firestone
Housing Structures in Firestone
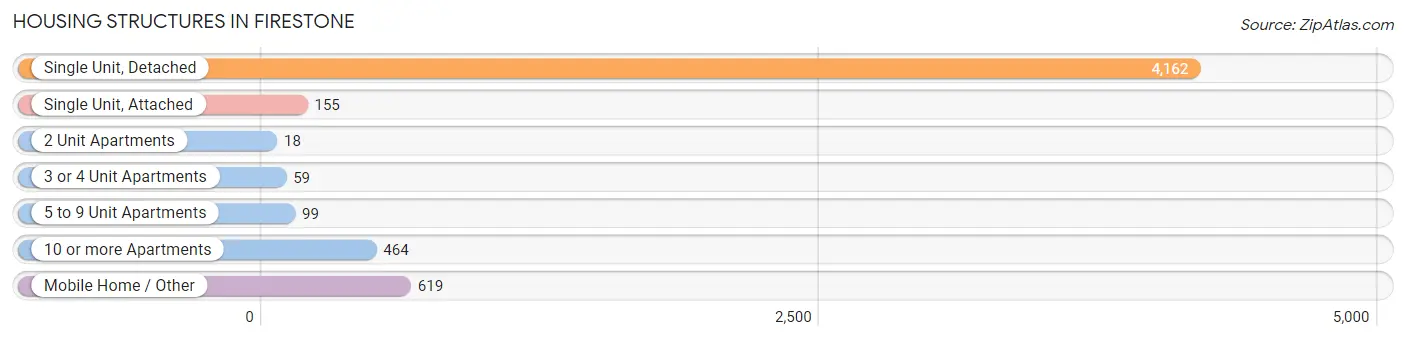
| Structure Type | # Housing Units | % Housing Units |
| Single Unit, Detached | 4,162 | 74.6% |
| Single Unit, Attached | 155 | 2.8% |
| 2 Unit Apartments | 18 | 0.3% |
| 3 or 4 Unit Apartments | 59 | 1.1% |
| 5 to 9 Unit Apartments | 99 | 1.8% |
| 10 or more Apartments | 464 | 8.3% |
| Mobile Home / Other | 619 | 11.1% |
| Total | 5,576 | 100.0% |
Housing Structures by Occupancy in Firestone
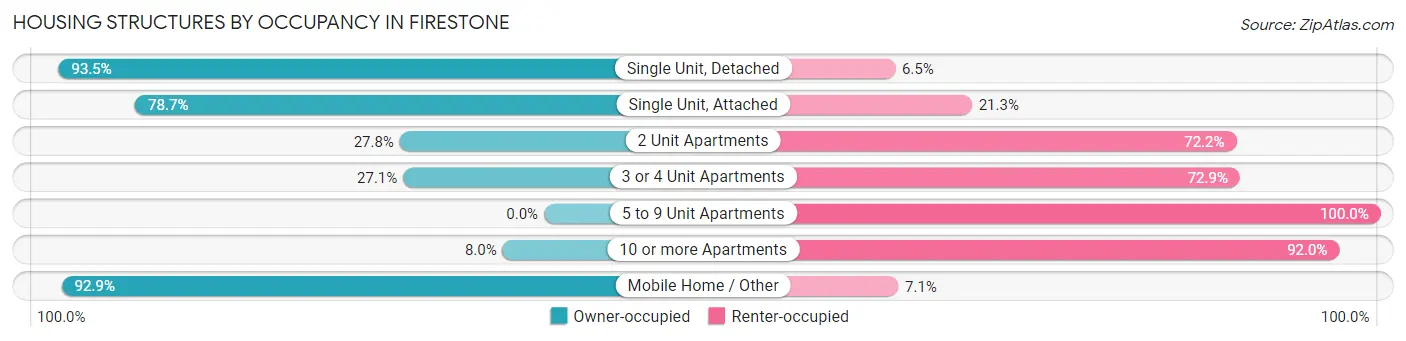
| Structure Type | Owner-occupied | Renter-occupied |
| Single Unit, Detached | 3,891 (93.5%) | 271 (6.5%) |
| Single Unit, Attached | 122 (78.7%) | 33 (21.3%) |
| 2 Unit Apartments | 5 (27.8%) | 13 (72.2%) |
| 3 or 4 Unit Apartments | 16 (27.1%) | 43 (72.9%) |
| 5 to 9 Unit Apartments | 0 (0.0%) | 99 (100.0%) |
| 10 or more Apartments | 37 (8.0%) | 427 (92.0%) |
| Mobile Home / Other | 575 (92.9%) | 44 (7.1%) |
| Total | 4,646 (83.3%) | 930 (16.7%) |
Housing Structures by Number of Rooms in Firestone
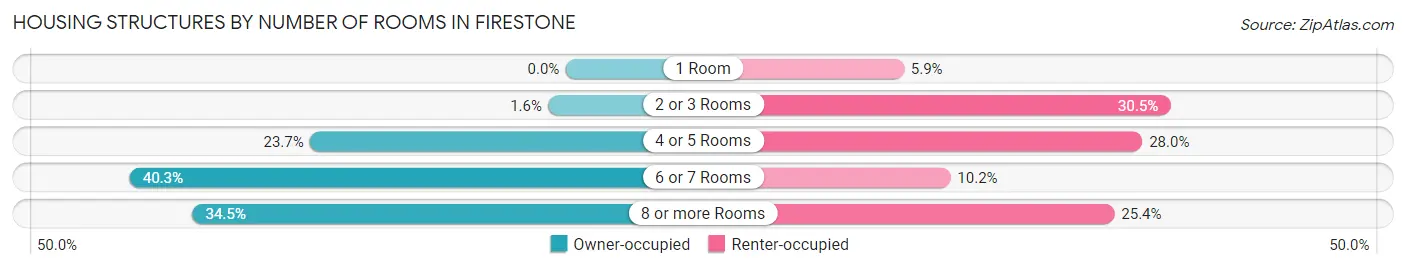
| Number of Rooms | Owner-occupied | Renter-occupied |
| 1 Room | 0 (0.0%) | 55 (5.9%) |
| 2 or 3 Rooms | 75 (1.6%) | 284 (30.5%) |
| 4 or 5 Rooms | 1,099 (23.6%) | 260 (28.0%) |
| 6 or 7 Rooms | 1,871 (40.3%) | 95 (10.2%) |
| 8 or more Rooms | 1,601 (34.5%) | 236 (25.4%) |
| Total | 4,646 (100.0%) | 930 (100.0%) |
Housing Structure by Heating Type in Firestone
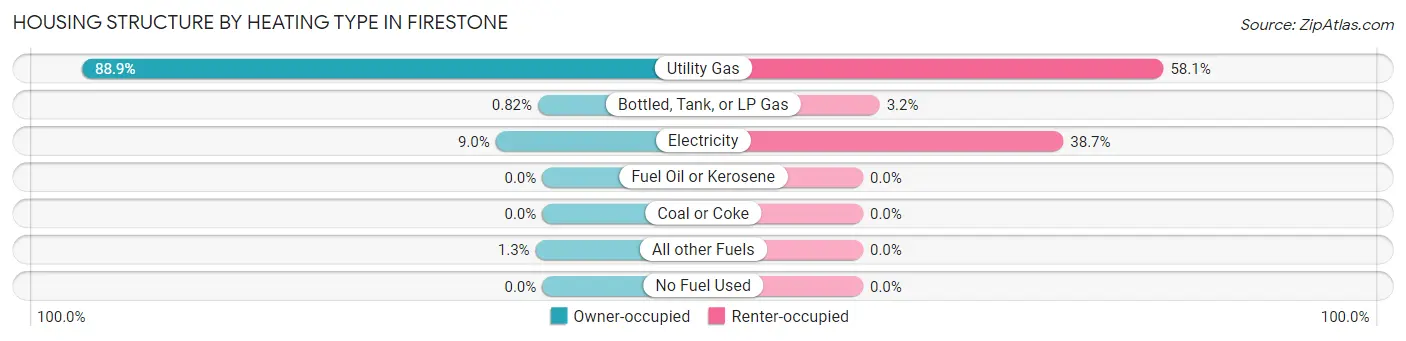
| Heating Type | Owner-occupied | Renter-occupied |
| Utility Gas | 4,130 (88.9%) | 540 (58.1%) |
| Bottled, Tank, or LP Gas | 38 (0.8%) | 30 (3.2%) |
| Electricity | 418 (9.0%) | 360 (38.7%) |
| Fuel Oil or Kerosene | 0 (0.0%) | 0 (0.0%) |
| Coal or Coke | 0 (0.0%) | 0 (0.0%) |
| All other Fuels | 60 (1.3%) | 0 (0.0%) |
| No Fuel Used | 0 (0.0%) | 0 (0.0%) |
| Total | 4,646 (100.0%) | 930 (100.0%) |
Household Vehicle Usage in Firestone
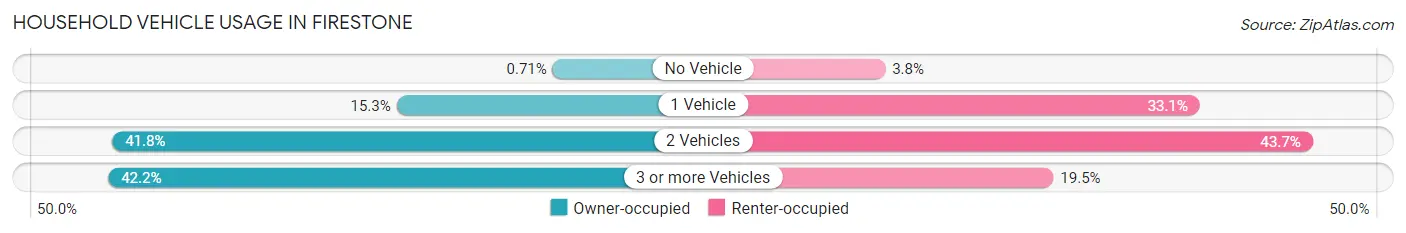
| Vehicles per Household | Owner-occupied | Renter-occupied |
| No Vehicle | 33 (0.7%) | 35 (3.8%) |
| 1 Vehicle | 710 (15.3%) | 308 (33.1%) |
| 2 Vehicles | 1,943 (41.8%) | 406 (43.7%) |
| 3 or more Vehicles | 1,960 (42.2%) | 181 (19.5%) |
| Total | 4,646 (100.0%) | 930 (100.0%) |
Real Estate & Mortgages in Firestone
Real Estate and Mortgage Overview in Firestone
| Characteristic | Without Mortgage | With Mortgage |
| Housing Units | 772 | 3,874 |
| Median Property Value | $449,300 | $461,700 |
| Median Household Income | $91,307 | $1,213 |
| Monthly Housing Costs | $670 | $593 |
| Real Estate Taxes | $2,872 | $179 |
Property Value by Mortgage Status in Firestone
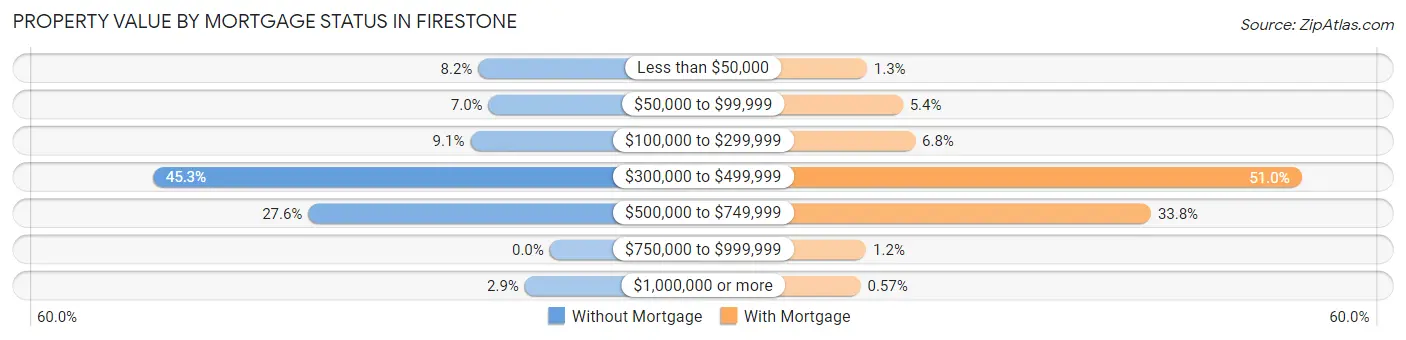
| Property Value | Without Mortgage | With Mortgage |
| Less than $50,000 | 63 (8.2%) | 50 (1.3%) |
| $50,000 to $99,999 | 54 (7.0%) | 209 (5.4%) |
| $100,000 to $299,999 | 70 (9.1%) | 264 (6.8%) |
| $300,000 to $499,999 | 350 (45.3%) | 1,974 (51.0%) |
| $500,000 to $749,999 | 213 (27.6%) | 1,308 (33.8%) |
| $750,000 to $999,999 | 0 (0.0%) | 47 (1.2%) |
| $1,000,000 or more | 22 (2.9%) | 22 (0.6%) |
| Total | 772 (100.0%) | 3,874 (100.0%) |
Household Income by Mortgage Status in Firestone
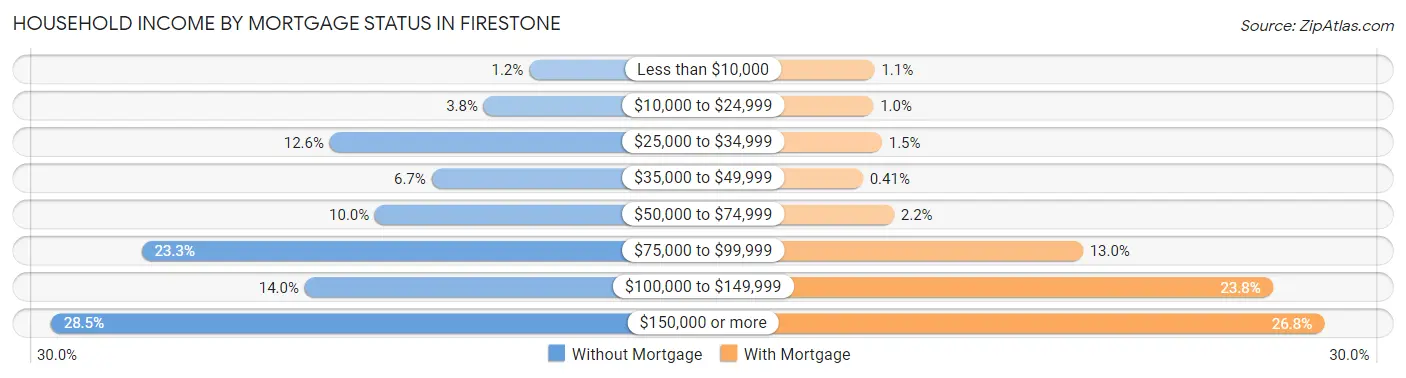
| Household Income | Without Mortgage | With Mortgage |
| Less than $10,000 | 9 (1.2%) | 42 (1.1%) |
| $10,000 to $24,999 | 29 (3.8%) | 39 (1.0%) |
| $25,000 to $34,999 | 97 (12.6%) | 58 (1.5%) |
| $35,000 to $49,999 | 52 (6.7%) | 16 (0.4%) |
| $50,000 to $74,999 | 77 (10.0%) | 85 (2.2%) |
| $75,000 to $99,999 | 180 (23.3%) | 503 (13.0%) |
| $100,000 to $149,999 | 108 (14.0%) | 923 (23.8%) |
| $150,000 or more | 220 (28.5%) | 1,037 (26.8%) |
| Total | 772 (100.0%) | 3,874 (100.0%) |
Property Value to Household Income Ratio in Firestone
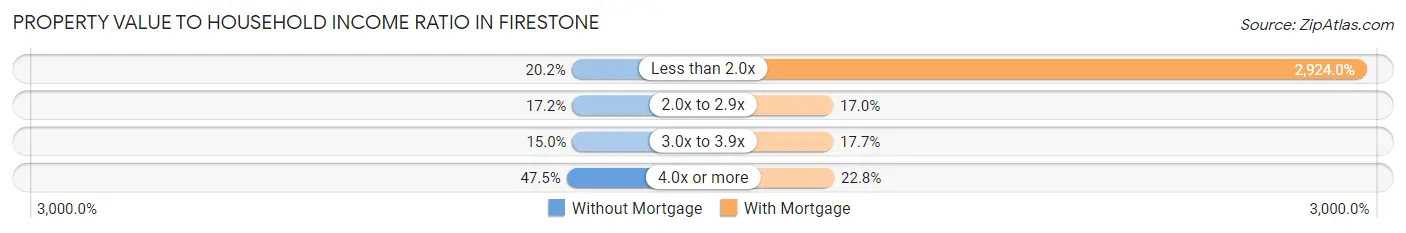
| Value-to-Income Ratio | Without Mortgage | With Mortgage |
| Less than 2.0x | 156 (20.2%) | 113,276 (2,924.0%) |
| 2.0x to 2.9x | 133 (17.2%) | 660 (17.0%) |
| 3.0x to 3.9x | 116 (15.0%) | 685 (17.7%) |
| 4.0x or more | 367 (47.5%) | 885 (22.8%) |
| Total | 772 (100.0%) | 3,874 (100.0%) |
Real Estate Taxes by Mortgage Status in Firestone
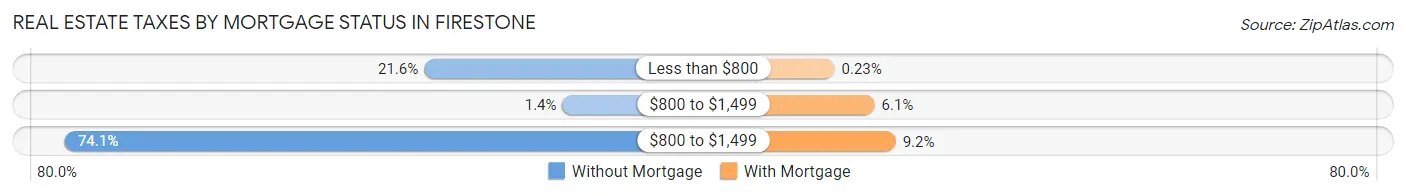
| Property Taxes | Without Mortgage | With Mortgage |
| Less than $800 | 167 (21.6%) | 9 (0.2%) |
| $800 to $1,499 | 11 (1.4%) | 235 (6.1%) |
| $800 to $1,499 | 572 (74.1%) | 355 (9.2%) |
| Total | 772 (100.0%) | 3,874 (100.0%) |
Health & Disability in Firestone
Health Insurance Coverage by Age in Firestone
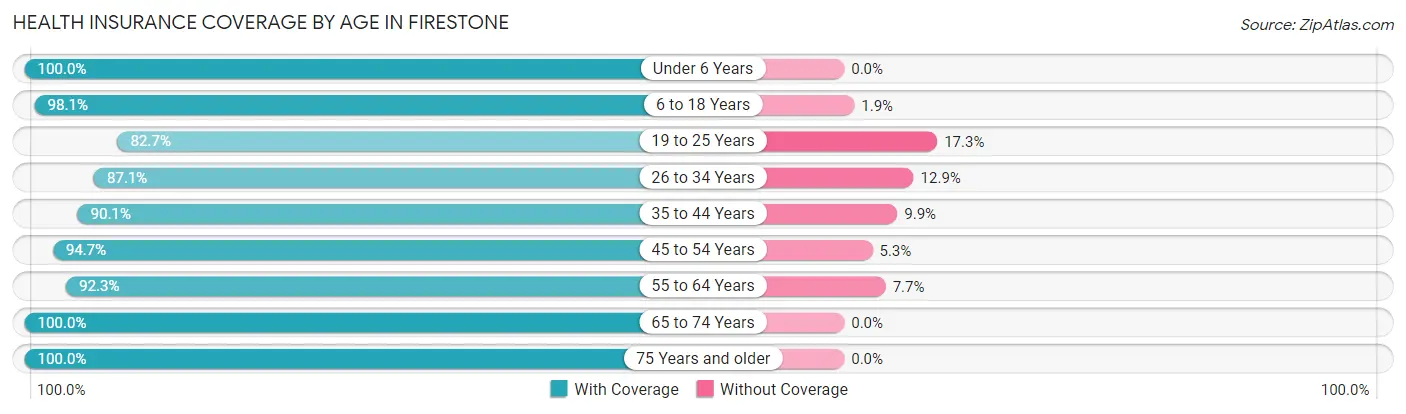
| Age Bracket | With Coverage | Without Coverage |
| Under 6 Years | 1,055 (100.0%) | 0 (0.0%) |
| 6 to 18 Years | 3,294 (98.1%) | 63 (1.9%) |
| 19 to 25 Years | 835 (82.7%) | 175 (17.3%) |
| 26 to 34 Years | 2,417 (87.1%) | 359 (12.9%) |
| 35 to 44 Years | 2,259 (90.1%) | 248 (9.9%) |
| 45 to 54 Years | 2,016 (94.7%) | 112 (5.3%) |
| 55 to 64 Years | 1,814 (92.3%) | 152 (7.7%) |
| 65 to 74 Years | 1,430 (100.0%) | 0 (0.0%) |
| 75 Years and older | 457 (100.0%) | 0 (0.0%) |
| Total | 15,577 (93.3%) | 1,109 (6.7%) |
Health Insurance Coverage by Citizenship Status in Firestone
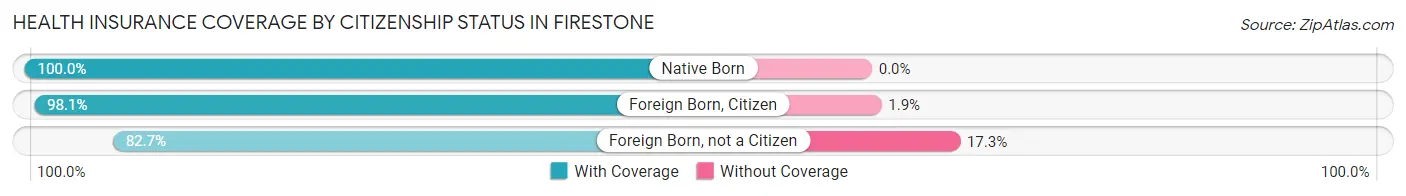
| Citizenship Status | With Coverage | Without Coverage |
| Native Born | 1,055 (100.0%) | 0 (0.0%) |
| Foreign Born, Citizen | 3,294 (98.1%) | 63 (1.9%) |
| Foreign Born, not a Citizen | 835 (82.7%) | 175 (17.3%) |
Health Insurance Coverage by Household Income in Firestone
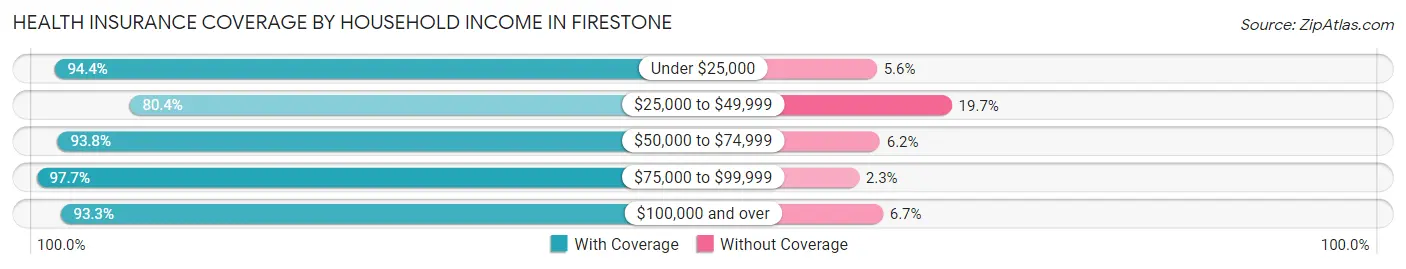
| Household Income | With Coverage | Without Coverage |
| Under $25,000 | 354 (94.4%) | 21 (5.6%) |
| $25,000 to $49,999 | 867 (80.3%) | 212 (19.7%) |
| $50,000 to $74,999 | 1,684 (93.8%) | 111 (6.2%) |
| $75,000 to $99,999 | 3,072 (97.7%) | 71 (2.3%) |
| $100,000 and over | 9,599 (93.3%) | 694 (6.7%) |
Public vs Private Health Insurance Coverage by Age in Firestone
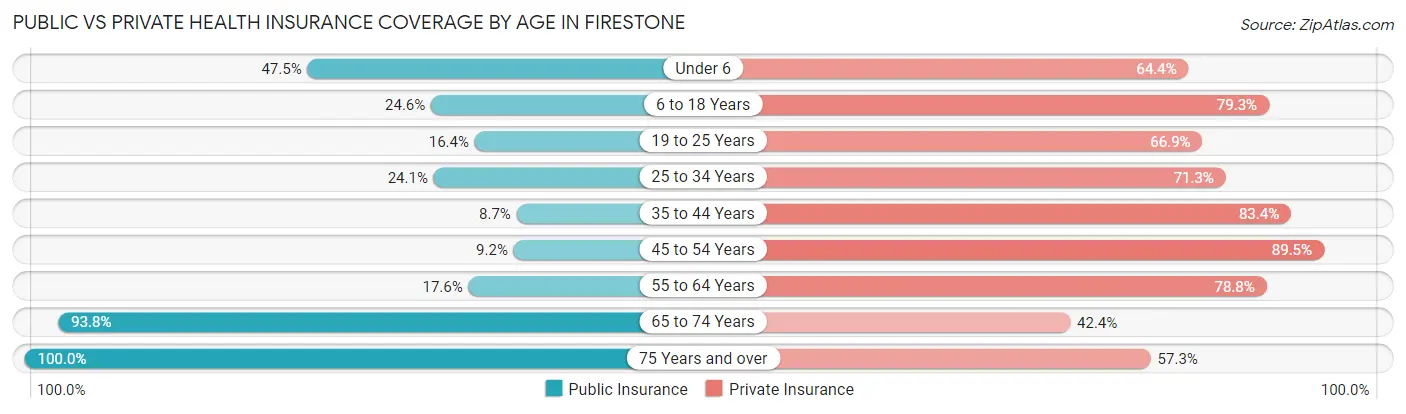
| Age Bracket | Public Insurance | Private Insurance |
| Under 6 | 501 (47.5%) | 679 (64.4%) |
| 6 to 18 Years | 824 (24.5%) | 2,661 (79.3%) |
| 19 to 25 Years | 166 (16.4%) | 676 (66.9%) |
| 25 to 34 Years | 668 (24.1%) | 1,978 (71.3%) |
| 35 to 44 Years | 217 (8.7%) | 2,090 (83.4%) |
| 45 to 54 Years | 196 (9.2%) | 1,904 (89.5%) |
| 55 to 64 Years | 346 (17.6%) | 1,550 (78.8%) |
| 65 to 74 Years | 1,341 (93.8%) | 606 (42.4%) |
| 75 Years and over | 457 (100.0%) | 262 (57.3%) |
| Total | 4,716 (28.3%) | 12,406 (74.4%) |
Disability Status by Sex by Age in Firestone
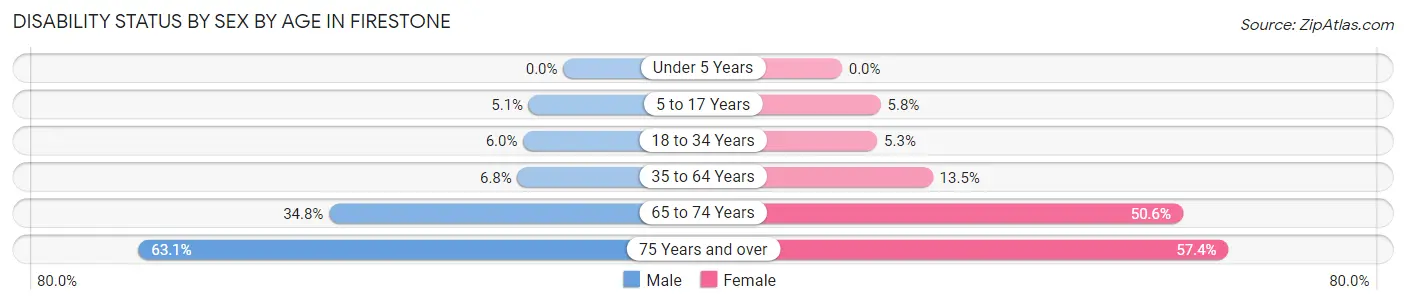
| Age Bracket | Male | Female |
| Under 5 Years | 0 (0.0%) | 0 (0.0%) |
| 5 to 17 Years | 88 (5.1%) | 88 (5.8%) |
| 18 to 34 Years | 128 (5.9%) | 102 (5.2%) |
| 35 to 64 Years | 249 (6.8%) | 396 (13.5%) |
| 65 to 74 Years | 193 (34.8%) | 443 (50.6%) |
| 75 Years and over | 118 (63.1%) | 155 (57.4%) |
Disability Class by Sex by Age in Firestone
Disability Class: Hearing Difficulty
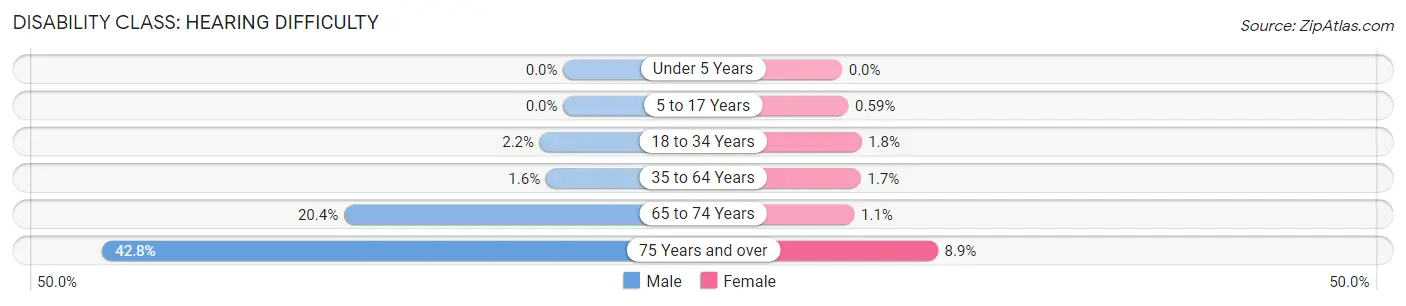
| Age Bracket | Male | Female |
| Under 5 Years | 0 (0.0%) | 0 (0.0%) |
| 5 to 17 Years | 0 (0.0%) | 9 (0.6%) |
| 18 to 34 Years | 47 (2.2%) | 35 (1.8%) |
| 35 to 64 Years | 59 (1.6%) | 51 (1.7%) |
| 65 to 74 Years | 113 (20.4%) | 10 (1.1%) |
| 75 Years and over | 80 (42.8%) | 24 (8.9%) |
Disability Class: Vision Difficulty
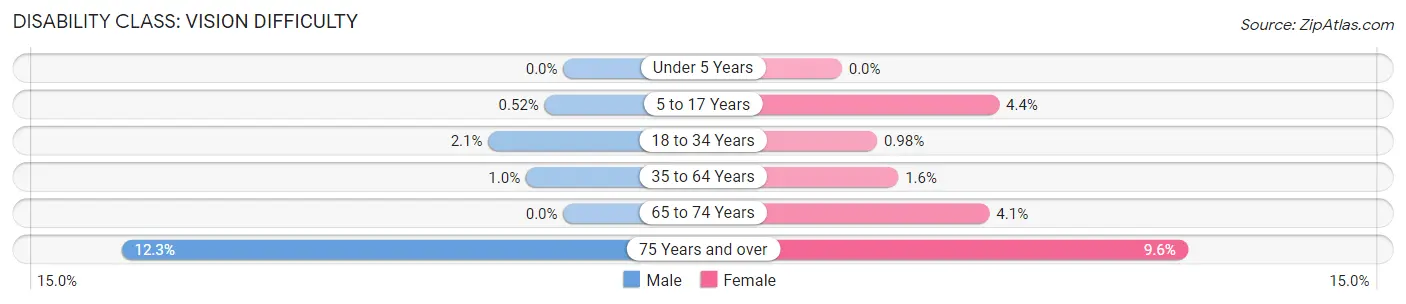
| Age Bracket | Male | Female |
| Under 5 Years | 0 (0.0%) | 0 (0.0%) |
| 5 to 17 Years | 9 (0.5%) | 67 (4.4%) |
| 18 to 34 Years | 45 (2.1%) | 19 (1.0%) |
| 35 to 64 Years | 38 (1.0%) | 46 (1.6%) |
| 65 to 74 Years | 0 (0.0%) | 36 (4.1%) |
| 75 Years and over | 23 (12.3%) | 26 (9.6%) |
Disability Class: Cognitive Difficulty
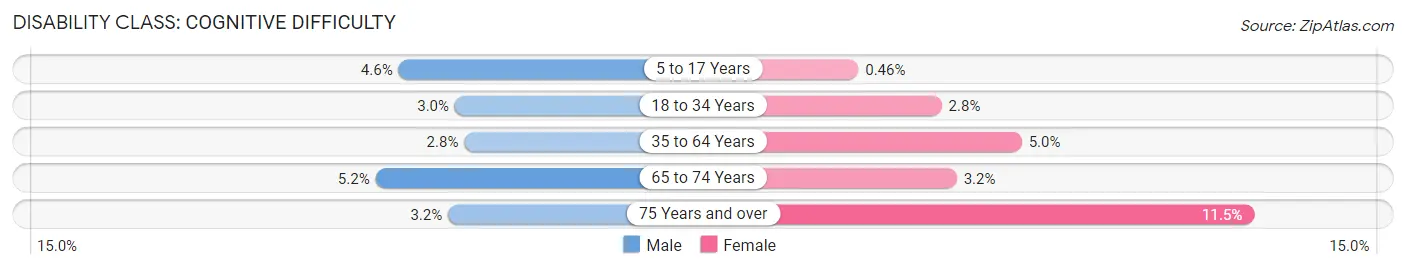
| Age Bracket | Male | Female |
| 5 to 17 Years | 79 (4.6%) | 7 (0.5%) |
| 18 to 34 Years | 65 (3.0%) | 54 (2.8%) |
| 35 to 64 Years | 101 (2.8%) | 147 (5.0%) |
| 65 to 74 Years | 29 (5.2%) | 28 (3.2%) |
| 75 Years and over | 6 (3.2%) | 31 (11.5%) |
Disability Class: Ambulatory Difficulty
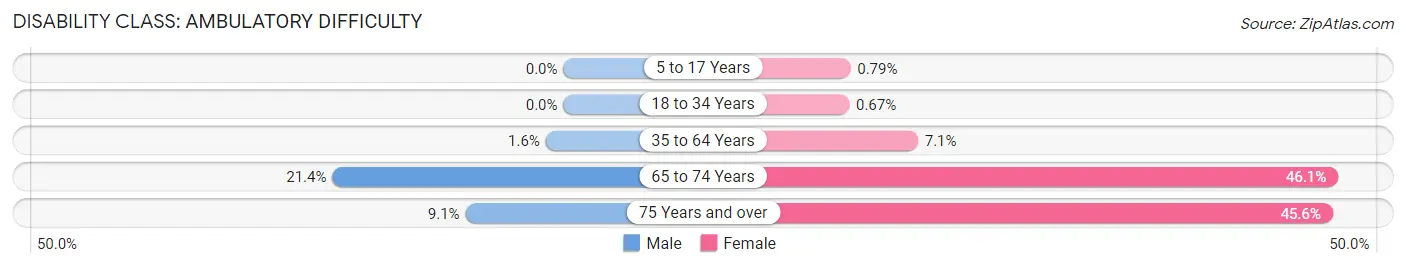
| Age Bracket | Male | Female |
| 5 to 17 Years | 0 (0.0%) | 12 (0.8%) |
| 18 to 34 Years | 0 (0.0%) | 13 (0.7%) |
| 35 to 64 Years | 60 (1.6%) | 207 (7.0%) |
| 65 to 74 Years | 119 (21.4%) | 403 (46.1%) |
| 75 Years and over | 17 (9.1%) | 123 (45.6%) |
Disability Class: Self-Care Difficulty
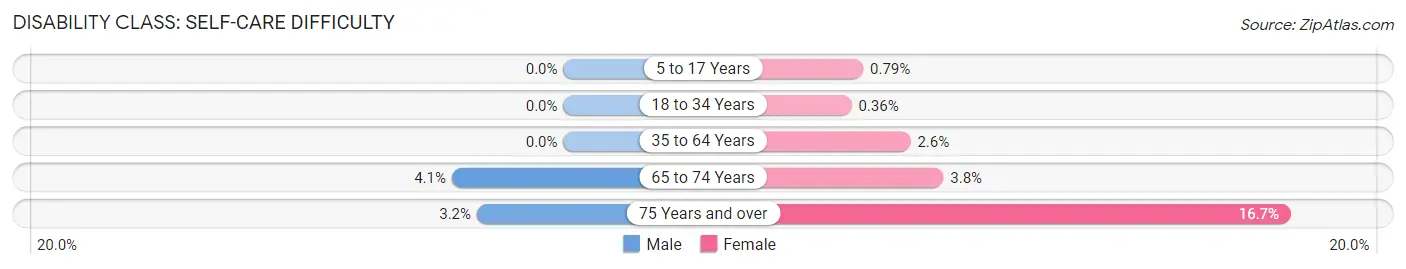
| Age Bracket | Male | Female |
| 5 to 17 Years | 0 (0.0%) | 12 (0.8%) |
| 18 to 34 Years | 0 (0.0%) | 7 (0.4%) |
| 35 to 64 Years | 0 (0.0%) | 75 (2.5%) |
| 65 to 74 Years | 23 (4.1%) | 33 (3.8%) |
| 75 Years and over | 6 (3.2%) | 45 (16.7%) |
Technology Access in Firestone
Computing Device Access in Firestone
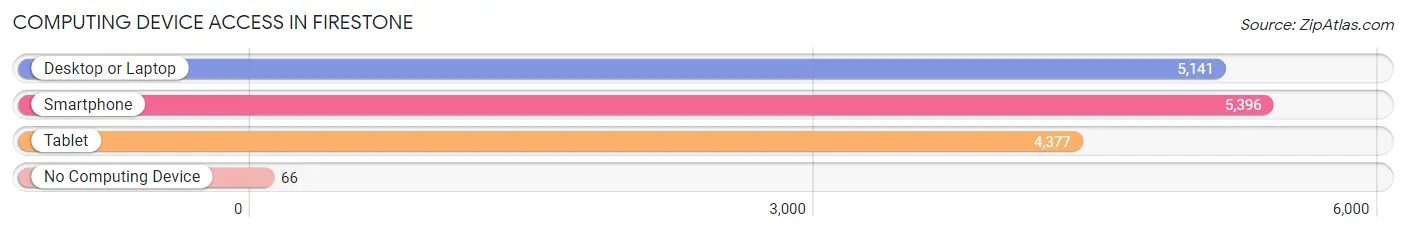
| Device Type | # Households | % Households |
| Desktop or Laptop | 5,141 | 92.2% |
| Smartphone | 5,396 | 96.8% |
| Tablet | 4,377 | 78.5% |
| No Computing Device | 66 | 1.2% |
| Total | 5,576 | 100.0% |
Internet Access in Firestone
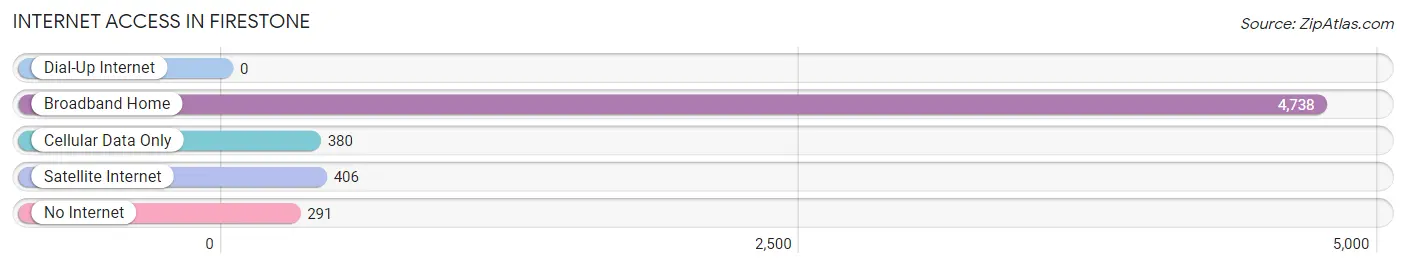
| Internet Type | # Households | % Households |
| Dial-Up Internet | 0 | 0.0% |
| Broadband Home | 4,738 | 85.0% |
| Cellular Data Only | 380 | 6.8% |
| Satellite Internet | 406 | 7.3% |
| No Internet | 291 | 5.2% |
| Total | 5,576 | 100.0% |
Firestone Summary
Firestone, Colorado is a small town located in Weld County, Colorado, United States. It is situated approximately 25 miles north of Denver and is part of the Denver-Aurora-Lakewood Metropolitan Statistical Area. The town was founded in 1902 and incorporated in 1908. As of the 2010 census, the population of Firestone was 10,147.
History
The town of Firestone was founded in 1902 by a group of settlers from Ohio. The settlers named the town after the Firestone Tire and Rubber Company, which had recently opened a factory in Akron, Ohio. The town was officially incorporated in 1908.
In the early years, Firestone was a small agricultural community, with most of the residents working in the local farms and ranches. The town was also home to a number of coal mines, which provided employment for many of the town’s residents.
In the 1950s, Firestone began to experience a period of growth and development. The town was connected to the Denver metropolitan area by the construction of Interstate 25, which allowed for easier access to the city. This led to an influx of new residents and businesses to the area.
In the late 1990s, Firestone experienced a period of rapid growth. This was due to the development of the nearby oil and gas industry, which brought many new jobs to the area. This growth has continued into the present day, with Firestone now being home to a number of businesses and industries.
Geography
Firestone is located in Weld County, Colorado, United States. It is situated approximately 25 miles north of Denver and is part of the Denver-Aurora-Lakewood Metropolitan Statistical Area. The town is located at an elevation of 5,072 feet above sea level.
The town is situated in the foothills of the Rocky Mountains, and is surrounded by rolling hills and open plains. The town is located near the St. Vrain River, which flows through the area.
Economy
Firestone’s economy is largely based on the oil and gas industry. The town is home to a number of oil and gas companies, which provide employment for many of the town’s residents. The town is also home to a number of other businesses, including retail stores, restaurants, and other service-based businesses.
The town is also home to a number of agricultural businesses, including farms and ranches. These businesses provide employment for many of the town’s residents.
Demographics
As of the 2010 census, the population of Firestone was 10,147. The racial makeup of the town was 87.3% White, 4.2% Hispanic or Latino, 2.2% African American, 0.7% Native American, 0.3% Asian, and 4.5% from other races.
The median household income in Firestone was $68,945, and the median family income was $76,945. The per capita income in Firestone was $30,945. The town’s poverty rate was 6.3%.
Conclusion
Firestone, Colorado is a small town located in Weld County, Colorado, United States. It is situated approximately 25 miles north of Denver and is part of the Denver-Aurora-Lakewood Metropolitan Statistical Area. The town was founded in 1902 and incorporated in 1908. As of the 2010 census, the population of Firestone was 10,147. The town’s economy is largely based on the oil and gas industry, and it is also home to a number of agricultural businesses. The racial makeup of the town was 87.3% White, 4.2% Hispanic or Latino, 2.2% African American, 0.7% Native American, 0.3% Asian, and 4.5% from other races. The median household income in Firestone was $68,945, and the median family income was $76,945. The per capita income in Firestone was $30,945. The town’s poverty rate was 6.3%.
Common Questions
What is Per Capita Income in Firestone?
Per Capita income in Firestone is $42,936.
What is the Median Family Income in Firestone?
Median Family Income in Firestone is $113,273.
What is the Median Household income in Firestone?
Median Household Income in Firestone is $106,960.
What is Income or Wage Gap in Firestone?
Income or Wage Gap in Firestone is 43.7%.
Women in Firestone earn 56.3 cents for every dollar earned by a man.
What is Family Income Deficit in Firestone?
Family Income Deficit in Firestone is $7,855.
Families that are below poverty line in Firestone earn $7,855 less on average than the poverty threshold level.
What is Inequality or Gini Index in Firestone?
Inequality or Gini Index in Firestone is 0.32.
What is the Total Population of Firestone?
Total Population of Firestone is 16,704.
What is the Total Male Population of Firestone?
Total Male Population of Firestone is 8,742.
What is the Total Female Population of Firestone?
Total Female Population of Firestone is 7,962.
What is the Ratio of Males per 100 Females in Firestone?
There are 109.80 Males per 100 Females in Firestone.
What is the Ratio of Females per 100 Males in Firestone?
There are 91.08 Females per 100 Males in Firestone.
What is the Median Population Age in Firestone?
Median Population Age in Firestone is 35.6 Years.
What is the Average Family Size in Firestone
Average Family Size in Firestone is 3.4 People.
What is the Average Household Size in Firestone
Average Household Size in Firestone is 3.0 People.
How Large is the Labor Force in Firestone?
There are 9,716 People in the Labor Forcein in Firestone.
What is the Percentage of People in the Labor Force in Firestone?
74.2% of People are in the Labor Force in Firestone.
What is the Unemployment Rate in Firestone?
Unemployment Rate in Firestone is 3.8%.