Zip Codes with the Highest Percentage of Population Employed in Computer & Mathematics in Brighton, CO
RELATED REPORTS & OPTIONS
Computer & Mathematics
Brighton
Compare Zip Codes
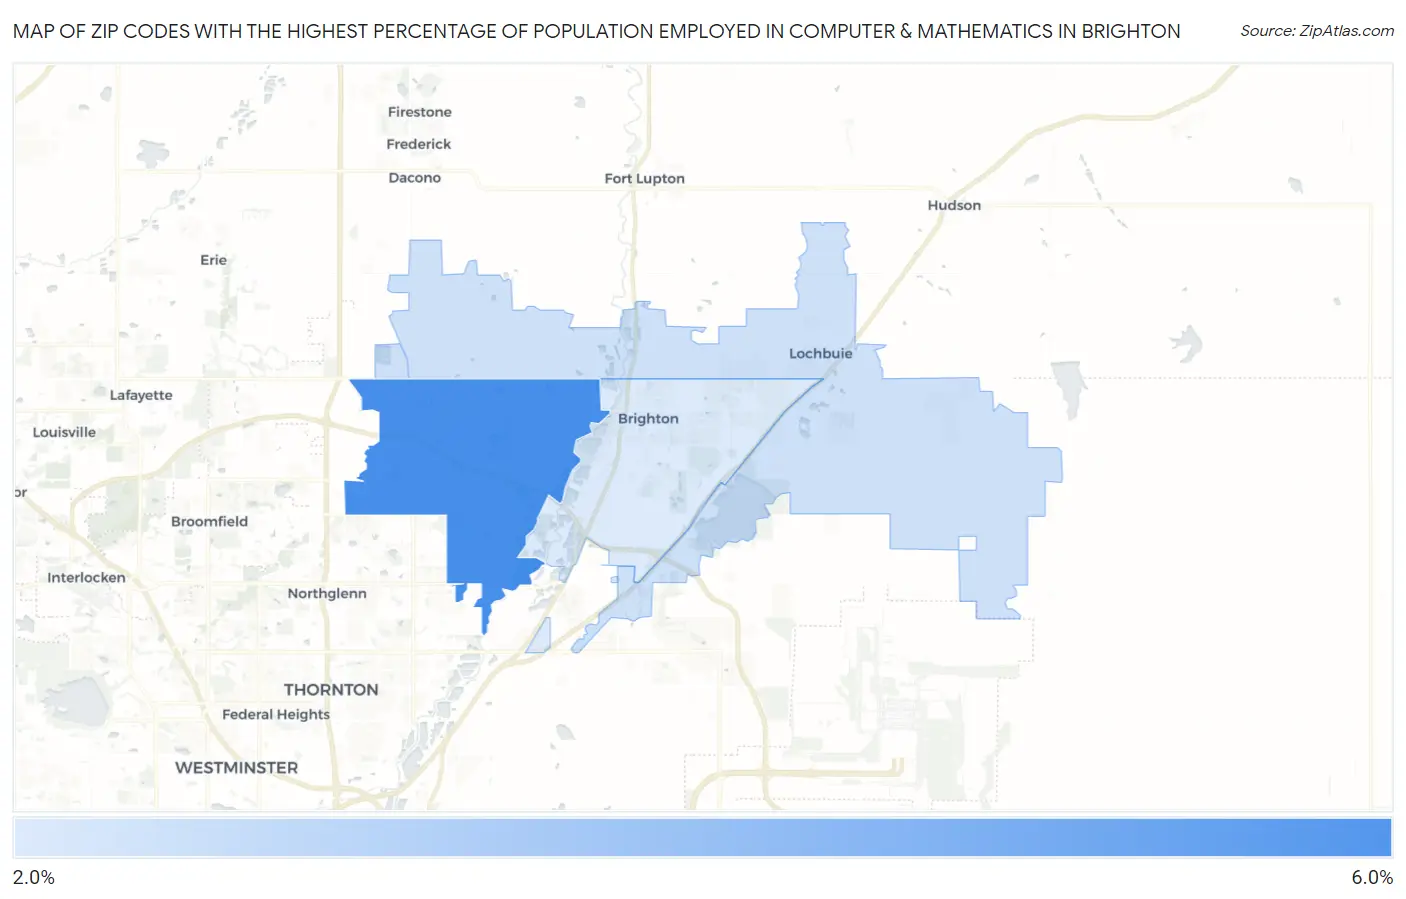
Map of Zip Codes with the Highest Percentage of Population Employed in Computer & Mathematics in Brighton
2.0%
5.3%
Zip Codes with the Highest Percentage of Population Employed in Computer & Mathematics in Brighton, CO
| Zip Code | % Employed | vs State | vs National | |
| 1. | 80602 | 5.3% | 4.8%(+0.497)#104 | 3.5%(+1.73)#3,071 |
| 2. | 80603 | 2.4% | 4.8%(-2.41)#223 | 3.5%(-1.17)#10,221 |
| 3. | 80601 | 2.0% | 4.8%(-2.72)#242 | 3.5%(-1.49)#11,637 |
1
Common Questions
What are the Top Zip Codes with the Highest Percentage of Population Employed in Computer & Mathematics in Brighton, CO?
Top Zip Codes with the Highest Percentage of Population Employed in Computer & Mathematics in Brighton, CO are:
What zip code has the Highest Percentage of Population Employed in Computer & Mathematics in Brighton, CO?
80602 has the Highest Percentage of Population Employed in Computer & Mathematics in Brighton, CO with 5.3%.
What is the Percentage of Population Employed in Computer & Mathematics in Brighton, CO?
Percentage of Population Employed in Computer & Mathematics in Brighton is 2.2%.
What is the Percentage of Population Employed in Computer & Mathematics in Colorado?
Percentage of Population Employed in Computer & Mathematics in Colorado is 4.8%.
What is the Percentage of Population Employed in Computer & Mathematics in the United States?
Percentage of Population Employed in Computer & Mathematics in the United States is 3.5%.