Zip Codes with the Highest Percentage of Population Employed in Computer & Mathematics in Broomfield, CO
RELATED REPORTS & OPTIONS
Computer & Mathematics
Broomfield
Compare Zip Codes
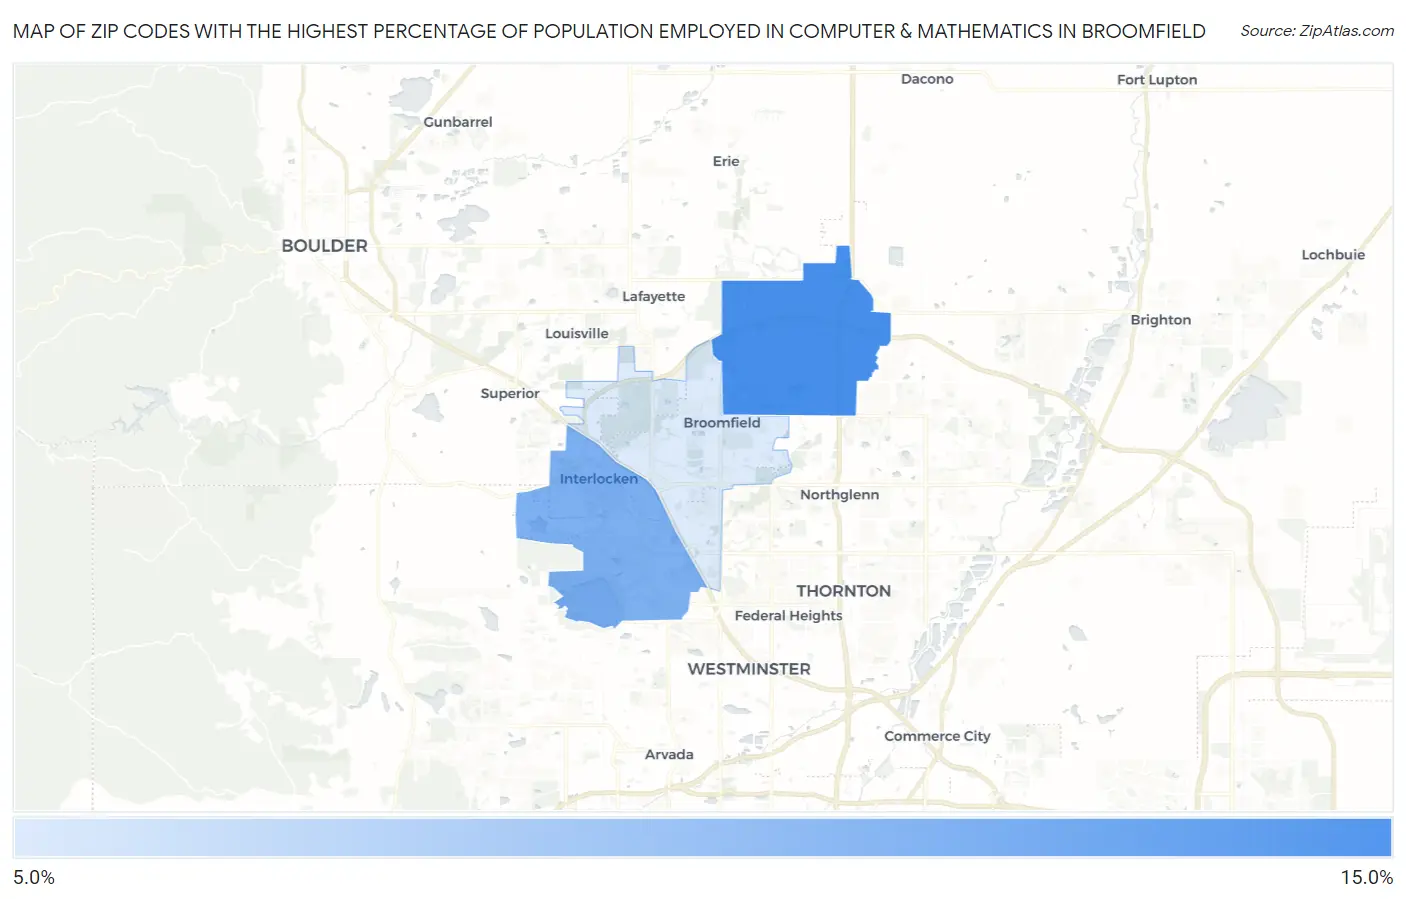
Map of Zip Codes with the Highest Percentage of Population Employed in Computer & Mathematics in Broomfield
7.2%
10.2%
Zip Codes with the Highest Percentage of Population Employed in Computer & Mathematics in Broomfield, CO
| Zip Code | % Employed | vs State | vs National | |
| 1. | 80023 | 10.2% | 4.8%(+5.47)#18 | 3.5%(+6.70)#672 |
| 2. | 80021 | 9.2% | 4.8%(+4.40)#31 | 3.5%(+5.63)#866 |
| 3. | 80020 | 7.2% | 4.8%(+2.41)#56 | 3.5%(+3.64)#1,534 |
1
Common Questions
What are the Top Zip Codes with the Highest Percentage of Population Employed in Computer & Mathematics in Broomfield, CO?
Top Zip Codes with the Highest Percentage of Population Employed in Computer & Mathematics in Broomfield, CO are:
What zip code has the Highest Percentage of Population Employed in Computer & Mathematics in Broomfield, CO?
80023 has the Highest Percentage of Population Employed in Computer & Mathematics in Broomfield, CO with 10.2%.
What is the Percentage of Population Employed in Computer & Mathematics in Broomfield, CO?
Percentage of Population Employed in Computer & Mathematics in Broomfield is 8.7%.
What is the Percentage of Population Employed in Computer & Mathematics in Colorado?
Percentage of Population Employed in Computer & Mathematics in Colorado is 4.8%.
What is the Percentage of Population Employed in Computer & Mathematics in the United States?
Percentage of Population Employed in Computer & Mathematics in the United States is 3.5%.