Zip Codes with the Highest Percentage of Population Employed in Computer & Mathematics in Colorado
RELATED REPORTS & OPTIONS
Computer & Mathematics
Colorado
Compare Zip Codes
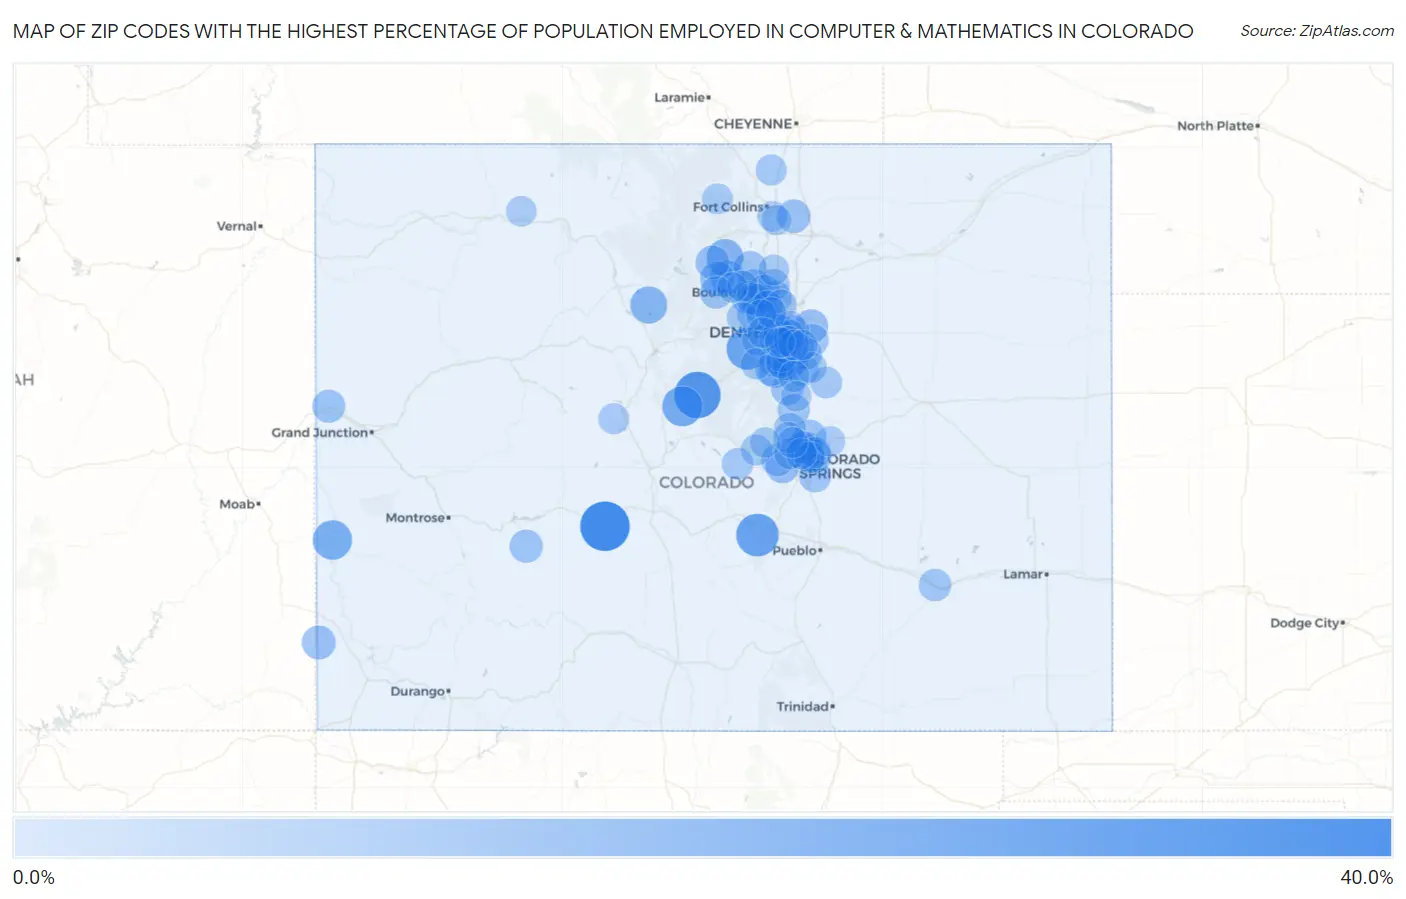
Map of Zip Codes with the Highest Percentage of Population Employed in Computer & Mathematics in Colorado
0.0%
40.0%
Zip Codes with the Highest Percentage of Population Employed in Computer & Mathematics in Colorado
| Zip Code | % Employed | vs State | vs National | |
| 1. | 81248 | 36.4% | 4.8%(+31.7)#1 | 3.5%(+32.9)#28 |
| 2. | 80456 | 31.0% | 4.8%(+26.3)#2 | 3.5%(+27.5)#45 |
| 3. | 81244 | 25.0% | 4.8%(+20.2)#3 | 3.5%(+21.5)#77 |
| 4. | 80454 | 23.9% | 4.8%(+19.2)#4 | 3.5%(+20.4)#86 |
| 5. | 80432 | 20.9% | 4.8%(+16.2)#5 | 3.5%(+17.4)#116 |
| 6. | 81429 | 19.5% | 4.8%(+14.8)#6 | 3.5%(+16.0)#136 |
| 7. | 80468 | 16.0% | 4.8%(+11.2)#7 | 3.5%(+12.4)#219 |
| 8. | 80540 | 15.6% | 4.8%(+10.9)#8 | 3.5%(+12.1)#226 |
| 9. | 80455 | 12.2% | 4.8%(+7.43)#9 | 3.5%(+8.66)#425 |
| 10. | 80481 | 12.0% | 4.8%(+7.26)#10 | 3.5%(+8.49)#438 |
| 11. | 80301 | 10.9% | 4.8%(+6.17)#11 | 3.5%(+7.40)#565 |
| 12. | 81324 | 10.9% | 4.8%(+6.15)#12 | 3.5%(+7.38)#569 |
| 13. | 80510 | 10.8% | 4.8%(+6.09)#13 | 3.5%(+7.32)#580 |
| 14. | 80829 | 10.8% | 4.8%(+6.08)#14 | 3.5%(+7.31)#581 |
| 15. | 80019 | 10.7% | 4.8%(+5.95)#15 | 3.5%(+7.18)#603 |
| 16. | 80546 | 10.6% | 4.8%(+5.84)#16 | 3.5%(+7.07)#615 |
| 17. | 80202 | 10.3% | 4.8%(+5.51)#17 | 3.5%(+6.74)#666 |
| 18. | 80023 | 10.2% | 4.8%(+5.47)#18 | 3.5%(+6.70)#672 |
| 19. | 80131 | 10.1% | 4.8%(+5.39)#19 | 3.5%(+6.62)#682 |
| 20. | 80923 | 10.0% | 4.8%(+5.21)#20 | 3.5%(+6.44)#716 |
| 21. | 81243 | 9.8% | 4.8%(+5.08)#21 | 3.5%(+6.31)#734 |
| 22. | 80305 | 9.7% | 4.8%(+4.90)#22 | 3.5%(+6.14)#762 |
| 23. | 80007 | 9.6% | 4.8%(+4.85)#23 | 3.5%(+6.09)#770 |
| 24. | 81525 | 9.6% | 4.8%(+4.85)#24 | 3.5%(+6.08)#772 |
| 25. | 80938 | 9.6% | 4.8%(+4.84)#25 | 3.5%(+6.07)#777 |
| 26. | 80503 | 9.5% | 4.8%(+4.73)#26 | 3.5%(+5.96)#800 |
| 27. | 80908 | 9.5% | 4.8%(+4.73)#27 | 3.5%(+5.96)#805 |
| 28. | 80124 | 9.4% | 4.8%(+4.64)#28 | 3.5%(+5.87)#814 |
| 29. | 80809 | 9.3% | 4.8%(+4.53)#29 | 3.5%(+5.76)#840 |
| 30. | 80109 | 9.2% | 4.8%(+4.44)#30 | 3.5%(+5.67)#852 |
| 31. | 80021 | 9.2% | 4.8%(+4.40)#31 | 3.5%(+5.63)#866 |
| 32. | 80112 | 9.1% | 4.8%(+4.37)#32 | 3.5%(+5.60)#873 |
| 33. | 80130 | 9.1% | 4.8%(+4.36)#33 | 3.5%(+5.59)#881 |
| 34. | 80026 | 8.9% | 4.8%(+4.15)#34 | 3.5%(+5.38)#922 |
| 35. | 80924 | 8.8% | 4.8%(+4.07)#35 | 3.5%(+5.30)#946 |
| 36. | 80466 | 8.8% | 4.8%(+4.03)#36 | 3.5%(+5.26)#959 |
| 37. | 80920 | 8.7% | 4.8%(+3.97)#37 | 3.5%(+5.20)#980 |
| 38. | 80027 | 8.7% | 4.8%(+3.90)#38 | 3.5%(+5.14)#1,005 |
| 39. | 80134 | 8.6% | 4.8%(+3.85)#39 | 3.5%(+5.09)#1,020 |
| 40. | 81077 | 8.6% | 4.8%(+3.81)#40 | 3.5%(+5.04)#1,033 |
| 41. | 80203 | 8.4% | 4.8%(+3.62)#41 | 3.5%(+4.85)#1,088 |
| 42. | 80118 | 8.3% | 4.8%(+3.58)#42 | 3.5%(+4.81)#1,099 |
| 43. | 80111 | 8.3% | 4.8%(+3.56)#43 | 3.5%(+4.79)#1,114 |
| 44. | 80925 | 8.3% | 4.8%(+3.52)#44 | 3.5%(+4.75)#1,126 |
| 45. | 80303 | 8.2% | 4.8%(+3.49)#45 | 3.5%(+4.72)#1,138 |
| 46. | 80129 | 8.2% | 4.8%(+3.44)#46 | 3.5%(+4.67)#1,150 |
| 47. | 80018 | 8.2% | 4.8%(+3.40)#47 | 3.5%(+4.63)#1,164 |
| 48. | 80125 | 7.9% | 4.8%(+3.17)#48 | 3.5%(+4.41)#1,226 |
| 49. | 80016 | 7.8% | 4.8%(+3.00)#49 | 3.5%(+4.23)#1,299 |
| 50. | 80132 | 7.7% | 4.8%(+2.93)#50 | 3.5%(+4.16)#1,323 |
| 51. | 80211 | 7.6% | 4.8%(+2.88)#51 | 3.5%(+4.12)#1,337 |
| 52. | 80516 | 7.6% | 4.8%(+2.85)#52 | 3.5%(+4.08)#1,351 |
| 53. | 80209 | 7.4% | 4.8%(+2.68)#53 | 3.5%(+3.91)#1,413 |
| 54. | 80107 | 7.3% | 4.8%(+2.59)#54 | 3.5%(+3.82)#1,443 |
| 55. | 80237 | 7.3% | 4.8%(+2.56)#55 | 3.5%(+3.80)#1,454 |
| 56. | 80020 | 7.2% | 4.8%(+2.41)#56 | 3.5%(+3.64)#1,534 |
| 57. | 80816 | 7.1% | 4.8%(+2.38)#57 | 3.5%(+3.61)#1,552 |
| 58. | 80205 | 7.0% | 4.8%(+2.29)#58 | 3.5%(+3.52)#1,599 |
| 59. | 80919 | 7.0% | 4.8%(+2.22)#59 | 3.5%(+3.46)#1,631 |
| 60. | 80228 | 6.9% | 4.8%(+2.12)#60 | 3.5%(+3.35)#1,690 |
| 61. | 80045 | 6.9% | 4.8%(+2.12)#61 | 3.5%(+3.35)#1,697 |
| 62. | 80814 | 6.9% | 4.8%(+2.10)#62 | 3.5%(+3.33)#1,708 |
| 63. | 80403 | 6.8% | 4.8%(+2.07)#63 | 3.5%(+3.30)#1,723 |
| 64. | 80015 | 6.8% | 4.8%(+2.07)#64 | 3.5%(+3.30)#1,724 |
| 65. | 80218 | 6.8% | 4.8%(+2.02)#65 | 3.5%(+3.25)#1,748 |
| 66. | 80122 | 6.8% | 4.8%(+2.02)#66 | 3.5%(+3.25)#1,749 |
| 67. | 80127 | 6.7% | 4.8%(+1.99)#67 | 3.5%(+3.22)#1,766 |
| 68. | 80223 | 6.7% | 4.8%(+1.98)#68 | 3.5%(+3.21)#1,768 |
| 69. | 80304 | 6.7% | 4.8%(+1.97)#69 | 3.5%(+3.21)#1,773 |
| 70. | 80230 | 6.7% | 4.8%(+1.96)#70 | 3.5%(+3.19)#1,783 |
| 71. | 80921 | 6.7% | 4.8%(+1.93)#71 | 3.5%(+3.16)#1,805 |
| 72. | 80126 | 6.6% | 4.8%(+1.89)#72 | 3.5%(+3.12)#1,835 |
| 73. | 80927 | 6.6% | 4.8%(+1.85)#73 | 3.5%(+3.09)#1,850 |
| 74. | 80922 | 6.6% | 4.8%(+1.85)#74 | 3.5%(+3.08)#1,858 |
| 75. | 80549 | 6.4% | 4.8%(+1.64)#75 | 3.5%(+2.87)#2,005 |
| 76. | 80138 | 6.4% | 4.8%(+1.63)#76 | 3.5%(+2.86)#2,014 |
| 77. | 80108 | 6.4% | 4.8%(+1.62)#77 | 3.5%(+2.85)#2,023 |
| 78. | 80241 | 6.4% | 4.8%(+1.61)#78 | 3.5%(+2.84)#2,033 |
| 79. | 80918 | 6.4% | 4.8%(+1.60)#79 | 3.5%(+2.83)#2,038 |
| 80. | 80840 | 6.4% | 4.8%(+1.60)#80 | 3.5%(+2.83)#2,039 |
| 81. | 80005 | 6.3% | 4.8%(+1.50)#81 | 3.5%(+2.73)#2,108 |
| 82. | 80224 | 6.2% | 4.8%(+1.43)#82 | 3.5%(+2.67)#2,151 |
| 83. | 81251 | 6.2% | 4.8%(+1.40)#83 | 3.5%(+2.63)#2,180 |
| 84. | 80238 | 6.1% | 4.8%(+1.34)#84 | 3.5%(+2.58)#2,227 |
| 85. | 80504 | 6.0% | 4.8%(+1.29)#85 | 3.5%(+2.52)#2,278 |
| 86. | 80222 | 5.9% | 4.8%(+1.11)#86 | 3.5%(+2.34)#2,443 |
| 87. | 80512 | 5.8% | 4.8%(+1.09)#87 | 3.5%(+2.32)#2,458 |
| 88. | 80231 | 5.8% | 4.8%(+1.07)#88 | 3.5%(+2.30)#2,480 |
| 89. | 80014 | 5.8% | 4.8%(+1.03)#89 | 3.5%(+2.26)#2,509 |
| 90. | 80031 | 5.8% | 4.8%(+1.03)#90 | 3.5%(+2.26)#2,511 |
| 91. | 80525 | 5.6% | 4.8%(+0.891)#91 | 3.5%(+2.12)#2,639 |
| 92. | 80302 | 5.6% | 4.8%(+0.825)#92 | 3.5%(+2.06)#2,698 |
| 93. | 80863 | 5.5% | 4.8%(+0.789)#93 | 3.5%(+2.02)#2,735 |
| 94. | 81639 | 5.5% | 4.8%(+0.776)#94 | 3.5%(+2.01)#2,748 |
| 95. | 80528 | 5.5% | 4.8%(+0.763)#95 | 3.5%(+1.99)#2,759 |
| 96. | 80013 | 5.4% | 4.8%(+0.650)#96 | 3.5%(+1.88)#2,889 |
| 97. | 80215 | 5.4% | 4.8%(+0.647)#97 | 3.5%(+1.88)#2,895 |
| 98. | 80104 | 5.4% | 4.8%(+0.622)#98 | 3.5%(+1.85)#2,915 |
| 99. | 80831 | 5.4% | 4.8%(+0.615)#99 | 3.5%(+1.85)#2,931 |
| 100. | 80210 | 5.3% | 4.8%(+0.555)#100 | 3.5%(+1.79)#2,990 |
Common Questions
What are the Top 10 Zip Codes with the Highest Percentage of Population Employed in Computer & Mathematics in Colorado?
Top 10 Zip Codes with the Highest Percentage of Population Employed in Computer & Mathematics in Colorado are:
What zip code has the Highest Percentage of Population Employed in Computer & Mathematics in Colorado?
81248 has the Highest Percentage of Population Employed in Computer & Mathematics in Colorado with 36.4%.
What is the Percentage of Population Employed in Computer & Mathematics in the State of Colorado?
Percentage of Population Employed in Computer & Mathematics in Colorado is 4.8%.
What is the Percentage of Population Employed in Computer & Mathematics in the United States?
Percentage of Population Employed in Computer & Mathematics in the United States is 3.5%.