Tabernash, CO Map & Demographics
Tabernash Map
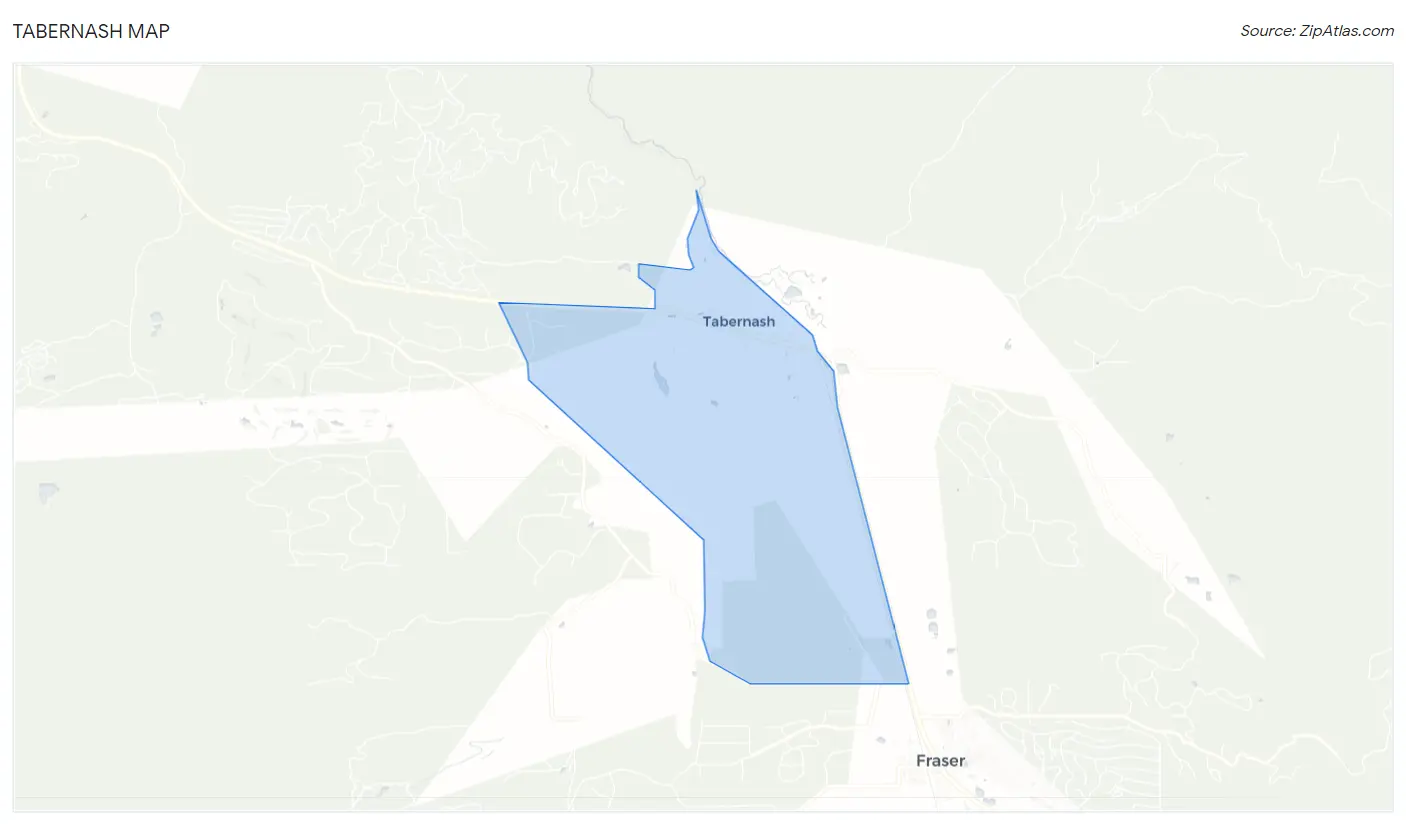
Tabernash Overview
$34,428
PER CAPITA INCOME
$104,335
AVG HOUSEHOLD INCOME
10.7%
WAGE / INCOME GAP [ % ]
89.3¢/ $1
WAGE / INCOME GAP [ $ ]
0.23
INEQUALITY / GINI INDEX
791
TOTAL POPULATION
530
MALE POPULATION
261
FEMALE POPULATION
203.07
MALES / 100 FEMALES
49.25
FEMALES / 100 MALES
45.3
MEDIAN AGE
4.2
AVG FAMILY SIZE
3.8
AVG HOUSEHOLD SIZE
493
LABOR FORCE [ PEOPLE ]
68.8%
PERCENT IN LABOR FORCE
4.7%
UNEMPLOYMENT RATE
Tabernash Zip Codes
Tabernash Area Codes
Income in Tabernash
Income Overview in Tabernash
| Characteristic | Number | Measure |
| Per Capita Income | 791 | $34,428 |
| Median Family Income | 89 | $0 |
| Mean Family Income | 89 | $103,692 |
| Median Household Income | 209 | $104,335 |
| Mean Household Income | 209 | $97,123 |
| Income Deficit | 89 | $0 |
| Wage / Income Gap (%) | 791 | 10.74% |
| Wage / Income Gap ($) | 791 | 89.26¢ per $1 |
| Gini / Inequality Index | 791 | 0.23 |
Earnings by Sex in Tabernash
Average Earnings in Tabernash are $44,276, $45,620 for men and $40,721 for women, a difference of 10.7%.
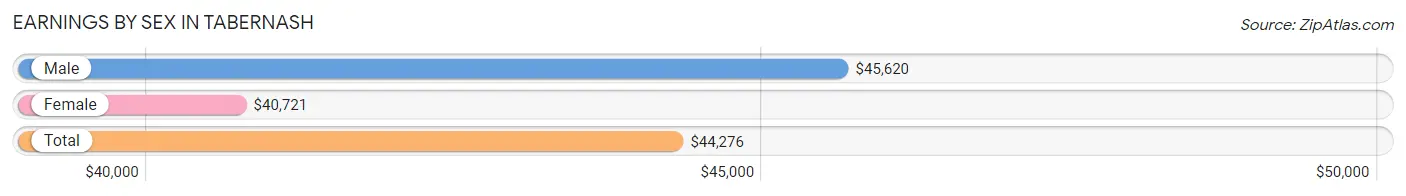
| Sex | Number | Average Earnings |
| Male | 414 (75.7%) | $45,620 |
| Female | 133 (24.3%) | $40,721 |
| Total | 547 (100.0%) | $44,276 |
Earnings by Sex by Income Bracket in Tabernash
The most common earnings brackets in Tabernash are $45,000 to $49,999 for men (129 | 31.2%) and $40,000 to $44,999 for women (45 | 33.8%).
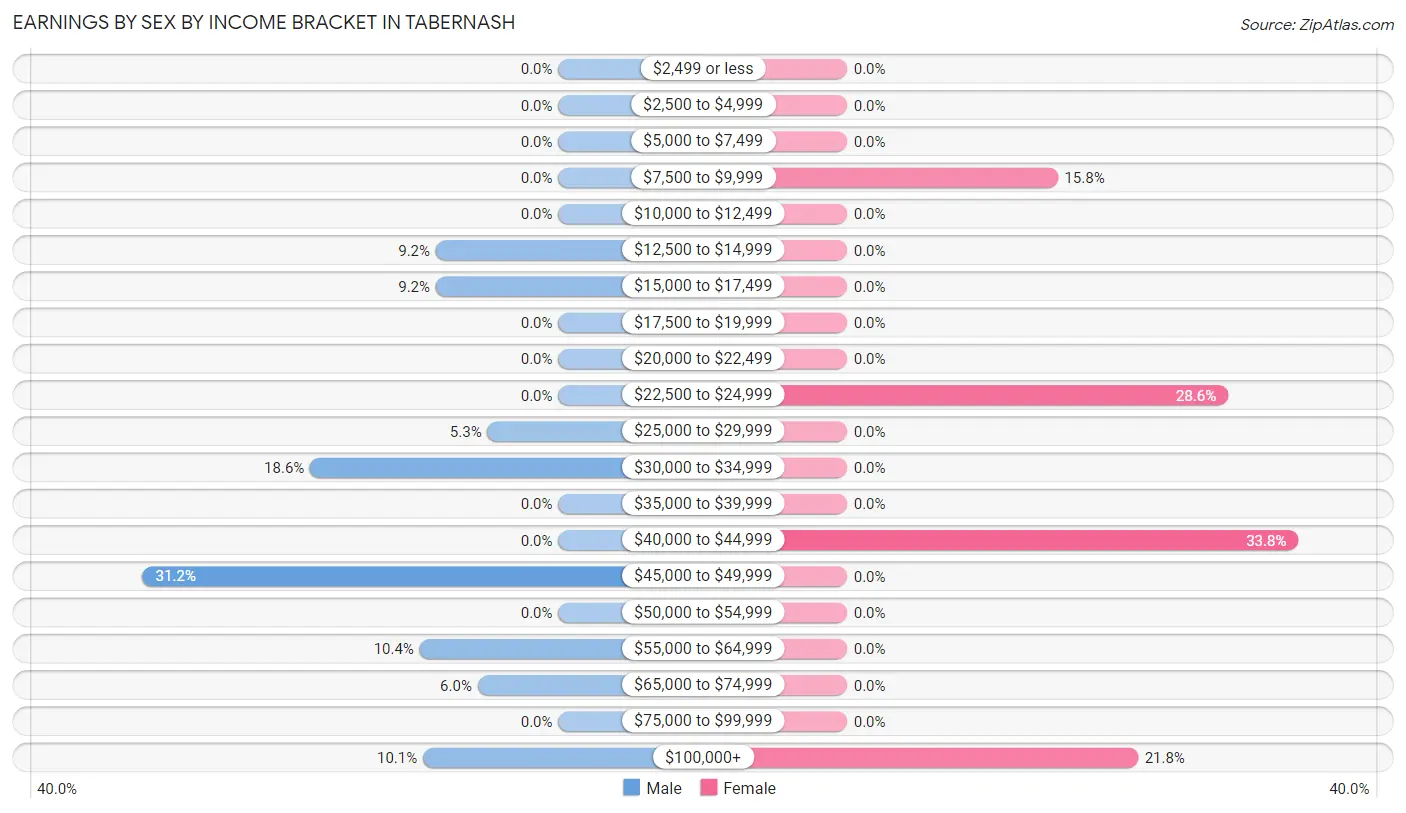
| Income | Male | Female |
| $2,499 or less | 0 (0.0%) | 0 (0.0%) |
| $2,500 to $4,999 | 0 (0.0%) | 0 (0.0%) |
| $5,000 to $7,499 | 0 (0.0%) | 0 (0.0%) |
| $7,500 to $9,999 | 0 (0.0%) | 21 (15.8%) |
| $10,000 to $12,499 | 0 (0.0%) | 0 (0.0%) |
| $12,500 to $14,999 | 38 (9.2%) | 0 (0.0%) |
| $15,000 to $17,499 | 38 (9.2%) | 0 (0.0%) |
| $17,500 to $19,999 | 0 (0.0%) | 0 (0.0%) |
| $20,000 to $22,499 | 0 (0.0%) | 0 (0.0%) |
| $22,500 to $24,999 | 0 (0.0%) | 38 (28.6%) |
| $25,000 to $29,999 | 22 (5.3%) | 0 (0.0%) |
| $30,000 to $34,999 | 77 (18.6%) | 0 (0.0%) |
| $35,000 to $39,999 | 0 (0.0%) | 0 (0.0%) |
| $40,000 to $44,999 | 0 (0.0%) | 45 (33.8%) |
| $45,000 to $49,999 | 129 (31.2%) | 0 (0.0%) |
| $50,000 to $54,999 | 0 (0.0%) | 0 (0.0%) |
| $55,000 to $64,999 | 43 (10.4%) | 0 (0.0%) |
| $65,000 to $74,999 | 25 (6.0%) | 0 (0.0%) |
| $75,000 to $99,999 | 0 (0.0%) | 0 (0.0%) |
| $100,000+ | 42 (10.1%) | 29 (21.8%) |
| Total | 414 (100.0%) | 133 (100.0%) |
Earnings by Sex by Educational Attainment in Tabernash
| Educational Attainment | Male Income | Female Income |
| Less than High School | - | - |
| High School Diploma | - | - |
| College or Associate's Degree | - | - |
| Bachelor's Degree | - | - |
| Graduate Degree | - | - |
| Total | $46,357 | $40,721 |
Family Income in Tabernash
Family Income Brackets in Tabernash
According to the Tabernash family income data, there are 47 families falling into the $50,000 to $74,999 income range, which is the most common income bracket and makes up 52.8% of all families.
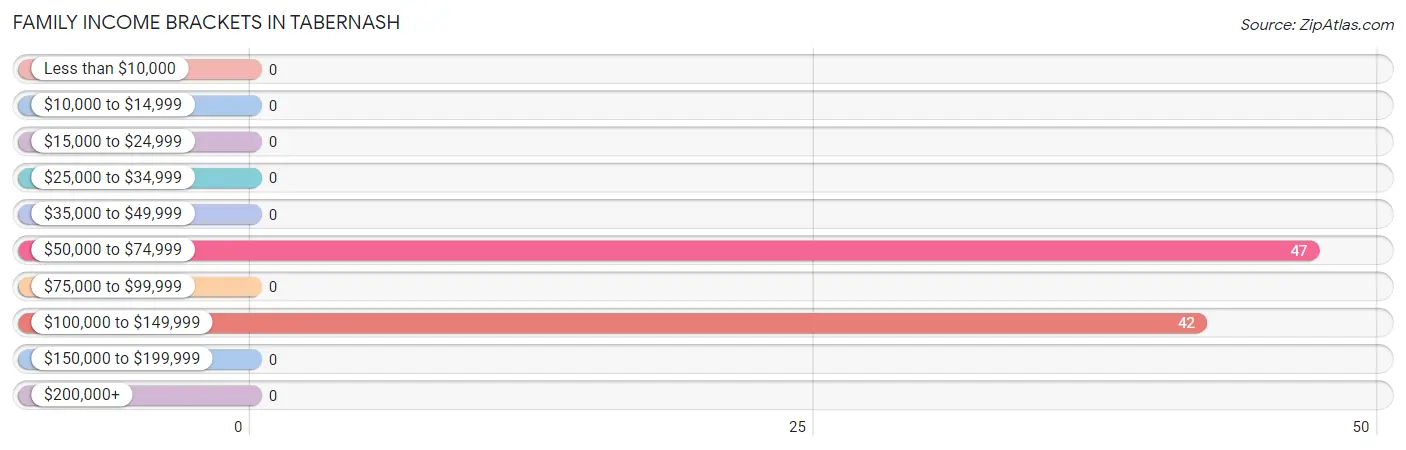
| Income Bracket | # Families | % Families |
| Less than $10,000 | 0 | 0.0% |
| $10,000 to $14,999 | 0 | 0.0% |
| $15,000 to $24,999 | 0 | 0.0% |
| $25,000 to $34,999 | 0 | 0.0% |
| $35,000 to $49,999 | 0 | 0.0% |
| $50,000 to $74,999 | 47 | 52.8% |
| $75,000 to $99,999 | 0 | 0.0% |
| $100,000 to $149,999 | 42 | 47.2% |
| $150,000 to $199,999 | 0 | 0.0% |
| $200,000+ | 0 | 0.0% |
Family Income by Famaliy Size in Tabernash

| Income Bracket | # Families | Median Income |
| 2-Person Families | 26 (29.2%) | $0 |
| 3-Person Families | 21 (23.6%) | $0 |
| 4-Person Families | 42 (47.2%) | $0 |
| 5-Person Families | 0 (0.0%) | $0 |
| 6-Person Families | 0 (0.0%) | $0 |
| 7+ Person Families | 0 (0.0%) | $0 |
| Total | 89 (100.0%) | $0 |
Family Income by Number of Earners in Tabernash
| Number of Earners | # Families | Median Income |
| No Earners | 0 (0.0%) | $0 |
| 1 Earner | 0 (0.0%) | $0 |
| 2 Earners | 89 (100.0%) | $0 |
| 3+ Earners | 0 (0.0%) | $0 |
| Total | 89 (100.0%) | $0 |
Household Income in Tabernash
Household Income Brackets in Tabernash
With 139 households falling in the category, the $100,000 to $149,999 income range is the most frequent in Tabernash, accounting for 66.5% of all households.
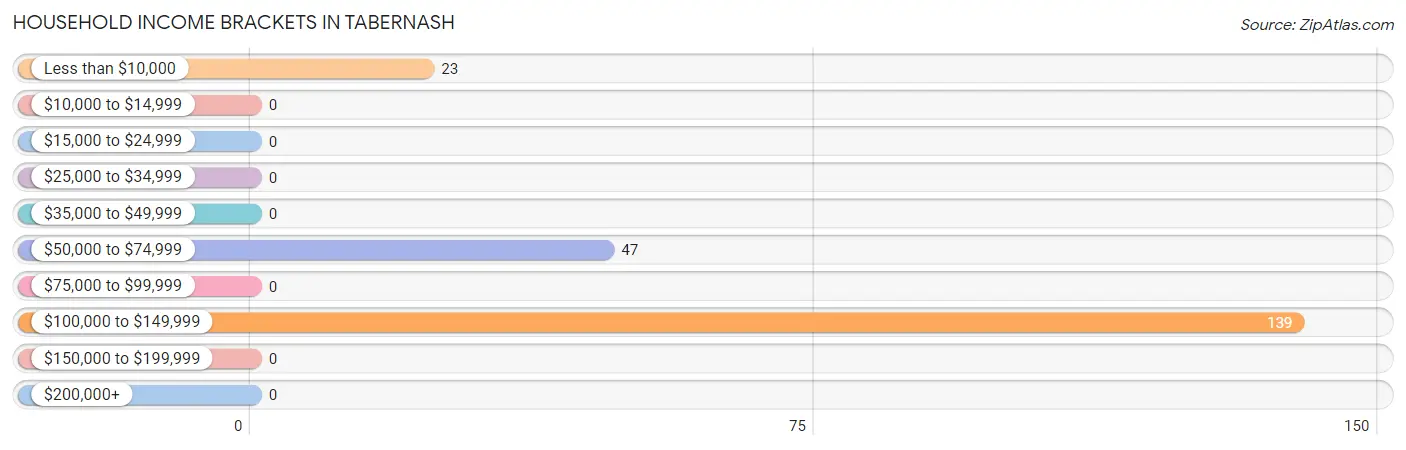
| Income Bracket | # Households | % Households |
| Less than $10,000 | 23 | 11.0% |
| $10,000 to $14,999 | 0 | 0.0% |
| $15,000 to $24,999 | 0 | 0.0% |
| $25,000 to $34,999 | 0 | 0.0% |
| $35,000 to $49,999 | 0 | 0.0% |
| $50,000 to $74,999 | 47 | 22.5% |
| $75,000 to $99,999 | 0 | 0.0% |
| $100,000 to $149,999 | 139 | 66.5% |
| $150,000 to $199,999 | 0 | 0.0% |
| $200,000+ | 0 | 0.0% |
Household Income by Householder Age in Tabernash
The median household income in Tabernash is $104,335, with the highest median household income of $118,362 found in the 45 to 64 years age bracket for the primary householder. A total of 164 households (78.5%) fall into this category.
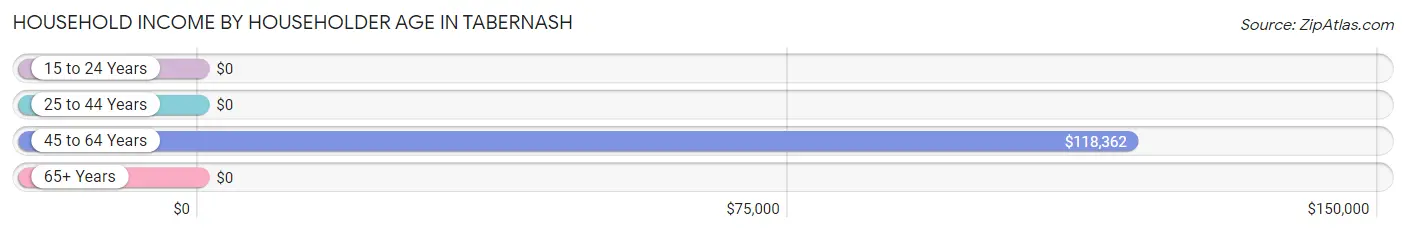
| Income Bracket | # Households | Median Income |
| 15 to 24 Years | 0 (0.0%) | $0 |
| 25 to 44 Years | 45 (21.5%) | $0 |
| 45 to 64 Years | 164 (78.5%) | $118,362 |
| 65+ Years | 0 (0.0%) | $0 |
| Total | 209 (100.0%) | $104,335 |
Poverty in Tabernash
Income Below Poverty by Sex and Age in Tabernash
With 24.7% poverty level for males and 20.7% for females among the residents of Tabernash, 35 to 44 year old males and 25 to 34 year old females are the most vulnerable to poverty, with 23 males (51.1%) and 54 females (100.0%) in their respective age groups living below the poverty level.
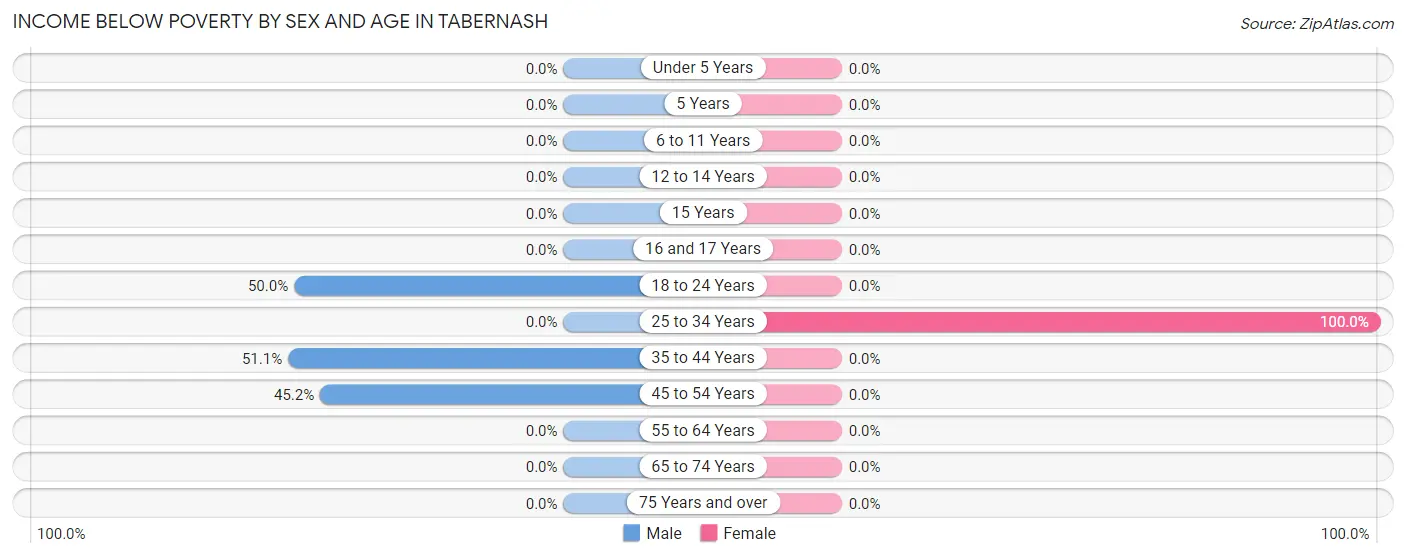
| Age Bracket | Male | Female |
| Under 5 Years | 0 (0.0%) | 0 (0.0%) |
| 5 Years | 0 (0.0%) | 0 (0.0%) |
| 6 to 11 Years | 0 (0.0%) | 0 (0.0%) |
| 12 to 14 Years | 0 (0.0%) | 0 (0.0%) |
| 15 Years | 0 (0.0%) | 0 (0.0%) |
| 16 and 17 Years | 0 (0.0%) | 0 (0.0%) |
| 18 to 24 Years | 38 (50.0%) | 0 (0.0%) |
| 25 to 34 Years | 0 (0.0%) | 54 (100.0%) |
| 35 to 44 Years | 23 (51.1%) | 0 (0.0%) |
| 45 to 54 Years | 70 (45.2%) | 0 (0.0%) |
| 55 to 64 Years | 0 (0.0%) | 0 (0.0%) |
| 65 to 74 Years | 0 (0.0%) | 0 (0.0%) |
| 75 Years and over | 0 (0.0%) | 0 (0.0%) |
| Total | 131 (24.7%) | 54 (20.7%) |
Income Above Poverty by Sex and Age in Tabernash
According to the poverty statistics in Tabernash, males aged 25 to 34 years and females aged 6 to 11 years are the age groups that are most secure financially, with 100.0% of males and 100.0% of females in these age groups living above the poverty line.
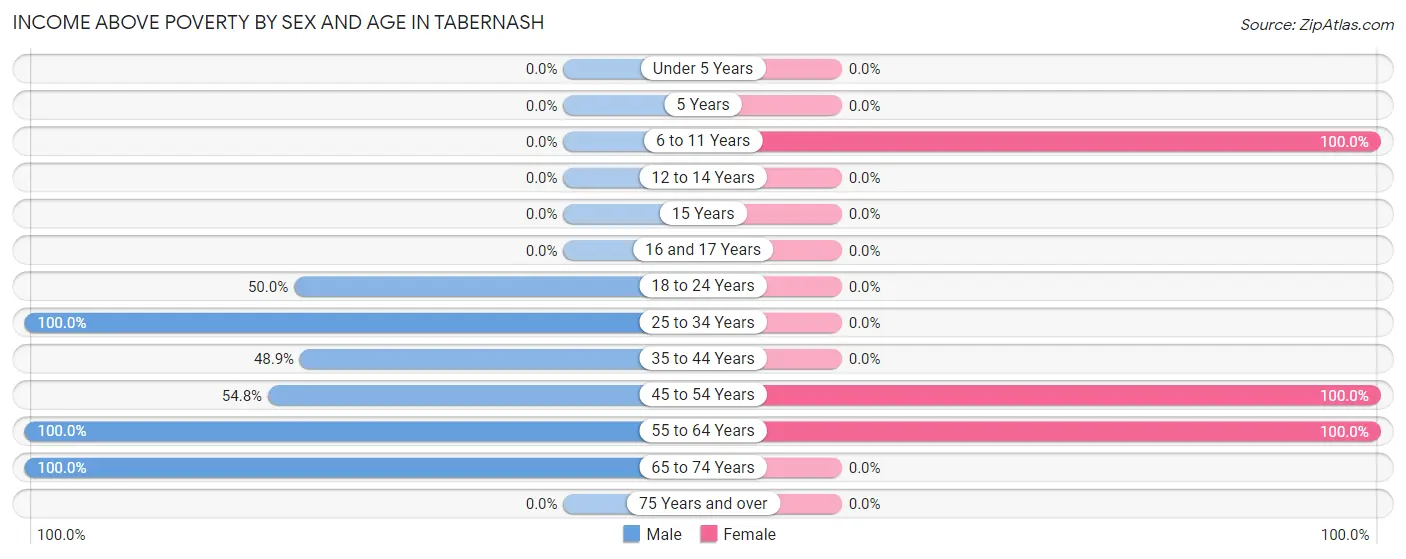
| Age Bracket | Male | Female |
| Under 5 Years | 0 (0.0%) | 0 (0.0%) |
| 5 Years | 0 (0.0%) | 0 (0.0%) |
| 6 to 11 Years | 0 (0.0%) | 74 (100.0%) |
| 12 to 14 Years | 0 (0.0%) | 0 (0.0%) |
| 15 Years | 0 (0.0%) | 0 (0.0%) |
| 16 and 17 Years | 0 (0.0%) | 0 (0.0%) |
| 18 to 24 Years | 38 (50.0%) | 0 (0.0%) |
| 25 to 34 Years | 129 (100.0%) | 0 (0.0%) |
| 35 to 44 Years | 22 (48.9%) | 0 (0.0%) |
| 45 to 54 Years | 85 (54.8%) | 83 (100.0%) |
| 55 to 64 Years | 102 (100.0%) | 50 (100.0%) |
| 65 to 74 Years | 23 (100.0%) | 0 (0.0%) |
| 75 Years and over | 0 (0.0%) | 0 (0.0%) |
| Total | 399 (75.3%) | 207 (79.3%) |
Income Below Poverty Among Married-Couple Families in Tabernash
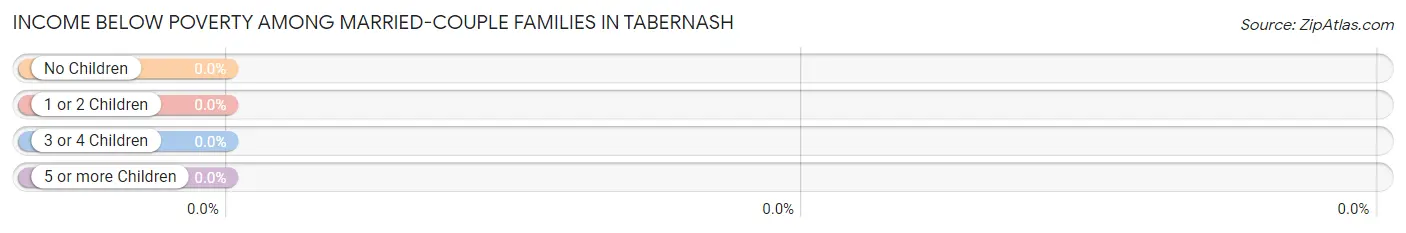
| Children | Above Poverty | Below Poverty |
| No Children | 47 (100.0%) | 0 (0.0%) |
| 1 or 2 Children | 42 (100.0%) | 0 (0.0%) |
| 3 or 4 Children | 0 (0.0%) | 0 (0.0%) |
| 5 or more Children | 0 (0.0%) | 0 (0.0%) |
| Total | 89 (100.0%) | 0 (0.0%) |
Income Below Poverty Among Single-Parent Households in Tabernash
| Children | Single Father | Single Mother |
| No Children | 0 (0.0%) | 0 (0.0%) |
| 1 or 2 Children | 0 (0.0%) | 0 (0.0%) |
| 3 or 4 Children | 0 (0.0%) | 0 (0.0%) |
| 5 or more Children | 0 (0.0%) | 0 (0.0%) |
| Total | 0 (0.0%) | 0 (0.0%) |
Income Below Poverty Among Married-Couple vs Single-Parent Households in Tabernash
| Children | Married-Couple Families | Single-Parent Households |
| No Children | 0 (0.0%) | 0 (0.0%) |
| 1 or 2 Children | 0 (0.0%) | 0 (0.0%) |
| 3 or 4 Children | 0 (0.0%) | 0 (0.0%) |
| 5 or more Children | 0 (0.0%) | 0 (0.0%) |
| Total | 0 (0.0%) | 0 (0.0%) |
Race in Tabernash
The most populous races in Tabernash are White / Caucasian (749 | 94.7%), and Two or more Races (42 | 5.3%).
| Race | # Population | % Population |
| Asian | 0 | 0.0% |
| Black / African American | 0 | 0.0% |
| Hawaiian / Pacific | 0 | 0.0% |
| Hispanic or Latino | 0 | 0.0% |
| Native / Alaskan | 0 | 0.0% |
| White / Caucasian | 749 | 94.7% |
| Two or more Races | 42 | 5.3% |
| Some other Race | 0 | 0.0% |
| Total | 791 | 100.0% |
Ancestry in Tabernash
The most populous ancestries reported in Tabernash are German (75 | 9.5%), English (42 | 5.3%), Irish (42 | 5.3%), African (37 | 4.7%), and Subsaharan African (37 | 4.7%), together accounting for 29.5% of all Tabernash residents.
| Ancestry | # Population | % Population |
| African | 37 | 4.7% |
| English | 42 | 5.3% |
| German | 75 | 9.5% |
| Irish | 42 | 5.3% |
| Norwegian | 21 | 2.6% |
| Subsaharan African | 37 | 4.7% | View All 6 Rows |
Immigrants in Tabernash

| Immigration Origin | # Population | % Population | View All 0 Rows |
Sex and Age in Tabernash
Sex and Age in Tabernash
The most populous age groups in Tabernash are 25 to 29 Years (129 | 24.3%) for men and 45 to 49 Years (57 | 21.8%) for women.
| Age Bracket | Male | Female |
| Under 5 Years | 0 (0.0%) | 0 (0.0%) |
| 5 to 9 Years | 0 (0.0%) | 37 (14.2%) |
| 10 to 14 Years | 0 (0.0%) | 37 (14.2%) |
| 15 to 19 Years | 0 (0.0%) | 0 (0.0%) |
| 20 to 24 Years | 76 (14.3%) | 0 (0.0%) |
| 25 to 29 Years | 129 (24.3%) | 54 (20.7%) |
| 30 to 34 Years | 0 (0.0%) | 0 (0.0%) |
| 35 to 39 Years | 22 (4.2%) | 0 (0.0%) |
| 40 to 44 Years | 23 (4.3%) | 0 (0.0%) |
| 45 to 49 Years | 85 (16.0%) | 57 (21.8%) |
| 50 to 54 Years | 70 (13.2%) | 26 (10.0%) |
| 55 to 59 Years | 0 (0.0%) | 29 (11.1%) |
| 60 to 64 Years | 102 (19.3%) | 21 (8.1%) |
| 65 to 69 Years | 23 (4.3%) | 0 (0.0%) |
| 70 to 74 Years | 0 (0.0%) | 0 (0.0%) |
| 75 to 79 Years | 0 (0.0%) | 0 (0.0%) |
| 80 to 84 Years | 0 (0.0%) | 0 (0.0%) |
| 85 Years and over | 0 (0.0%) | 0 (0.0%) |
| Total | 530 (100.0%) | 261 (100.0%) |
Families and Households in Tabernash
Median Family Size in Tabernash
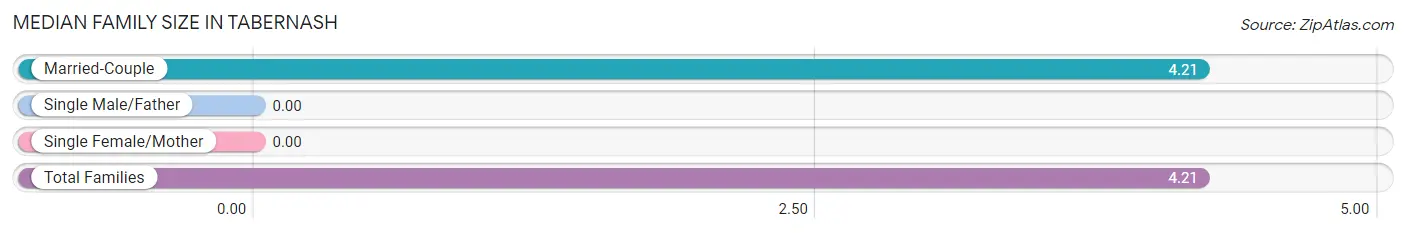
| Family Type | # Families | Family Size |
| Married-Couple | 89 (100.0%) | 4.21 |
| Single Male/Father | 0 (0.0%) | - |
| Single Female/Mother | 0 (0.0%) | - |
| Total Families | 89 (100.0%) | 4.21 |
Median Household Size in Tabernash
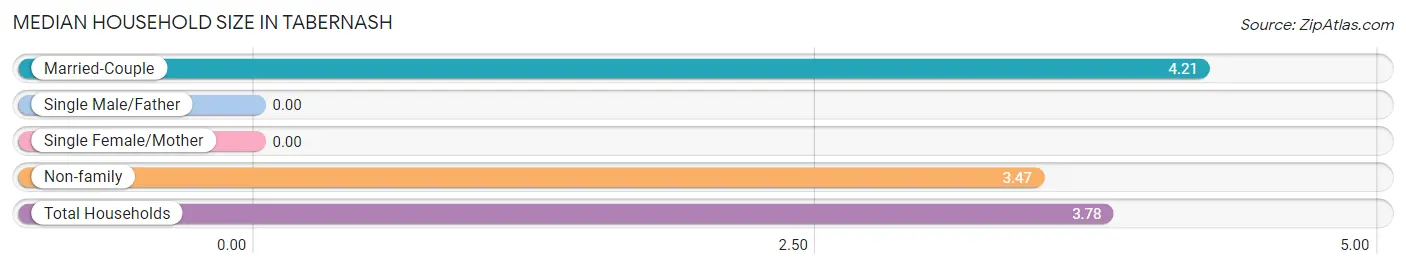
| Household Type | # Households | Household Size |
| Married-Couple | 89 (42.6%) | 4.21 |
| Single Male/Father | 0 (0.0%) | - |
| Single Female/Mother | 0 (0.0%) | - |
| Non-family | 120 (57.4%) | 3.47 |
| Total Households | 209 (100.0%) | 3.78 |
Household Size by Marriage Status in Tabernash
Out of a total of 209 households in Tabernash, 89 (42.6%) are family households, while 120 (57.4%) are nonfamily households. The most numerous type of family households are 4-person households, comprising 42, and the most common type of nonfamily households are 1-person households, comprising 52.
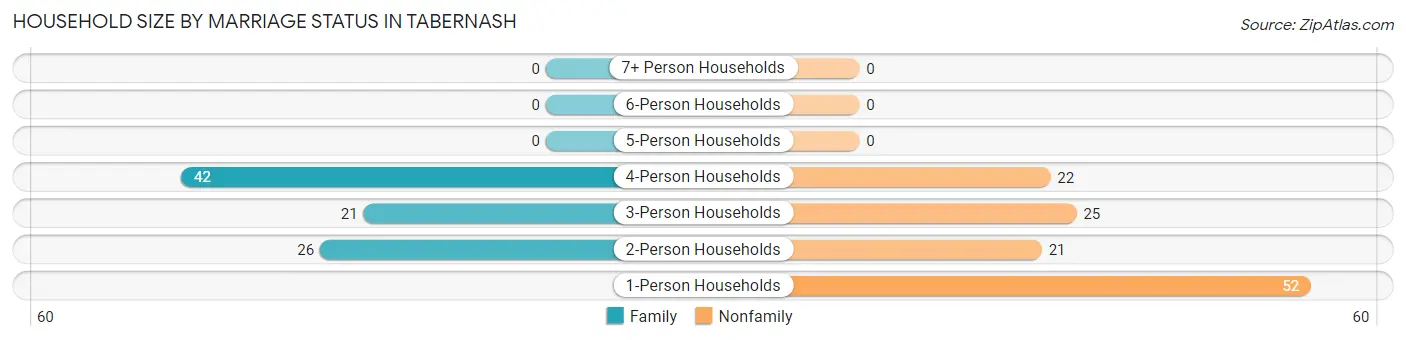
| Household Size | Family Households | Nonfamily Households |
| 1-Person Households | - | 52 (24.9%) |
| 2-Person Households | 26 (12.4%) | 21 (10.1%) |
| 3-Person Households | 21 (10.1%) | 25 (12.0%) |
| 4-Person Households | 42 (20.1%) | 22 (10.5%) |
| 5-Person Households | 0 (0.0%) | 0 (0.0%) |
| 6-Person Households | 0 (0.0%) | 0 (0.0%) |
| 7+ Person Households | 0 (0.0%) | 0 (0.0%) |
| Total | 89 (42.6%) | 120 (57.4%) |
Female Fertility in Tabernash
Fertility by Age in Tabernash
| Age Bracket | Women with Births | Births / 1,000 Women |
| 15 to 19 years | 0 (0.0%) | 0.0 |
| 20 to 34 years | 0 (0.0%) | 0.0 |
| 35 to 50 years | 0 (0.0%) | 0.0 |
| Total | 0 (0.0%) | 0.0 |
Fertility by Age by Marriage Status in Tabernash
| Age Bracket | Married | Unmarried |
| 15 to 19 years | 0 (0.0%) | 0 (0.0%) |
| 20 to 34 years | 0 (0.0%) | 0 (0.0%) |
| 35 to 50 years | 0 (0.0%) | 0 (0.0%) |
| Total | 0 (0.0%) | 0 (0.0%) |
Fertility by Education in Tabernash
| Educational Attainment | Women with Births | Births / 1,000 Women |
| Less than High School | 0 (0.0%) | 0.0 |
| High School Diploma | 0 (0.0%) | 0.0 |
| College or Associate's Degree | 0 (0.0%) | 0.0 |
| Bachelor's Degree | 0 (0.0%) | 0.0 |
| Graduate Degree | 0 (0.0%) | 0.0 |
| Total | 0 (0.0%) | 0.0 |
Fertility by Education by Marriage Status in Tabernash
| Educational Attainment | Married | Unmarried |
| Less than High School | 0 (0.0%) | 0 (0.0%) |
| High School Diploma | 0 (0.0%) | 0 (0.0%) |
| College or Associate's Degree | 0 (0.0%) | 0 (0.0%) |
| Bachelor's Degree | 0 (0.0%) | 0 (0.0%) |
| Graduate Degree | 0 (0.0%) | 0 (0.0%) |
| Total | 0 (0.0%) | 0 (0.0%) |
Employment Characteristics in Tabernash
Employment by Class of Employer in Tabernash
Among the 470 employed individuals in Tabernash, local government employees (158 | 33.6%), private company employees (128 | 27.2%), and self-employed (not incorporated) (80 | 17.0%) make up the most common classes of employment.
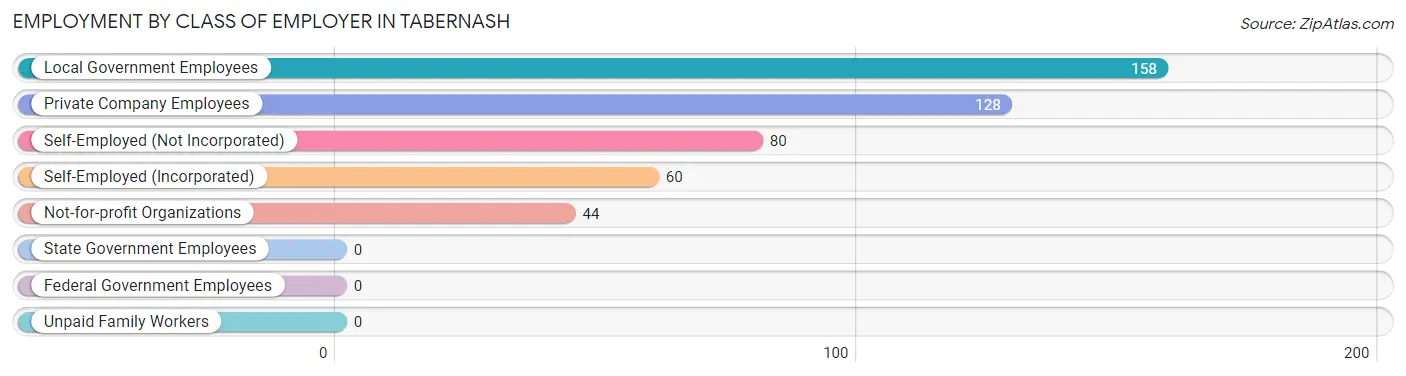
| Employer Class | # Employees | % Employees |
| Private Company Employees | 128 | 27.2% |
| Self-Employed (Incorporated) | 60 | 12.8% |
| Self-Employed (Not Incorporated) | 80 | 17.0% |
| Not-for-profit Organizations | 44 | 9.4% |
| Local Government Employees | 158 | 33.6% |
| State Government Employees | 0 | 0.0% |
| Federal Government Employees | 0 | 0.0% |
| Unpaid Family Workers | 0 | 0.0% |
| Total | 470 | 100.0% |
Employment Status by Age in Tabernash
According to the labor force statistics for Tabernash, out of the total population over 16 years of age (717), 68.8% or 493 individuals are in the labor force, with 4.7% or 23 of them unemployed. The age group with the highest labor force participation rate is 20 to 24 years, with 100.0% or 76 individuals in the labor force. Within the labor force, the 35 to 44 years age range has the highest percentage of unemployed individuals, with 51.1% or 23 of them being unemployed.
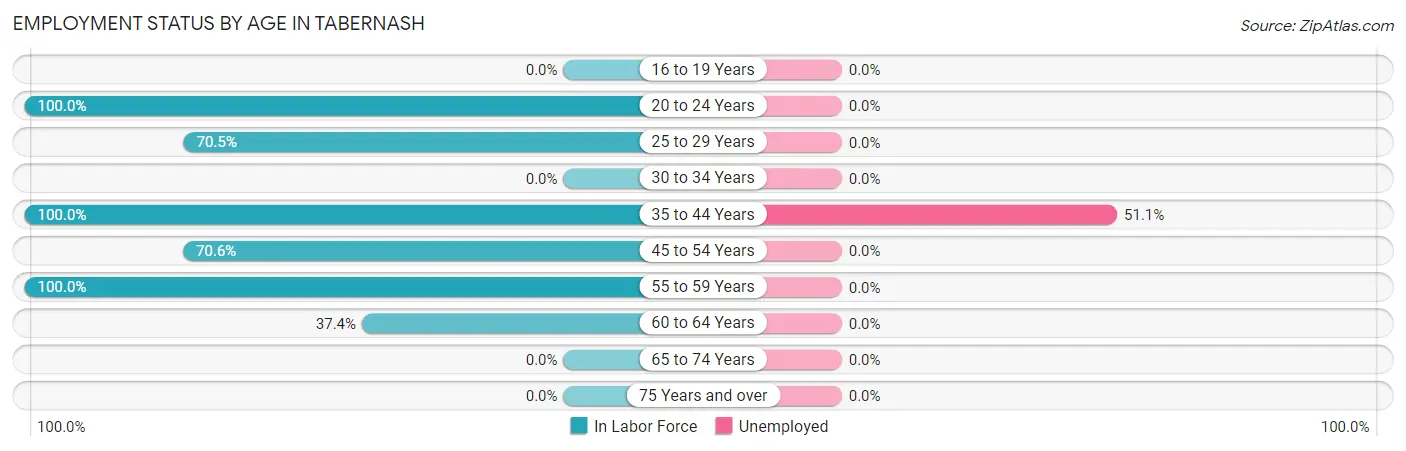
| Age Bracket | In Labor Force | Unemployed |
| 16 to 19 Years | 0 (0.0%) | 0 (0.0%) |
| 20 to 24 Years | 76 (100.0%) | 0 (0.0%) |
| 25 to 29 Years | 129 (70.5%) | 0 (0.0%) |
| 30 to 34 Years | 0 (0.0%) | 0 (0.0%) |
| 35 to 44 Years | 45 (100.0%) | 23 (51.1%) |
| 45 to 54 Years | 168 (70.6%) | 0 (0.0%) |
| 55 to 59 Years | 29 (100.0%) | 0 (0.0%) |
| 60 to 64 Years | 46 (37.4%) | 0 (0.0%) |
| 65 to 74 Years | 0 (0.0%) | 0 (0.0%) |
| 75 Years and over | 0 (0.0%) | 0 (0.0%) |
| Total | 493 (68.8%) | 23 (4.7%) |
Employment Status by Educational Attainment in Tabernash
According to labor force statistics for Tabernash, 67.5% of individuals (417) out of the total population between 25 and 64 years of age (618) are in the labor force, with 5.5% or 23 of them being unemployed. The group with the highest labor force participation rate are those with the educational attainment of high school diploma, with 100.0% or 180 individuals in the labor force. Within the labor force, individuals with college / associate degree education have the highest percentage of unemployment, with 20.9% or 23 of them being unemployed.
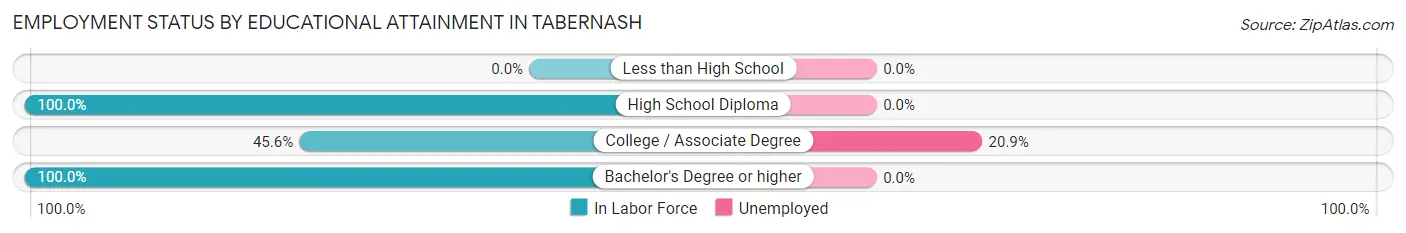
| Educational Attainment | In Labor Force | Unemployed |
| Less than High School | 0 (0.0%) | 0 (0.0%) |
| High School Diploma | 180 (100.0%) | 0 (0.0%) |
| College / Associate Degree | 110 (45.6%) | 50 (20.9%) |
| Bachelor's Degree or higher | 127 (100.0%) | 0 (0.0%) |
| Total | 417 (67.5%) | 34 (5.5%) |
Employment Occupations by Sex in Tabernash
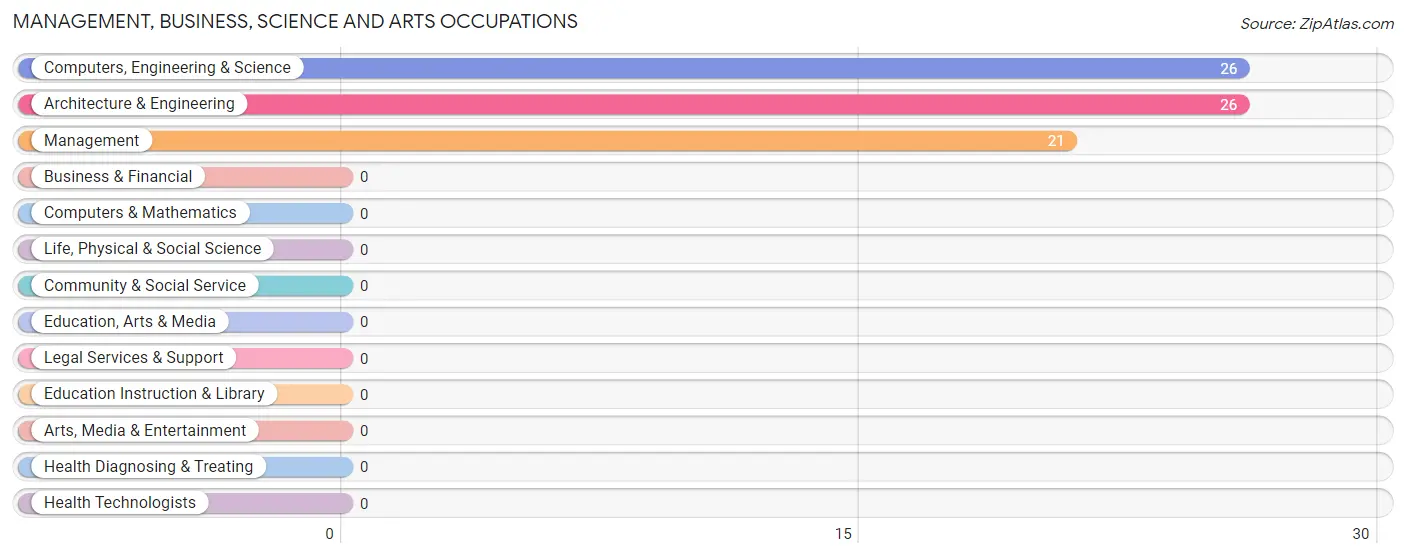
Management, Business, Science and Arts Occupations
The most common Management, Business, Science and Arts occupations in Tabernash are Computers, Engineering & Science (26 | 5.5%), Architecture & Engineering (26 | 5.5%), and Management (21 | 4.5%).
Management, Business, Science and Arts Occupations by Sex
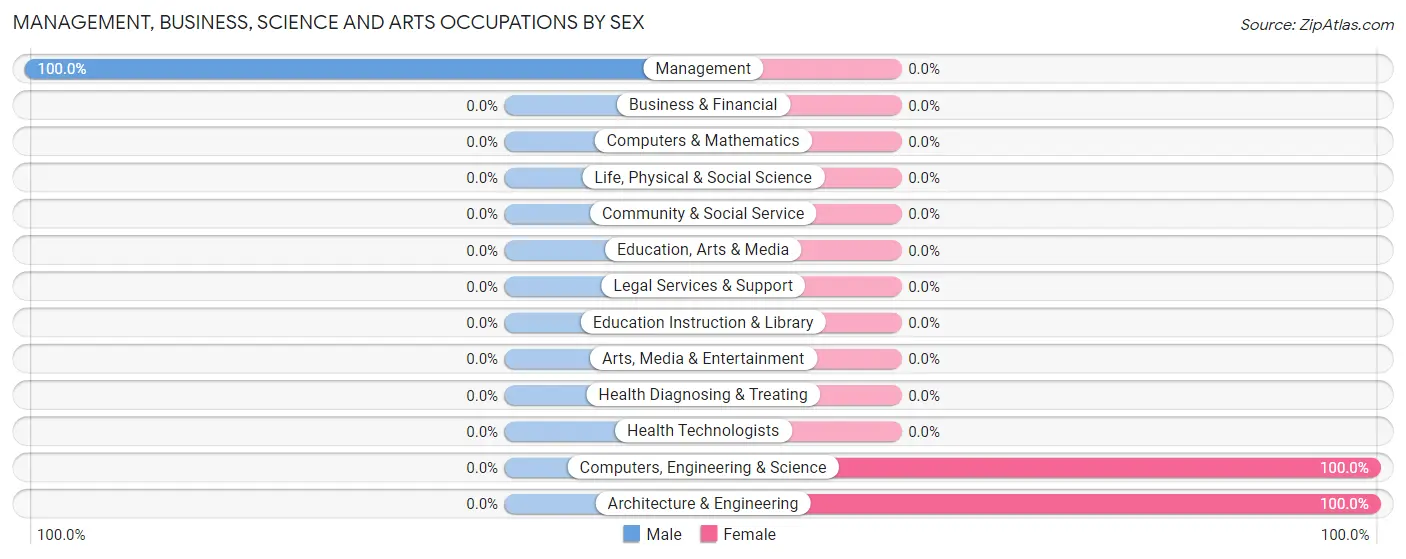
| Occupation | Male | Female |
| Management | 21 (100.0%) | 0 (0.0%) |
| Business & Financial | 0 (0.0%) | 0 (0.0%) |
| Computers, Engineering & Science | 0 (0.0%) | 26 (100.0%) |
| Computers & Mathematics | 0 (0.0%) | 0 (0.0%) |
| Architecture & Engineering | 0 (0.0%) | 26 (100.0%) |
| Life, Physical & Social Science | 0 (0.0%) | 0 (0.0%) |
| Community & Social Service | 0 (0.0%) | 0 (0.0%) |
| Education, Arts & Media | 0 (0.0%) | 0 (0.0%) |
| Legal Services & Support | 0 (0.0%) | 0 (0.0%) |
| Education Instruction & Library | 0 (0.0%) | 0 (0.0%) |
| Arts, Media & Entertainment | 0 (0.0%) | 0 (0.0%) |
| Health Diagnosing & Treating | 0 (0.0%) | 0 (0.0%) |
| Health Technologists | 0 (0.0%) | 0 (0.0%) |
| Total (Category) | 21 (44.7%) | 26 (55.3%) |
| Total (Overall) | 337 (71.7%) | 133 (28.3%) |
Services Occupations
The most common Services occupations in Tabernash are Personal Care & Service (101 | 21.5%), and Cleaning & Maintenance (25 | 5.3%).
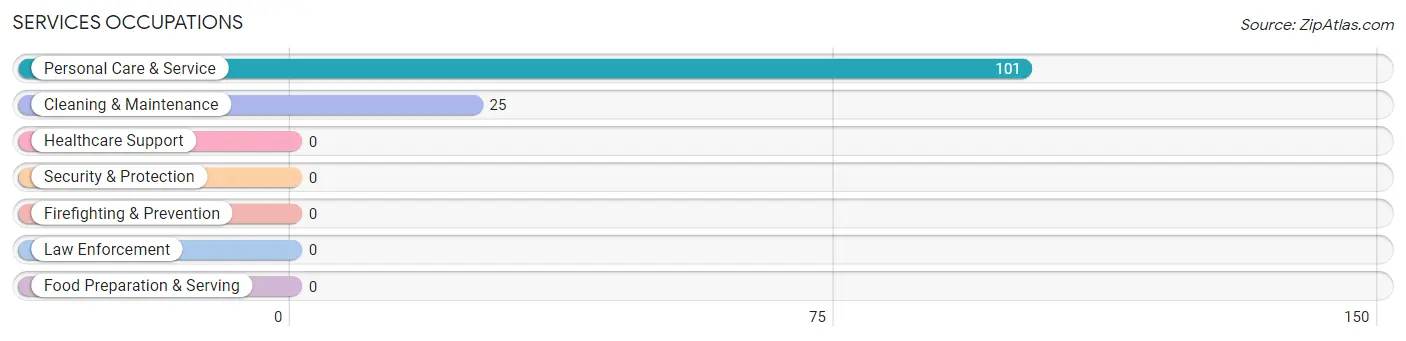
Services Occupations by Sex
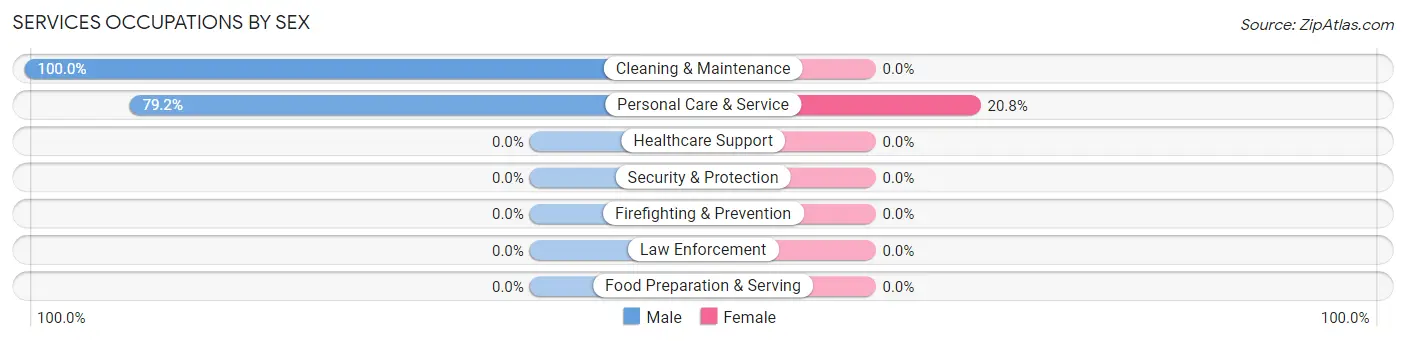
| Occupation | Male | Female |
| Healthcare Support | 0 (0.0%) | 0 (0.0%) |
| Security & Protection | 0 (0.0%) | 0 (0.0%) |
| Firefighting & Prevention | 0 (0.0%) | 0 (0.0%) |
| Law Enforcement | 0 (0.0%) | 0 (0.0%) |
| Food Preparation & Serving | 0 (0.0%) | 0 (0.0%) |
| Cleaning & Maintenance | 25 (100.0%) | 0 (0.0%) |
| Personal Care & Service | 80 (79.2%) | 21 (20.8%) |
| Total (Category) | 105 (83.3%) | 21 (16.7%) |
| Total (Overall) | 337 (71.7%) | 133 (28.3%) |
Sales and Office Occupations
The most common Sales and Office occupations in Tabernash are Sales & Related (79 | 16.8%), and Office & Administration (67 | 14.3%).
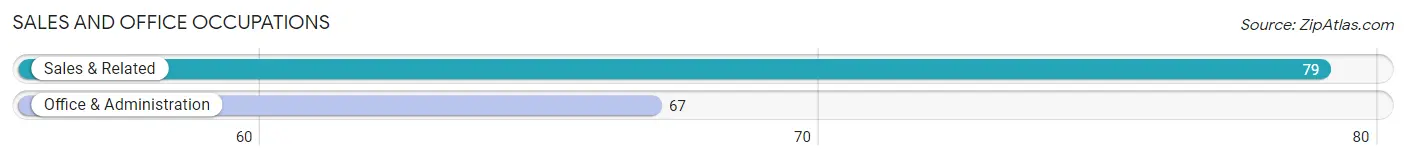
Sales and Office Occupations by Sex
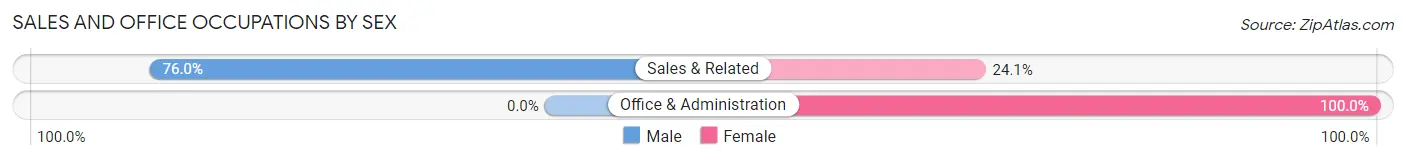
| Occupation | Male | Female |
| Sales & Related | 60 (75.9%) | 19 (24.0%) |
| Office & Administration | 0 (0.0%) | 67 (100.0%) |
| Total (Category) | 60 (41.1%) | 86 (58.9%) |
| Total (Overall) | 337 (71.7%) | 133 (28.3%) |
Natural Resources, Construction and Maintenance Occupations
The most common Natural Resources, Construction and Maintenance occupations in Tabernash are , and Construction & Extraction (129 | 27.5%).
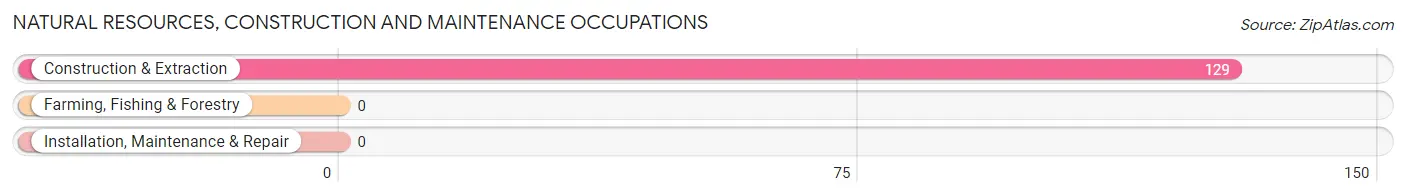
Natural Resources, Construction and Maintenance Occupations by Sex
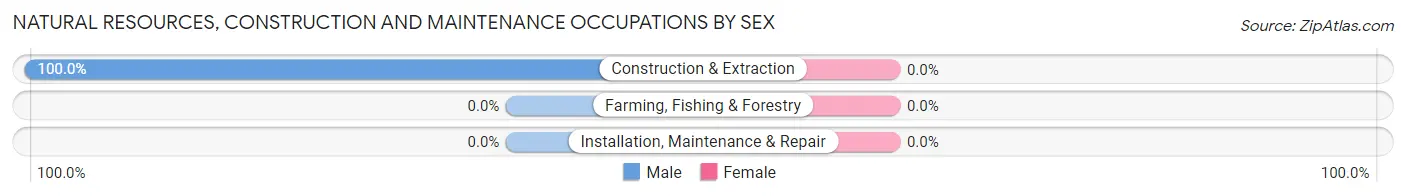
| Occupation | Male | Female |
| Farming, Fishing & Forestry | 0 (0.0%) | 0 (0.0%) |
| Construction & Extraction | 129 (100.0%) | 0 (0.0%) |
| Installation, Maintenance & Repair | 0 (0.0%) | 0 (0.0%) |
| Total (Category) | 129 (100.0%) | 0 (0.0%) |
| Total (Overall) | 337 (71.7%) | 133 (28.3%) |
Production, Transportation and Moving Occupations
The most common Production, Transportation and Moving occupations in Tabernash are , and Production (22 | 4.7%).
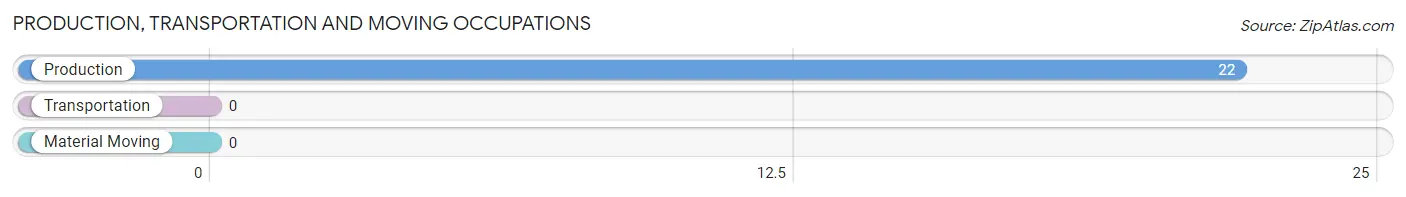
Production, Transportation and Moving Occupations by Sex
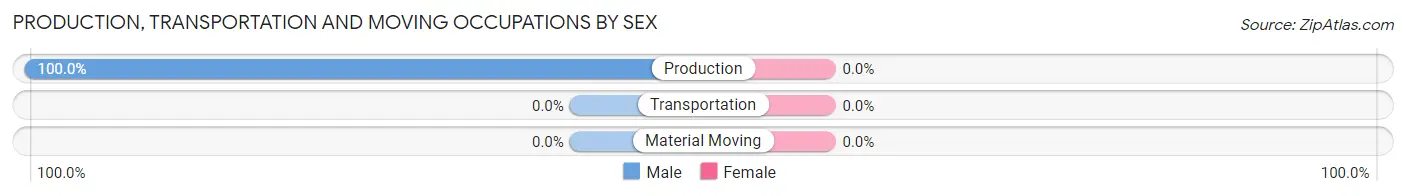
| Occupation | Male | Female |
| Production | 22 (100.0%) | 0 (0.0%) |
| Transportation | 0 (0.0%) | 0 (0.0%) |
| Material Moving | 0 (0.0%) | 0 (0.0%) |
| Total (Category) | 22 (100.0%) | 0 (0.0%) |
| Total (Overall) | 337 (71.7%) | 133 (28.3%) |
Employment Industries by Sex in Tabernash
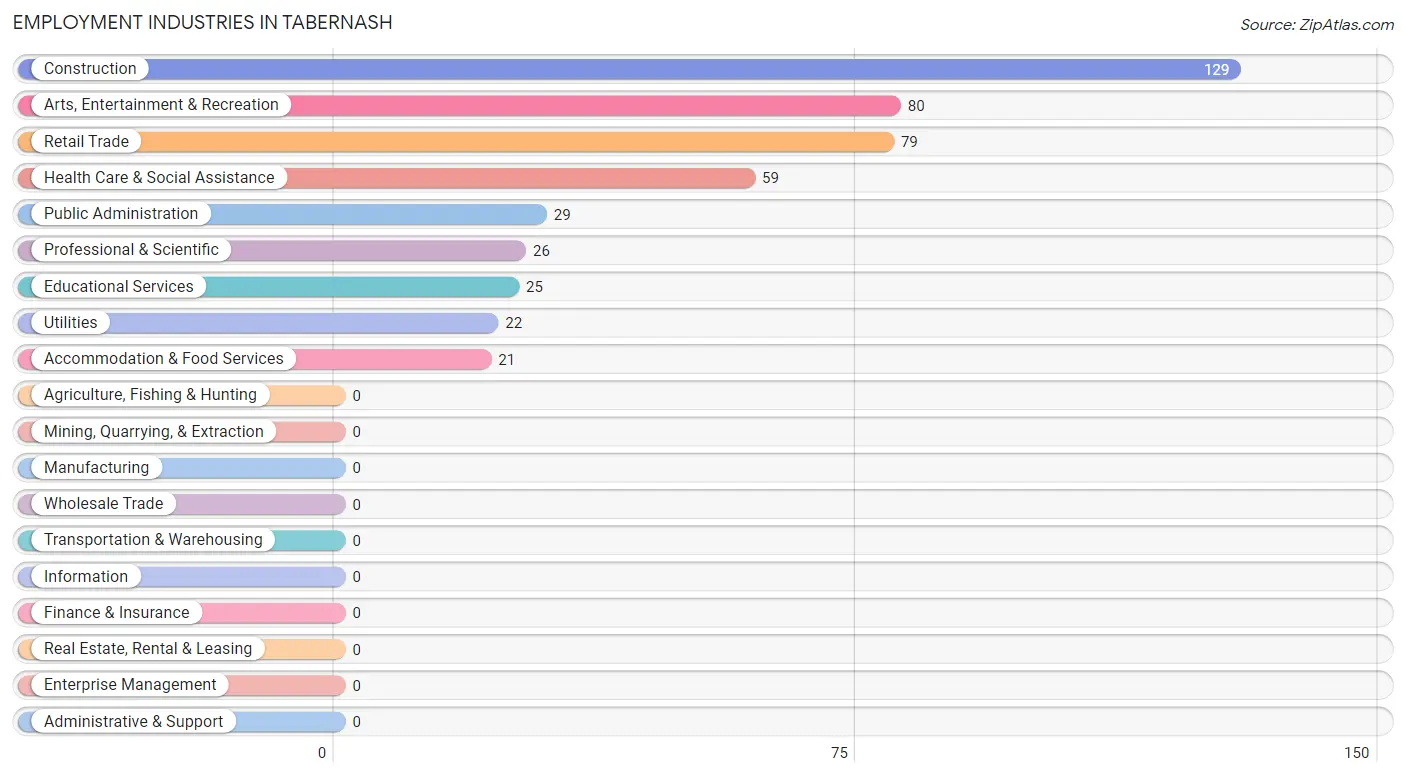
Employment Industries in Tabernash
The major employment industries in Tabernash include Construction (129 | 27.5%), Arts, Entertainment & Recreation (80 | 17.0%), Retail Trade (79 | 16.8%), Health Care & Social Assistance (59 | 12.6%), and Public Administration (29 | 6.2%).
Employment Industries by Sex in Tabernash
The Tabernash industries that see more men than women are Construction (100.0%), Utilities (100.0%), and Educational Services (100.0%), whereas the industries that tend to have a higher number of women are Professional & Scientific (100.0%), Public Administration (100.0%), and Arts, Entertainment & Recreation (47.5%).
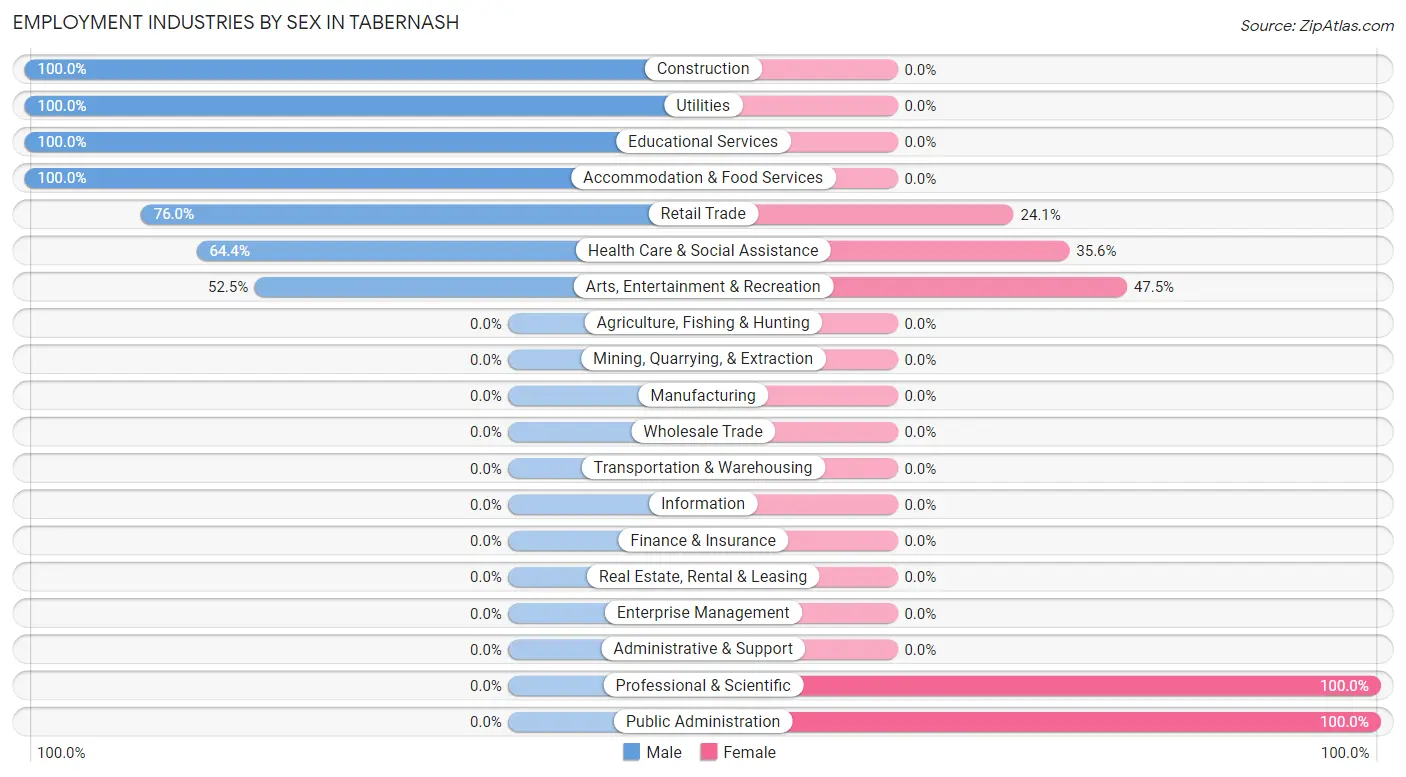
| Industry | Male | Female |
| Agriculture, Fishing & Hunting | 0 (0.0%) | 0 (0.0%) |
| Mining, Quarrying, & Extraction | 0 (0.0%) | 0 (0.0%) |
| Construction | 129 (100.0%) | 0 (0.0%) |
| Manufacturing | 0 (0.0%) | 0 (0.0%) |
| Wholesale Trade | 0 (0.0%) | 0 (0.0%) |
| Retail Trade | 60 (75.9%) | 19 (24.0%) |
| Transportation & Warehousing | 0 (0.0%) | 0 (0.0%) |
| Utilities | 22 (100.0%) | 0 (0.0%) |
| Information | 0 (0.0%) | 0 (0.0%) |
| Finance & Insurance | 0 (0.0%) | 0 (0.0%) |
| Real Estate, Rental & Leasing | 0 (0.0%) | 0 (0.0%) |
| Professional & Scientific | 0 (0.0%) | 26 (100.0%) |
| Enterprise Management | 0 (0.0%) | 0 (0.0%) |
| Administrative & Support | 0 (0.0%) | 0 (0.0%) |
| Educational Services | 25 (100.0%) | 0 (0.0%) |
| Health Care & Social Assistance | 38 (64.4%) | 21 (35.6%) |
| Arts, Entertainment & Recreation | 42 (52.5%) | 38 (47.5%) |
| Accommodation & Food Services | 21 (100.0%) | 0 (0.0%) |
| Public Administration | 0 (0.0%) | 29 (100.0%) |
| Total | 337 (71.7%) | 133 (28.3%) |
Education in Tabernash
School Enrollment in Tabernash
The most common levels of schooling among the 74 students in Tabernash are elementary school (37 | 50.0%), and middle school (37 | 50.0%).
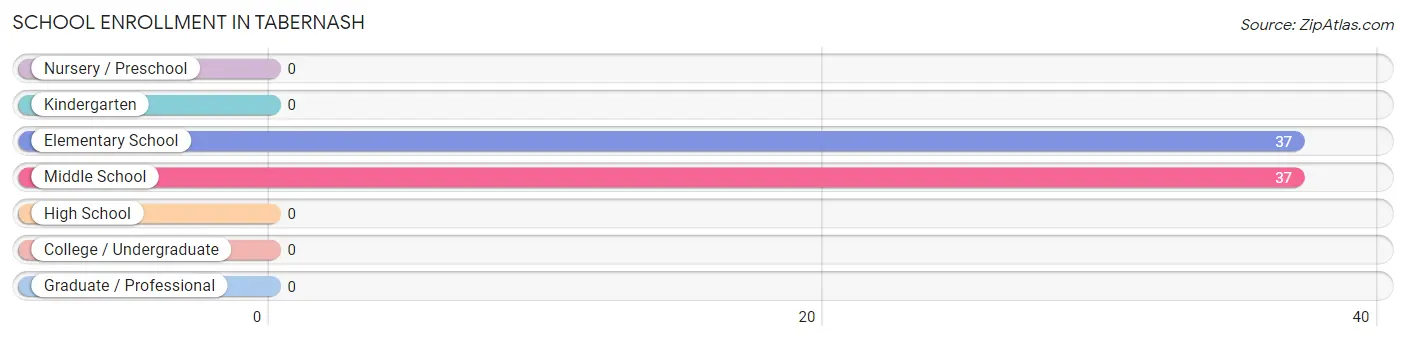
| School Level | # Students | % Students |
| Nursery / Preschool | 0 | 0.0% |
| Kindergarten | 0 | 0.0% |
| Elementary School | 37 | 50.0% |
| Middle School | 37 | 50.0% |
| High School | 0 | 0.0% |
| College / Undergraduate | 0 | 0.0% |
| Graduate / Professional | 0 | 0.0% |
| Total | 74 | 100.0% |
School Enrollment by Age by Funding Source in Tabernash
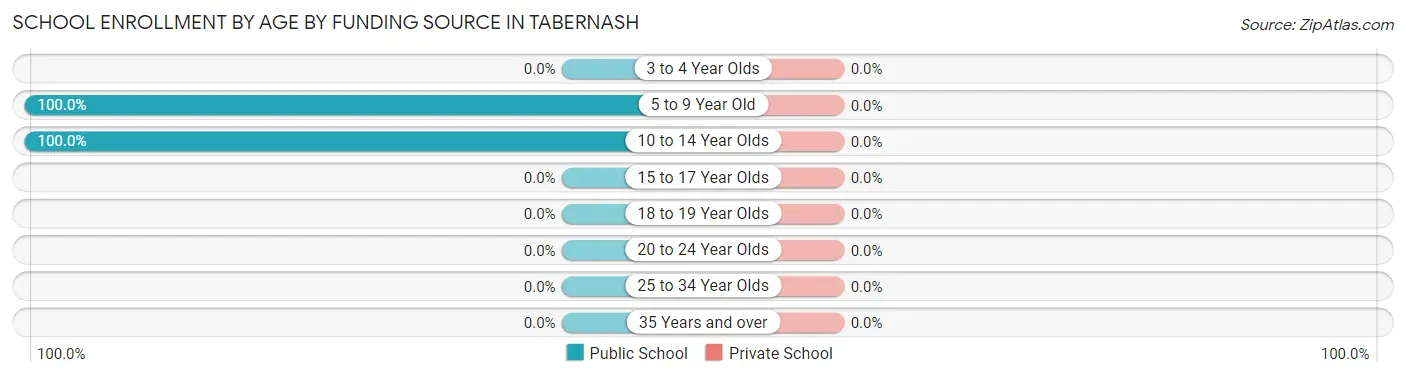
| Age Bracket | Public School | Private School |
| 3 to 4 Year Olds | 0 (0.0%) | 0 (0.0%) |
| 5 to 9 Year Old | 37 (100.0%) | 0 (0.0%) |
| 10 to 14 Year Olds | 37 (100.0%) | 0 (0.0%) |
| 15 to 17 Year Olds | 0 (0.0%) | 0 (0.0%) |
| 18 to 19 Year Olds | 0 (0.0%) | 0 (0.0%) |
| 20 to 24 Year Olds | 0 (0.0%) | 0 (0.0%) |
| 25 to 34 Year Olds | 0 (0.0%) | 0 (0.0%) |
| 35 Years and over | 0 (0.0%) | 0 (0.0%) |
| Total | 74 (100.0%) | 0 (0.0%) |
Educational Attainment by Field of Study in Tabernash
Arts & humanities (64 | 38.8%), computers & mathematics (42 | 25.5%), science & technology (38 | 23.0%), and liberal arts & history (21 | 12.7%) are the most common fields of study among 165 individuals in Tabernash who have obtained a bachelor's degree or higher.
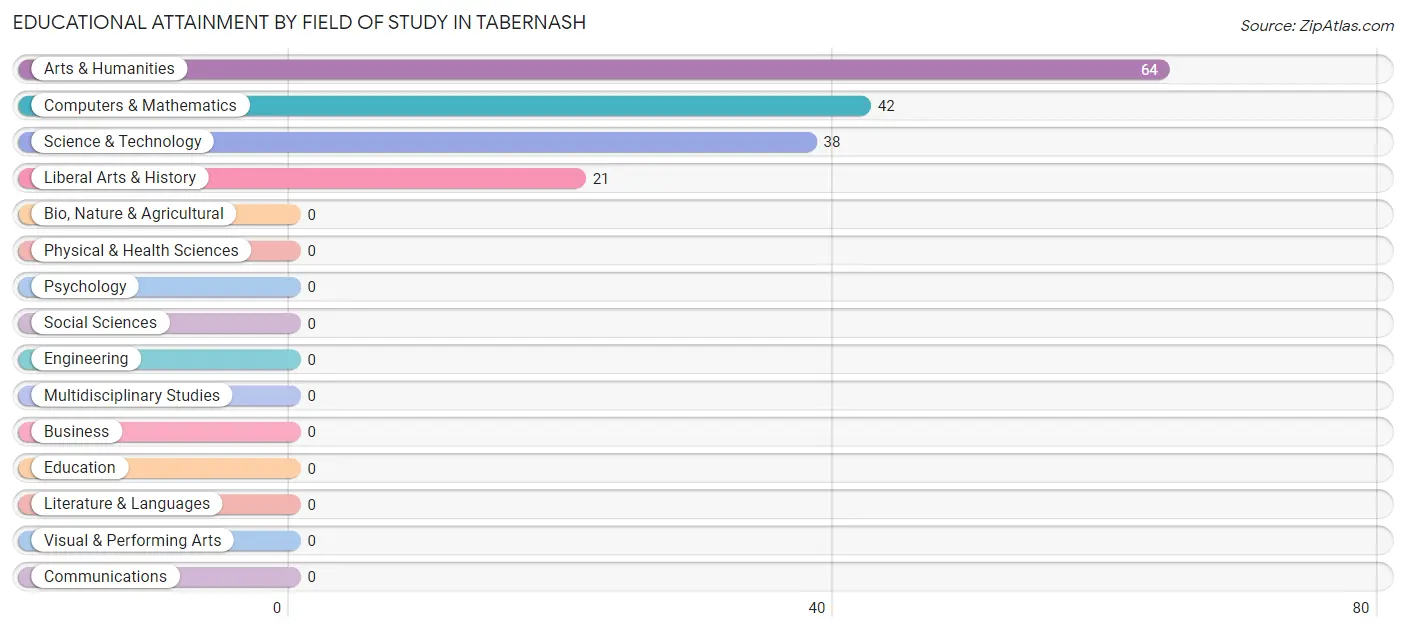
| Field of Study | # Graduates | % Graduates |
| Computers & Mathematics | 42 | 25.5% |
| Bio, Nature & Agricultural | 0 | 0.0% |
| Physical & Health Sciences | 0 | 0.0% |
| Psychology | 0 | 0.0% |
| Social Sciences | 0 | 0.0% |
| Engineering | 0 | 0.0% |
| Multidisciplinary Studies | 0 | 0.0% |
| Science & Technology | 38 | 23.0% |
| Business | 0 | 0.0% |
| Education | 0 | 0.0% |
| Literature & Languages | 0 | 0.0% |
| Liberal Arts & History | 21 | 12.7% |
| Visual & Performing Arts | 0 | 0.0% |
| Communications | 0 | 0.0% |
| Arts & Humanities | 64 | 38.8% |
| Total | 165 | 100.0% |
Transportation & Commute in Tabernash
Vehicle Availability by Sex in Tabernash
The most prevalent vehicle ownership categories in Tabernash are males with 1 vehicle (129, accounting for 38.3%) and females with 1 vehicle (50, making up 97.0%).
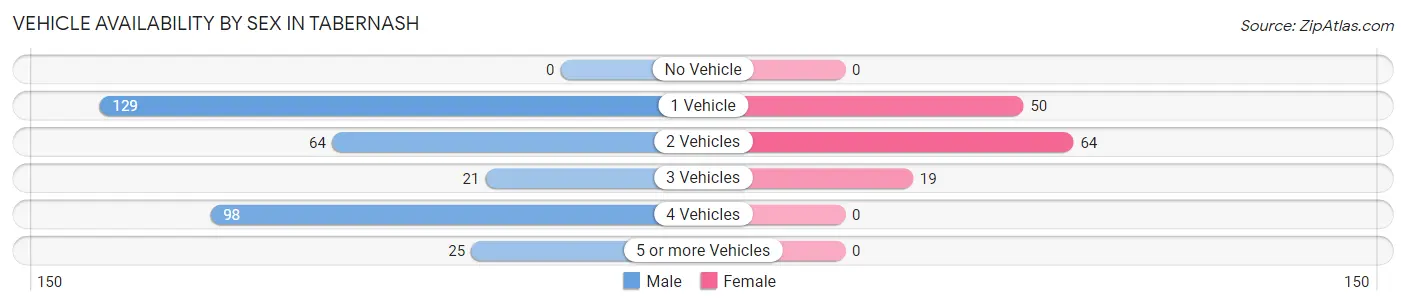
| Vehicles Available | Male | Female |
| No Vehicle | 0 (0.0%) | 0 (0.0%) |
| 1 Vehicle | 129 (38.3%) | 50 (37.6%) |
| 2 Vehicles | 64 (19.0%) | 64 (48.1%) |
| 3 Vehicles | 21 (6.2%) | 19 (14.3%) |
| 4 Vehicles | 98 (29.1%) | 0 (0.0%) |
| 5 or more Vehicles | 25 (7.4%) | 0 (0.0%) |
| Total | 337 (100.0%) | 133 (100.0%) |
Commute Time in Tabernash
The most frequently occuring commute durations in Tabernash are 30 to 34 minutes (150 commuters, 45.1%), 10 to 14 minutes (111 commuters, 33.3%), and 15 to 19 minutes (29 commuters, 8.7%).
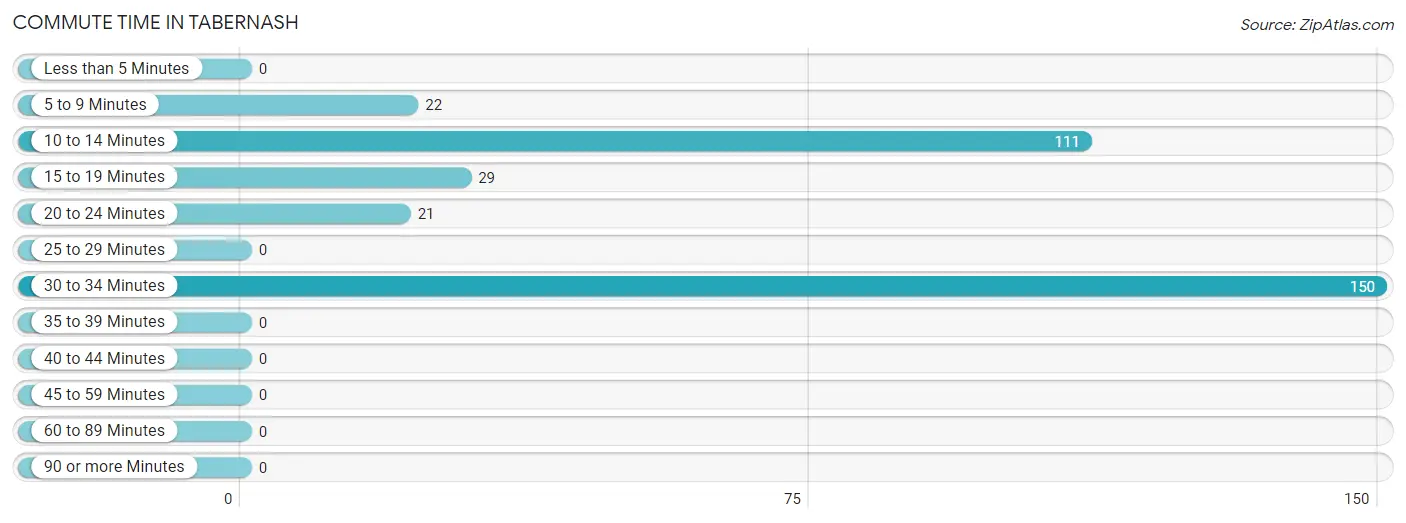
| Commute Time | # Commuters | % Commuters |
| Less than 5 Minutes | 0 | 0.0% |
| 5 to 9 Minutes | 22 | 6.6% |
| 10 to 14 Minutes | 111 | 33.3% |
| 15 to 19 Minutes | 29 | 8.7% |
| 20 to 24 Minutes | 21 | 6.3% |
| 25 to 29 Minutes | 0 | 0.0% |
| 30 to 34 Minutes | 150 | 45.1% |
| 35 to 39 Minutes | 0 | 0.0% |
| 40 to 44 Minutes | 0 | 0.0% |
| 45 to 59 Minutes | 0 | 0.0% |
| 60 to 89 Minutes | 0 | 0.0% |
| 90 or more Minutes | 0 | 0.0% |
Commute Time by Sex in Tabernash
The most common commute times in Tabernash are 30 to 34 minutes (129 commuters, 50.2%) for males and 15 to 19 minutes (29 commuters, 38.2%) for females.
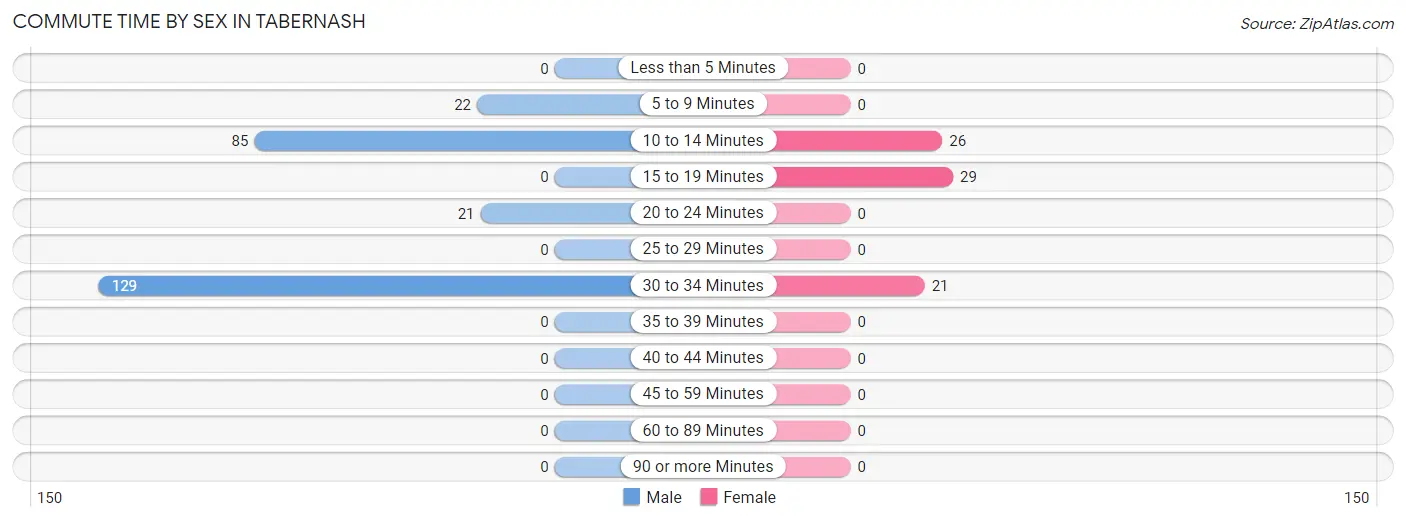
| Commute Time | Male | Female |
| Less than 5 Minutes | 0 (0.0%) | 0 (0.0%) |
| 5 to 9 Minutes | 22 (8.6%) | 0 (0.0%) |
| 10 to 14 Minutes | 85 (33.1%) | 26 (34.2%) |
| 15 to 19 Minutes | 0 (0.0%) | 29 (38.2%) |
| 20 to 24 Minutes | 21 (8.2%) | 0 (0.0%) |
| 25 to 29 Minutes | 0 (0.0%) | 0 (0.0%) |
| 30 to 34 Minutes | 129 (50.2%) | 21 (27.6%) |
| 35 to 39 Minutes | 0 (0.0%) | 0 (0.0%) |
| 40 to 44 Minutes | 0 (0.0%) | 0 (0.0%) |
| 45 to 59 Minutes | 0 (0.0%) | 0 (0.0%) |
| 60 to 89 Minutes | 0 (0.0%) | 0 (0.0%) |
| 90 or more Minutes | 0 (0.0%) | 0 (0.0%) |
Time of Departure to Work by Sex in Tabernash
The most frequent times of departure to work in Tabernash are 5:30 AM to 5:59 AM (129, 50.2%) for males and 9:00 AM to 9:59 AM (29, 38.2%) for females.
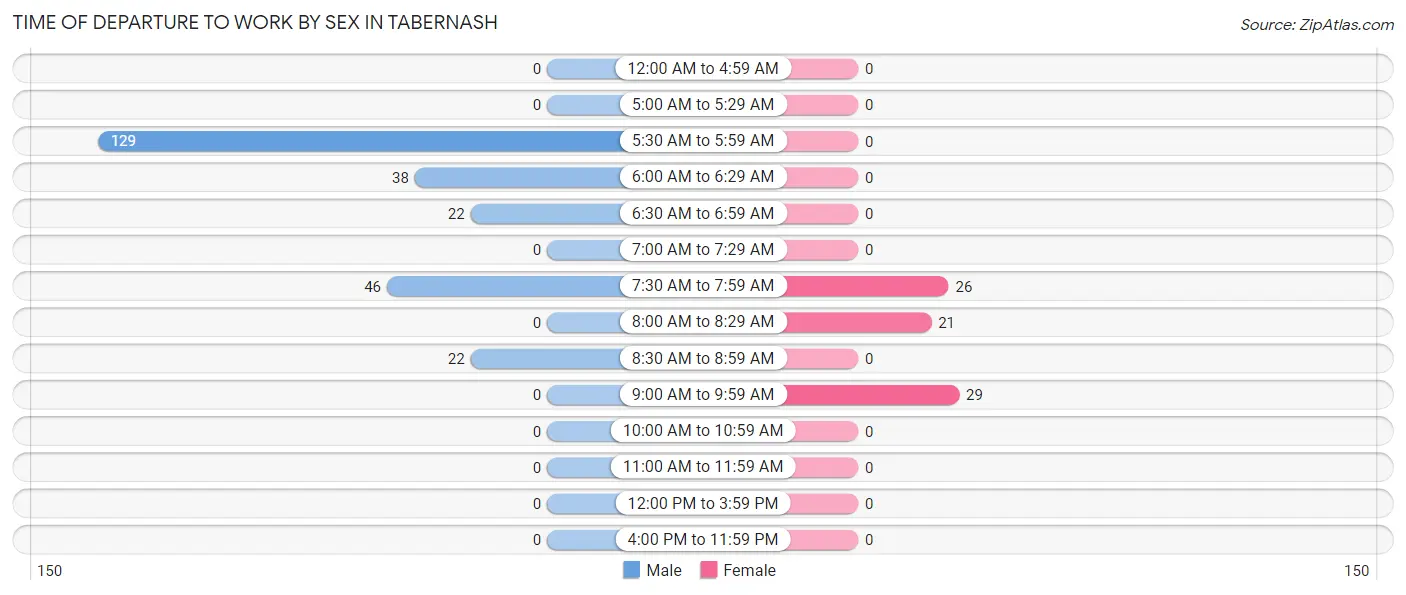
| Time of Departure | Male | Female |
| 12:00 AM to 4:59 AM | 0 (0.0%) | 0 (0.0%) |
| 5:00 AM to 5:29 AM | 0 (0.0%) | 0 (0.0%) |
| 5:30 AM to 5:59 AM | 129 (50.2%) | 0 (0.0%) |
| 6:00 AM to 6:29 AM | 38 (14.8%) | 0 (0.0%) |
| 6:30 AM to 6:59 AM | 22 (8.6%) | 0 (0.0%) |
| 7:00 AM to 7:29 AM | 0 (0.0%) | 0 (0.0%) |
| 7:30 AM to 7:59 AM | 46 (17.9%) | 26 (34.2%) |
| 8:00 AM to 8:29 AM | 0 (0.0%) | 21 (27.6%) |
| 8:30 AM to 8:59 AM | 22 (8.6%) | 0 (0.0%) |
| 9:00 AM to 9:59 AM | 0 (0.0%) | 29 (38.2%) |
| 10:00 AM to 10:59 AM | 0 (0.0%) | 0 (0.0%) |
| 11:00 AM to 11:59 AM | 0 (0.0%) | 0 (0.0%) |
| 12:00 PM to 3:59 PM | 0 (0.0%) | 0 (0.0%) |
| 4:00 PM to 11:59 PM | 0 (0.0%) | 0 (0.0%) |
| Total | 257 (100.0%) | 76 (100.0%) |
Housing Occupancy in Tabernash
Occupancy by Ownership in Tabernash
Of the total 209 dwellings in Tabernash, owner-occupied units account for 164 (78.5%), while renter-occupied units make up 45 (21.5%).
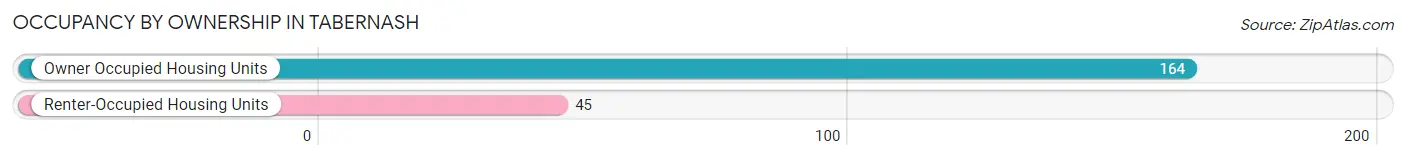
| Occupancy | # Housing Units | % Housing Units |
| Owner Occupied Housing Units | 164 | 78.5% |
| Renter-Occupied Housing Units | 45 | 21.5% |
| Total Occupied Housing Units | 209 | 100.0% |
Occupancy by Household Size in Tabernash
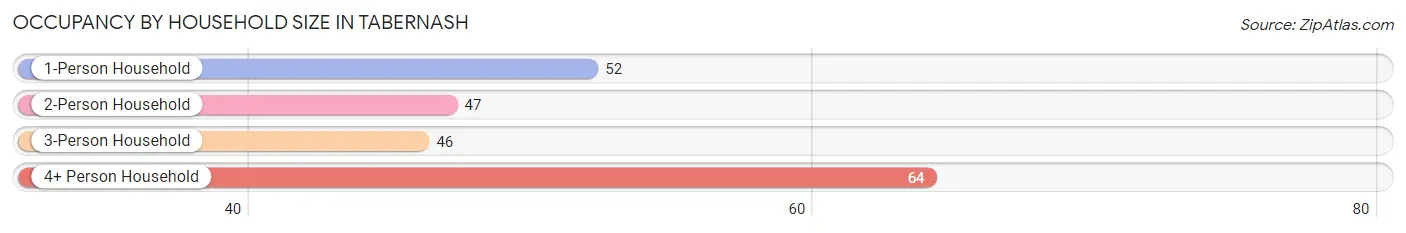
| Household Size | # Housing Units | % Housing Units |
| 1-Person Household | 52 | 24.9% |
| 2-Person Household | 47 | 22.5% |
| 3-Person Household | 46 | 22.0% |
| 4+ Person Household | 64 | 30.6% |
| Total Housing Units | 209 | 100.0% |
Occupancy by Ownership by Household Size in Tabernash
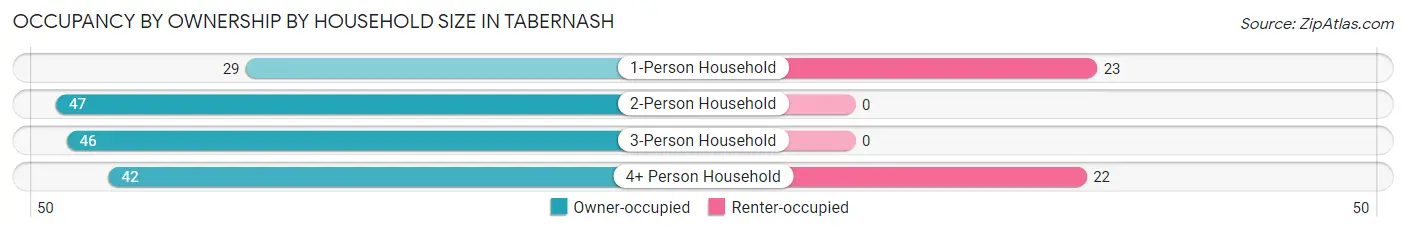
| Household Size | Owner-occupied | Renter-occupied |
| 1-Person Household | 29 (55.8%) | 23 (44.2%) |
| 2-Person Household | 47 (100.0%) | 0 (0.0%) |
| 3-Person Household | 46 (100.0%) | 0 (0.0%) |
| 4+ Person Household | 42 (65.6%) | 22 (34.4%) |
| Total Housing Units | 164 (78.5%) | 45 (21.5%) |
Occupancy by Educational Attainment in Tabernash
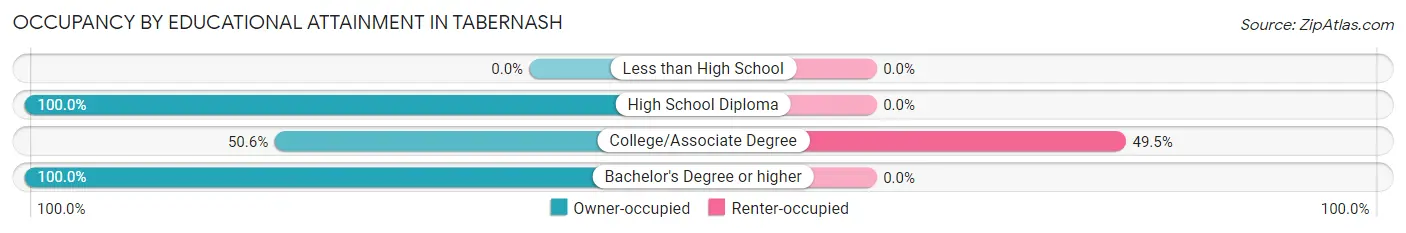
| Household Size | Owner-occupied | Renter-occupied |
| Less than High School | 0 (0.0%) | 0 (0.0%) |
| High School Diploma | 29 (100.0%) | 0 (0.0%) |
| College/Associate Degree | 46 (50.5%) | 45 (49.4%) |
| Bachelor's Degree or higher | 89 (100.0%) | 0 (0.0%) |
Occupancy by Age of Householder in Tabernash
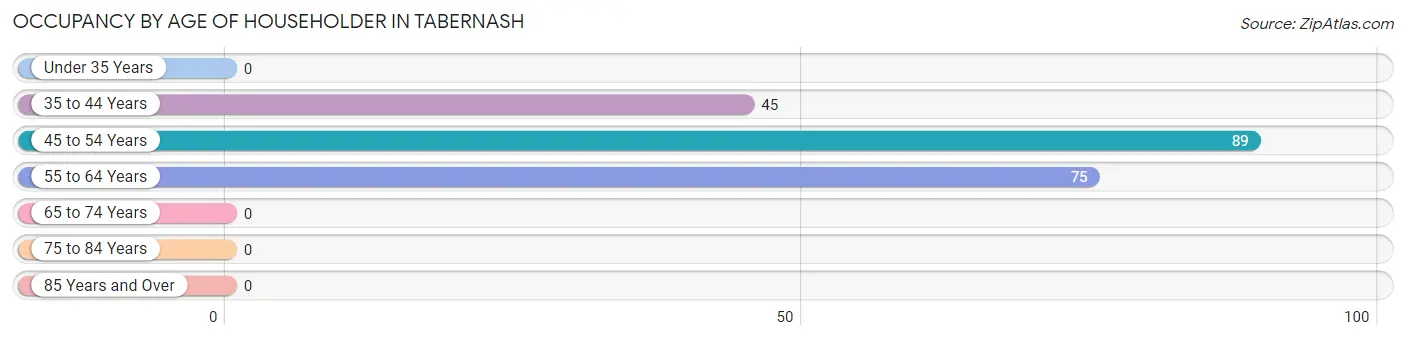
| Age Bracket | # Households | % Households |
| Under 35 Years | 0 | 0.0% |
| 35 to 44 Years | 45 | 21.5% |
| 45 to 54 Years | 89 | 42.6% |
| 55 to 64 Years | 75 | 35.9% |
| 65 to 74 Years | 0 | 0.0% |
| 75 to 84 Years | 0 | 0.0% |
| 85 Years and Over | 0 | 0.0% |
| Total | 209 | 100.0% |
Housing Finances in Tabernash
Median Income by Occupancy in Tabernash
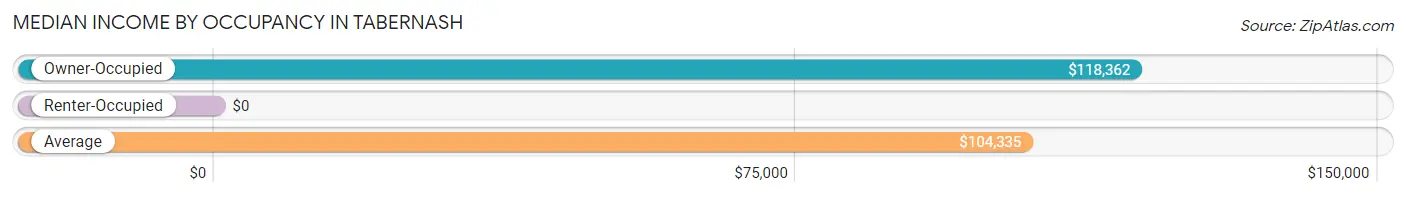
| Occupancy Type | # Households | Median Income |
| Owner-Occupied | 164 (78.5%) | $118,362 |
| Renter-Occupied | 45 (21.5%) | $0 |
| Average | 209 (100.0%) | $104,335 |
Occupancy by Householder Income Bracket in Tabernash
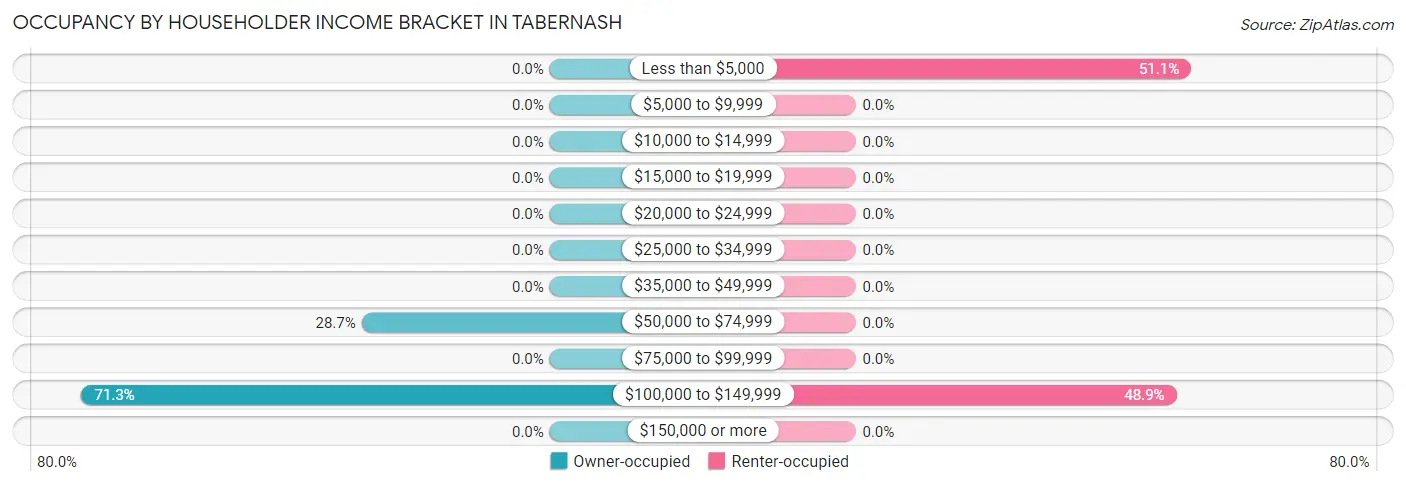
| Income Bracket | Owner-occupied | Renter-occupied |
| Less than $5,000 | 0 (0.0%) | 23 (51.1%) |
| $5,000 to $9,999 | 0 (0.0%) | 0 (0.0%) |
| $10,000 to $14,999 | 0 (0.0%) | 0 (0.0%) |
| $15,000 to $19,999 | 0 (0.0%) | 0 (0.0%) |
| $20,000 to $24,999 | 0 (0.0%) | 0 (0.0%) |
| $25,000 to $34,999 | 0 (0.0%) | 0 (0.0%) |
| $35,000 to $49,999 | 0 (0.0%) | 0 (0.0%) |
| $50,000 to $74,999 | 47 (28.7%) | 0 (0.0%) |
| $75,000 to $99,999 | 0 (0.0%) | 0 (0.0%) |
| $100,000 to $149,999 | 117 (71.3%) | 22 (48.9%) |
| $150,000 or more | 0 (0.0%) | 0 (0.0%) |
| Total | 164 (100.0%) | 45 (100.0%) |
Monthly Housing Cost Tiers in Tabernash
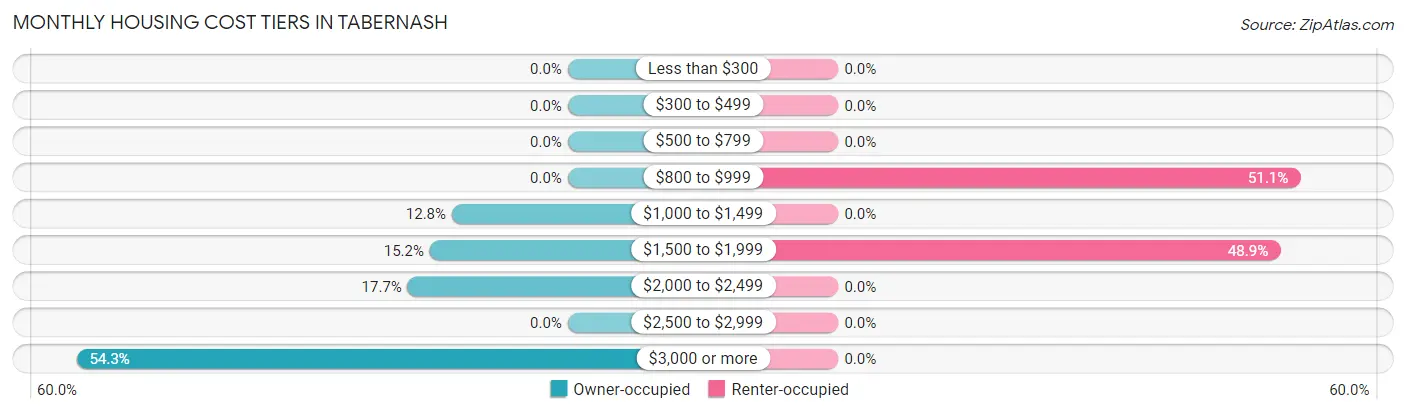
| Monthly Cost | Owner-occupied | Renter-occupied |
| Less than $300 | 0 (0.0%) | 0 (0.0%) |
| $300 to $499 | 0 (0.0%) | 0 (0.0%) |
| $500 to $799 | 0 (0.0%) | 0 (0.0%) |
| $800 to $999 | 0 (0.0%) | 23 (51.1%) |
| $1,000 to $1,499 | 21 (12.8%) | 0 (0.0%) |
| $1,500 to $1,999 | 25 (15.2%) | 22 (48.9%) |
| $2,000 to $2,499 | 29 (17.7%) | 0 (0.0%) |
| $2,500 to $2,999 | 0 (0.0%) | 0 (0.0%) |
| $3,000 or more | 89 (54.3%) | 0 (0.0%) |
| Total | 164 (100.0%) | 45 (100.0%) |
Physical Housing Characteristics in Tabernash
Housing Structures in Tabernash
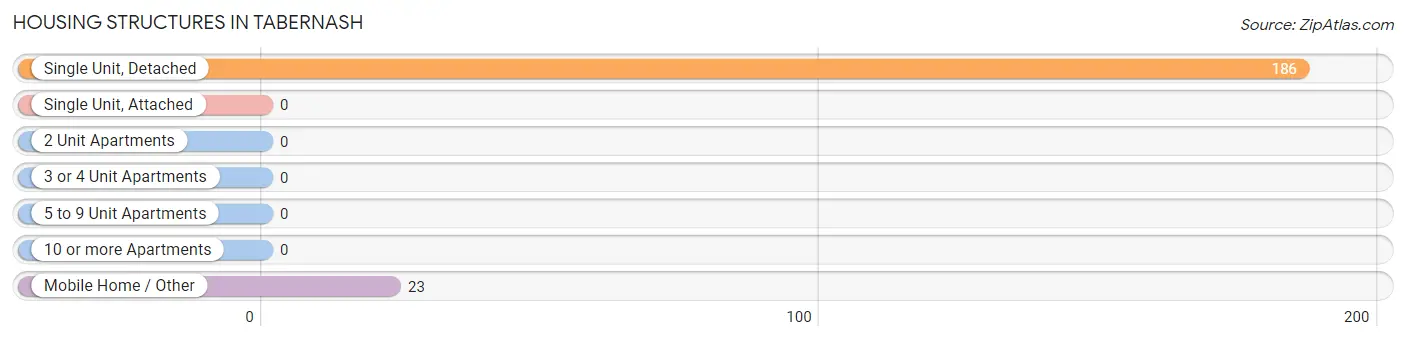
| Structure Type | # Housing Units | % Housing Units |
| Single Unit, Detached | 186 | 89.0% |
| Single Unit, Attached | 0 | 0.0% |
| 2 Unit Apartments | 0 | 0.0% |
| 3 or 4 Unit Apartments | 0 | 0.0% |
| 5 to 9 Unit Apartments | 0 | 0.0% |
| 10 or more Apartments | 0 | 0.0% |
| Mobile Home / Other | 23 | 11.0% |
| Total | 209 | 100.0% |
Housing Structures by Occupancy in Tabernash
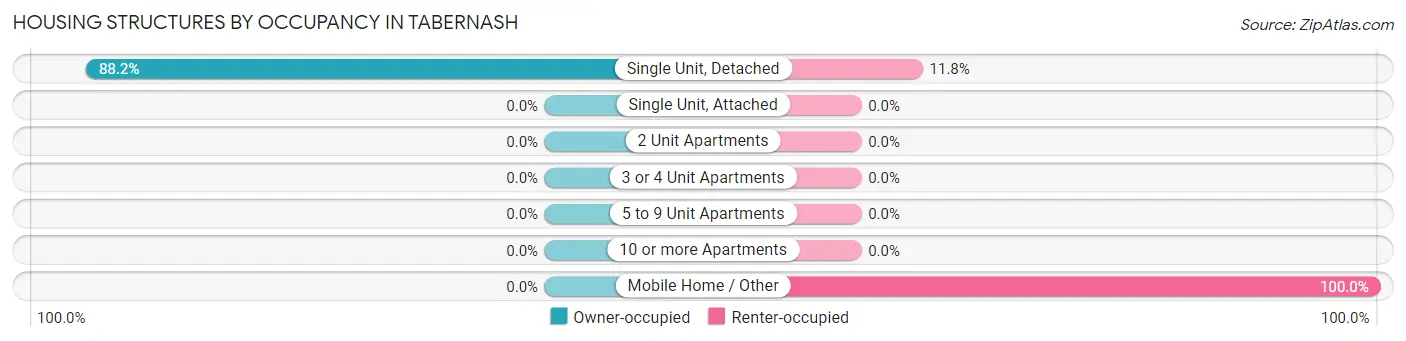
| Structure Type | Owner-occupied | Renter-occupied |
| Single Unit, Detached | 164 (88.2%) | 22 (11.8%) |
| Single Unit, Attached | 0 (0.0%) | 0 (0.0%) |
| 2 Unit Apartments | 0 (0.0%) | 0 (0.0%) |
| 3 or 4 Unit Apartments | 0 (0.0%) | 0 (0.0%) |
| 5 to 9 Unit Apartments | 0 (0.0%) | 0 (0.0%) |
| 10 or more Apartments | 0 (0.0%) | 0 (0.0%) |
| Mobile Home / Other | 0 (0.0%) | 23 (100.0%) |
| Total | 164 (78.5%) | 45 (21.5%) |
Housing Structures by Number of Rooms in Tabernash
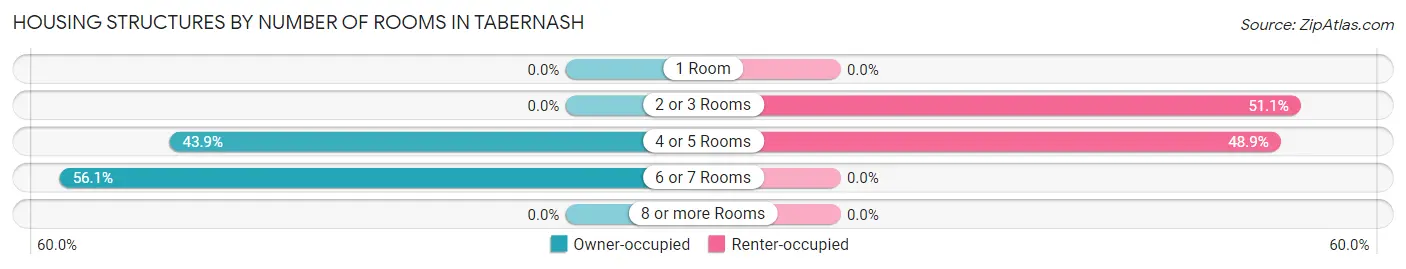
| Number of Rooms | Owner-occupied | Renter-occupied |
| 1 Room | 0 (0.0%) | 0 (0.0%) |
| 2 or 3 Rooms | 0 (0.0%) | 23 (51.1%) |
| 4 or 5 Rooms | 72 (43.9%) | 22 (48.9%) |
| 6 or 7 Rooms | 92 (56.1%) | 0 (0.0%) |
| 8 or more Rooms | 0 (0.0%) | 0 (0.0%) |
| Total | 164 (100.0%) | 45 (100.0%) |
Housing Structure by Heating Type in Tabernash
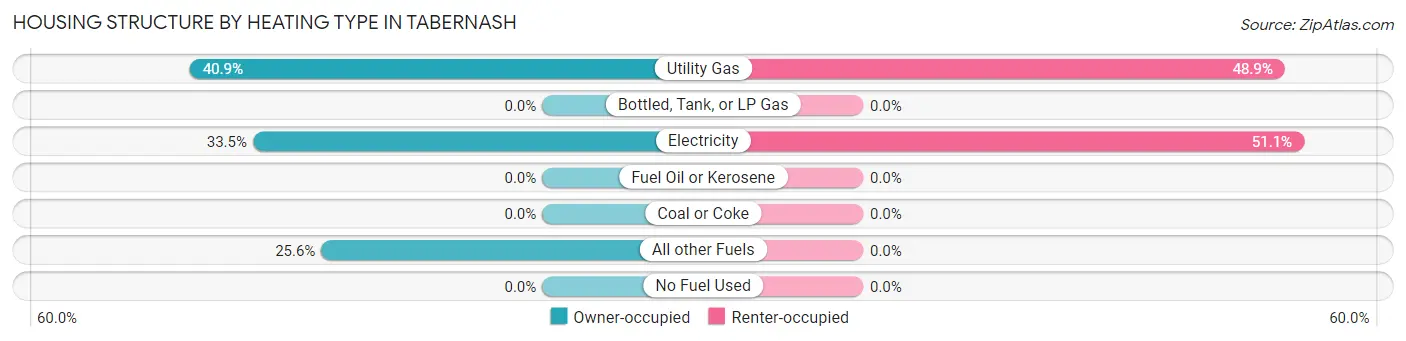
| Heating Type | Owner-occupied | Renter-occupied |
| Utility Gas | 67 (40.8%) | 22 (48.9%) |
| Bottled, Tank, or LP Gas | 0 (0.0%) | 0 (0.0%) |
| Electricity | 55 (33.5%) | 23 (51.1%) |
| Fuel Oil or Kerosene | 0 (0.0%) | 0 (0.0%) |
| Coal or Coke | 0 (0.0%) | 0 (0.0%) |
| All other Fuels | 42 (25.6%) | 0 (0.0%) |
| No Fuel Used | 0 (0.0%) | 0 (0.0%) |
| Total | 164 (100.0%) | 45 (100.0%) |
Household Vehicle Usage in Tabernash
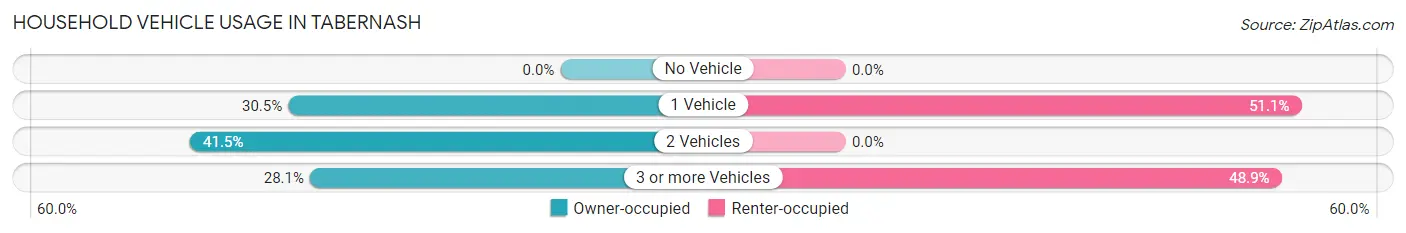
| Vehicles per Household | Owner-occupied | Renter-occupied |
| No Vehicle | 0 (0.0%) | 0 (0.0%) |
| 1 Vehicle | 50 (30.5%) | 23 (51.1%) |
| 2 Vehicles | 68 (41.5%) | 0 (0.0%) |
| 3 or more Vehicles | 46 (28.1%) | 22 (48.9%) |
| Total | 164 (100.0%) | 45 (100.0%) |
Real Estate & Mortgages in Tabernash
Real Estate and Mortgage Overview in Tabernash
| Characteristic | Without Mortgage | With Mortgage |
| Housing Units | 0 | 164 |
| Median Property Value | - | - |
| Median Household Income | - | - |
| Monthly Housing Costs | - | - |
| Real Estate Taxes | - | - |
Property Value by Mortgage Status in Tabernash
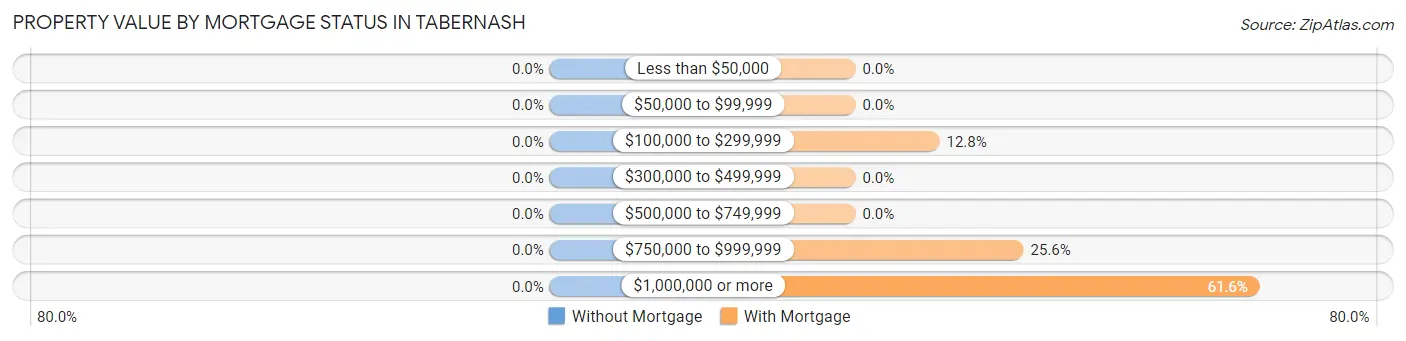
| Property Value | Without Mortgage | With Mortgage |
| Less than $50,000 | 0 (0.0%) | 0 (0.0%) |
| $50,000 to $99,999 | 0 (0.0%) | 0 (0.0%) |
| $100,000 to $299,999 | 0 (0.0%) | 21 (12.8%) |
| $300,000 to $499,999 | 0 (0.0%) | 0 (0.0%) |
| $500,000 to $749,999 | 0 (0.0%) | 0 (0.0%) |
| $750,000 to $999,999 | 0 (0.0%) | 42 (25.6%) |
| $1,000,000 or more | 0 (0.0%) | 101 (61.6%) |
| Total | 0 (0.0%) | 164 (100.0%) |
Household Income by Mortgage Status in Tabernash
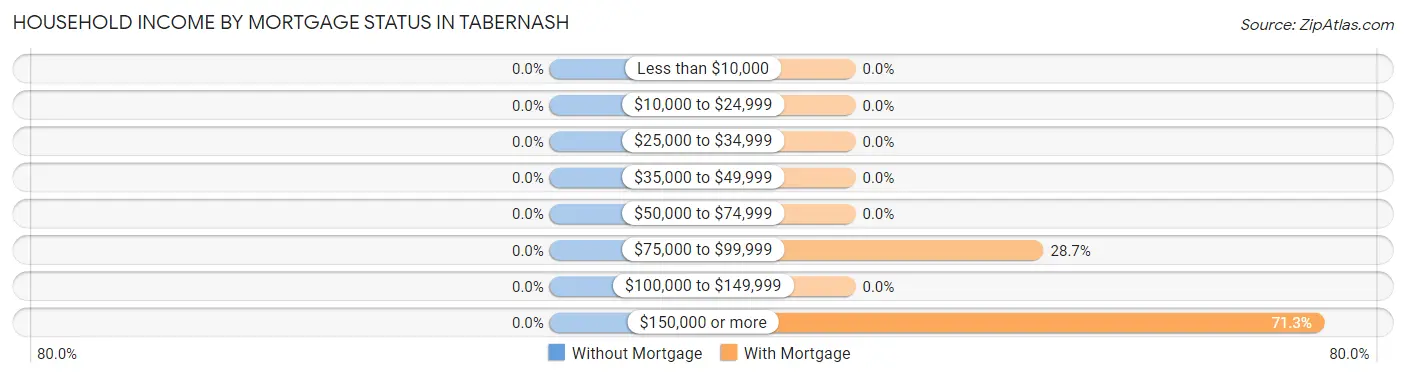
| Household Income | Without Mortgage | With Mortgage |
| Less than $10,000 | 0 (0.0%) | 0 (0.0%) |
| $10,000 to $24,999 | 0 (0.0%) | 0 (0.0%) |
| $25,000 to $34,999 | 0 (0.0%) | 0 (0.0%) |
| $35,000 to $49,999 | 0 (0.0%) | 0 (0.0%) |
| $50,000 to $74,999 | 0 (0.0%) | 0 (0.0%) |
| $75,000 to $99,999 | 0 (0.0%) | 47 (28.7%) |
| $100,000 to $149,999 | 0 (0.0%) | 0 (0.0%) |
| $150,000 or more | 0 (0.0%) | 117 (71.3%) |
| Total | 0 (0.0%) | 164 (100.0%) |
Property Value to Household Income Ratio in Tabernash
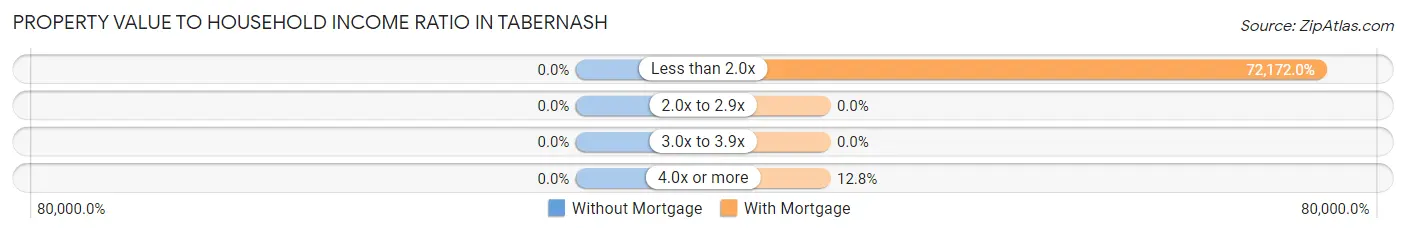
| Value-to-Income Ratio | Without Mortgage | With Mortgage |
| Less than 2.0x | 0 (0.0%) | 118,362 (72,172.0%) |
| 2.0x to 2.9x | 0 (0.0%) | 0 (0.0%) |
| 3.0x to 3.9x | 0 (0.0%) | 0 (0.0%) |
| 4.0x or more | 0 (0.0%) | 21 (12.8%) |
| Total | 0 (0.0%) | 164 (100.0%) |
Real Estate Taxes by Mortgage Status in Tabernash
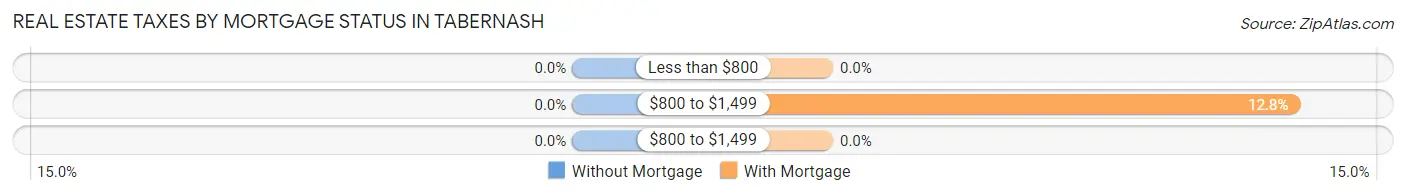
| Property Taxes | Without Mortgage | With Mortgage |
| Less than $800 | 0 (0.0%) | 0 (0.0%) |
| $800 to $1,499 | 0 (0.0%) | 21 (12.8%) |
| $800 to $1,499 | 0 (0.0%) | 0 (0.0%) |
| Total | 0 (0.0%) | 164 (100.0%) |
Health & Disability in Tabernash
Health Insurance Coverage by Age in Tabernash
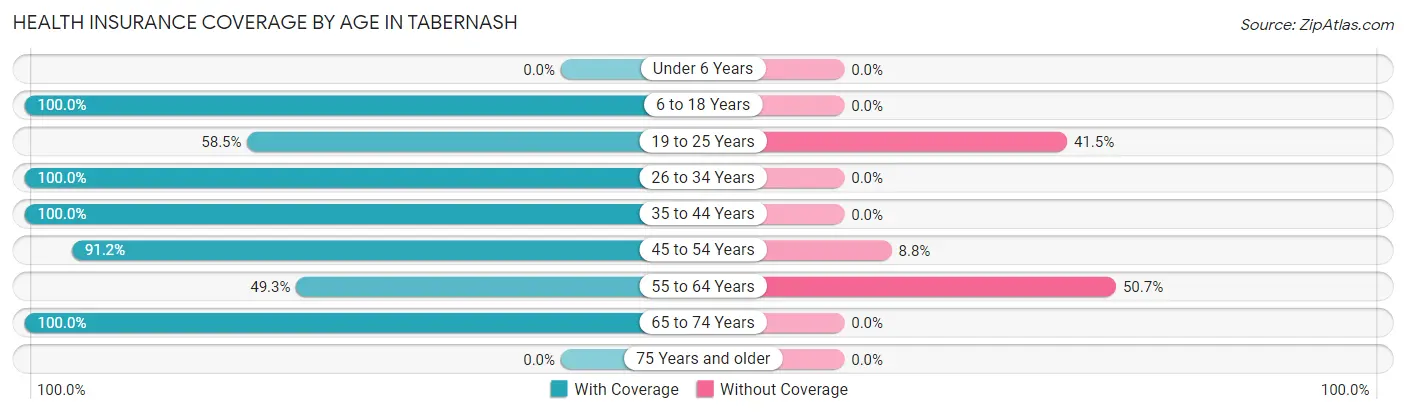
| Age Bracket | With Coverage | Without Coverage |
| Under 6 Years | 0 (0.0%) | 0 (0.0%) |
| 6 to 18 Years | 74 (100.0%) | 0 (0.0%) |
| 19 to 25 Years | 76 (58.5%) | 54 (41.5%) |
| 26 to 34 Years | 129 (100.0%) | 0 (0.0%) |
| 35 to 44 Years | 45 (100.0%) | 0 (0.0%) |
| 45 to 54 Years | 217 (91.2%) | 21 (8.8%) |
| 55 to 64 Years | 75 (49.3%) | 77 (50.7%) |
| 65 to 74 Years | 23 (100.0%) | 0 (0.0%) |
| 75 Years and older | 0 (0.0%) | 0 (0.0%) |
| Total | 639 (80.8%) | 152 (19.2%) |
Health Insurance Coverage by Citizenship Status in Tabernash
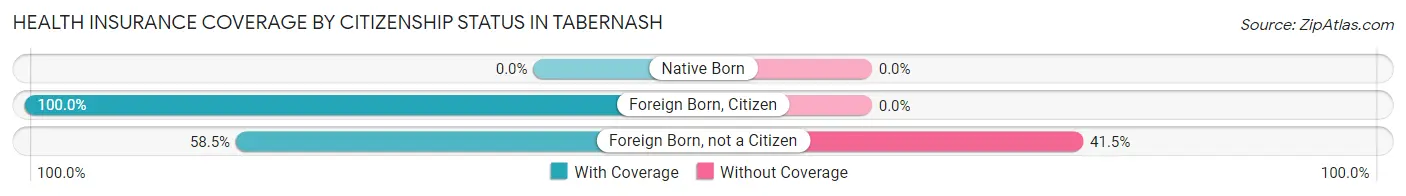
| Citizenship Status | With Coverage | Without Coverage |
| Native Born | 0 (0.0%) | 0 (0.0%) |
| Foreign Born, Citizen | 74 (100.0%) | 0 (0.0%) |
| Foreign Born, not a Citizen | 76 (58.5%) | 54 (41.5%) |
Health Insurance Coverage by Household Income in Tabernash
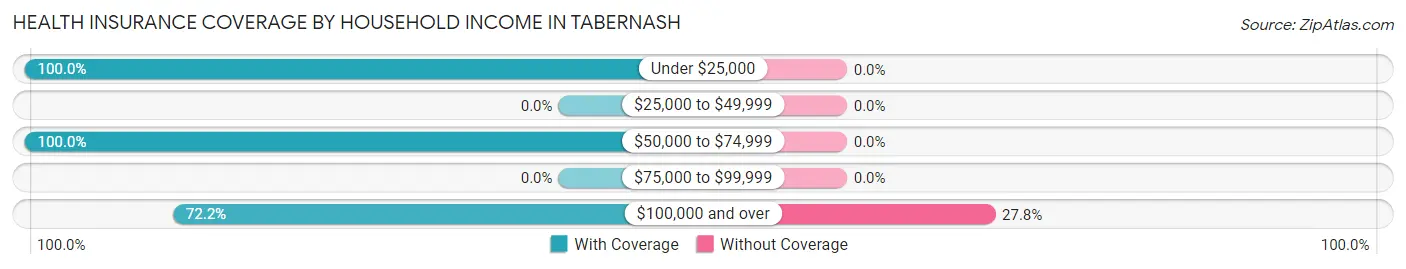
| Household Income | With Coverage | Without Coverage |
| Under $25,000 | 23 (100.0%) | 0 (0.0%) |
| $25,000 to $49,999 | 0 (0.0%) | 0 (0.0%) |
| $50,000 to $74,999 | 221 (100.0%) | 0 (0.0%) |
| $75,000 to $99,999 | 0 (0.0%) | 0 (0.0%) |
| $100,000 and over | 395 (72.2%) | 152 (27.8%) |
Public vs Private Health Insurance Coverage by Age in Tabernash
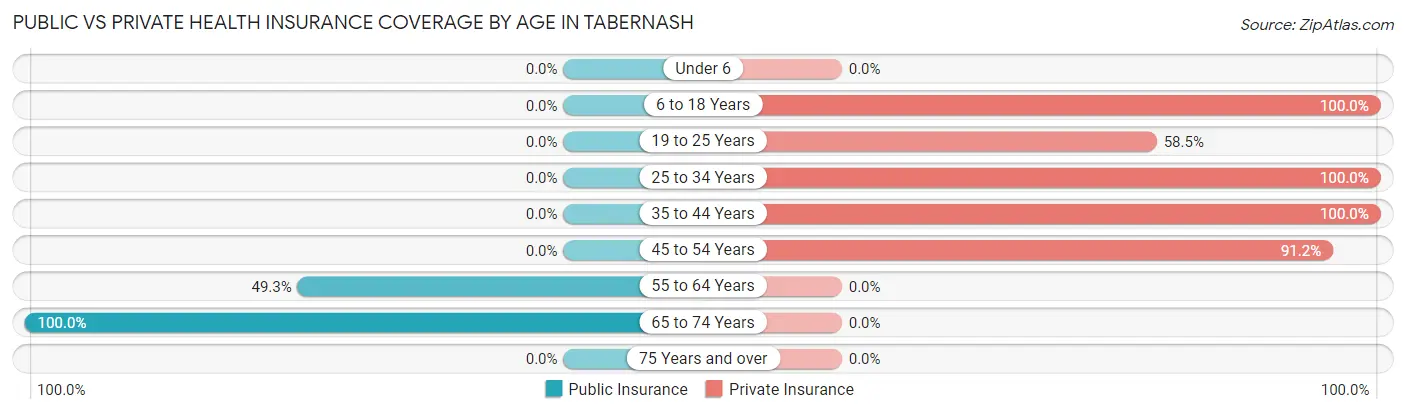
| Age Bracket | Public Insurance | Private Insurance |
| Under 6 | 0 (0.0%) | 0 (0.0%) |
| 6 to 18 Years | 0 (0.0%) | 74 (100.0%) |
| 19 to 25 Years | 0 (0.0%) | 76 (58.5%) |
| 25 to 34 Years | 0 (0.0%) | 129 (100.0%) |
| 35 to 44 Years | 0 (0.0%) | 45 (100.0%) |
| 45 to 54 Years | 0 (0.0%) | 217 (91.2%) |
| 55 to 64 Years | 75 (49.3%) | 0 (0.0%) |
| 65 to 74 Years | 23 (100.0%) | 0 (0.0%) |
| 75 Years and over | 0 (0.0%) | 0 (0.0%) |
| Total | 98 (12.4%) | 541 (68.4%) |
Disability Status by Sex by Age in Tabernash
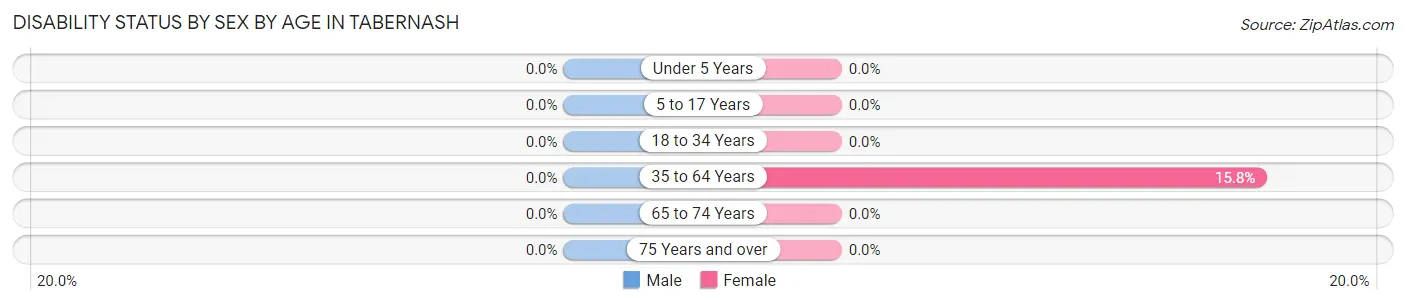
| Age Bracket | Male | Female |
| Under 5 Years | 0 (0.0%) | 0 (0.0%) |
| 5 to 17 Years | 0 (0.0%) | 0 (0.0%) |
| 18 to 34 Years | 0 (0.0%) | 0 (0.0%) |
| 35 to 64 Years | 0 (0.0%) | 21 (15.8%) |
| 65 to 74 Years | 0 (0.0%) | 0 (0.0%) |
| 75 Years and over | 0 (0.0%) | 0 (0.0%) |
Disability Class by Sex by Age in Tabernash
Disability Class: Hearing Difficulty
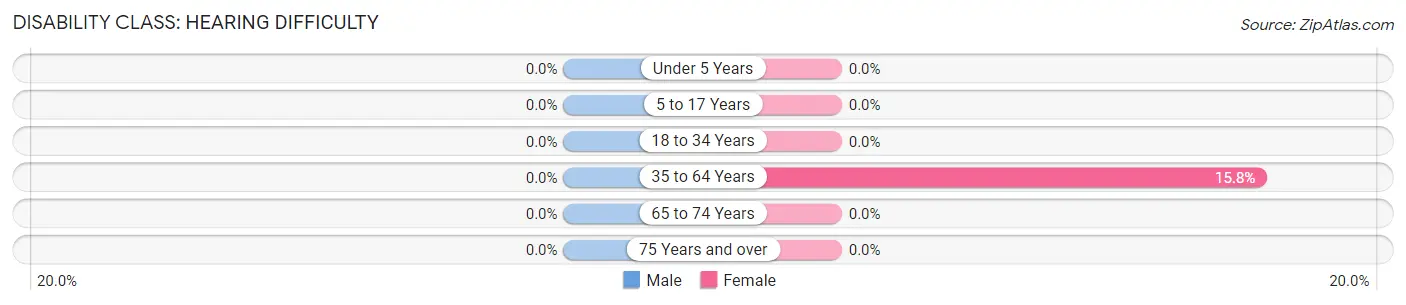
| Age Bracket | Male | Female |
| Under 5 Years | 0 (0.0%) | 0 (0.0%) |
| 5 to 17 Years | 0 (0.0%) | 0 (0.0%) |
| 18 to 34 Years | 0 (0.0%) | 0 (0.0%) |
| 35 to 64 Years | 0 (0.0%) | 21 (15.8%) |
| 65 to 74 Years | 0 (0.0%) | 0 (0.0%) |
| 75 Years and over | 0 (0.0%) | 0 (0.0%) |
Disability Class: Vision Difficulty
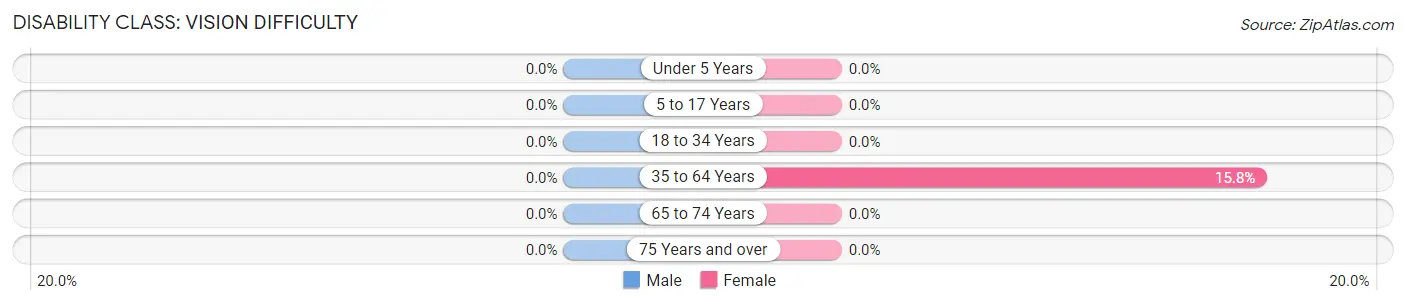
| Age Bracket | Male | Female |
| Under 5 Years | 0 (0.0%) | 0 (0.0%) |
| 5 to 17 Years | 0 (0.0%) | 0 (0.0%) |
| 18 to 34 Years | 0 (0.0%) | 0 (0.0%) |
| 35 to 64 Years | 0 (0.0%) | 21 (15.8%) |
| 65 to 74 Years | 0 (0.0%) | 0 (0.0%) |
| 75 Years and over | 0 (0.0%) | 0 (0.0%) |
Disability Class: Cognitive Difficulty
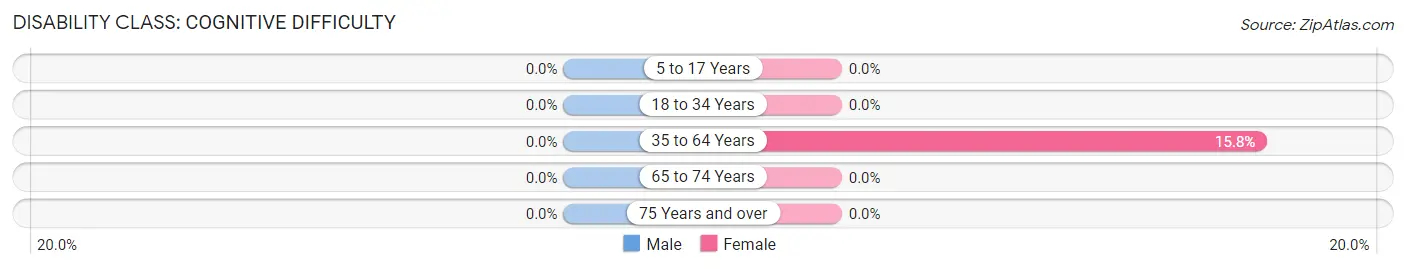
| Age Bracket | Male | Female |
| 5 to 17 Years | 0 (0.0%) | 0 (0.0%) |
| 18 to 34 Years | 0 (0.0%) | 0 (0.0%) |
| 35 to 64 Years | 0 (0.0%) | 21 (15.8%) |
| 65 to 74 Years | 0 (0.0%) | 0 (0.0%) |
| 75 Years and over | 0 (0.0%) | 0 (0.0%) |
Disability Class: Ambulatory Difficulty
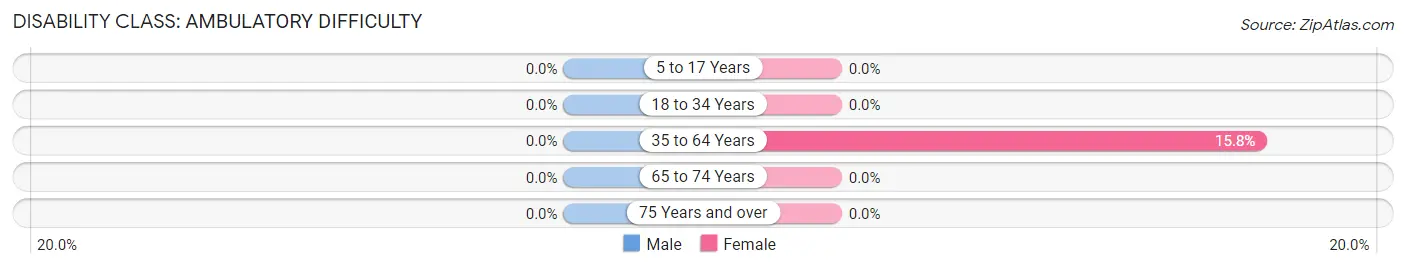
| Age Bracket | Male | Female |
| 5 to 17 Years | 0 (0.0%) | 0 (0.0%) |
| 18 to 34 Years | 0 (0.0%) | 0 (0.0%) |
| 35 to 64 Years | 0 (0.0%) | 21 (15.8%) |
| 65 to 74 Years | 0 (0.0%) | 0 (0.0%) |
| 75 Years and over | 0 (0.0%) | 0 (0.0%) |
Disability Class: Self-Care Difficulty
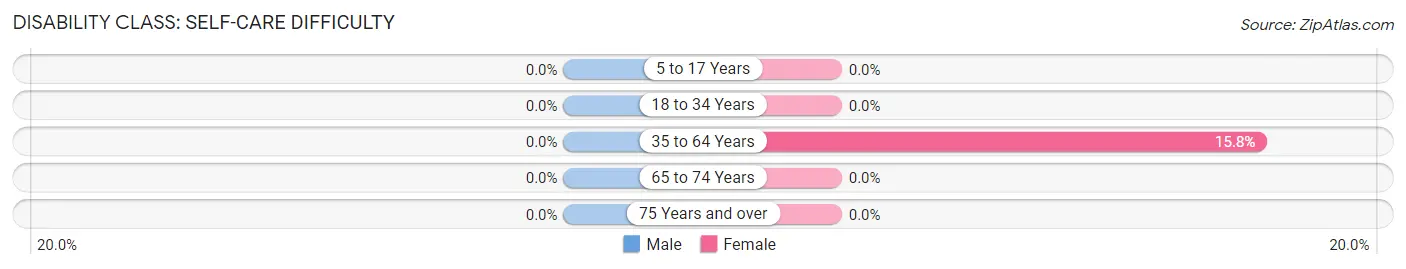
| Age Bracket | Male | Female |
| 5 to 17 Years | 0 (0.0%) | 0 (0.0%) |
| 18 to 34 Years | 0 (0.0%) | 0 (0.0%) |
| 35 to 64 Years | 0 (0.0%) | 21 (15.8%) |
| 65 to 74 Years | 0 (0.0%) | 0 (0.0%) |
| 75 Years and over | 0 (0.0%) | 0 (0.0%) |
Technology Access in Tabernash
Computing Device Access in Tabernash
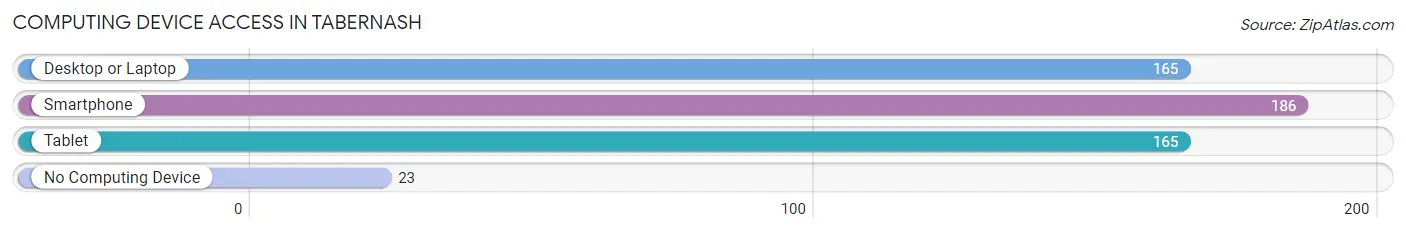
| Device Type | # Households | % Households |
| Desktop or Laptop | 165 | 78.9% |
| Smartphone | 186 | 89.0% |
| Tablet | 165 | 78.9% |
| No Computing Device | 23 | 11.0% |
| Total | 209 | 100.0% |
Internet Access in Tabernash
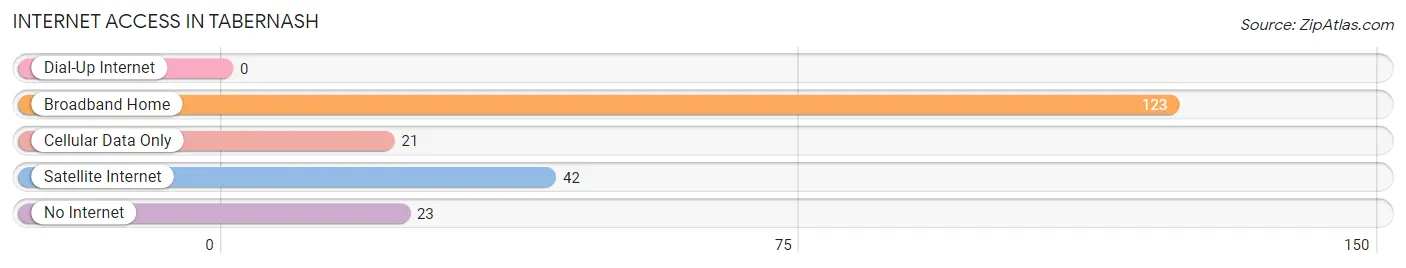
| Internet Type | # Households | % Households |
| Dial-Up Internet | 0 | 0.0% |
| Broadband Home | 123 | 58.9% |
| Cellular Data Only | 21 | 10.1% |
| Satellite Internet | 42 | 20.1% |
| No Internet | 23 | 11.0% |
| Total | 209 | 100.0% |
Tabernash Summary
Tabernash is a small unincorporated community located in Grand County, Colorado. It is situated in the Fraser Valley, approximately 8 miles north of the town of Fraser and 8 miles south of the town of Granby. The population of Tabernash was estimated to be 545 in 2019.
History
Tabernash was originally inhabited by the Ute Indians, who used the area for hunting and gathering. The first settlers arrived in the area in the late 1800s, and the town was officially established in 1891. The town was named after a Ute Indian chief, Chief Tabernash.
The town was originally a farming and ranching community, and the first post office was established in 1892. In the early 1900s, the town began to grow and develop, and the first school was built in 1910.
Geography
Tabernash is located in the Fraser Valley, at an elevation of 8,000 feet. The town is surrounded by the Rocky Mountains, and is located near the headwaters of the Colorado River. The Fraser River runs through the town, and the Fraser Valley is known for its scenic beauty.
The climate in Tabernash is semi-arid, with hot summers and cold winters. The average annual temperature is 45°F, and the average annual precipitation is 16 inches.
Economy
The economy of Tabernash is largely based on tourism and recreation. The town is home to several ski resorts, including Winter Park Resort, which is the largest ski resort in Colorado. The town is also home to several restaurants, shops, and other businesses.
In addition to tourism and recreation, Tabernash is also home to several small businesses, including a brewery, a winery, and a distillery. The town is also home to several farms and ranches, which produce hay, beef, and other agricultural products.
Demographics
The population of Tabernash was estimated to be 545 in 2019. The town is predominantly white, with a small Hispanic population. The median household income in Tabernash is $60,000, and the median home value is $400,000.
Tabernash is a small, close-knit community, and the town is known for its friendly atmosphere and welcoming attitude. The town is home to several churches, and the community is very active in local events and activities.
Conclusion
Tabernash is a small unincorporated community located in Grand County, Colorado. It is situated in the Fraser Valley, and is known for its scenic beauty and friendly atmosphere. The town is home to several ski resorts, restaurants, shops, and other businesses, and the economy is largely based on tourism and recreation. The population of Tabernash was estimated to be 545 in 2019, and the town is predominantly white, with a small Hispanic population. Tabernash is a close-knit community, and the town is known for its friendly atmosphere and welcoming attitude.
Common Questions
What is Per Capita Income in Tabernash?
Per Capita income in Tabernash is $34,428.
What is the Median Household income in Tabernash?
Median Household Income in Tabernash is $104,335.
What is Income or Wage Gap in Tabernash?
Income or Wage Gap in Tabernash is 10.7%.
Women in Tabernash earn 89.3 cents for every dollar earned by a man.
What is Inequality or Gini Index in Tabernash?
Inequality or Gini Index in Tabernash is 0.23.
What is the Total Population of Tabernash?
Total Population of Tabernash is 791.
What is the Total Male Population of Tabernash?
Total Male Population of Tabernash is 530.
What is the Total Female Population of Tabernash?
Total Female Population of Tabernash is 261.
What is the Ratio of Males per 100 Females in Tabernash?
There are 203.07 Males per 100 Females in Tabernash.
What is the Ratio of Females per 100 Males in Tabernash?
There are 49.25 Females per 100 Males in Tabernash.
What is the Median Population Age in Tabernash?
Median Population Age in Tabernash is 45.3 Years.
What is the Average Family Size in Tabernash
Average Family Size in Tabernash is 4.2 People.
What is the Average Household Size in Tabernash
Average Household Size in Tabernash is 3.8 People.
How Large is the Labor Force in Tabernash?
There are 493 People in the Labor Forcein in Tabernash.
What is the Percentage of People in the Labor Force in Tabernash?
68.8% of People are in the Labor Force in Tabernash.
What is the Unemployment Rate in Tabernash?
Unemployment Rate in Tabernash is 4.7%.