Holly Hills, CO Map & Demographics
Holly Hills Map
Holly Hills Overview
$62,356
PER CAPITA INCOME
$155,417
AVG FAMILY INCOME
$129,700
AVG HOUSEHOLD INCOME
5.1%
WAGE / INCOME GAP [ % ]
94.9¢/ $1
WAGE / INCOME GAP [ $ ]
0.42
INEQUALITY / GINI INDEX
2,801
TOTAL POPULATION
1,434
MALE POPULATION
1,367
FEMALE POPULATION
104.90
MALES / 100 FEMALES
95.33
FEMALES / 100 MALES
42.4
MEDIAN AGE
3.0
AVG FAMILY SIZE
2.6
AVG HOUSEHOLD SIZE
1,537
LABOR FORCE [ PEOPLE ]
66.3%
PERCENT IN LABOR FORCE
1.3%
UNEMPLOYMENT RATE
Income in Holly Hills
Income Overview in Holly Hills
Per Capita Income in Holly Hills is $62,356, while median incomes of families and households are $155,417 and $129,700 respectively.
| Characteristic | Number | Measure |
| Per Capita Income | 2,801 | $62,356 |
| Median Family Income | 700 | $155,417 |
| Mean Family Income | 700 | $181,663 |
| Median Household Income | 1,004 | $129,700 |
| Mean Household Income | 1,004 | $164,752 |
| Income Deficit | 700 | $0 |
| Wage / Income Gap (%) | 2,801 | 5.06% |
| Wage / Income Gap ($) | 2,801 | 94.94¢ per $1 |
| Gini / Inequality Index | 2,801 | 0.42 |
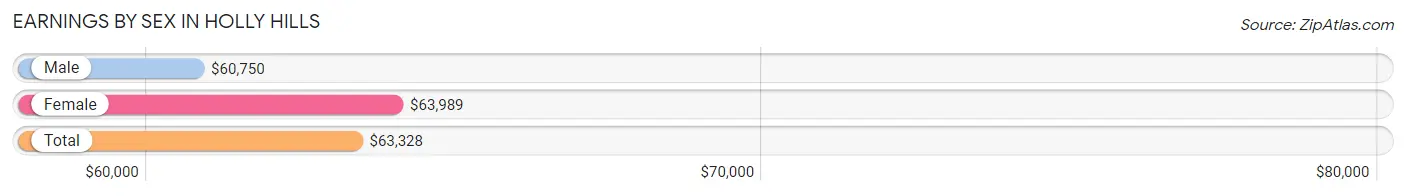
Earnings by Sex in Holly Hills
Average Earnings in Holly Hills are $63,328, $60,750 for men and $63,989 for women, a difference of 5.1%.
| Sex | Number | Average Earnings |
| Male | 912 (55.9%) | $60,750 |
| Female | 719 (44.1%) | $63,989 |
| Total | 1,631 (100.0%) | $63,328 |
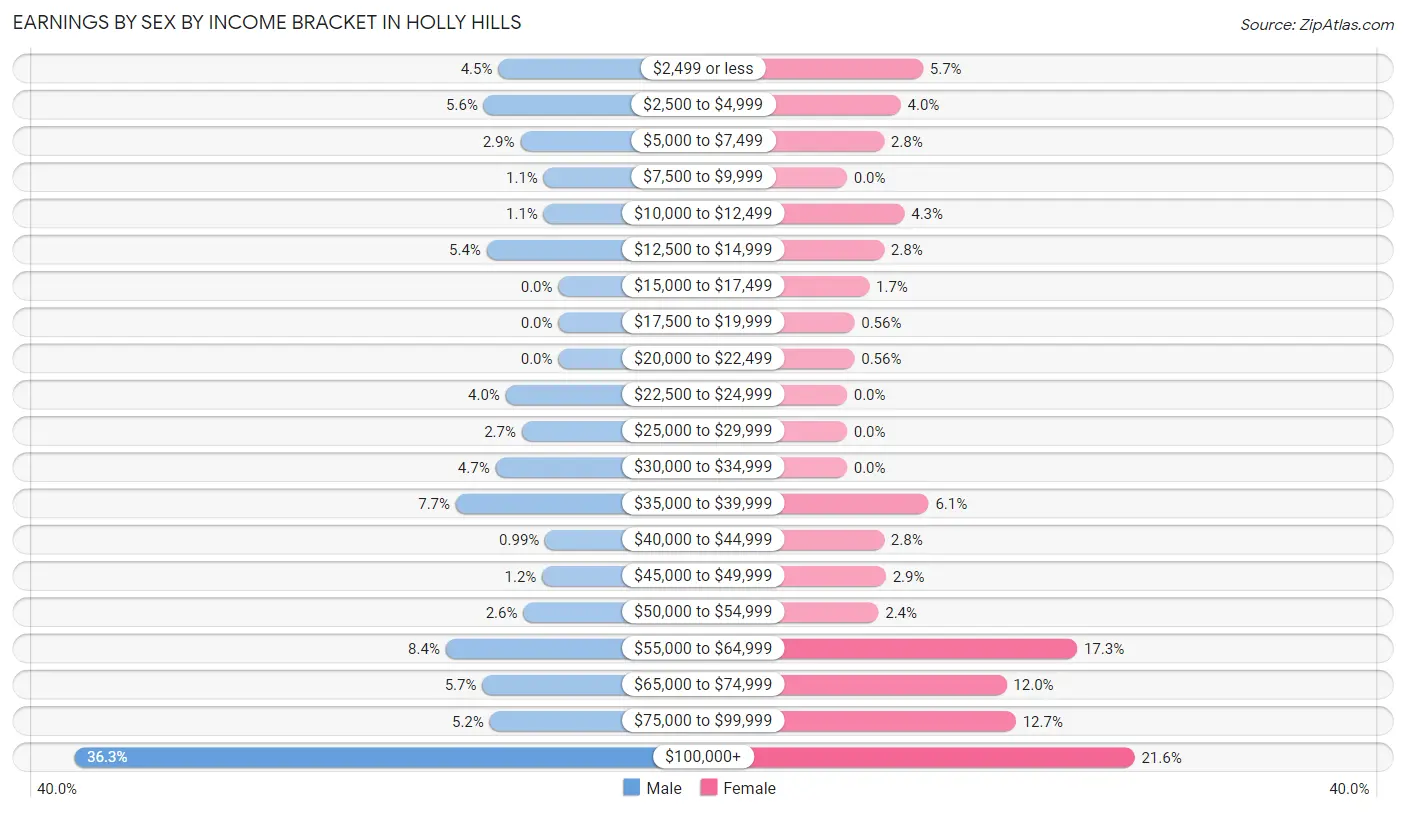
Earnings by Sex by Income Bracket in Holly Hills
The most common earnings brackets in Holly Hills are $100,000+ for men (331 | 36.3%) and $100,000+ for women (155 | 21.6%).
| Income | Male | Female |
| $2,499 or less | 41 (4.5%) | 41 (5.7%) |
| $2,500 to $4,999 | 51 (5.6%) | 29 (4.0%) |
| $5,000 to $7,499 | 26 (2.9%) | 20 (2.8%) |
| $7,500 to $9,999 | 10 (1.1%) | 0 (0.0%) |
| $10,000 to $12,499 | 10 (1.1%) | 31 (4.3%) |
| $12,500 to $14,999 | 49 (5.4%) | 20 (2.8%) |
| $15,000 to $17,499 | 0 (0.0%) | 12 (1.7%) |
| $17,500 to $19,999 | 0 (0.0%) | 4 (0.6%) |
| $20,000 to $22,499 | 0 (0.0%) | 4 (0.6%) |
| $22,500 to $24,999 | 36 (4.0%) | 0 (0.0%) |
| $25,000 to $29,999 | 25 (2.7%) | 0 (0.0%) |
| $30,000 to $34,999 | 43 (4.7%) | 0 (0.0%) |
| $35,000 to $39,999 | 70 (7.7%) | 44 (6.1%) |
| $40,000 to $44,999 | 9 (1.0%) | 20 (2.8%) |
| $45,000 to $49,999 | 11 (1.2%) | 21 (2.9%) |
| $50,000 to $54,999 | 24 (2.6%) | 17 (2.4%) |
| $55,000 to $64,999 | 77 (8.4%) | 124 (17.2%) |
| $65,000 to $74,999 | 52 (5.7%) | 86 (12.0%) |
| $75,000 to $99,999 | 47 (5.1%) | 91 (12.7%) |
| $100,000+ | 331 (36.3%) | 155 (21.6%) |
| Total | 912 (100.0%) | 719 (100.0%) |
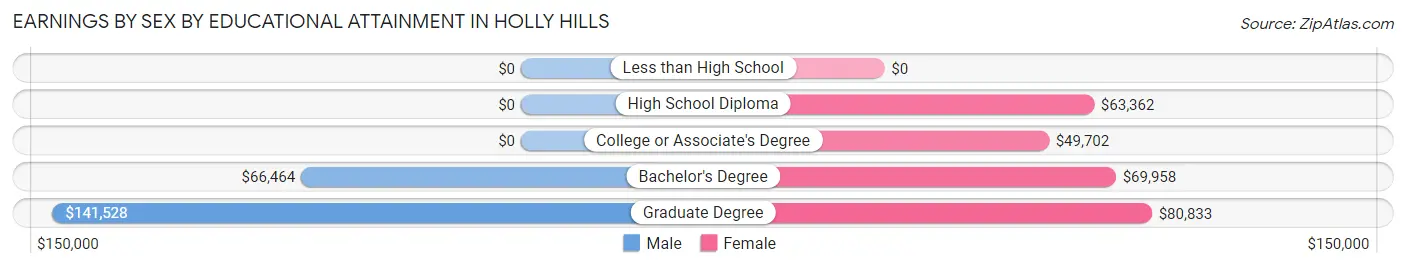
Earnings by Sex by Educational Attainment in Holly Hills
Average earnings in Holly Hills are $67,151 for men and $64,669 for women, a difference of 3.7%. Men with an educational attainment of graduate degree enjoy the highest average annual earnings of $141,528, while those with bachelor's degree education earn the least with $66,464. Women with an educational attainment of graduate degree earn the most with the average annual earnings of $80,833, while those with college or associate's degree education have the smallest earnings of $49,702.
| Educational Attainment | Male Income | Female Income |
| Less than High School | - | - |
| High School Diploma | - | - |
| College or Associate's Degree | - | - |
| Bachelor's Degree | $66,464 | $69,958 |
| Graduate Degree | $141,528 | $80,833 |
| Total | $67,151 | $64,669 |
Family Income in Holly Hills
Family Income Brackets in Holly Hills
According to the Holly Hills family income data, there are 286 families falling into the $200,000+ income range, which is the most common income bracket and makes up 40.9% of all families.
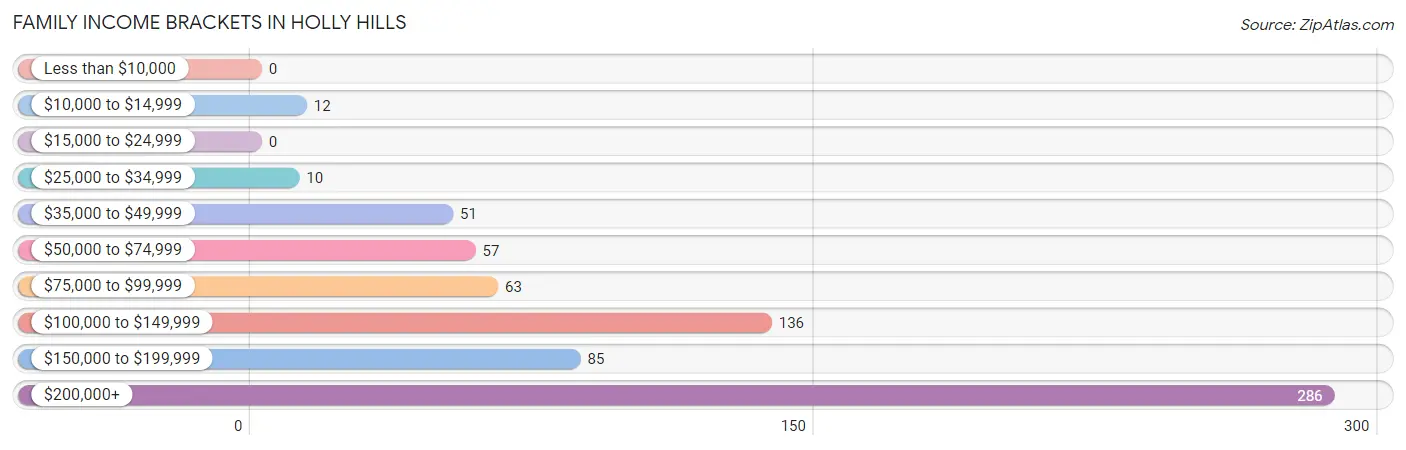
| Income Bracket | # Families | % Families |
| Less than $10,000 | 0 | 0.0% |
| $10,000 to $14,999 | 12 | 1.7% |
| $15,000 to $24,999 | 0 | 0.0% |
| $25,000 to $34,999 | 10 | 1.4% |
| $35,000 to $49,999 | 51 | 7.3% |
| $50,000 to $74,999 | 57 | 8.1% |
| $75,000 to $99,999 | 63 | 9.0% |
| $100,000 to $149,999 | 136 | 19.4% |
| $150,000 to $199,999 | 85 | 12.1% |
| $200,000+ | 286 | 40.9% |
Family Income by Famaliy Size in Holly Hills
5-person families (76 | 10.9%) account for the highest median family income in Holly Hills with $225,833 per family, while 2-person families (335 | 47.9%) have the highest median income of $65,375 per family member.
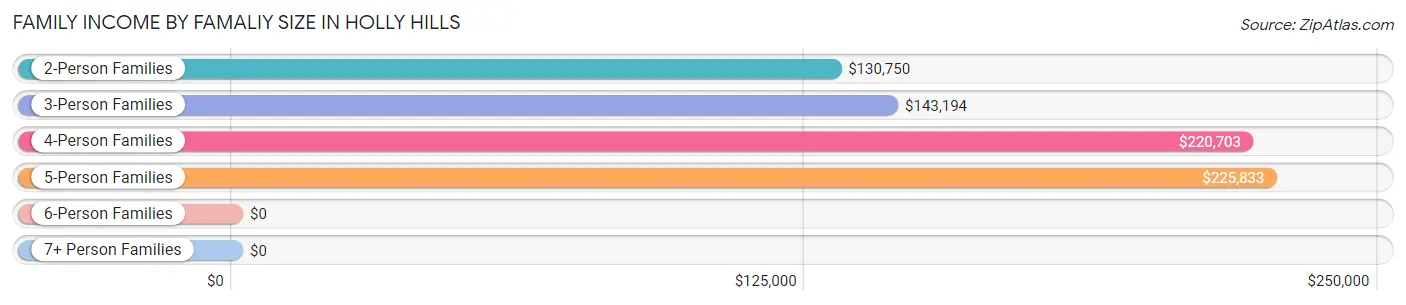
| Income Bracket | # Families | Median Income |
| 2-Person Families | 335 (47.9%) | $130,750 |
| 3-Person Families | 193 (27.6%) | $143,194 |
| 4-Person Families | 95 (13.6%) | $220,703 |
| 5-Person Families | 76 (10.9%) | $225,833 |
| 6-Person Families | 0 (0.0%) | $0 |
| 7+ Person Families | 1 (0.1%) | $0 |
| Total | 700 (100.0%) | $155,417 |
Family Income by Number of Earners in Holly Hills
The median family income in Holly Hills is $155,417, with families comprising 3+ earners (73) having the highest median family income of $250,001, while families with no earners (91) have the lowest median family income of $56,528, accounting for 10.4% and 13.0% of families, respectively.
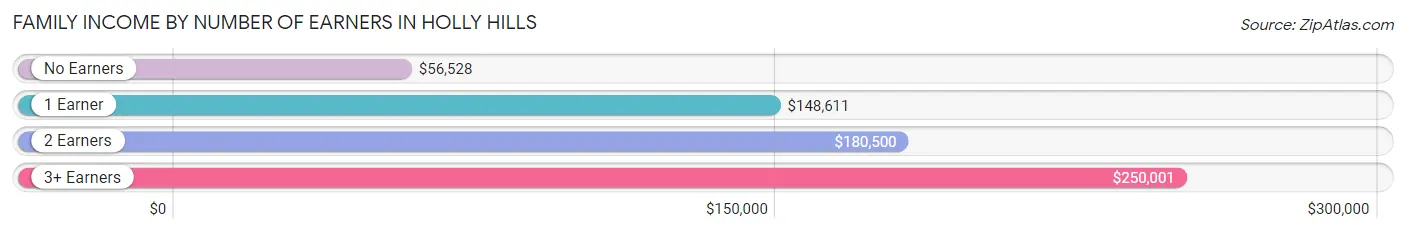
| Number of Earners | # Families | Median Income |
| No Earners | 91 (13.0%) | $56,528 |
| 1 Earner | 154 (22.0%) | $148,611 |
| 2 Earners | 382 (54.6%) | $180,500 |
| 3+ Earners | 73 (10.4%) | $250,001 |
| Total | 700 (100.0%) | $155,417 |
Household Income in Holly Hills
Household Income Brackets in Holly Hills
With 342 households falling in the category, the $200,000+ income range is the most frequent in Holly Hills, accounting for 34.1% of all households.
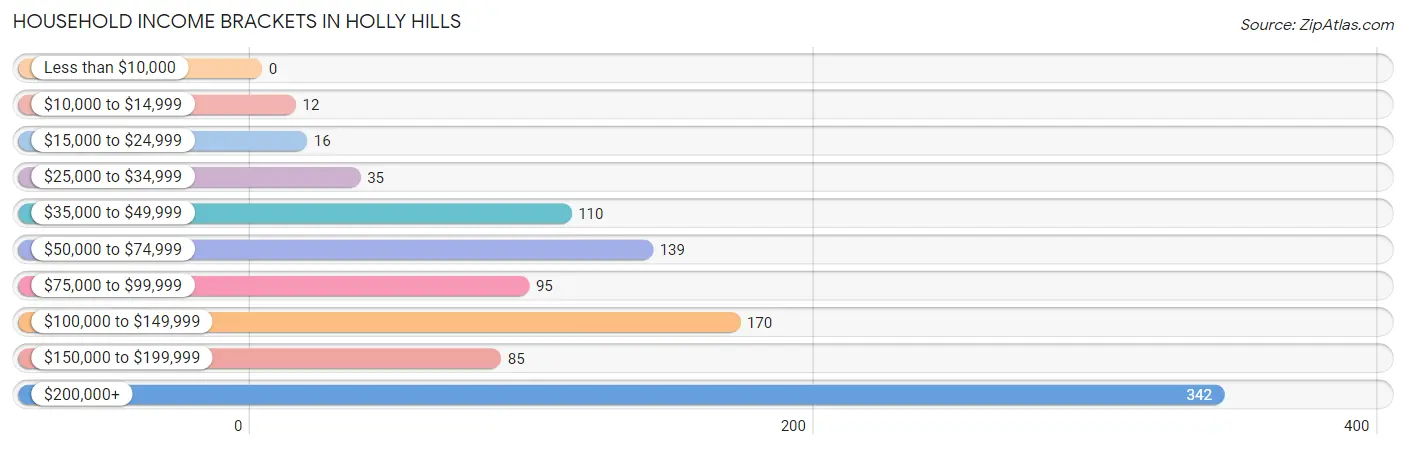
| Income Bracket | # Households | % Households |
| Less than $10,000 | 0 | 0.0% |
| $10,000 to $14,999 | 12 | 1.2% |
| $15,000 to $24,999 | 16 | 1.6% |
| $25,000 to $34,999 | 35 | 3.5% |
| $35,000 to $49,999 | 110 | 11.0% |
| $50,000 to $74,999 | 139 | 13.8% |
| $75,000 to $99,999 | 95 | 9.5% |
| $100,000 to $149,999 | 170 | 16.9% |
| $150,000 to $199,999 | 85 | 8.5% |
| $200,000+ | 342 | 34.1% |
Household Income by Householder Age in Holly Hills
The median household income in Holly Hills is $129,700, with the highest median household income of $153,750 found in the 25 to 44 years age bracket for the primary householder. A total of 326 households (32.5%) fall into this category. Meanwhile, the 15 to 24 years age bracket for the primary householder has the lowest median household income of $0, with 12 households (1.2%) in this group.
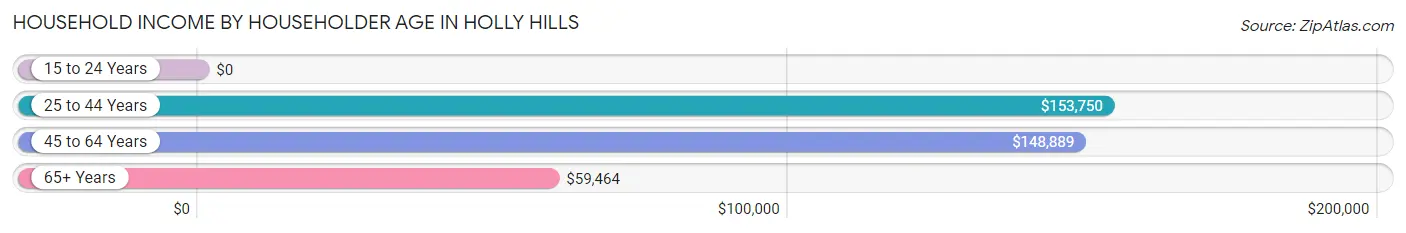
| Income Bracket | # Households | Median Income |
| 15 to 24 Years | 12 (1.2%) | $0 |
| 25 to 44 Years | 326 (32.5%) | $153,750 |
| 45 to 64 Years | 364 (36.2%) | $148,889 |
| 65+ Years | 302 (30.1%) | $59,464 |
| Total | 1,004 (100.0%) | $129,700 |
Poverty in Holly Hills
Income Below Poverty by Sex and Age in Holly Hills
With 9.3% poverty level for males and 6.1% for females among the residents of Holly Hills, 25 to 34 year old males and 18 to 24 year old females are the most vulnerable to poverty, with 78 males (30.3%) and 27 females (69.2%) in their respective age groups living below the poverty level.
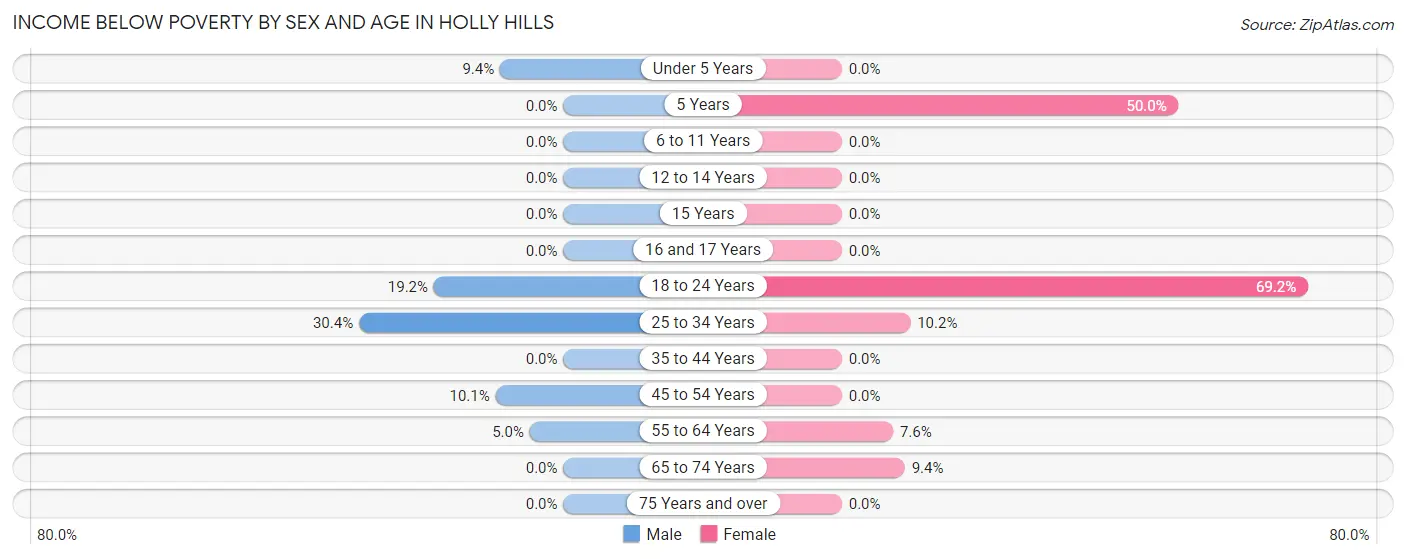
| Age Bracket | Male | Female |
| Under 5 Years | 11 (9.4%) | 0 (0.0%) |
| 5 Years | 0 (0.0%) | 12 (50.0%) |
| 6 to 11 Years | 0 (0.0%) | 0 (0.0%) |
| 12 to 14 Years | 0 (0.0%) | 0 (0.0%) |
| 15 Years | 0 (0.0%) | 0 (0.0%) |
| 16 and 17 Years | 0 (0.0%) | 0 (0.0%) |
| 18 to 24 Years | 20 (19.2%) | 27 (69.2%) |
| 25 to 34 Years | 78 (30.3%) | 19 (10.2%) |
| 35 to 44 Years | 0 (0.0%) | 0 (0.0%) |
| 45 to 54 Years | 14 (10.1%) | 0 (0.0%) |
| 55 to 64 Years | 10 (5.0%) | 13 (7.6%) |
| 65 to 74 Years | 0 (0.0%) | 10 (9.3%) |
| 75 Years and over | 0 (0.0%) | 0 (0.0%) |
| Total | 133 (9.3%) | 81 (6.1%) |
Income Above Poverty by Sex and Age in Holly Hills
According to the poverty statistics in Holly Hills, males aged 5 years and females aged under 5 years are the age groups that are most secure financially, with 100.0% of males and 100.0% of females in these age groups living above the poverty line.
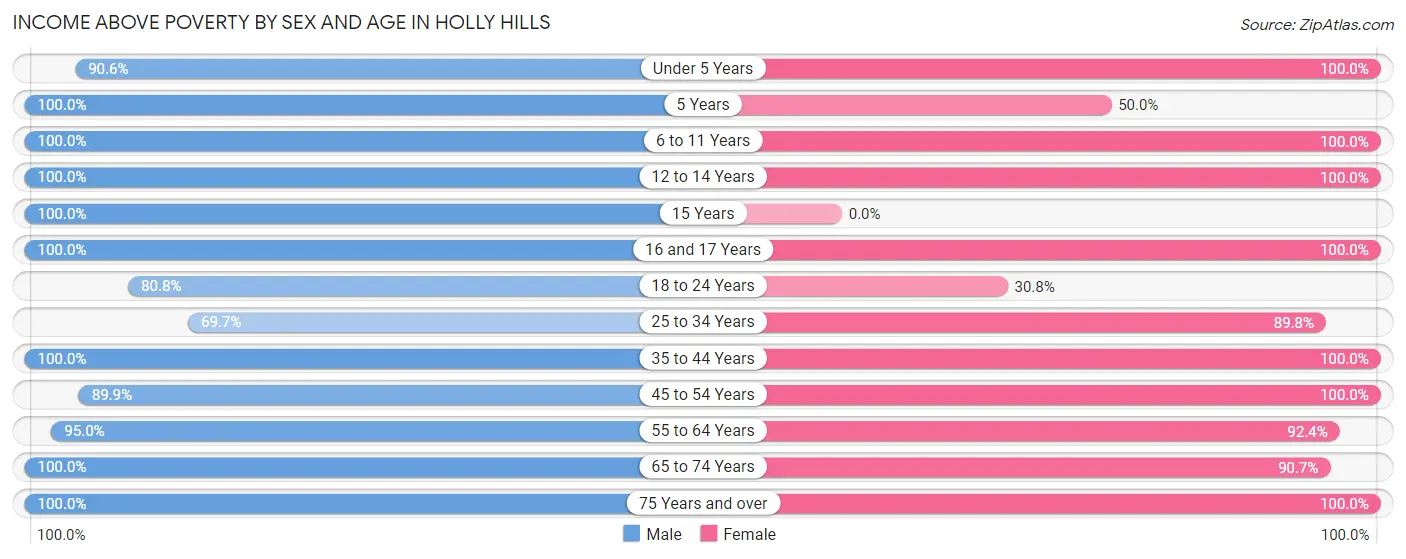
| Age Bracket | Male | Female |
| Under 5 Years | 106 (90.6%) | 130 (100.0%) |
| 5 Years | 8 (100.0%) | 12 (50.0%) |
| 6 to 11 Years | 62 (100.0%) | 42 (100.0%) |
| 12 to 14 Years | 62 (100.0%) | 26 (100.0%) |
| 15 Years | 11 (100.0%) | 0 (0.0%) |
| 16 and 17 Years | 59 (100.0%) | 42 (100.0%) |
| 18 to 24 Years | 84 (80.8%) | 12 (30.8%) |
| 25 to 34 Years | 179 (69.7%) | 168 (89.8%) |
| 35 to 44 Years | 199 (100.0%) | 118 (100.0%) |
| 45 to 54 Years | 125 (89.9%) | 213 (100.0%) |
| 55 to 64 Years | 191 (95.0%) | 158 (92.4%) |
| 65 to 74 Years | 130 (100.0%) | 97 (90.6%) |
| 75 Years and over | 75 (100.0%) | 234 (100.0%) |
| Total | 1,291 (90.7%) | 1,252 (93.9%) |
Income Below Poverty Among Married-Couple Families in Holly Hills
The poverty statistics for married-couple families in Holly Hills show that 2.0% or 12 of the total 591 families live below the poverty line. Families with 1 or 2 children have the highest poverty rate of 5.5%, comprising of 12 families. On the other hand, families with no children have the lowest poverty rate of 0.0%, which includes 0 families.
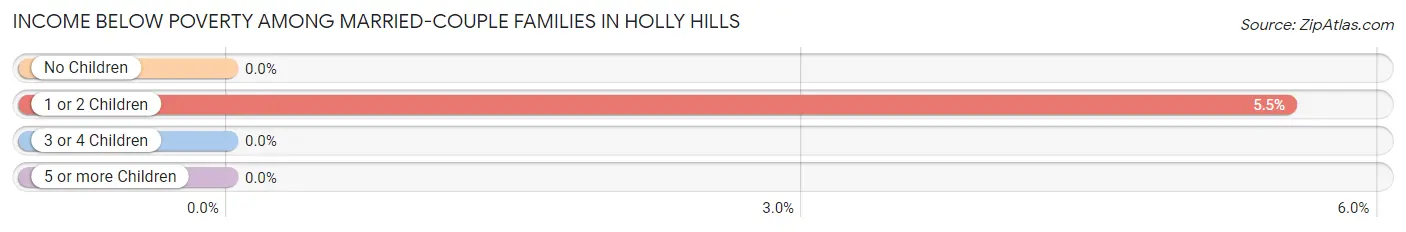
| Children | Above Poverty | Below Poverty |
| No Children | 354 (100.0%) | 0 (0.0%) |
| 1 or 2 Children | 205 (94.5%) | 12 (5.5%) |
| 3 or 4 Children | 20 (100.0%) | 0 (0.0%) |
| 5 or more Children | 0 (0.0%) | 0 (0.0%) |
| Total | 579 (98.0%) | 12 (2.0%) |
Income Below Poverty Among Single-Parent Households in Holly Hills
| Children | Single Father | Single Mother |
| No Children | 0 (0.0%) | 0 (0.0%) |
| 1 or 2 Children | 0 (0.0%) | 0 (0.0%) |
| 3 or 4 Children | 0 (0.0%) | 0 (0.0%) |
| 5 or more Children | 0 (0.0%) | 0 (0.0%) |
| Total | 0 (0.0%) | 0 (0.0%) |
Income Below Poverty Among Married-Couple vs Single-Parent Households in Holly Hills
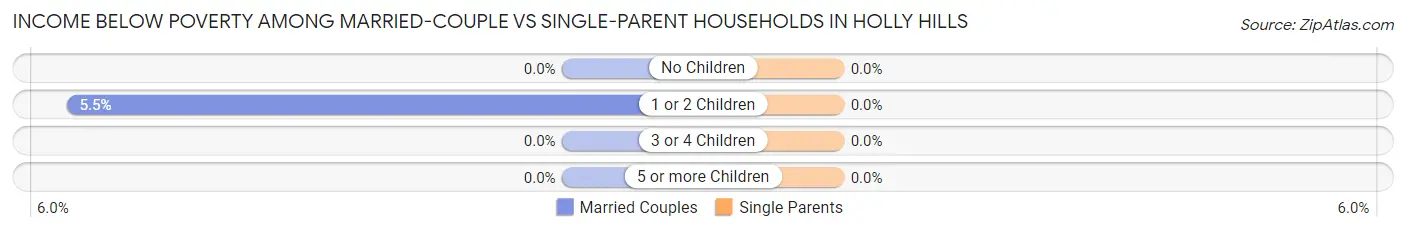
| Children | Married-Couple Families | Single-Parent Households |
| No Children | 0 (0.0%) | 0 (0.0%) |
| 1 or 2 Children | 12 (5.5%) | 0 (0.0%) |
| 3 or 4 Children | 0 (0.0%) | 0 (0.0%) |
| 5 or more Children | 0 (0.0%) | 0 (0.0%) |
| Total | 12 (2.0%) | 0 (0.0%) |
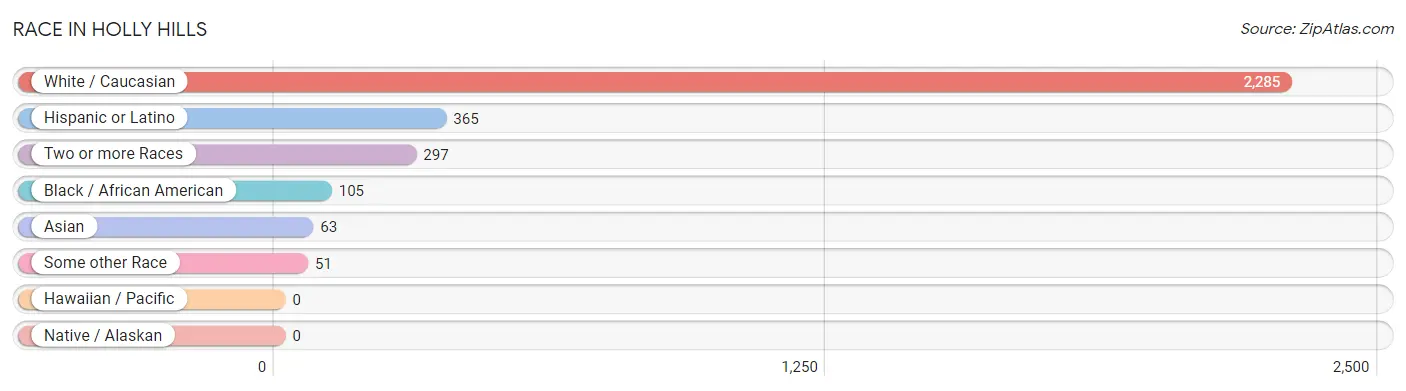
Race in Holly Hills
The most populous races in Holly Hills are White / Caucasian (2,285 | 81.6%), Hispanic or Latino (365 | 13.0%), and Two or more Races (297 | 10.6%).
| Race | # Population | % Population |
| Asian | 63 | 2.2% |
| Black / African American | 105 | 3.7% |
| Hawaiian / Pacific | 0 | 0.0% |
| Hispanic or Latino | 365 | 13.0% |
| Native / Alaskan | 0 | 0.0% |
| White / Caucasian | 2,285 | 81.6% |
| Two or more Races | 297 | 10.6% |
| Some other Race | 51 | 1.8% |
| Total | 2,801 | 100.0% |
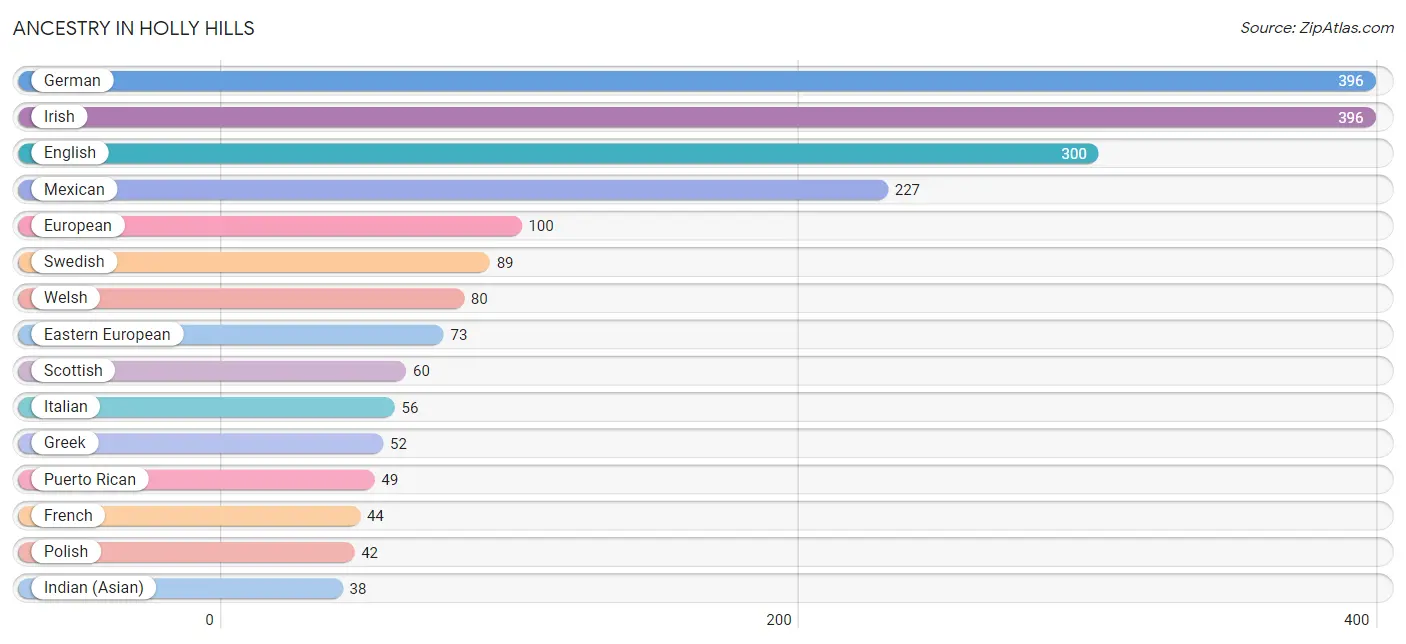
Ancestry in Holly Hills
The most populous ancestries reported in Holly Hills are German (396 | 14.1%), Irish (396 | 14.1%), English (300 | 10.7%), Mexican (227 | 8.1%), and European (100 | 3.6%), together accounting for 50.7% of all Holly Hills residents.
| Ancestry | # Population | % Population |
| American | 26 | 0.9% |
| Arab | 14 | 0.5% |
| Austrian | 10 | 0.4% |
| Bhutanese | 37 | 1.3% |
| Cambodian | 14 | 0.5% |
| Central American | 32 | 1.1% |
| Croatian | 7 | 0.3% |
| Cuban | 21 | 0.7% |
| Czech | 20 | 0.7% |
| Czechoslovakian | 11 | 0.4% |
| Danish | 9 | 0.3% |
| Dutch | 37 | 1.3% |
| Eastern European | 73 | 2.6% |
| English | 300 | 10.7% |
| European | 100 | 3.6% |
| Finnish | 5 | 0.2% |
| French | 44 | 1.6% |
| French Canadian | 10 | 0.4% |
| German | 396 | 14.1% |
| Greek | 52 | 1.9% |
| Hungarian | 11 | 0.4% |
| Indian (Asian) | 38 | 1.4% |
| Iranian | 31 | 1.1% |
| Irish | 396 | 14.1% |
| Italian | 56 | 2.0% |
| Lebanese | 9 | 0.3% |
| Lithuanian | 5 | 0.2% |
| Mexican | 227 | 8.1% |
| Native Hawaiian | 12 | 0.4% |
| Nicaraguan | 32 | 1.1% |
| Northern European | 17 | 0.6% |
| Norwegian | 30 | 1.1% |
| Polish | 42 | 1.5% |
| Portuguese | 22 | 0.8% |
| Puerto Rican | 49 | 1.8% |
| Russian | 10 | 0.4% |
| Scandinavian | 38 | 1.4% |
| Scottish | 60 | 2.1% |
| Slovak | 12 | 0.4% |
| Spaniard | 5 | 0.2% |
| Spanish | 31 | 1.1% |
| Swedish | 89 | 3.2% |
| Syrian | 5 | 0.2% |
| Thai | 24 | 0.9% |
| Welsh | 80 | 2.9% | View All 45 Rows |
Immigrants in Holly Hills
The most numerous immigrant groups reported in Holly Hills came from Europe (99 | 3.5%), Northern Europe (38 | 1.4%), Germany (32 | 1.1%), Western Europe (32 | 1.1%), and Africa (29 | 1.0%), together accounting for 8.2% of all Holly Hills residents.
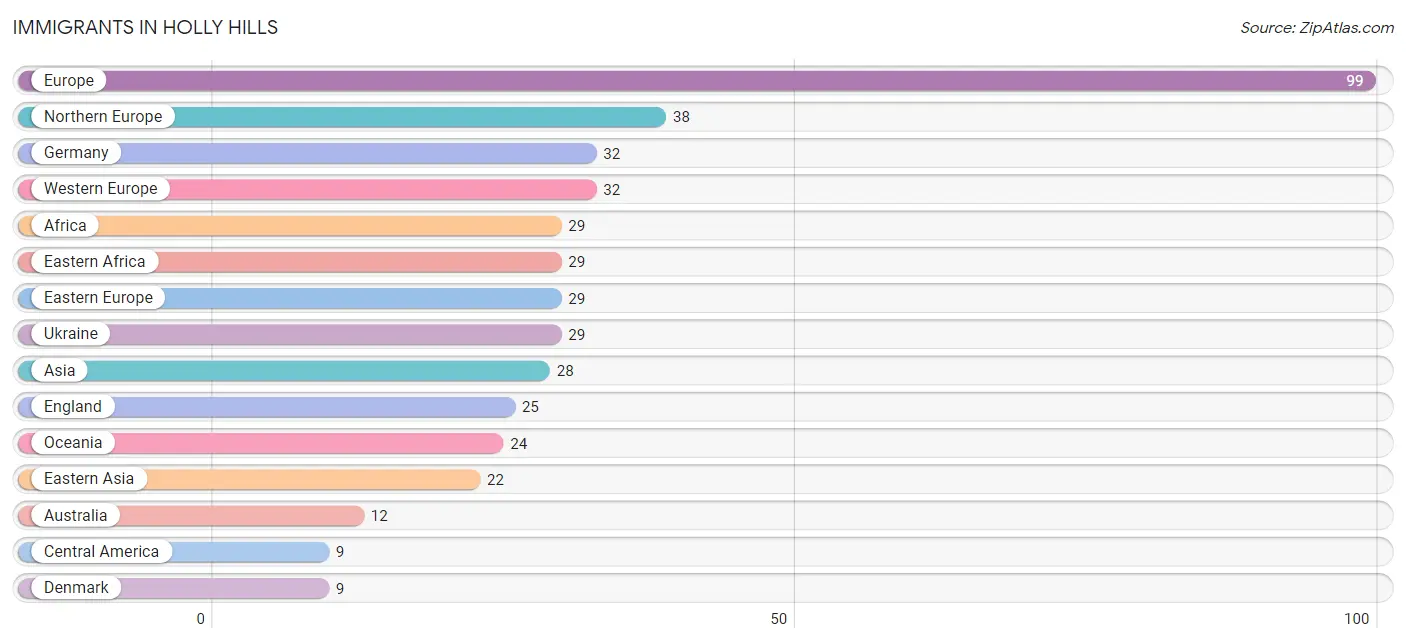
| Immigration Origin | # Population | % Population |
| Africa | 29 | 1.0% |
| Asia | 28 | 1.0% |
| Australia | 12 | 0.4% |
| Central America | 9 | 0.3% |
| China | 8 | 0.3% |
| Denmark | 9 | 0.3% |
| Eastern Africa | 29 | 1.0% |
| Eastern Asia | 22 | 0.8% |
| Eastern Europe | 29 | 1.0% |
| England | 25 | 0.9% |
| Europe | 99 | 3.5% |
| Germany | 32 | 1.1% |
| Kazakhstan | 6 | 0.2% |
| Latin America | 9 | 0.3% |
| Mexico | 9 | 0.3% |
| Northern Europe | 38 | 1.4% |
| Oceania | 24 | 0.9% |
| Scotland | 4 | 0.1% |
| South Central Asia | 6 | 0.2% |
| Ukraine | 29 | 1.0% |
| Western Europe | 32 | 1.1% | View All 21 Rows |
Sex and Age in Holly Hills
Sex and Age in Holly Hills
The most populous age groups in Holly Hills are 25 to 29 Years (190 | 13.3%) for men and 45 to 49 Years (141 | 10.3%) for women.
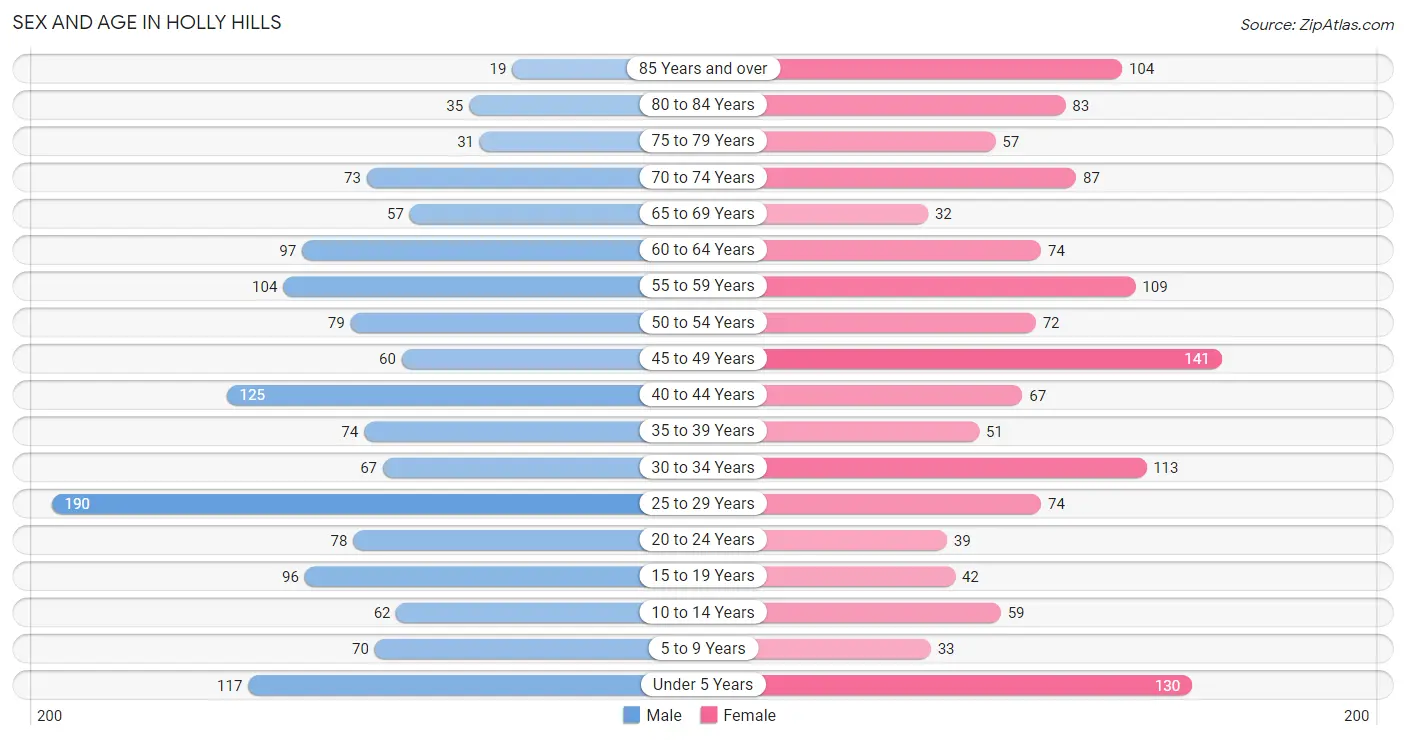
| Age Bracket | Male | Female |
| Under 5 Years | 117 (8.2%) | 130 (9.5%) |
| 5 to 9 Years | 70 (4.9%) | 33 (2.4%) |
| 10 to 14 Years | 62 (4.3%) | 59 (4.3%) |
| 15 to 19 Years | 96 (6.7%) | 42 (3.1%) |
| 20 to 24 Years | 78 (5.4%) | 39 (2.9%) |
| 25 to 29 Years | 190 (13.3%) | 74 (5.4%) |
| 30 to 34 Years | 67 (4.7%) | 113 (8.3%) |
| 35 to 39 Years | 74 (5.2%) | 51 (3.7%) |
| 40 to 44 Years | 125 (8.7%) | 67 (4.9%) |
| 45 to 49 Years | 60 (4.2%) | 141 (10.3%) |
| 50 to 54 Years | 79 (5.5%) | 72 (5.3%) |
| 55 to 59 Years | 104 (7.2%) | 109 (8.0%) |
| 60 to 64 Years | 97 (6.8%) | 74 (5.4%) |
| 65 to 69 Years | 57 (4.0%) | 32 (2.3%) |
| 70 to 74 Years | 73 (5.1%) | 87 (6.4%) |
| 75 to 79 Years | 31 (2.2%) | 57 (4.2%) |
| 80 to 84 Years | 35 (2.4%) | 83 (6.1%) |
| 85 Years and over | 19 (1.3%) | 104 (7.6%) |
| Total | 1,434 (100.0%) | 1,367 (100.0%) |
Families and Households in Holly Hills
Median Family Size in Holly Hills
The median family size in Holly Hills is 3.04 persons per family, with single female/mother families (46 | 6.6%) accounting for the largest median family size of 3.37 persons per family. On the other hand, married-couple families (591 | 84.4%) represent the smallest median family size with 3.00 persons per family.
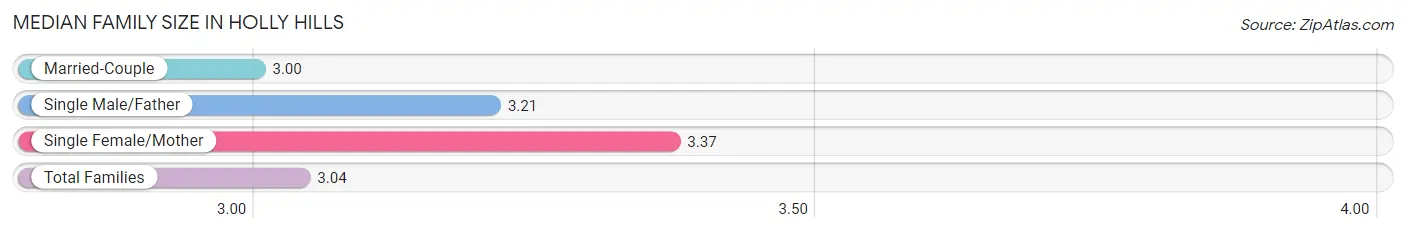
| Family Type | # Families | Family Size |
| Married-Couple | 591 (84.4%) | 3.00 |
| Single Male/Father | 63 (9.0%) | 3.21 |
| Single Female/Mother | 46 (6.6%) | 3.37 |
| Total Families | 700 (100.0%) | 3.04 |
Median Household Size in Holly Hills
The median household size in Holly Hills is 2.65 persons per household, with single female/mother households (46 | 4.6%) accounting for the largest median household size of 3.37 persons per household. non-family households (304 | 30.3%) represent the smallest median household size with 1.61 persons per household.
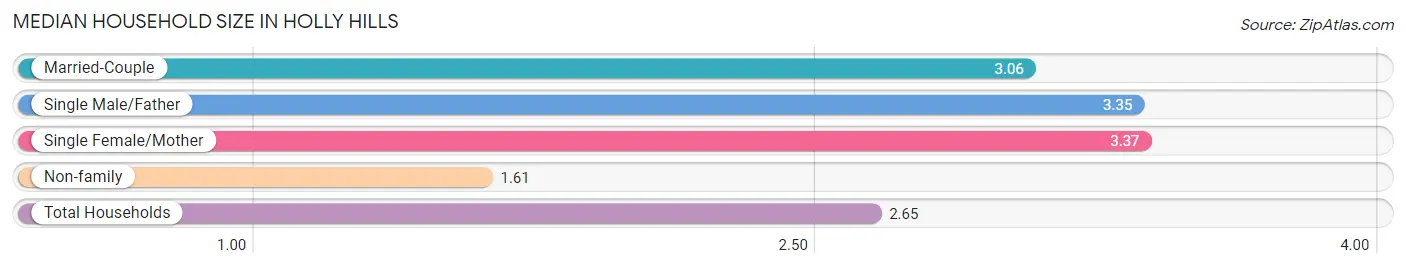
| Household Type | # Households | Household Size |
| Married-Couple | 591 (58.9%) | 3.06 |
| Single Male/Father | 63 (6.3%) | 3.35 |
| Single Female/Mother | 46 (4.6%) | 3.37 |
| Non-family | 304 (30.3%) | 1.61 |
| Total Households | 1,004 (100.0%) | 2.65 |
Household Size by Marriage Status in Holly Hills
Out of a total of 1,004 households in Holly Hills, 700 (69.7%) are family households, while 304 (30.3%) are nonfamily households. The most numerous type of family households are 2-person households, comprising 335, and the most common type of nonfamily households are 1-person households, comprising 188.
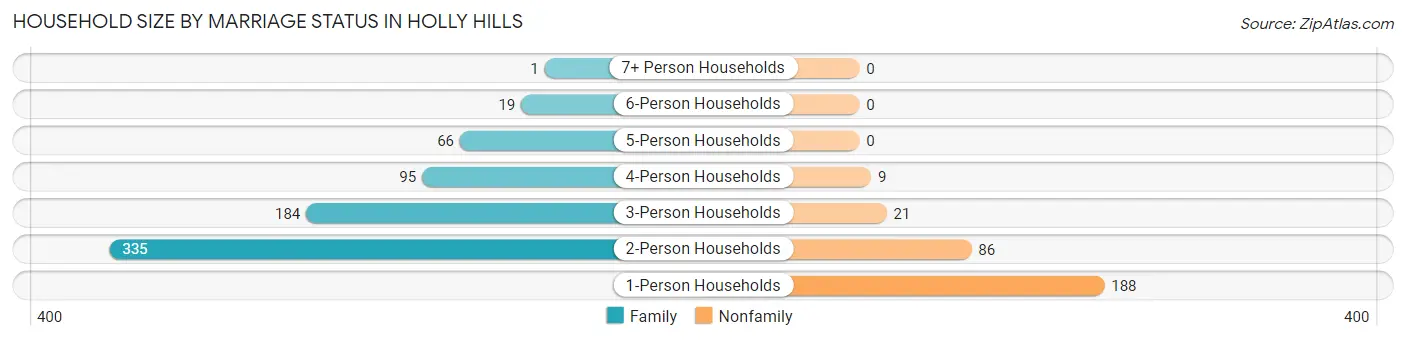
| Household Size | Family Households | Nonfamily Households |
| 1-Person Households | - | 188 (18.7%) |
| 2-Person Households | 335 (33.4%) | 86 (8.6%) |
| 3-Person Households | 184 (18.3%) | 21 (2.1%) |
| 4-Person Households | 95 (9.5%) | 9 (0.9%) |
| 5-Person Households | 66 (6.6%) | 0 (0.0%) |
| 6-Person Households | 19 (1.9%) | 0 (0.0%) |
| 7+ Person Households | 1 (0.1%) | 0 (0.0%) |
| Total | 700 (69.7%) | 304 (30.3%) |
Female Fertility in Holly Hills
Fertility by Age in Holly Hills
Average fertility rate in Holly Hills is 122.0 births per 1,000 women. Women in the age bracket of 20 to 34 years have the highest fertility rate with 261.0 births per 1,000 women. Women in the age bracket of 20 to 34 years acount for 88.1% of all women with births.
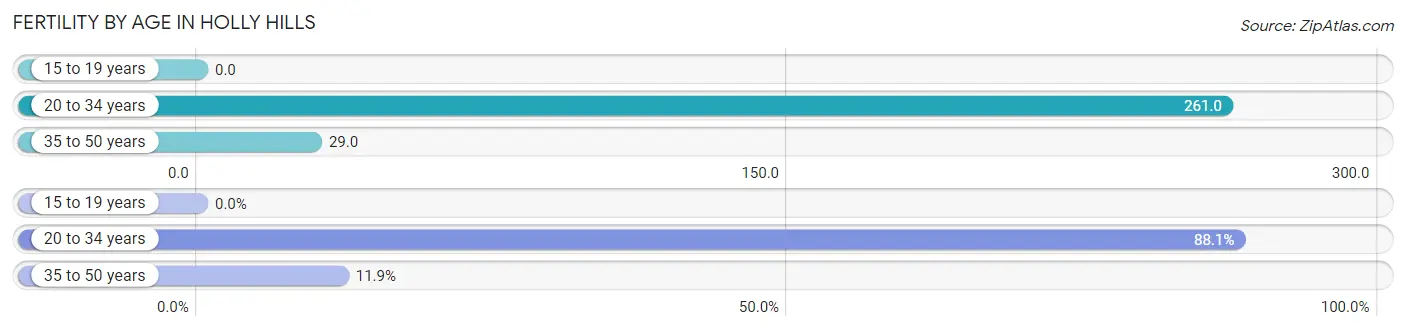
| Age Bracket | Women with Births | Births / 1,000 Women |
| 15 to 19 years | 0 (0.0%) | 0.0 |
| 20 to 34 years | 59 (88.1%) | 261.0 |
| 35 to 50 years | 8 (11.9%) | 29.0 |
| Total | 67 (100.0%) | 122.0 |
Fertility by Age by Marriage Status in Holly Hills
77.6% of women with births (67) in Holly Hills are married. The highest percentage of unmarried women with births falls into 20 to 34 years age bracket with 25.4% of them unmarried at the time of birth, while the lowest percentage of unmarried women with births belong to 35 to 50 years age bracket with 0.0% of them unmarried.
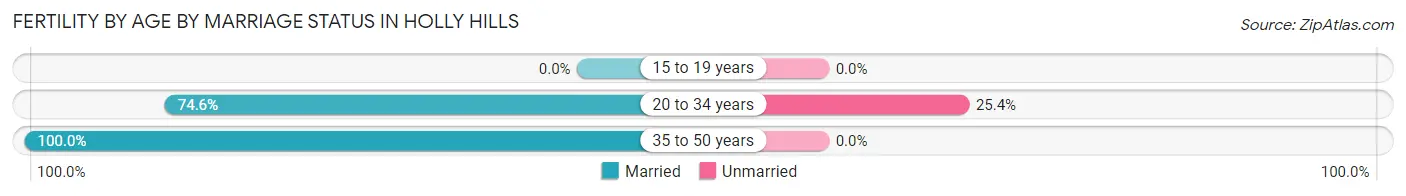
| Age Bracket | Married | Unmarried |
| 15 to 19 years | 0 (0.0%) | 0 (0.0%) |
| 20 to 34 years | 44 (74.6%) | 15 (25.4%) |
| 35 to 50 years | 8 (100.0%) | 0 (0.0%) |
| Total | 52 (77.6%) | 15 (22.4%) |
Fertility by Education in Holly Hills
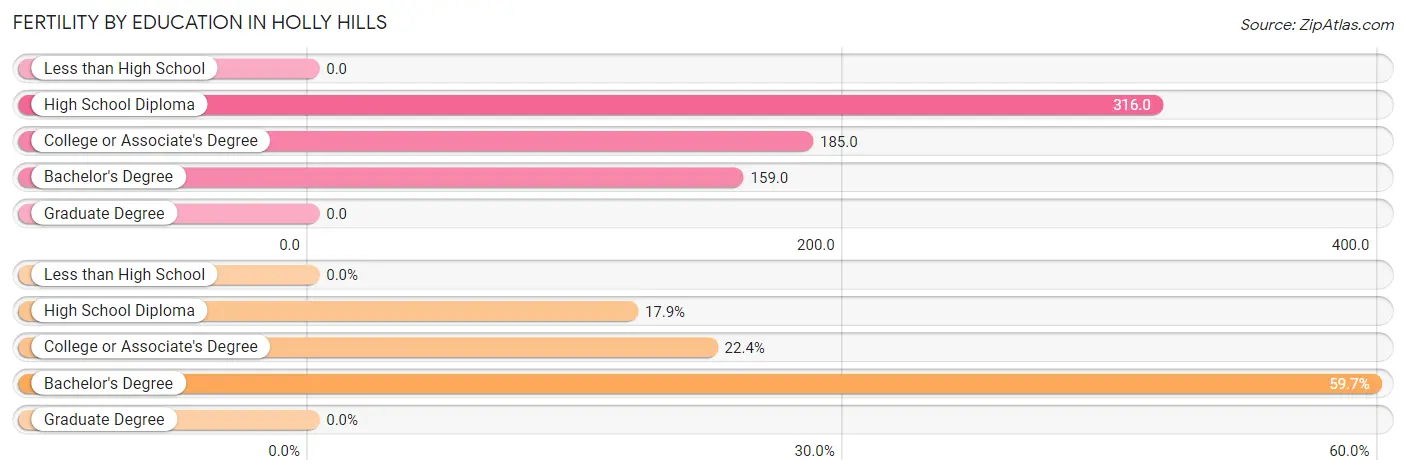
| Educational Attainment | Women with Births | Births / 1,000 Women |
| Less than High School | 0 (0.0%) | 0.0 |
| High School Diploma | 12 (17.9%) | 316.0 |
| College or Associate's Degree | 15 (22.4%) | 185.0 |
| Bachelor's Degree | 40 (59.7%) | 159.0 |
| Graduate Degree | 0 (0.0%) | 0.0 |
| Total | 67 (100.0%) | 122.0 |
Fertility by Education by Marriage Status in Holly Hills
22.4% of women with births in Holly Hills are unmarried. Women with the educational attainment of high school diploma are most likely to be married with 100.0% of them married at childbirth, while women with the educational attainment of college or associate's degree are least likely to be married with 100.0% of them unmarried at childbirth.
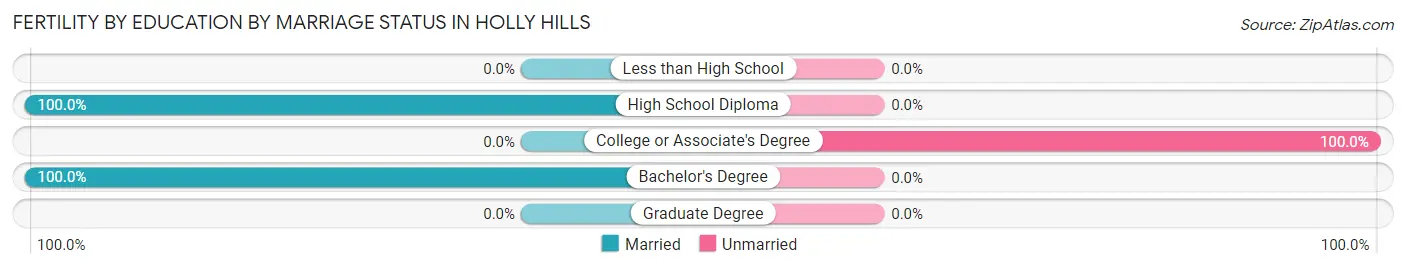
| Educational Attainment | Married | Unmarried |
| Less than High School | 0 (0.0%) | 0 (0.0%) |
| High School Diploma | 12 (100.0%) | 0 (0.0%) |
| College or Associate's Degree | 0 (0.0%) | 15 (100.0%) |
| Bachelor's Degree | 40 (100.0%) | 0 (0.0%) |
| Graduate Degree | 0 (0.0%) | 0 (0.0%) |
| Total | 52 (77.6%) | 15 (22.4%) |
Employment Characteristics in Holly Hills
Employment by Class of Employer in Holly Hills
Among the 1,511 employed individuals in Holly Hills, private company employees (884 | 58.5%), self-employed (not incorporated) (193 | 12.8%), and local government employees (120 | 7.9%) make up the most common classes of employment.
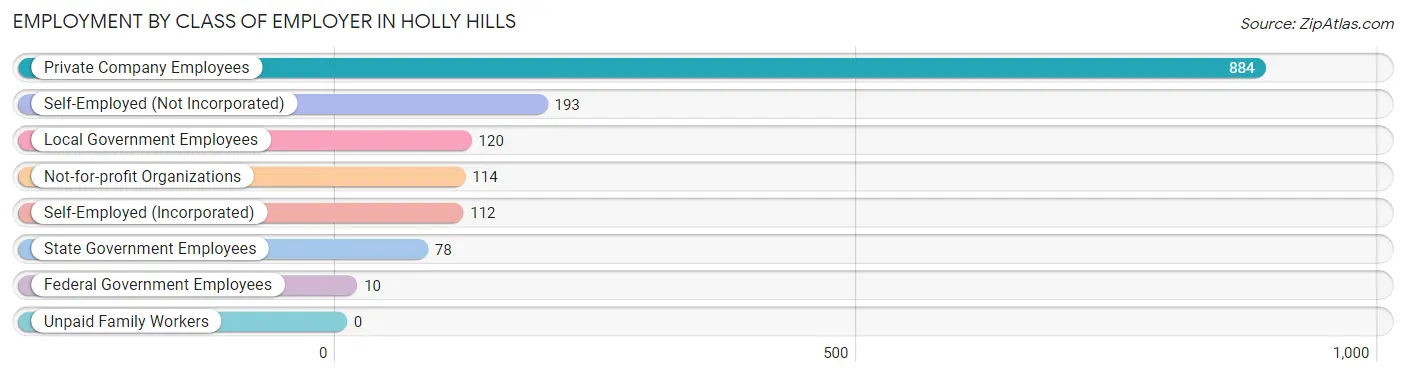
| Employer Class | # Employees | % Employees |
| Private Company Employees | 884 | 58.5% |
| Self-Employed (Incorporated) | 112 | 7.4% |
| Self-Employed (Not Incorporated) | 193 | 12.8% |
| Not-for-profit Organizations | 114 | 7.5% |
| Local Government Employees | 120 | 7.9% |
| State Government Employees | 78 | 5.2% |
| Federal Government Employees | 10 | 0.7% |
| Unpaid Family Workers | 0 | 0.0% |
| Total | 1,511 | 100.0% |
Employment Status by Age in Holly Hills
According to the labor force statistics for Holly Hills, out of the total population over 16 years of age (2,319), 66.3% or 1,537 individuals are in the labor force, with 1.3% or 20 of them unemployed. The age group with the highest labor force participation rate is 35 to 44 years, with 98.1% or 311 individuals in the labor force. Within the labor force, the 16 to 19 years age range has the highest percentage of unemployed individuals, with 33.3% or 20 of them being unemployed.
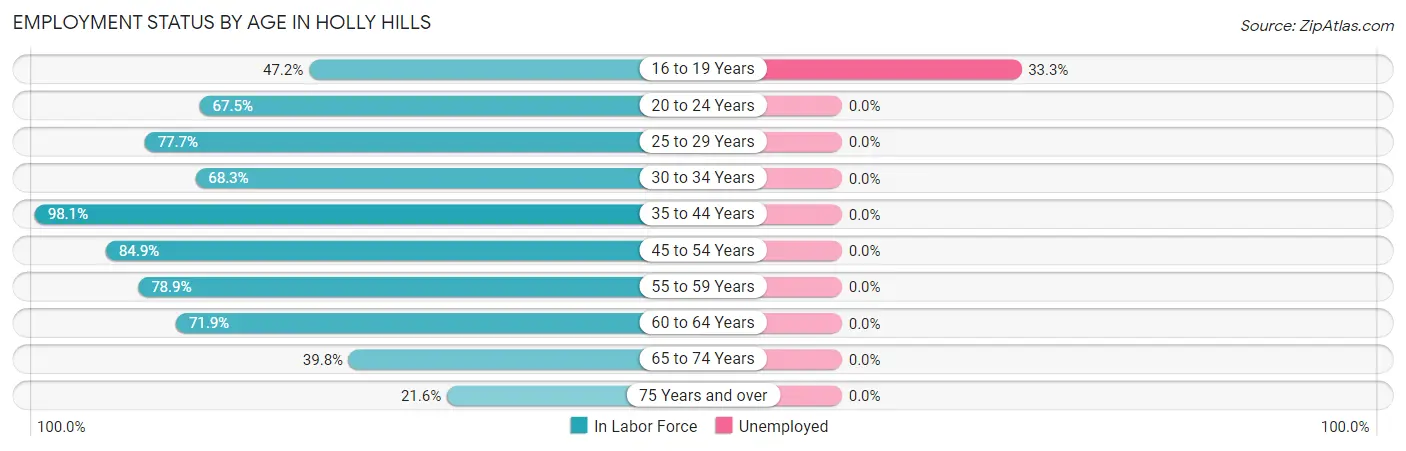
| Age Bracket | In Labor Force | Unemployed |
| 16 to 19 Years | 60 (47.2%) | 20 (33.3%) |
| 20 to 24 Years | 79 (67.5%) | 0 (0.0%) |
| 25 to 29 Years | 205 (77.7%) | 0 (0.0%) |
| 30 to 34 Years | 123 (68.3%) | 0 (0.0%) |
| 35 to 44 Years | 311 (98.1%) | 0 (0.0%) |
| 45 to 54 Years | 299 (84.9%) | 0 (0.0%) |
| 55 to 59 Years | 168 (78.9%) | 0 (0.0%) |
| 60 to 64 Years | 123 (71.9%) | 0 (0.0%) |
| 65 to 74 Years | 99 (39.8%) | 0 (0.0%) |
| 75 Years and over | 71 (21.6%) | 0 (0.0%) |
| Total | 1,537 (66.3%) | 20 (1.3%) |
Employment Status by Educational Attainment in Holly Hills
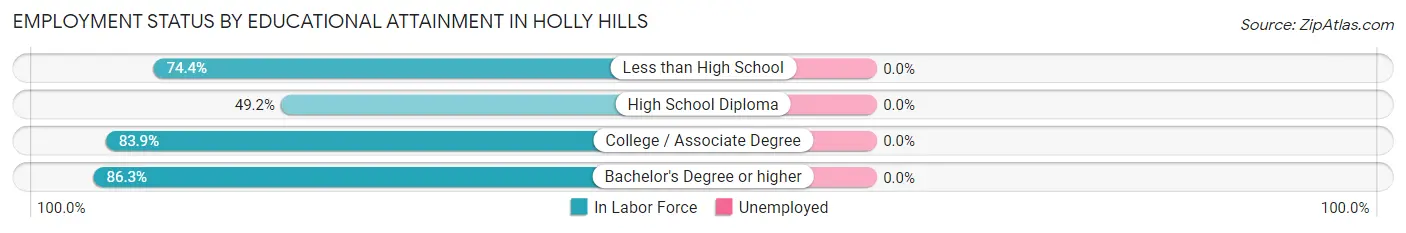
| Educational Attainment | In Labor Force | Unemployed |
| Less than High School | 58 (74.4%) | 0 (0.0%) |
| High School Diploma | 61 (49.2%) | 0 (0.0%) |
| College / Associate Degree | 250 (83.9%) | 0 (0.0%) |
| Bachelor's Degree or higher | 860 (86.3%) | 0 (0.0%) |
| Total | 1,229 (82.1%) | 0 (0.0%) |
Employment Occupations by Sex in Holly Hills
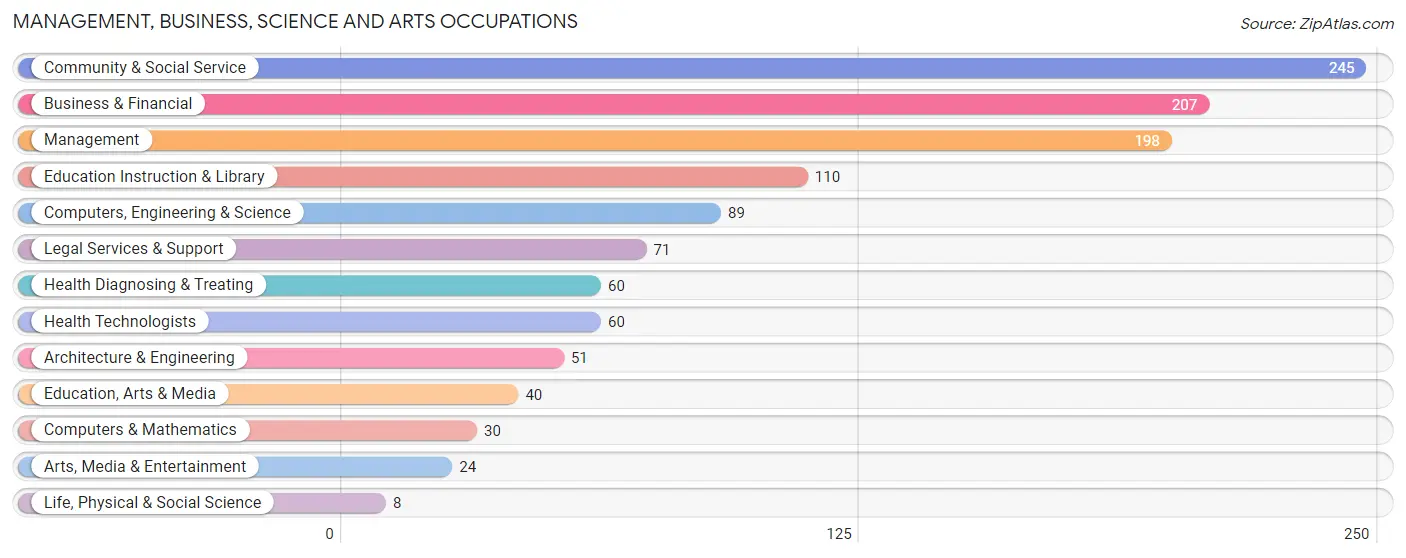
Management, Business, Science and Arts Occupations
The most common Management, Business, Science and Arts occupations in Holly Hills are Community & Social Service (245 | 16.1%), Business & Financial (207 | 13.6%), Management (198 | 13.0%), Education Instruction & Library (110 | 7.2%), and Computers, Engineering & Science (89 | 5.9%).
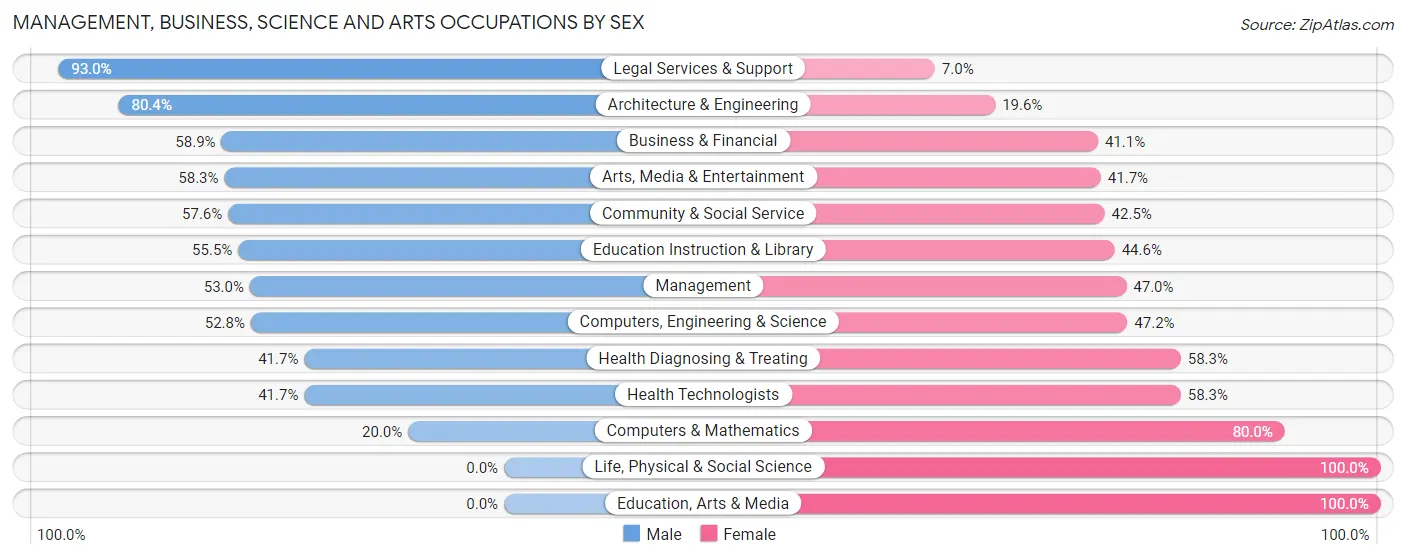
Management, Business, Science and Arts Occupations by Sex
Within the Management, Business, Science and Arts occupations in Holly Hills, the most male-oriented occupations are Legal Services & Support (93.0%), Architecture & Engineering (80.4%), and Business & Financial (58.9%), while the most female-oriented occupations are Life, Physical & Social Science (100.0%), Education, Arts & Media (100.0%), and Computers & Mathematics (80.0%).
| Occupation | Male | Female |
| Management | 105 (53.0%) | 93 (47.0%) |
| Business & Financial | 122 (58.9%) | 85 (41.1%) |
| Computers, Engineering & Science | 47 (52.8%) | 42 (47.2%) |
| Computers & Mathematics | 6 (20.0%) | 24 (80.0%) |
| Architecture & Engineering | 41 (80.4%) | 10 (19.6%) |
| Life, Physical & Social Science | 0 (0.0%) | 8 (100.0%) |
| Community & Social Service | 141 (57.6%) | 104 (42.4%) |
| Education, Arts & Media | 0 (0.0%) | 40 (100.0%) |
| Legal Services & Support | 66 (93.0%) | 5 (7.0%) |
| Education Instruction & Library | 61 (55.4%) | 49 (44.6%) |
| Arts, Media & Entertainment | 14 (58.3%) | 10 (41.7%) |
| Health Diagnosing & Treating | 25 (41.7%) | 35 (58.3%) |
| Health Technologists | 25 (41.7%) | 35 (58.3%) |
| Total (Category) | 440 (55.1%) | 359 (44.9%) |
| Total (Overall) | 856 (56.4%) | 662 (43.6%) |
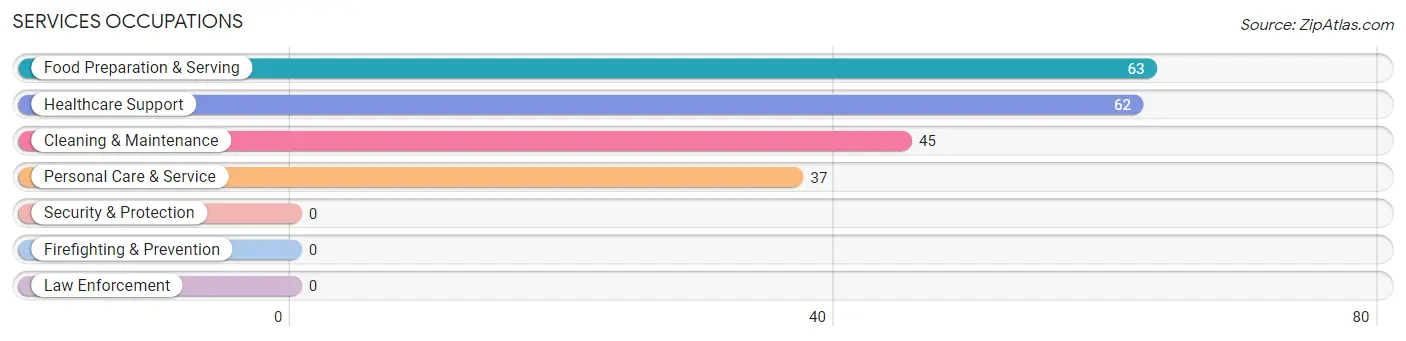
Services Occupations
The most common Services occupations in Holly Hills are Food Preparation & Serving (63 | 4.2%), Healthcare Support (62 | 4.1%), Cleaning & Maintenance (45 | 3.0%), and Personal Care & Service (37 | 2.4%).
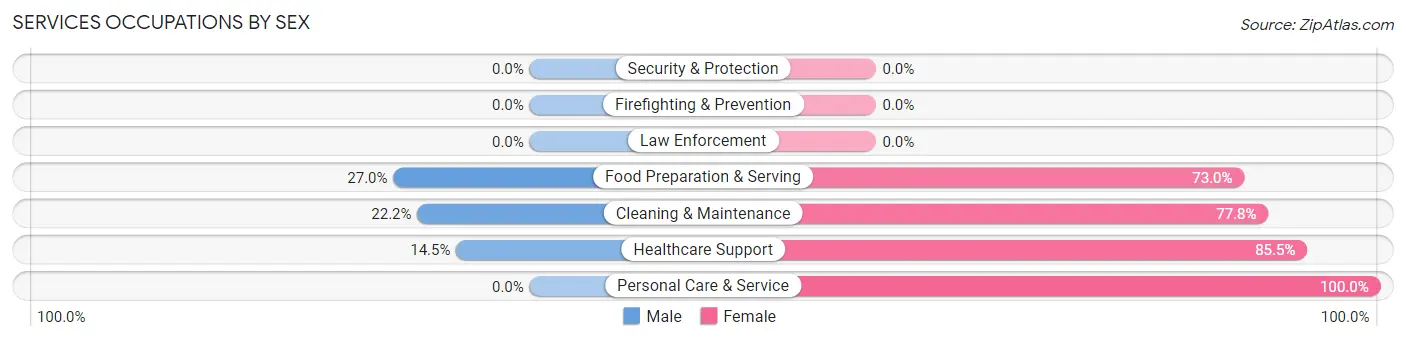
Services Occupations by Sex
Within the Services occupations in Holly Hills, the most male-oriented occupations are Food Preparation & Serving (27.0%), Cleaning & Maintenance (22.2%), and Healthcare Support (14.5%), while the most female-oriented occupations are Personal Care & Service (100.0%), Healthcare Support (85.5%), and Cleaning & Maintenance (77.8%).
| Occupation | Male | Female |
| Healthcare Support | 9 (14.5%) | 53 (85.5%) |
| Security & Protection | 0 (0.0%) | 0 (0.0%) |
| Firefighting & Prevention | 0 (0.0%) | 0 (0.0%) |
| Law Enforcement | 0 (0.0%) | 0 (0.0%) |
| Food Preparation & Serving | 17 (27.0%) | 46 (73.0%) |
| Cleaning & Maintenance | 10 (22.2%) | 35 (77.8%) |
| Personal Care & Service | 0 (0.0%) | 37 (100.0%) |
| Total (Category) | 36 (17.4%) | 171 (82.6%) |
| Total (Overall) | 856 (56.4%) | 662 (43.6%) |
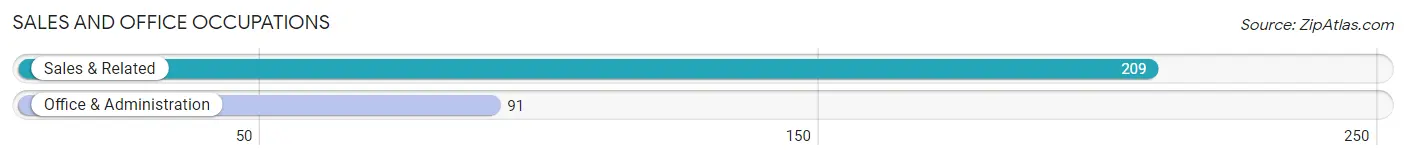
Sales and Office Occupations
The most common Sales and Office occupations in Holly Hills are Sales & Related (209 | 13.8%), and Office & Administration (91 | 6.0%).
Sales and Office Occupations by Sex
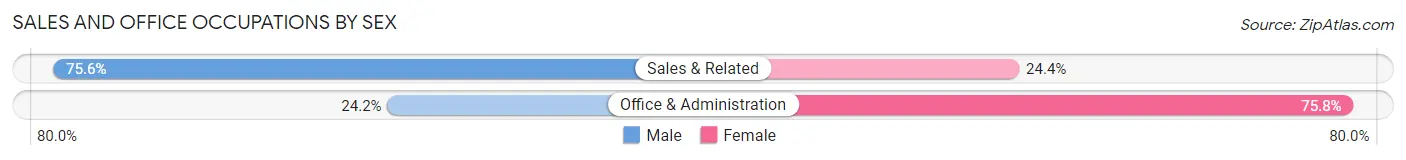
| Occupation | Male | Female |
| Sales & Related | 158 (75.6%) | 51 (24.4%) |
| Office & Administration | 22 (24.2%) | 69 (75.8%) |
| Total (Category) | 180 (60.0%) | 120 (40.0%) |
| Total (Overall) | 856 (56.4%) | 662 (43.6%) |
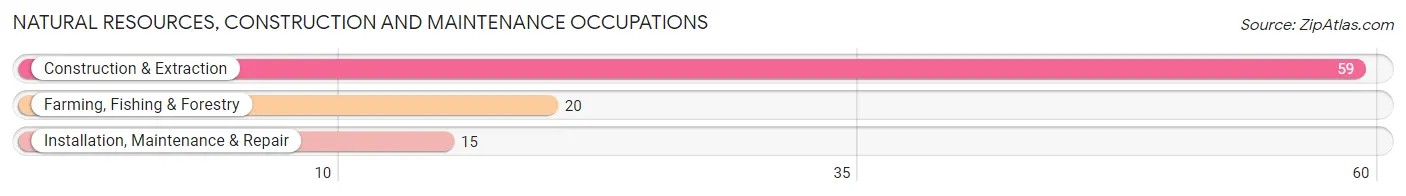
Natural Resources, Construction and Maintenance Occupations
The most common Natural Resources, Construction and Maintenance occupations in Holly Hills are Construction & Extraction (59 | 3.9%), Farming, Fishing & Forestry (20 | 1.3%), and Installation, Maintenance & Repair (15 | 1.0%).
Natural Resources, Construction and Maintenance Occupations by Sex
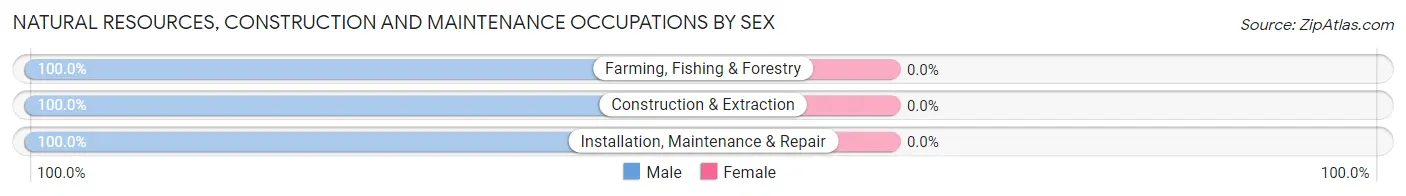
| Occupation | Male | Female |
| Farming, Fishing & Forestry | 20 (100.0%) | 0 (0.0%) |
| Construction & Extraction | 59 (100.0%) | 0 (0.0%) |
| Installation, Maintenance & Repair | 15 (100.0%) | 0 (0.0%) |
| Total (Category) | 94 (100.0%) | 0 (0.0%) |
| Total (Overall) | 856 (56.4%) | 662 (43.6%) |
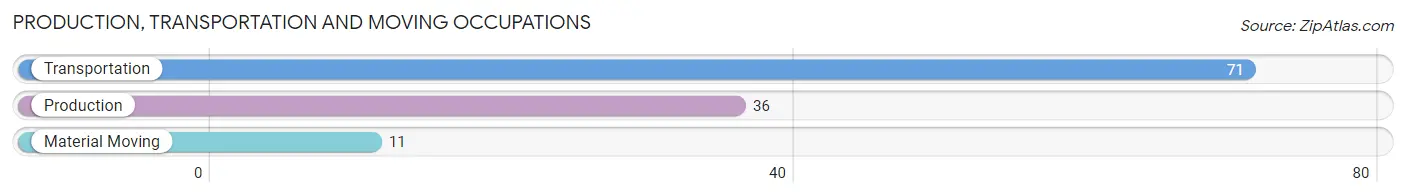
Production, Transportation and Moving Occupations
The most common Production, Transportation and Moving occupations in Holly Hills are Transportation (71 | 4.7%), Production (36 | 2.4%), and Material Moving (11 | 0.7%).
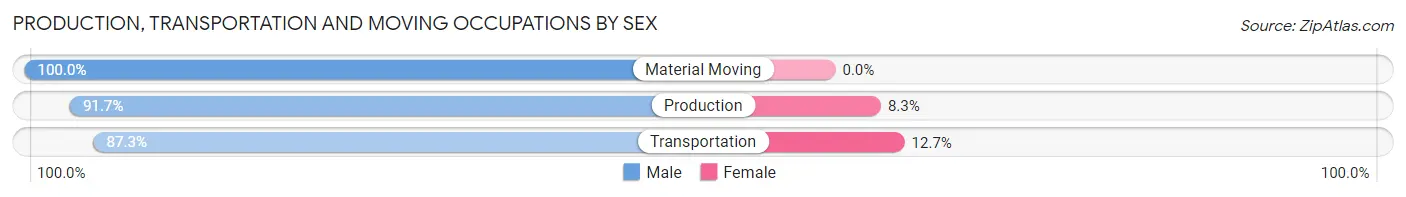
Production, Transportation and Moving Occupations by Sex
| Occupation | Male | Female |
| Production | 33 (91.7%) | 3 (8.3%) |
| Transportation | 62 (87.3%) | 9 (12.7%) |
| Material Moving | 11 (100.0%) | 0 (0.0%) |
| Total (Category) | 106 (89.8%) | 12 (10.2%) |
| Total (Overall) | 856 (56.4%) | 662 (43.6%) |
Employment Industries by Sex in Holly Hills
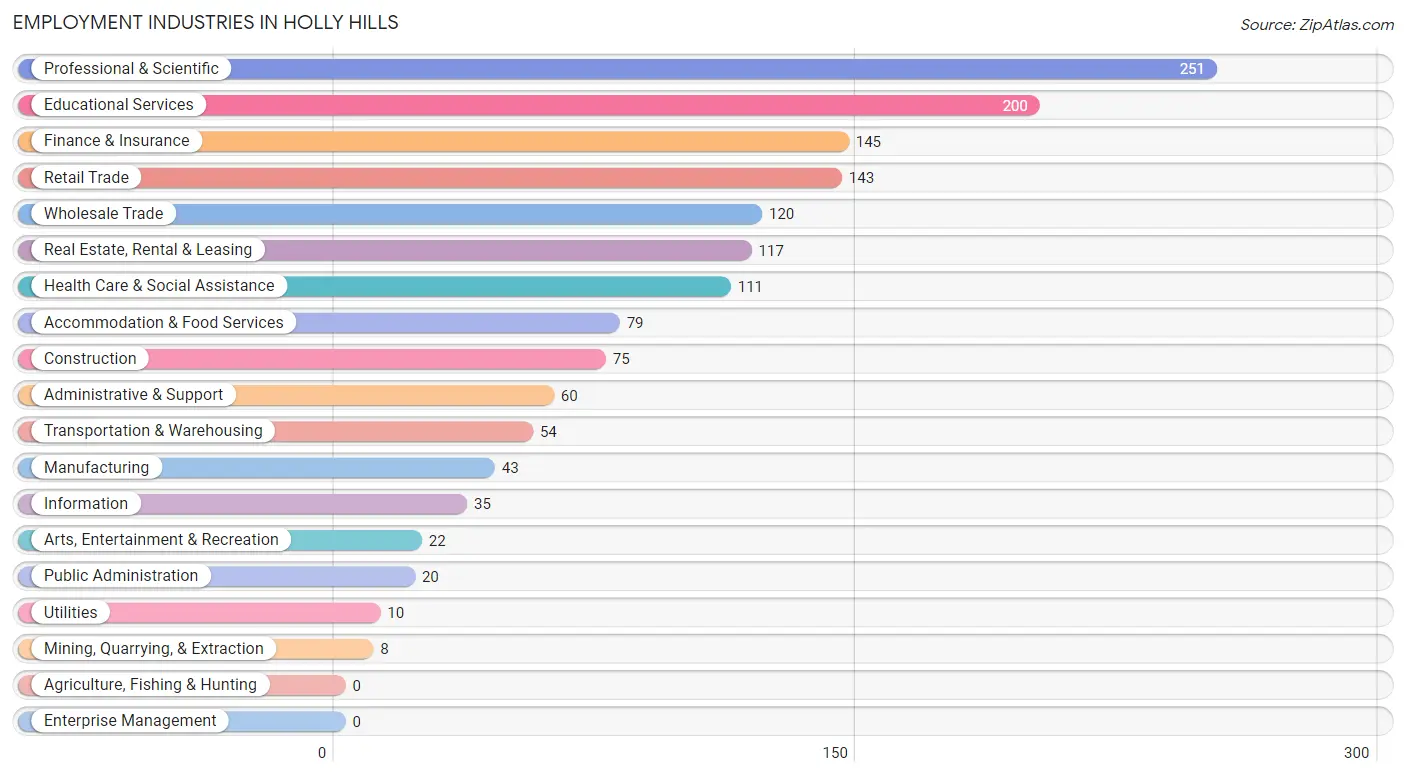
Employment Industries in Holly Hills
The major employment industries in Holly Hills include Professional & Scientific (251 | 16.5%), Educational Services (200 | 13.2%), Finance & Insurance (145 | 9.6%), Retail Trade (143 | 9.4%), and Wholesale Trade (120 | 7.9%).
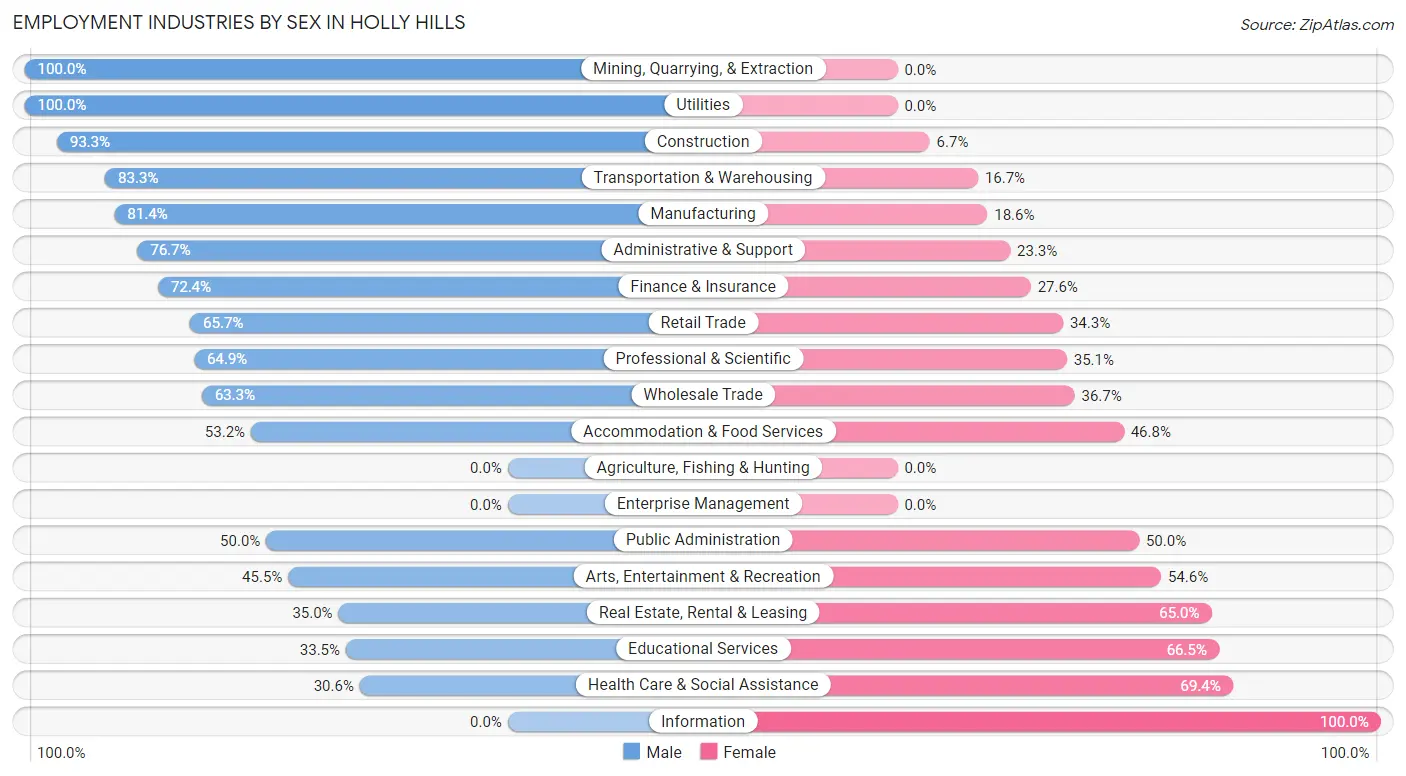
Employment Industries by Sex in Holly Hills
The Holly Hills industries that see more men than women are Mining, Quarrying, & Extraction (100.0%), Utilities (100.0%), and Construction (93.3%), whereas the industries that tend to have a higher number of women are Information (100.0%), Health Care & Social Assistance (69.4%), and Educational Services (66.5%).
| Industry | Male | Female |
| Agriculture, Fishing & Hunting | 0 (0.0%) | 0 (0.0%) |
| Mining, Quarrying, & Extraction | 8 (100.0%) | 0 (0.0%) |
| Construction | 70 (93.3%) | 5 (6.7%) |
| Manufacturing | 35 (81.4%) | 8 (18.6%) |
| Wholesale Trade | 76 (63.3%) | 44 (36.7%) |
| Retail Trade | 94 (65.7%) | 49 (34.3%) |
| Transportation & Warehousing | 45 (83.3%) | 9 (16.7%) |
| Utilities | 10 (100.0%) | 0 (0.0%) |
| Information | 0 (0.0%) | 35 (100.0%) |
| Finance & Insurance | 105 (72.4%) | 40 (27.6%) |
| Real Estate, Rental & Leasing | 41 (35.0%) | 76 (65.0%) |
| Professional & Scientific | 163 (64.9%) | 88 (35.1%) |
| Enterprise Management | 0 (0.0%) | 0 (0.0%) |
| Administrative & Support | 46 (76.7%) | 14 (23.3%) |
| Educational Services | 67 (33.5%) | 133 (66.5%) |
| Health Care & Social Assistance | 34 (30.6%) | 77 (69.4%) |
| Arts, Entertainment & Recreation | 10 (45.5%) | 12 (54.5%) |
| Accommodation & Food Services | 42 (53.2%) | 37 (46.8%) |
| Public Administration | 10 (50.0%) | 10 (50.0%) |
| Total | 856 (56.4%) | 662 (43.6%) |
Education in Holly Hills
School Enrollment in Holly Hills
The most common levels of schooling among the 572 students in Holly Hills are high school (131 | 22.9%), middle school (108 | 18.9%), and graduate / professional (100 | 17.5%).
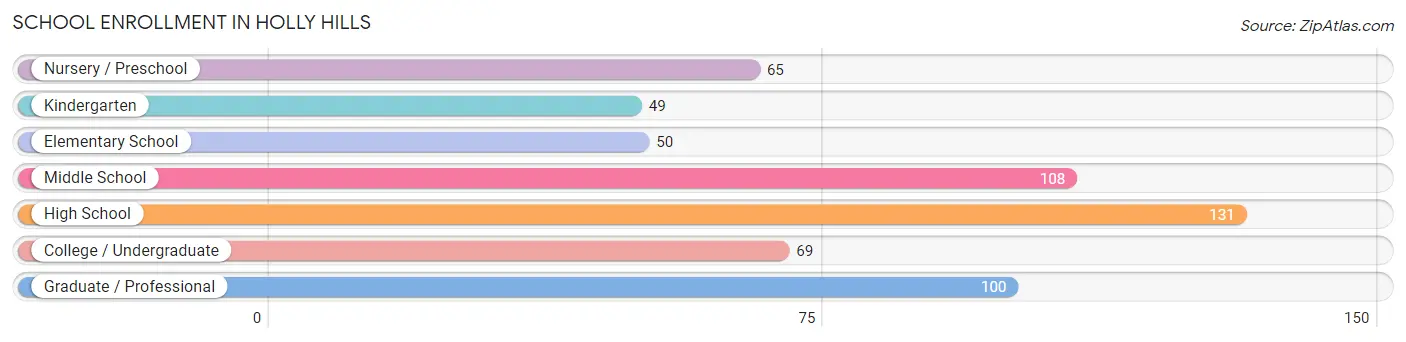
| School Level | # Students | % Students |
| Nursery / Preschool | 65 | 11.4% |
| Kindergarten | 49 | 8.6% |
| Elementary School | 50 | 8.7% |
| Middle School | 108 | 18.9% |
| High School | 131 | 22.9% |
| College / Undergraduate | 69 | 12.1% |
| Graduate / Professional | 100 | 17.5% |
| Total | 572 | 100.0% |
School Enrollment by Age by Funding Source in Holly Hills
Out of a total of 572 students who are enrolled in schools in Holly Hills, 165 (28.8%) attend a private institution, while the remaining 407 (71.2%) are enrolled in public schools. The age group of 3 to 4 year olds has the highest likelihood of being enrolled in private schools, with 52 (85.3% in the age bracket) enrolled. Conversely, the age group of 18 to 19 year olds has the lowest likelihood of being enrolled in a private school, with 6 (100.0% in the age bracket) attending a public institution.
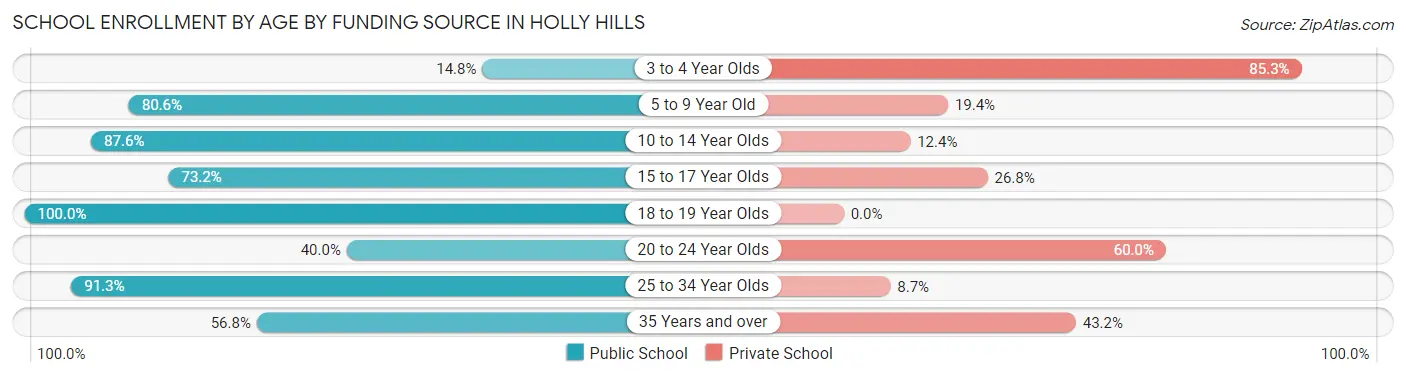
| Age Bracket | Public School | Private School |
| 3 to 4 Year Olds | 9 (14.7%) | 52 (85.3%) |
| 5 to 9 Year Old | 83 (80.6%) | 20 (19.4%) |
| 10 to 14 Year Olds | 106 (87.6%) | 15 (12.4%) |
| 15 to 17 Year Olds | 82 (73.2%) | 30 (26.8%) |
| 18 to 19 Year Olds | 6 (100.0%) | 0 (0.0%) |
| 20 to 24 Year Olds | 16 (40.0%) | 24 (60.0%) |
| 25 to 34 Year Olds | 84 (91.3%) | 8 (8.7%) |
| 35 Years and over | 21 (56.8%) | 16 (43.2%) |
| Total | 407 (71.2%) | 165 (28.8%) |
Educational Attainment by Field of Study in Holly Hills
Business (307 | 20.7%), social sciences (169 | 11.4%), science & technology (149 | 10.0%), education (134 | 9.0%), and bio, nature & agricultural (132 | 8.9%) are the most common fields of study among 1,485 individuals in Holly Hills who have obtained a bachelor's degree or higher.
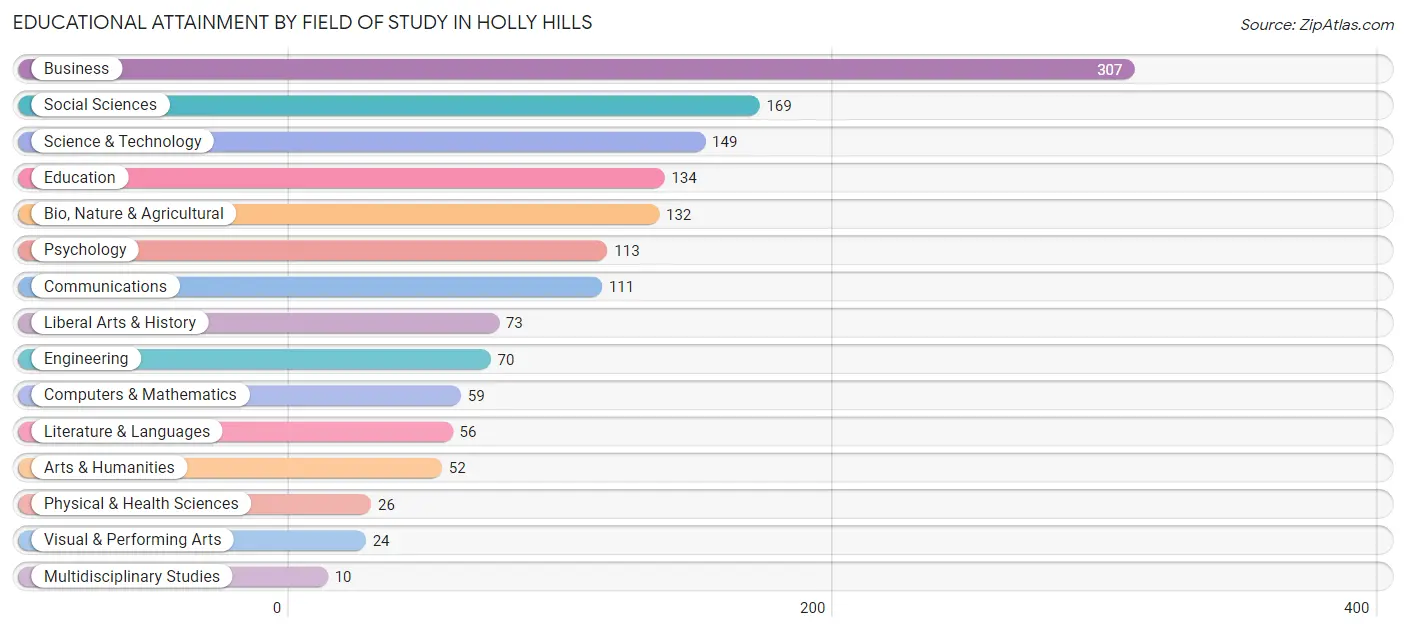
| Field of Study | # Graduates | % Graduates |
| Computers & Mathematics | 59 | 4.0% |
| Bio, Nature & Agricultural | 132 | 8.9% |
| Physical & Health Sciences | 26 | 1.8% |
| Psychology | 113 | 7.6% |
| Social Sciences | 169 | 11.4% |
| Engineering | 70 | 4.7% |
| Multidisciplinary Studies | 10 | 0.7% |
| Science & Technology | 149 | 10.0% |
| Business | 307 | 20.7% |
| Education | 134 | 9.0% |
| Literature & Languages | 56 | 3.8% |
| Liberal Arts & History | 73 | 4.9% |
| Visual & Performing Arts | 24 | 1.6% |
| Communications | 111 | 7.5% |
| Arts & Humanities | 52 | 3.5% |
| Total | 1,485 | 100.0% |
Transportation & Commute in Holly Hills
Vehicle Availability by Sex in Holly Hills
The most prevalent vehicle ownership categories in Holly Hills are males with 2 vehicles (422, accounting for 51.2%) and females with 2 vehicles (294, making up 63.7%).
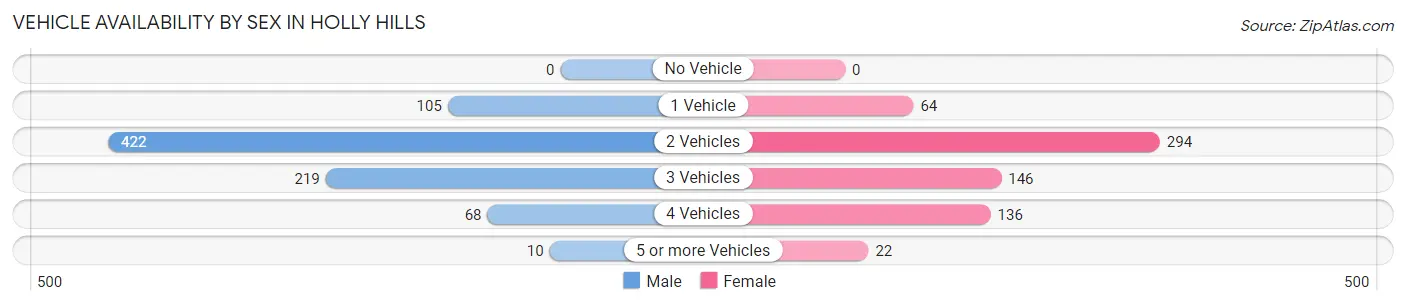
| Vehicles Available | Male | Female |
| No Vehicle | 0 (0.0%) | 0 (0.0%) |
| 1 Vehicle | 105 (12.7%) | 64 (9.7%) |
| 2 Vehicles | 422 (51.2%) | 294 (44.4%) |
| 3 Vehicles | 219 (26.6%) | 146 (22.1%) |
| 4 Vehicles | 68 (8.3%) | 136 (20.5%) |
| 5 or more Vehicles | 10 (1.2%) | 22 (3.3%) |
| Total | 824 (100.0%) | 662 (100.0%) |
Commute Time in Holly Hills
The most frequently occuring commute durations in Holly Hills are 15 to 19 minutes (280 commuters, 22.7%), 10 to 14 minutes (184 commuters, 14.9%), and 20 to 24 minutes (158 commuters, 12.8%).
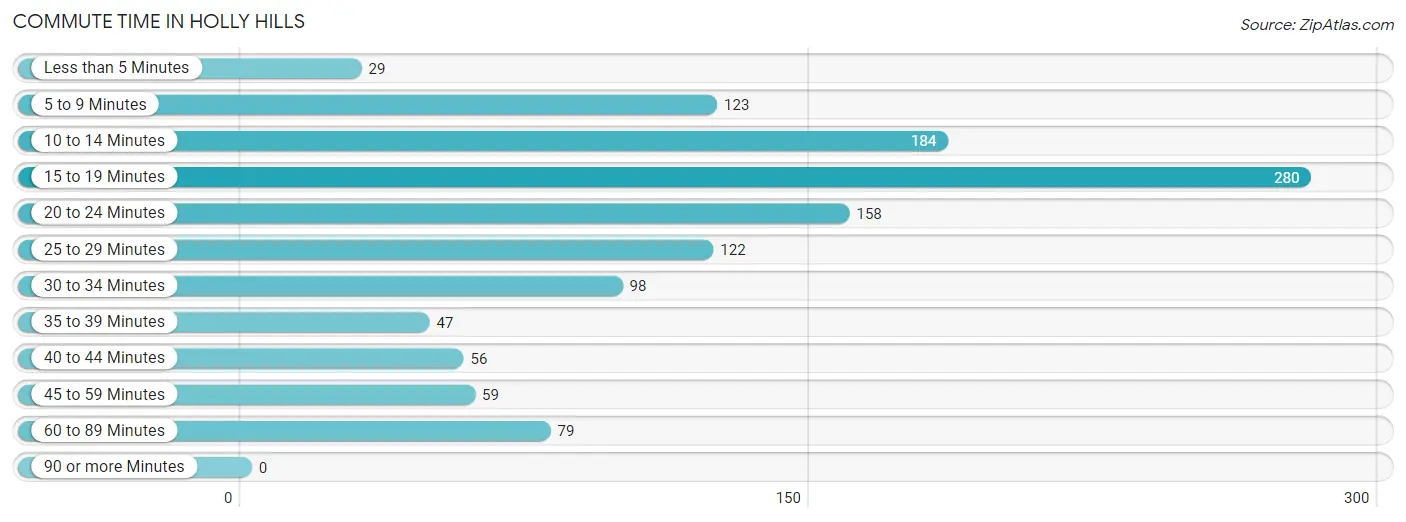
| Commute Time | # Commuters | % Commuters |
| Less than 5 Minutes | 29 | 2.4% |
| 5 to 9 Minutes | 123 | 10.0% |
| 10 to 14 Minutes | 184 | 14.9% |
| 15 to 19 Minutes | 280 | 22.7% |
| 20 to 24 Minutes | 158 | 12.8% |
| 25 to 29 Minutes | 122 | 9.9% |
| 30 to 34 Minutes | 98 | 7.9% |
| 35 to 39 Minutes | 47 | 3.8% |
| 40 to 44 Minutes | 56 | 4.5% |
| 45 to 59 Minutes | 59 | 4.8% |
| 60 to 89 Minutes | 79 | 6.4% |
| 90 or more Minutes | 0 | 0.0% |
Commute Time by Sex in Holly Hills
The most common commute times in Holly Hills are 10 to 14 minutes (130 commuters, 18.7%) for males and 15 to 19 minutes (182 commuters, 33.8%) for females.
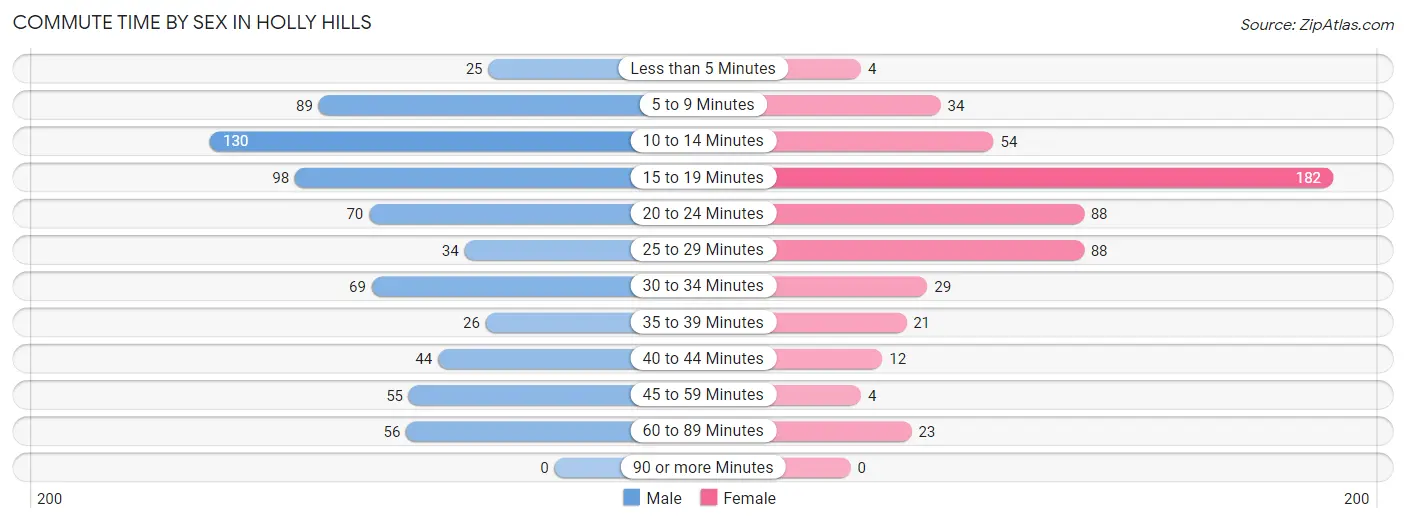
| Commute Time | Male | Female |
| Less than 5 Minutes | 25 (3.6%) | 4 (0.7%) |
| 5 to 9 Minutes | 89 (12.8%) | 34 (6.3%) |
| 10 to 14 Minutes | 130 (18.7%) | 54 (10.0%) |
| 15 to 19 Minutes | 98 (14.1%) | 182 (33.8%) |
| 20 to 24 Minutes | 70 (10.1%) | 88 (16.3%) |
| 25 to 29 Minutes | 34 (4.9%) | 88 (16.3%) |
| 30 to 34 Minutes | 69 (9.9%) | 29 (5.4%) |
| 35 to 39 Minutes | 26 (3.7%) | 21 (3.9%) |
| 40 to 44 Minutes | 44 (6.3%) | 12 (2.2%) |
| 45 to 59 Minutes | 55 (7.9%) | 4 (0.7%) |
| 60 to 89 Minutes | 56 (8.1%) | 23 (4.3%) |
| 90 or more Minutes | 0 (0.0%) | 0 (0.0%) |
Time of Departure to Work by Sex in Holly Hills
The most frequent times of departure to work in Holly Hills are 9:00 AM to 9:59 AM (97, 13.9%) for males and 7:30 AM to 7:59 AM (105, 19.5%) for females.
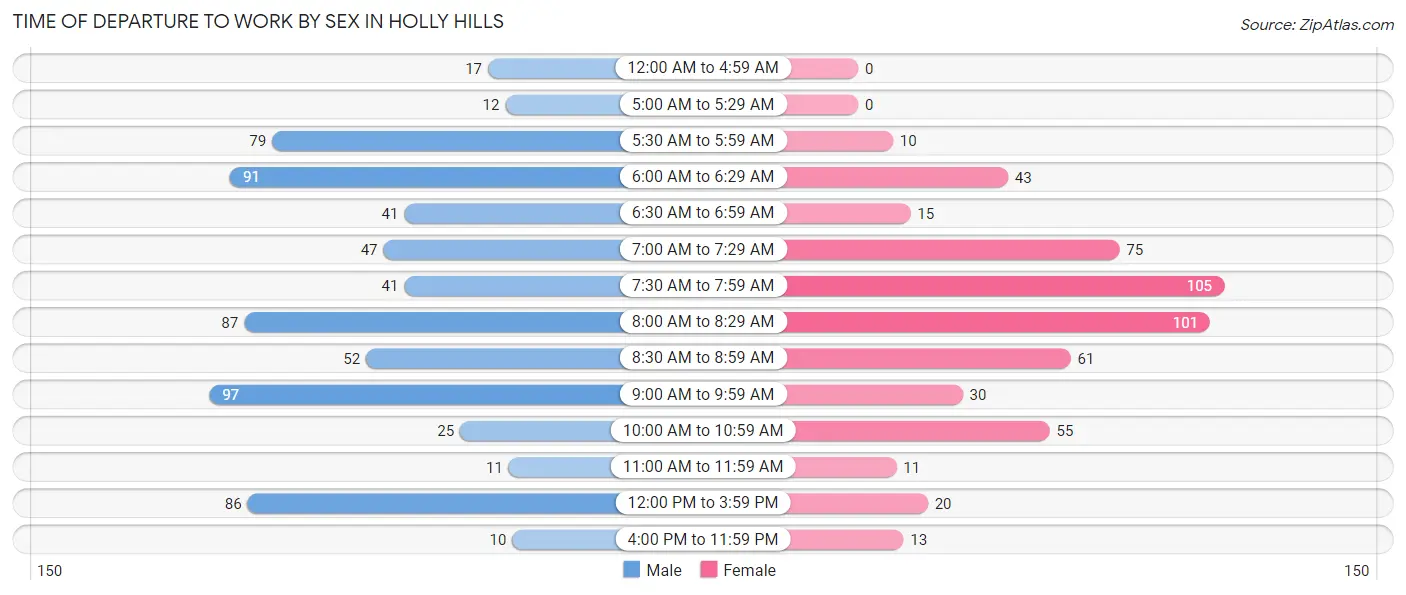
| Time of Departure | Male | Female |
| 12:00 AM to 4:59 AM | 17 (2.4%) | 0 (0.0%) |
| 5:00 AM to 5:29 AM | 12 (1.7%) | 0 (0.0%) |
| 5:30 AM to 5:59 AM | 79 (11.4%) | 10 (1.9%) |
| 6:00 AM to 6:29 AM | 91 (13.1%) | 43 (8.0%) |
| 6:30 AM to 6:59 AM | 41 (5.9%) | 15 (2.8%) |
| 7:00 AM to 7:29 AM | 47 (6.8%) | 75 (13.9%) |
| 7:30 AM to 7:59 AM | 41 (5.9%) | 105 (19.5%) |
| 8:00 AM to 8:29 AM | 87 (12.5%) | 101 (18.7%) |
| 8:30 AM to 8:59 AM | 52 (7.5%) | 61 (11.3%) |
| 9:00 AM to 9:59 AM | 97 (13.9%) | 30 (5.6%) |
| 10:00 AM to 10:59 AM | 25 (3.6%) | 55 (10.2%) |
| 11:00 AM to 11:59 AM | 11 (1.6%) | 11 (2.0%) |
| 12:00 PM to 3:59 PM | 86 (12.4%) | 20 (3.7%) |
| 4:00 PM to 11:59 PM | 10 (1.4%) | 13 (2.4%) |
| Total | 696 (100.0%) | 539 (100.0%) |
Housing Occupancy in Holly Hills
Occupancy by Ownership in Holly Hills
Of the total 1,004 dwellings in Holly Hills, owner-occupied units account for 886 (88.2%), while renter-occupied units make up 118 (11.7%).
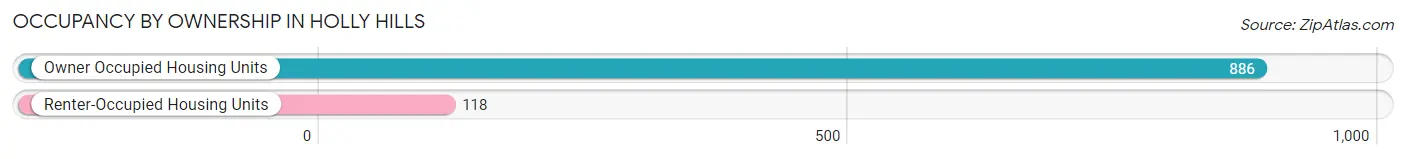
| Occupancy | # Housing Units | % Housing Units |
| Owner Occupied Housing Units | 886 | 88.2% |
| Renter-Occupied Housing Units | 118 | 11.7% |
| Total Occupied Housing Units | 1,004 | 100.0% |
Occupancy by Household Size in Holly Hills
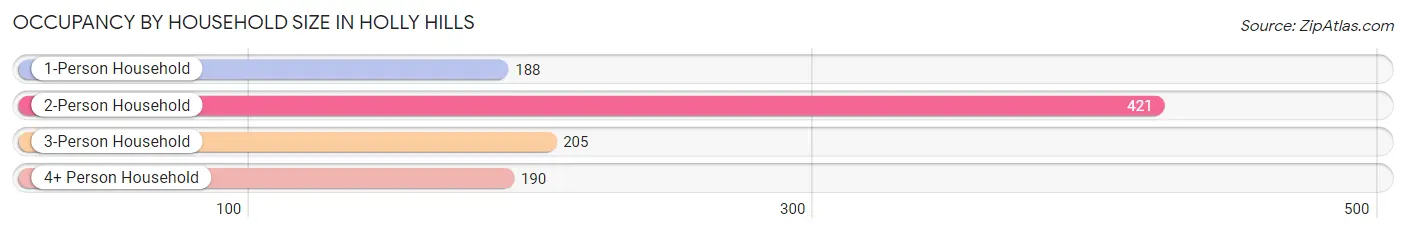
| Household Size | # Housing Units | % Housing Units |
| 1-Person Household | 188 | 18.7% |
| 2-Person Household | 421 | 41.9% |
| 3-Person Household | 205 | 20.4% |
| 4+ Person Household | 190 | 18.9% |
| Total Housing Units | 1,004 | 100.0% |
Occupancy by Ownership by Household Size in Holly Hills
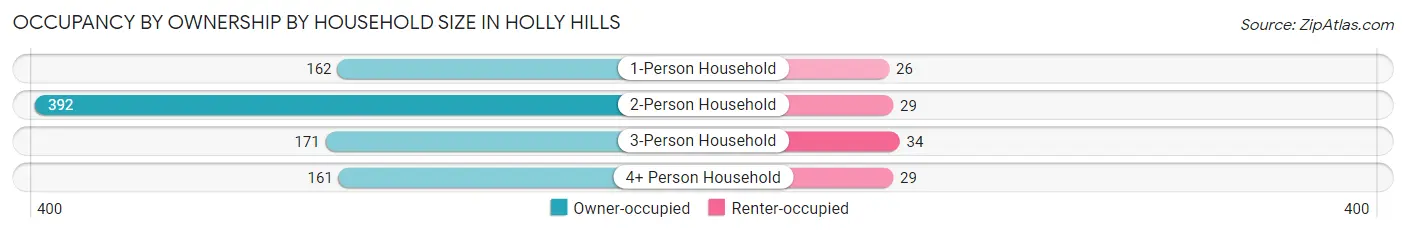
| Household Size | Owner-occupied | Renter-occupied |
| 1-Person Household | 162 (86.2%) | 26 (13.8%) |
| 2-Person Household | 392 (93.1%) | 29 (6.9%) |
| 3-Person Household | 171 (83.4%) | 34 (16.6%) |
| 4+ Person Household | 161 (84.7%) | 29 (15.3%) |
| Total Housing Units | 886 (88.2%) | 118 (11.7%) |
Occupancy by Educational Attainment in Holly Hills
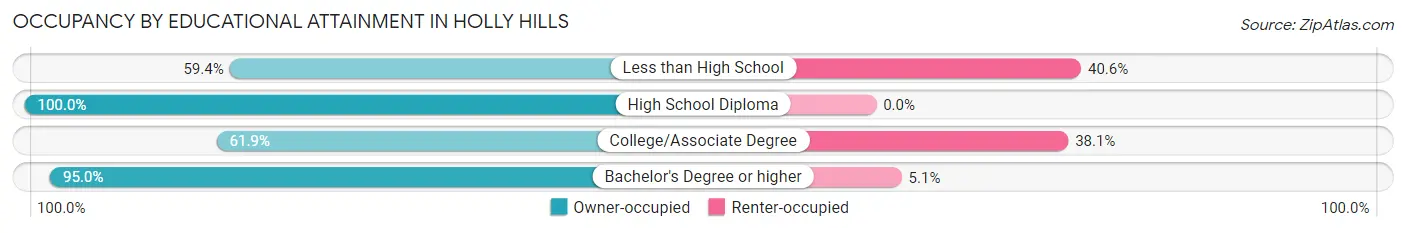
| Household Size | Owner-occupied | Renter-occupied |
| Less than High School | 19 (59.4%) | 13 (40.6%) |
| High School Diploma | 43 (100.0%) | 0 (0.0%) |
| College/Associate Degree | 109 (61.9%) | 67 (38.1%) |
| Bachelor's Degree or higher | 715 (95.0%) | 38 (5.1%) |
Occupancy by Age of Householder in Holly Hills
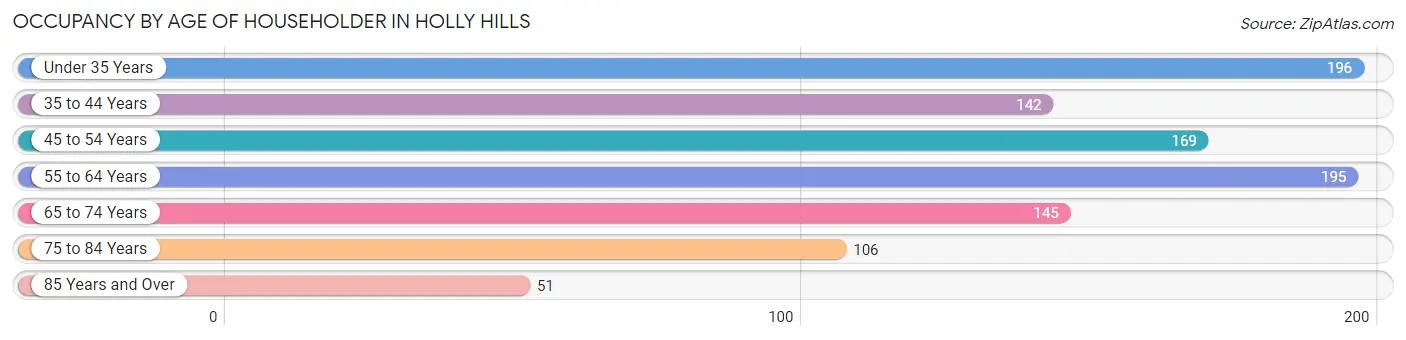
| Age Bracket | # Households | % Households |
| Under 35 Years | 196 | 19.5% |
| 35 to 44 Years | 142 | 14.1% |
| 45 to 54 Years | 169 | 16.8% |
| 55 to 64 Years | 195 | 19.4% |
| 65 to 74 Years | 145 | 14.4% |
| 75 to 84 Years | 106 | 10.6% |
| 85 Years and Over | 51 | 5.1% |
| Total | 1,004 | 100.0% |
Housing Finances in Holly Hills
Median Income by Occupancy in Holly Hills
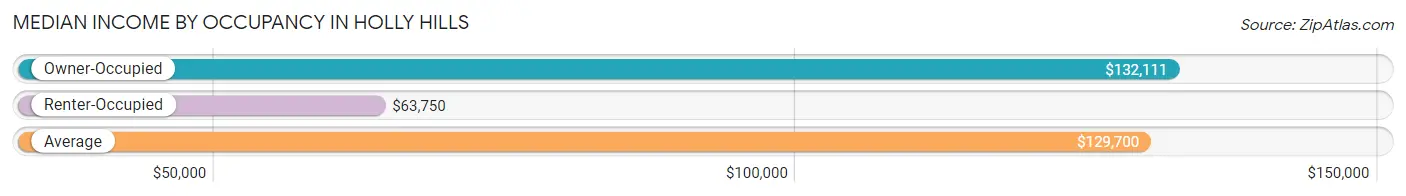
| Occupancy Type | # Households | Median Income |
| Owner-Occupied | 886 (88.2%) | $132,111 |
| Renter-Occupied | 118 (11.7%) | $63,750 |
| Average | 1,004 (100.0%) | $129,700 |
Occupancy by Householder Income Bracket in Holly Hills
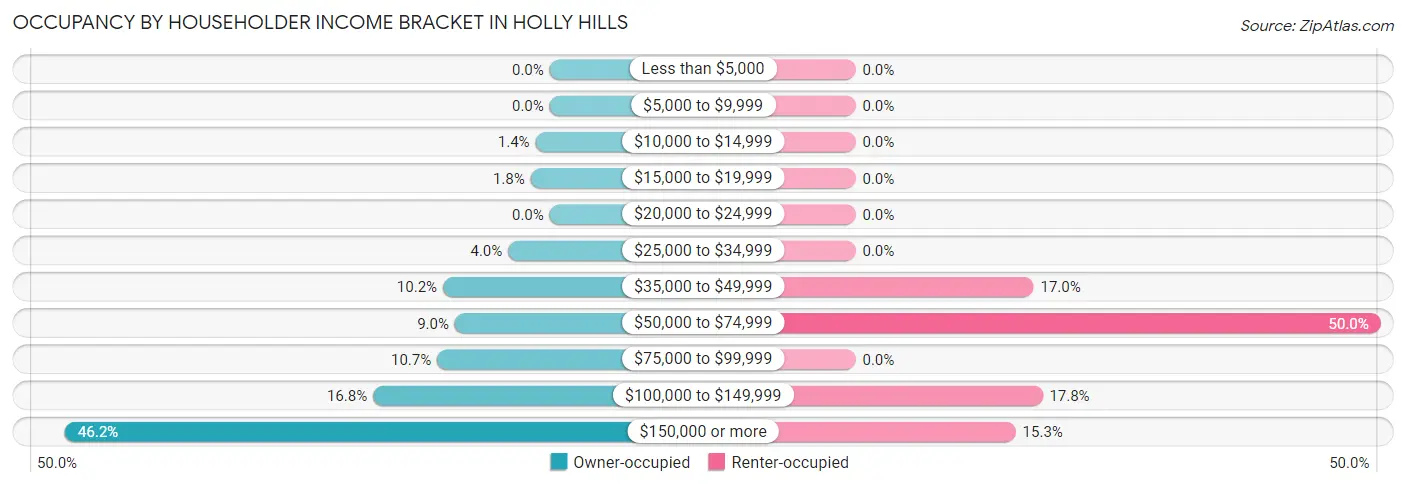
| Income Bracket | Owner-occupied | Renter-occupied |
| Less than $5,000 | 0 (0.0%) | 0 (0.0%) |
| $5,000 to $9,999 | 0 (0.0%) | 0 (0.0%) |
| $10,000 to $14,999 | 12 (1.3%) | 0 (0.0%) |
| $15,000 to $19,999 | 16 (1.8%) | 0 (0.0%) |
| $20,000 to $24,999 | 0 (0.0%) | 0 (0.0%) |
| $25,000 to $34,999 | 35 (4.0%) | 0 (0.0%) |
| $35,000 to $49,999 | 90 (10.2%) | 20 (17.0%) |
| $50,000 to $74,999 | 80 (9.0%) | 59 (50.0%) |
| $75,000 to $99,999 | 95 (10.7%) | 0 (0.0%) |
| $100,000 to $149,999 | 149 (16.8%) | 21 (17.8%) |
| $150,000 or more | 409 (46.2%) | 18 (15.2%) |
| Total | 886 (100.0%) | 118 (100.0%) |
Monthly Housing Cost Tiers in Holly Hills
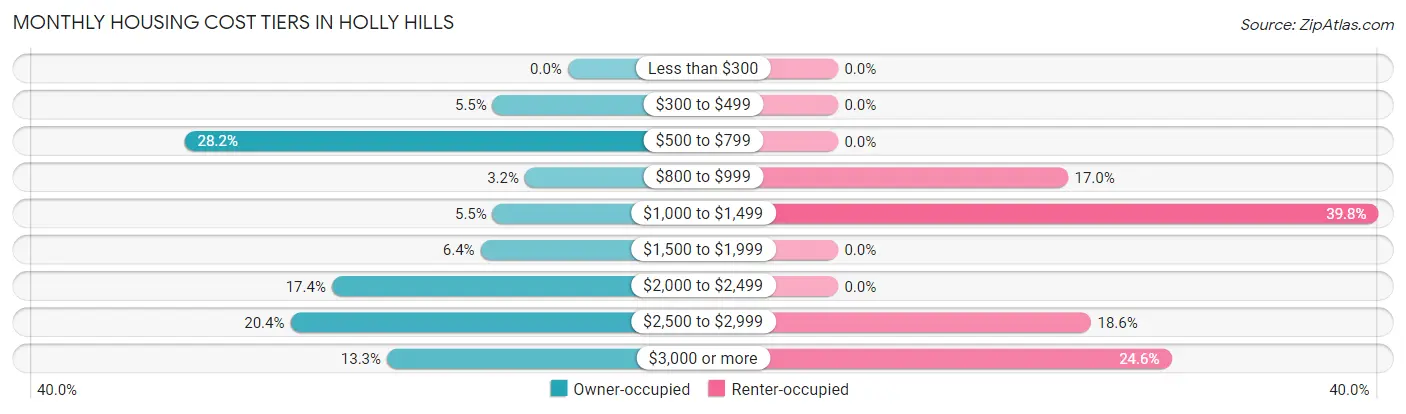
| Monthly Cost | Owner-occupied | Renter-occupied |
| Less than $300 | 0 (0.0%) | 0 (0.0%) |
| $300 to $499 | 49 (5.5%) | 0 (0.0%) |
| $500 to $799 | 250 (28.2%) | 0 (0.0%) |
| $800 to $999 | 28 (3.2%) | 20 (17.0%) |
| $1,000 to $1,499 | 49 (5.5%) | 47 (39.8%) |
| $1,500 to $1,999 | 57 (6.4%) | 0 (0.0%) |
| $2,000 to $2,499 | 154 (17.4%) | 0 (0.0%) |
| $2,500 to $2,999 | 181 (20.4%) | 22 (18.6%) |
| $3,000 or more | 118 (13.3%) | 29 (24.6%) |
| Total | 886 (100.0%) | 118 (100.0%) |
Physical Housing Characteristics in Holly Hills
Housing Structures in Holly Hills
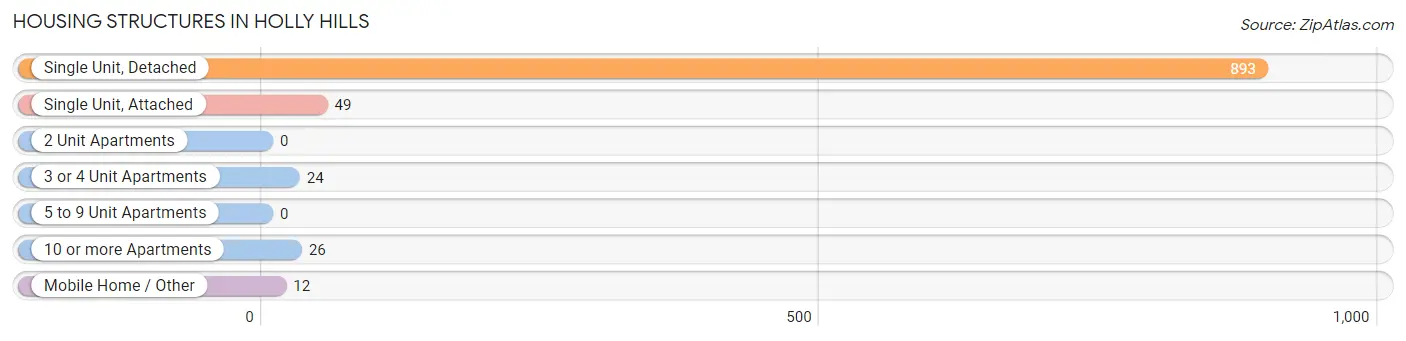
| Structure Type | # Housing Units | % Housing Units |
| Single Unit, Detached | 893 | 88.9% |
| Single Unit, Attached | 49 | 4.9% |
| 2 Unit Apartments | 0 | 0.0% |
| 3 or 4 Unit Apartments | 24 | 2.4% |
| 5 to 9 Unit Apartments | 0 | 0.0% |
| 10 or more Apartments | 26 | 2.6% |
| Mobile Home / Other | 12 | 1.2% |
| Total | 1,004 | 100.0% |
Housing Structures by Occupancy in Holly Hills
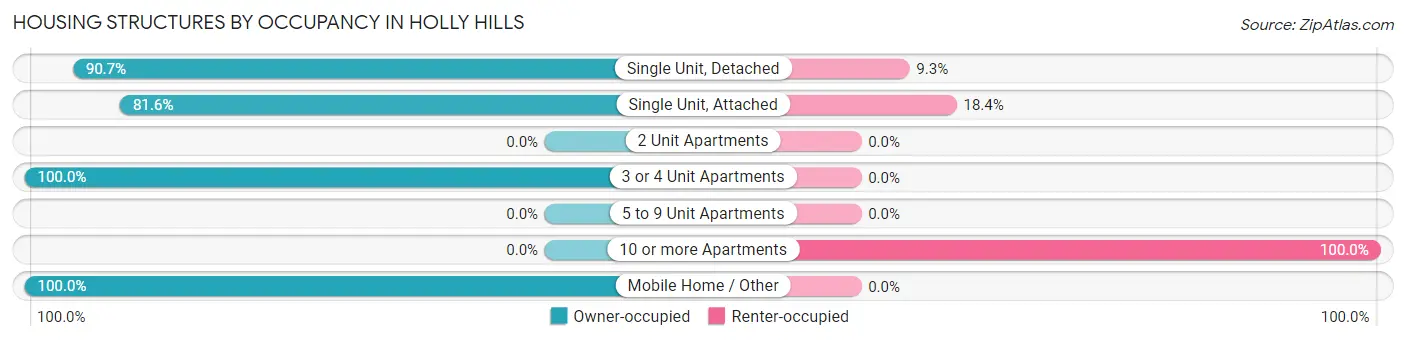
| Structure Type | Owner-occupied | Renter-occupied |
| Single Unit, Detached | 810 (90.7%) | 83 (9.3%) |
| Single Unit, Attached | 40 (81.6%) | 9 (18.4%) |
| 2 Unit Apartments | 0 (0.0%) | 0 (0.0%) |
| 3 or 4 Unit Apartments | 24 (100.0%) | 0 (0.0%) |
| 5 to 9 Unit Apartments | 0 (0.0%) | 0 (0.0%) |
| 10 or more Apartments | 0 (0.0%) | 26 (100.0%) |
| Mobile Home / Other | 12 (100.0%) | 0 (0.0%) |
| Total | 886 (88.2%) | 118 (11.7%) |
Housing Structures by Number of Rooms in Holly Hills
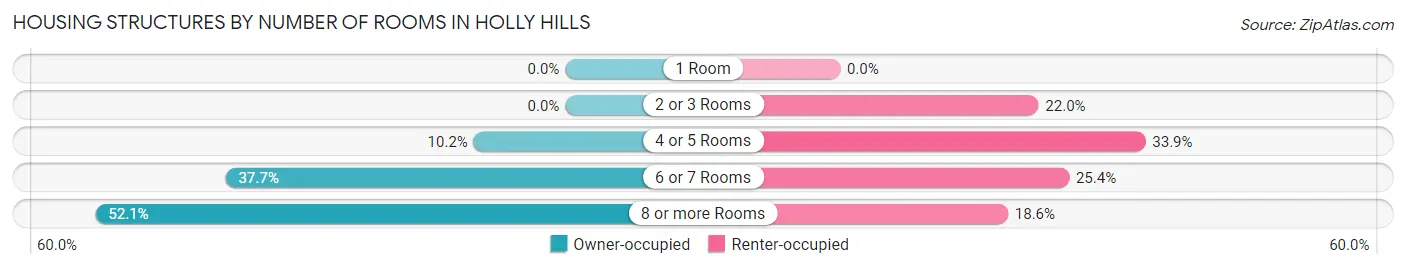
| Number of Rooms | Owner-occupied | Renter-occupied |
| 1 Room | 0 (0.0%) | 0 (0.0%) |
| 2 or 3 Rooms | 0 (0.0%) | 26 (22.0%) |
| 4 or 5 Rooms | 90 (10.2%) | 40 (33.9%) |
| 6 or 7 Rooms | 334 (37.7%) | 30 (25.4%) |
| 8 or more Rooms | 462 (52.1%) | 22 (18.6%) |
| Total | 886 (100.0%) | 118 (100.0%) |
Housing Structure by Heating Type in Holly Hills
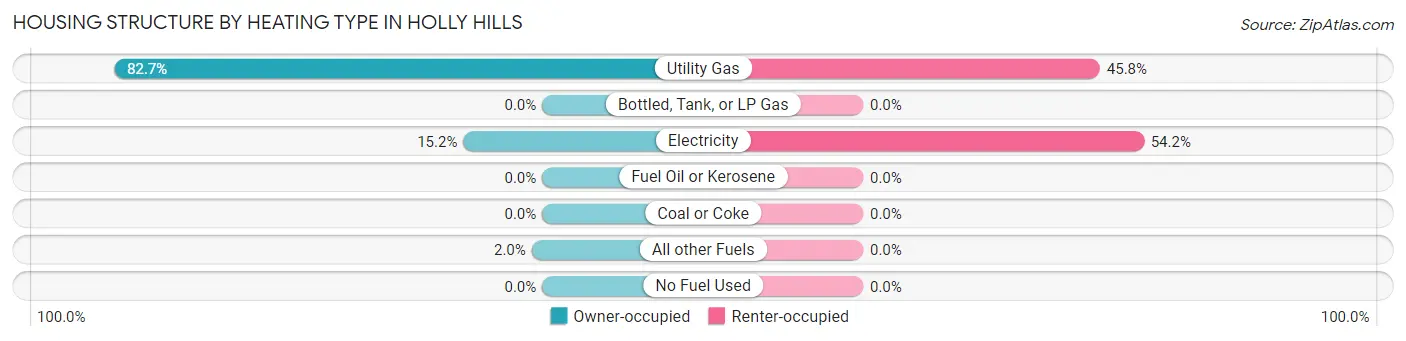
| Heating Type | Owner-occupied | Renter-occupied |
| Utility Gas | 733 (82.7%) | 54 (45.8%) |
| Bottled, Tank, or LP Gas | 0 (0.0%) | 0 (0.0%) |
| Electricity | 135 (15.2%) | 64 (54.2%) |
| Fuel Oil or Kerosene | 0 (0.0%) | 0 (0.0%) |
| Coal or Coke | 0 (0.0%) | 0 (0.0%) |
| All other Fuels | 18 (2.0%) | 0 (0.0%) |
| No Fuel Used | 0 (0.0%) | 0 (0.0%) |
| Total | 886 (100.0%) | 118 (100.0%) |
Household Vehicle Usage in Holly Hills
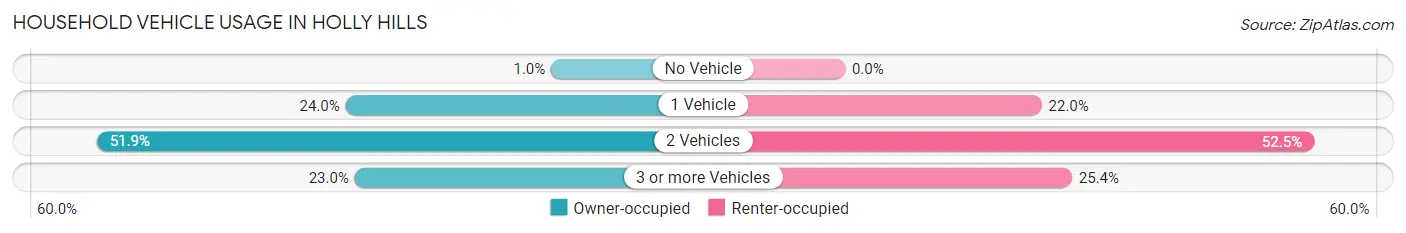
| Vehicles per Household | Owner-occupied | Renter-occupied |
| No Vehicle | 9 (1.0%) | 0 (0.0%) |
| 1 Vehicle | 213 (24.0%) | 26 (22.0%) |
| 2 Vehicles | 460 (51.9%) | 62 (52.5%) |
| 3 or more Vehicles | 204 (23.0%) | 30 (25.4%) |
| Total | 886 (100.0%) | 118 (100.0%) |
Real Estate & Mortgages in Holly Hills
Real Estate and Mortgage Overview in Holly Hills
| Characteristic | Without Mortgage | With Mortgage |
| Housing Units | 321 | 565 |
| Median Property Value | $579,300 | $627,500 |
| Median Household Income | $61,705 | $344 |
| Monthly Housing Costs | $595 | $118 |
| Real Estate Taxes | $2,616 | $0 |
Property Value by Mortgage Status in Holly Hills
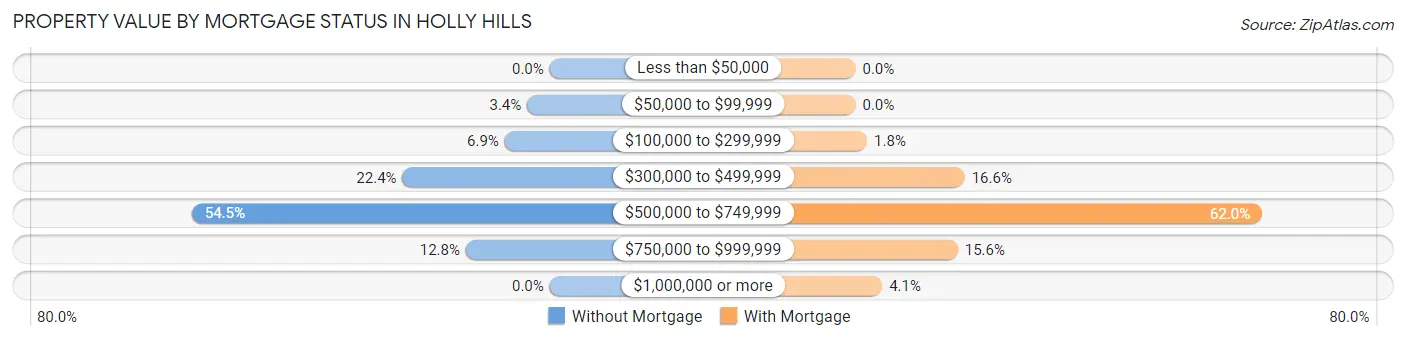
| Property Value | Without Mortgage | With Mortgage |
| Less than $50,000 | 0 (0.0%) | 0 (0.0%) |
| $50,000 to $99,999 | 11 (3.4%) | 0 (0.0%) |
| $100,000 to $299,999 | 22 (6.9%) | 10 (1.8%) |
| $300,000 to $499,999 | 72 (22.4%) | 94 (16.6%) |
| $500,000 to $749,999 | 175 (54.5%) | 350 (62.0%) |
| $750,000 to $999,999 | 41 (12.8%) | 88 (15.6%) |
| $1,000,000 or more | 0 (0.0%) | 23 (4.1%) |
| Total | 321 (100.0%) | 565 (100.0%) |
Household Income by Mortgage Status in Holly Hills
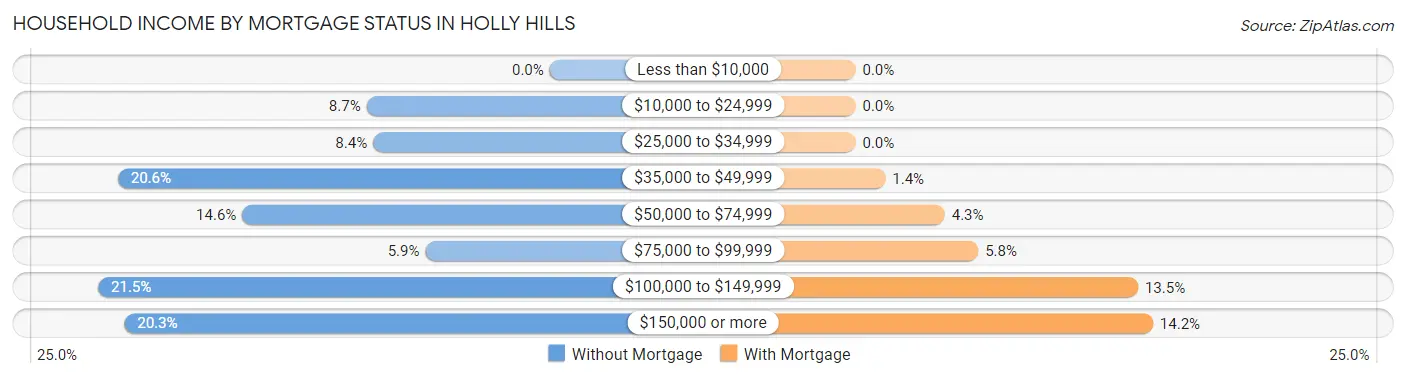
| Household Income | Without Mortgage | With Mortgage |
| Less than $10,000 | 0 (0.0%) | 0 (0.0%) |
| $10,000 to $24,999 | 28 (8.7%) | 0 (0.0%) |
| $25,000 to $34,999 | 27 (8.4%) | 0 (0.0%) |
| $35,000 to $49,999 | 66 (20.6%) | 8 (1.4%) |
| $50,000 to $74,999 | 47 (14.6%) | 24 (4.3%) |
| $75,000 to $99,999 | 19 (5.9%) | 33 (5.8%) |
| $100,000 to $149,999 | 69 (21.5%) | 76 (13.5%) |
| $150,000 or more | 65 (20.3%) | 80 (14.2%) |
| Total | 321 (100.0%) | 565 (100.0%) |
Property Value to Household Income Ratio in Holly Hills
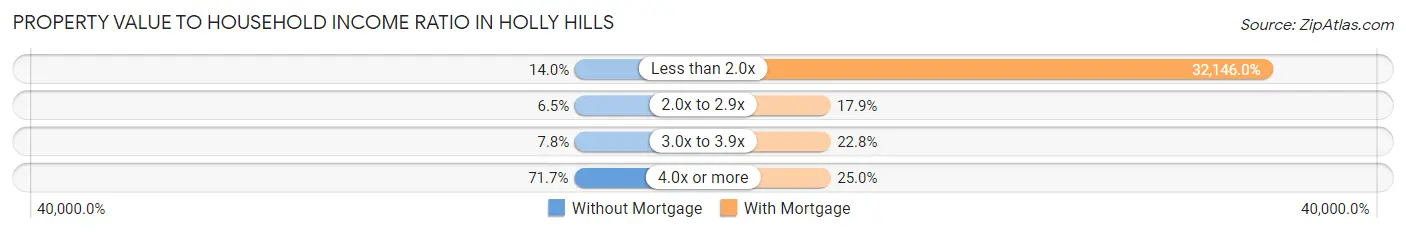
| Value-to-Income Ratio | Without Mortgage | With Mortgage |
| Less than 2.0x | 45 (14.0%) | 181,625 (32,146.0%) |
| 2.0x to 2.9x | 21 (6.5%) | 101 (17.9%) |
| 3.0x to 3.9x | 25 (7.8%) | 129 (22.8%) |
| 4.0x or more | 230 (71.7%) | 141 (25.0%) |
| Total | 321 (100.0%) | 565 (100.0%) |
Real Estate Taxes by Mortgage Status in Holly Hills
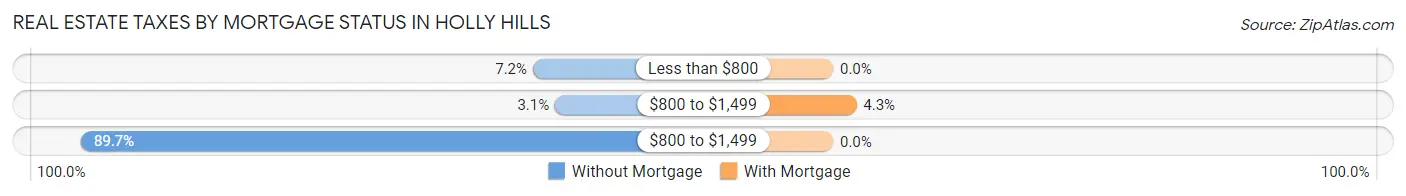
| Property Taxes | Without Mortgage | With Mortgage |
| Less than $800 | 23 (7.2%) | 0 (0.0%) |
| $800 to $1,499 | 10 (3.1%) | 24 (4.3%) |
| $800 to $1,499 | 288 (89.7%) | 0 (0.0%) |
| Total | 321 (100.0%) | 565 (100.0%) |
Health & Disability in Holly Hills
Health Insurance Coverage by Age in Holly Hills
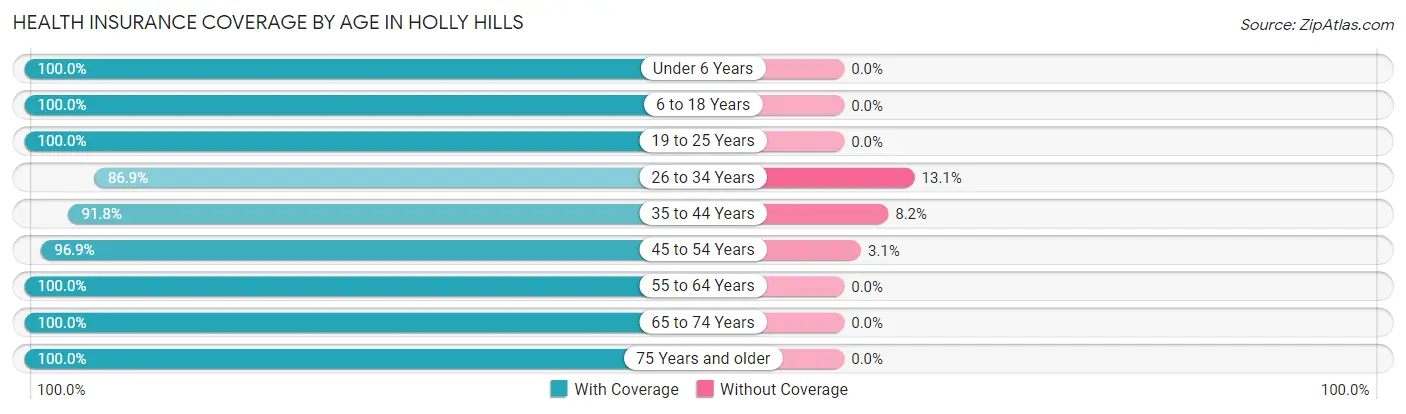
| Age Bracket | With Coverage | Without Coverage |
| Under 6 Years | 279 (100.0%) | 0 (0.0%) |
| 6 to 18 Years | 310 (100.0%) | 0 (0.0%) |
| 19 to 25 Years | 154 (100.0%) | 0 (0.0%) |
| 26 to 34 Years | 371 (86.9%) | 56 (13.1%) |
| 35 to 44 Years | 291 (91.8%) | 26 (8.2%) |
| 45 to 54 Years | 341 (96.9%) | 11 (3.1%) |
| 55 to 64 Years | 372 (100.0%) | 0 (0.0%) |
| 65 to 74 Years | 237 (100.0%) | 0 (0.0%) |
| 75 Years and older | 309 (100.0%) | 0 (0.0%) |
| Total | 2,664 (96.6%) | 93 (3.4%) |
Health Insurance Coverage by Citizenship Status in Holly Hills
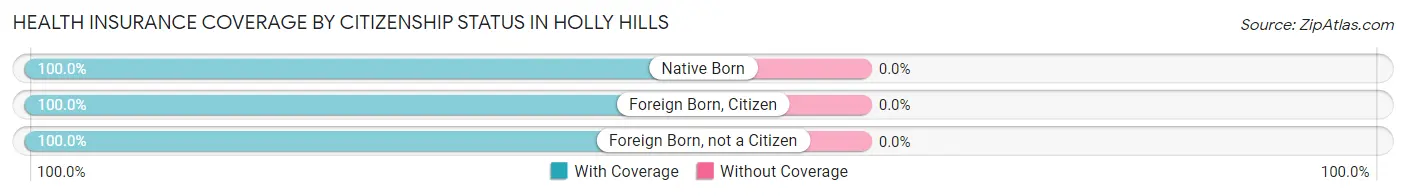
| Citizenship Status | With Coverage | Without Coverage |
| Native Born | 279 (100.0%) | 0 (0.0%) |
| Foreign Born, Citizen | 310 (100.0%) | 0 (0.0%) |
| Foreign Born, not a Citizen | 154 (100.0%) | 0 (0.0%) |
Health Insurance Coverage by Household Income in Holly Hills
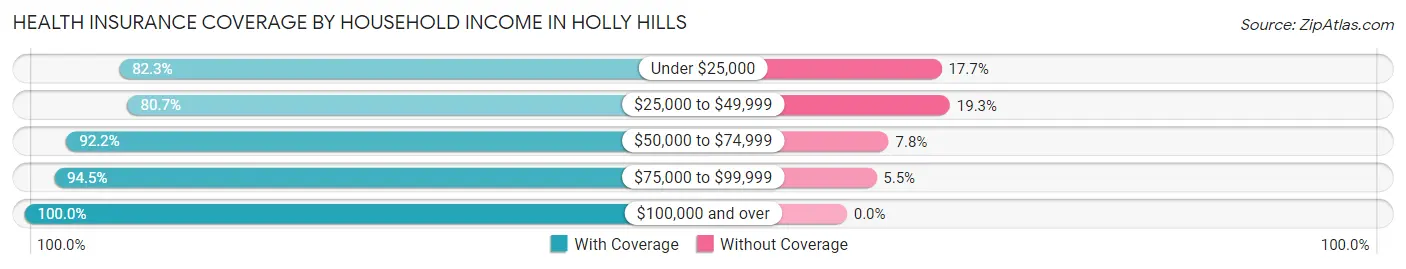
| Household Income | With Coverage | Without Coverage |
| Under $25,000 | 51 (82.3%) | 11 (17.7%) |
| $25,000 to $49,999 | 188 (80.7%) | 45 (19.3%) |
| $50,000 to $74,999 | 306 (92.2%) | 26 (7.8%) |
| $75,000 to $99,999 | 188 (94.5%) | 11 (5.5%) |
| $100,000 and over | 1,836 (100.0%) | 0 (0.0%) |
Public vs Private Health Insurance Coverage by Age in Holly Hills
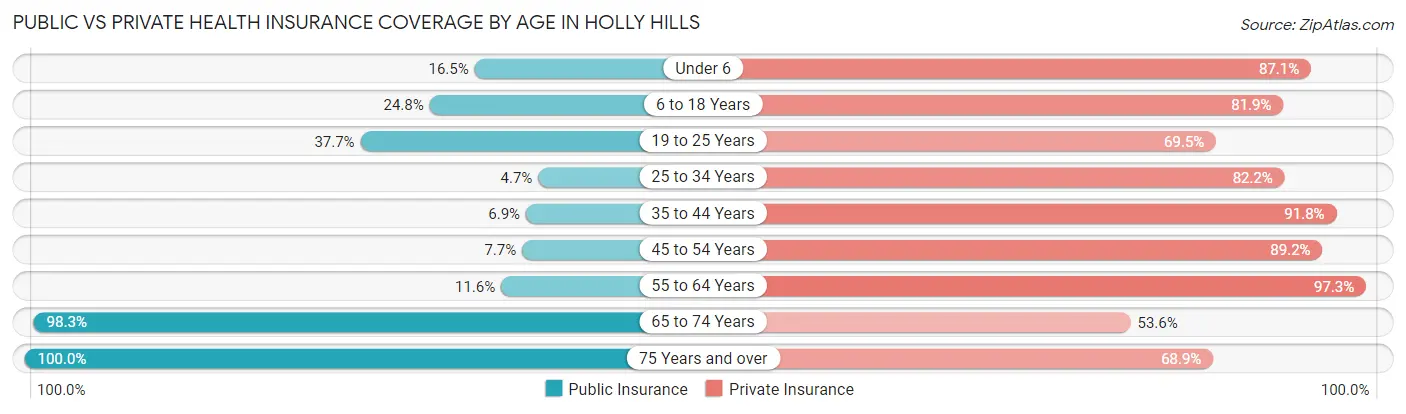
| Age Bracket | Public Insurance | Private Insurance |
| Under 6 | 46 (16.5%) | 243 (87.1%) |
| 6 to 18 Years | 77 (24.8%) | 254 (81.9%) |
| 19 to 25 Years | 58 (37.7%) | 107 (69.5%) |
| 25 to 34 Years | 20 (4.7%) | 351 (82.2%) |
| 35 to 44 Years | 22 (6.9%) | 291 (91.8%) |
| 45 to 54 Years | 27 (7.7%) | 314 (89.2%) |
| 55 to 64 Years | 43 (11.6%) | 362 (97.3%) |
| 65 to 74 Years | 233 (98.3%) | 127 (53.6%) |
| 75 Years and over | 309 (100.0%) | 213 (68.9%) |
| Total | 835 (30.3%) | 2,262 (82.1%) |
Disability Status by Sex by Age in Holly Hills
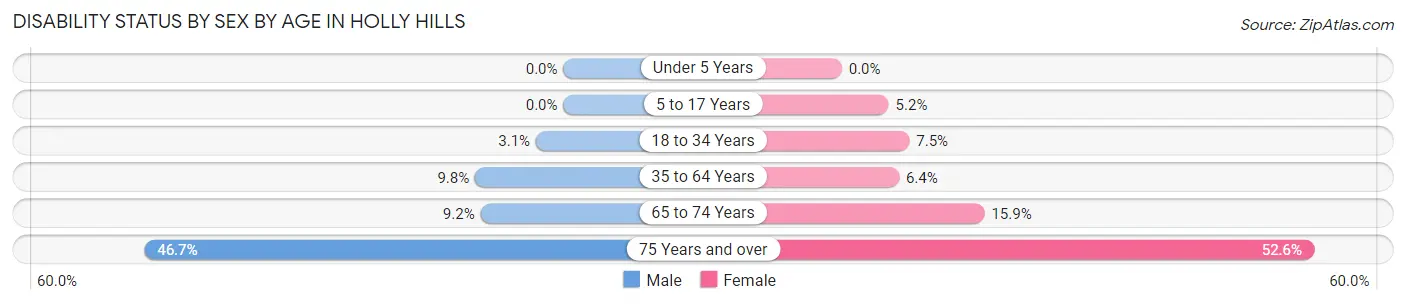
| Age Bracket | Male | Female |
| Under 5 Years | 0 (0.0%) | 0 (0.0%) |
| 5 to 17 Years | 0 (0.0%) | 7 (5.2%) |
| 18 to 34 Years | 11 (3.0%) | 17 (7.5%) |
| 35 to 64 Years | 53 (9.8%) | 32 (6.4%) |
| 65 to 74 Years | 12 (9.2%) | 17 (15.9%) |
| 75 Years and over | 35 (46.7%) | 123 (52.6%) |
Disability Class by Sex by Age in Holly Hills
Disability Class: Hearing Difficulty
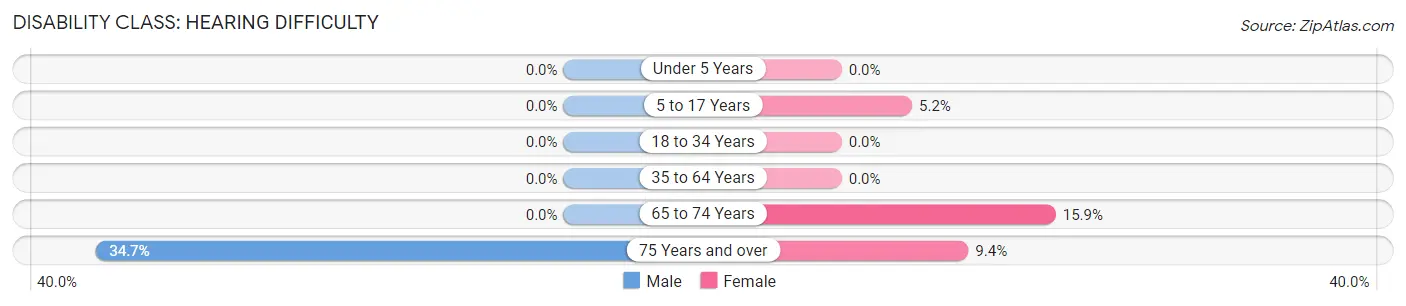
| Age Bracket | Male | Female |
| Under 5 Years | 0 (0.0%) | 0 (0.0%) |
| 5 to 17 Years | 0 (0.0%) | 7 (5.2%) |
| 18 to 34 Years | 0 (0.0%) | 0 (0.0%) |
| 35 to 64 Years | 0 (0.0%) | 0 (0.0%) |
| 65 to 74 Years | 0 (0.0%) | 17 (15.9%) |
| 75 Years and over | 26 (34.7%) | 22 (9.4%) |
Disability Class: Vision Difficulty
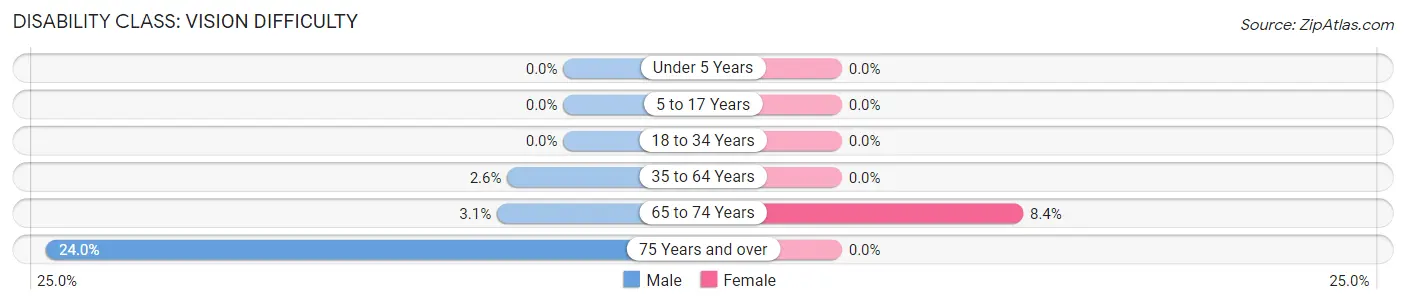
| Age Bracket | Male | Female |
| Under 5 Years | 0 (0.0%) | 0 (0.0%) |
| 5 to 17 Years | 0 (0.0%) | 0 (0.0%) |
| 18 to 34 Years | 0 (0.0%) | 0 (0.0%) |
| 35 to 64 Years | 14 (2.6%) | 0 (0.0%) |
| 65 to 74 Years | 4 (3.1%) | 9 (8.4%) |
| 75 Years and over | 18 (24.0%) | 0 (0.0%) |
Disability Class: Cognitive Difficulty
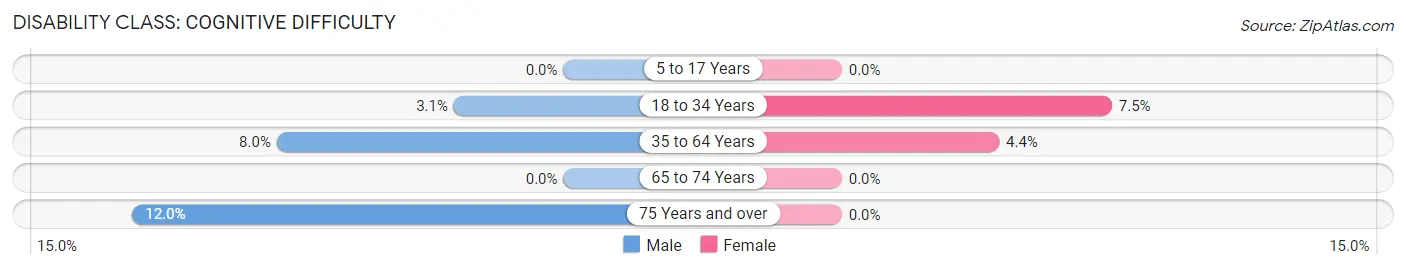
| Age Bracket | Male | Female |
| 5 to 17 Years | 0 (0.0%) | 0 (0.0%) |
| 18 to 34 Years | 11 (3.0%) | 17 (7.5%) |
| 35 to 64 Years | 43 (8.0%) | 22 (4.4%) |
| 65 to 74 Years | 0 (0.0%) | 0 (0.0%) |
| 75 Years and over | 9 (12.0%) | 0 (0.0%) |
Disability Class: Ambulatory Difficulty
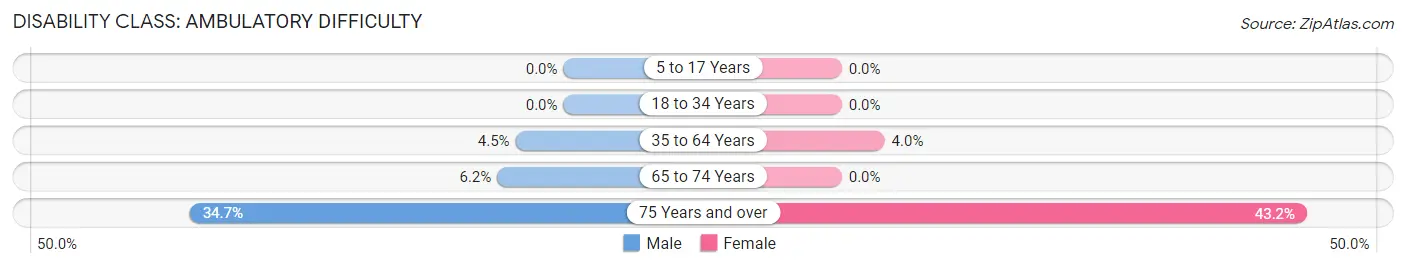
| Age Bracket | Male | Female |
| 5 to 17 Years | 0 (0.0%) | 0 (0.0%) |
| 18 to 34 Years | 0 (0.0%) | 0 (0.0%) |
| 35 to 64 Years | 24 (4.4%) | 20 (4.0%) |
| 65 to 74 Years | 8 (6.1%) | 0 (0.0%) |
| 75 Years and over | 26 (34.7%) | 101 (43.2%) |
Disability Class: Self-Care Difficulty
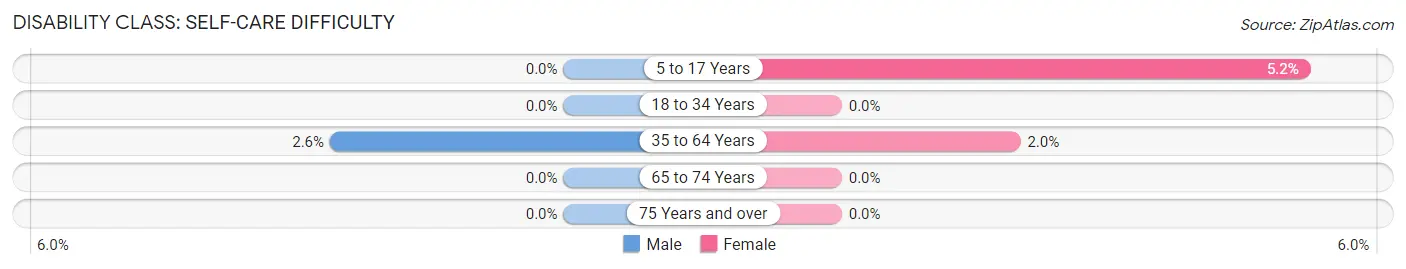
| Age Bracket | Male | Female |
| 5 to 17 Years | 0 (0.0%) | 7 (5.2%) |
| 18 to 34 Years | 0 (0.0%) | 0 (0.0%) |
| 35 to 64 Years | 14 (2.6%) | 10 (2.0%) |
| 65 to 74 Years | 0 (0.0%) | 0 (0.0%) |
| 75 Years and over | 0 (0.0%) | 0 (0.0%) |
Technology Access in Holly Hills
Computing Device Access in Holly Hills
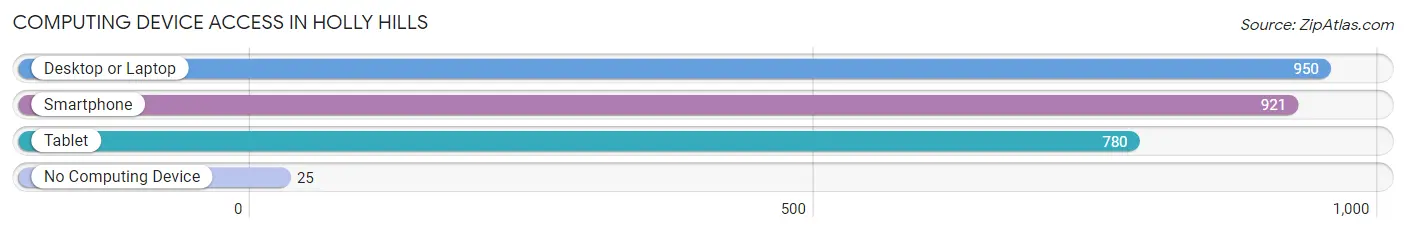
| Device Type | # Households | % Households |
| Desktop or Laptop | 950 | 94.6% |
| Smartphone | 921 | 91.7% |
| Tablet | 780 | 77.7% |
| No Computing Device | 25 | 2.5% |
| Total | 1,004 | 100.0% |
Internet Access in Holly Hills
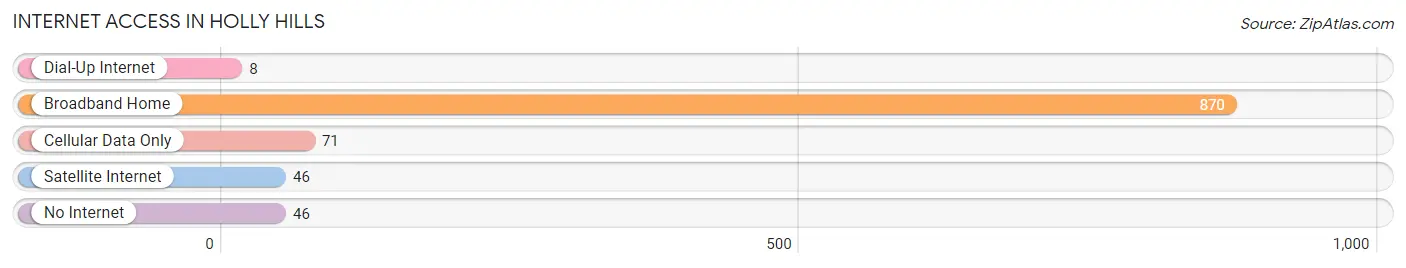
| Internet Type | # Households | % Households |
| Dial-Up Internet | 8 | 0.8% |
| Broadband Home | 870 | 86.7% |
| Cellular Data Only | 71 | 7.1% |
| Satellite Internet | 46 | 4.6% |
| No Internet | 46 | 4.6% |
| Total | 1,004 | 100.0% |
Holly Hills Summary
Holly Hills is a small town located in the foothills of the Rocky Mountains in Colorado. It is situated in the northern part of the state, about 25 miles north of Denver. The town has a population of just over 1,000 people and is known for its rural charm and small-town atmosphere.
History
Holly Hills was founded in 1872 by a group of settlers from the Midwest. The town was named after the holly trees that grew in the area. The settlers were attracted to the area due to its proximity to Denver and the abundance of natural resources. The town quickly grew and by the early 1900s, it had become a popular destination for tourists and outdoor enthusiasts.
In the early 1900s, the town was home to a number of businesses, including a hotel, a general store, a blacksmith, and a post office. The town also had a school, a church, and a library. The town was also home to a number of farms, which provided the town with much of its food and other goods.
Geography
Holly Hills is located in the foothills of the Rocky Mountains in Colorado. The town is situated in the northern part of the state, about 25 miles north of Denver. The town is surrounded by rolling hills and is situated at an elevation of 6,000 feet. The town is located in a valley, which is surrounded by mountains on all sides. The town is also located near several rivers, including the South Platte River and the Cache La Poudre River.
Economy
Holly Hills is a small town with a limited economy. The town is primarily supported by tourism, as it is a popular destination for outdoor enthusiasts. The town also has a number of small businesses, including restaurants, shops, and galleries. The town also has a number of farms, which provide the town with much of its food and other goods.
Demographics
As of the 2010 census, the population of Holly Hills was 1,072. The town is predominantly white, with 94.3% of the population being white. The town also has a small Hispanic population, with 4.2% of the population being Hispanic. The median household income in the town is $50,000, and the median home value is $250,000. The town also has a low unemployment rate, with only 3.2% of the population being unemployed.
Conclusion
Holly Hills is a small town located in the foothills of the Rocky Mountains in Colorado. The town has a population of just over 1,000 people and is known for its rural charm and small-town atmosphere. The town is primarily supported by tourism, as it is a popular destination for outdoor enthusiasts. The town also has a number of small businesses, including restaurants, shops, and galleries. The town is predominantly white, with 94.3% of the population being white. The median household income in the town is $50,000, and the median home value is $250,000. The town also has a low unemployment rate, with only 3.2% of the population being unemployed.
Common Questions
What is Per Capita Income in Holly Hills?
Per Capita income in Holly Hills is $62,356.
What is the Median Family Income in Holly Hills?
Median Family Income in Holly Hills is $155,417.
What is the Median Household income in Holly Hills?
Median Household Income in Holly Hills is $129,700.
What is Income or Wage Gap in Holly Hills?
Income or Wage Gap in Holly Hills is 5.1%.
Women in Holly Hills earn 94.9 cents for every dollar earned by a man.
What is Inequality or Gini Index in Holly Hills?
Inequality or Gini Index in Holly Hills is 0.42.
What is the Total Population of Holly Hills?
Total Population of Holly Hills is 2,801.
What is the Total Male Population of Holly Hills?
Total Male Population of Holly Hills is 1,434.
What is the Total Female Population of Holly Hills?
Total Female Population of Holly Hills is 1,367.
What is the Ratio of Males per 100 Females in Holly Hills?
There are 104.90 Males per 100 Females in Holly Hills.
What is the Ratio of Females per 100 Males in Holly Hills?
There are 95.33 Females per 100 Males in Holly Hills.
What is the Median Population Age in Holly Hills?
Median Population Age in Holly Hills is 42.4 Years.
What is the Average Family Size in Holly Hills
Average Family Size in Holly Hills is 3.0 People.
What is the Average Household Size in Holly Hills
Average Household Size in Holly Hills is 2.6 People.
How Large is the Labor Force in Holly Hills?
There are 1,537 People in the Labor Forcein in Holly Hills.
What is the Percentage of People in the Labor Force in Holly Hills?
66.3% of People are in the Labor Force in Holly Hills.
What is the Unemployment Rate in Holly Hills?
Unemployment Rate in Holly Hills is 1.3%.