Johnstown, CO Map & Demographics
Johnstown Map
Johnstown Overview
$47,480
PER CAPITA INCOME
$132,296
AVG FAMILY INCOME
$120,395
AVG HOUSEHOLD INCOME
32.2%
WAGE / INCOME GAP [ % ]
67.8¢/ $1
WAGE / INCOME GAP [ $ ]
0.39
INEQUALITY / GINI INDEX
17,327
TOTAL POPULATION
9,586
MALE POPULATION
7,741
FEMALE POPULATION
123.83
MALES / 100 FEMALES
80.75
FEMALES / 100 MALES
35.1
MEDIAN AGE
3.1
AVG FAMILY SIZE
2.7
AVG HOUSEHOLD SIZE
10,051
LABOR FORCE [ PEOPLE ]
76.5%
PERCENT IN LABOR FORCE
5.4%
UNEMPLOYMENT RATE
Johnstown Zip Codes
Johnstown Area Codes
Income in Johnstown
Income Overview in Johnstown
Per Capita Income in Johnstown is $47,480, while median incomes of families and households are $132,296 and $120,395 respectively.
| Characteristic | Number | Measure |
| Per Capita Income | 17,327 | $47,480 |
| Median Family Income | 4,665 | $132,296 |
| Mean Family Income | 4,665 | $143,222 |
| Median Household Income | 6,524 | $120,395 |
| Mean Household Income | 6,524 | $125,082 |
| Income Deficit | 4,665 | $0 |
| Wage / Income Gap (%) | 17,327 | 32.24% |
| Wage / Income Gap ($) | 17,327 | 67.76¢ per $1 |
| Gini / Inequality Index | 17,327 | 0.39 |
Earnings by Sex in Johnstown
Average Earnings in Johnstown are $64,490, $69,620 for men and $47,173 for women, a difference of 32.2%.
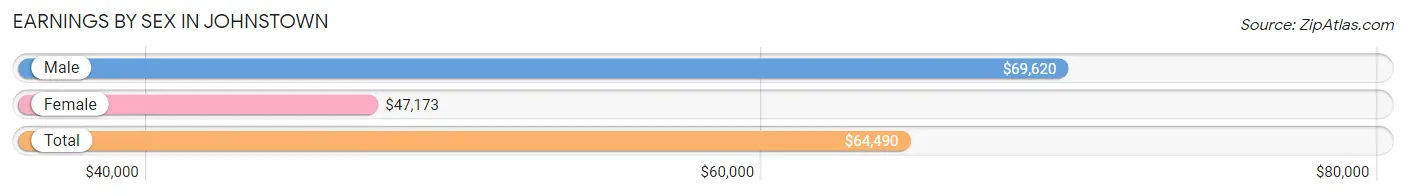
| Sex | Number | Average Earnings |
| Male | 5,809 (56.9%) | $69,620 |
| Female | 4,402 (43.1%) | $47,173 |
| Total | 10,211 (100.0%) | $64,490 |
Earnings by Sex by Income Bracket in Johnstown
The most common earnings brackets in Johnstown are $100,000+ for men (1,725 | 29.7%) and $100,000+ for women (774 | 17.6%).
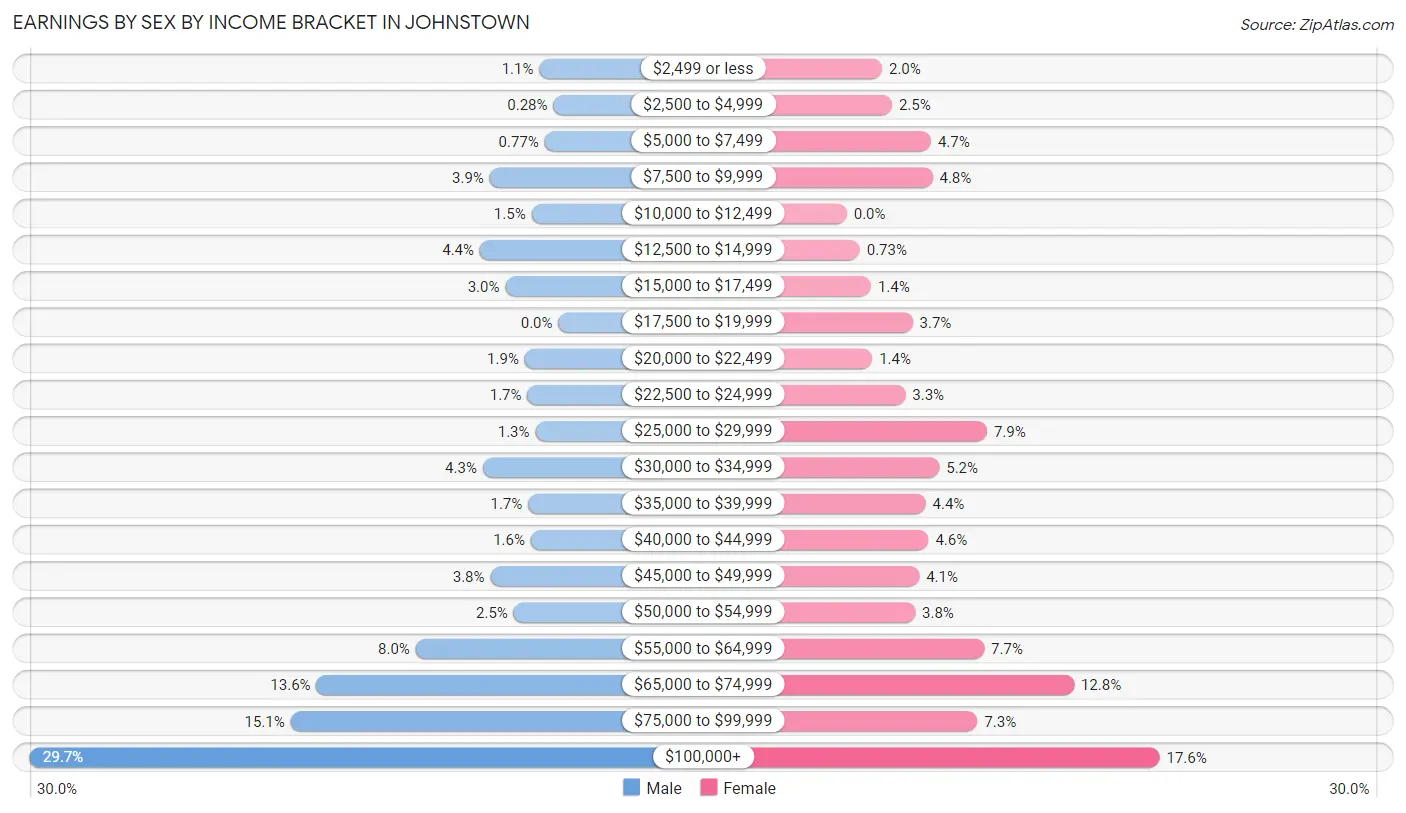
| Income | Male | Female |
| $2,499 or less | 62 (1.1%) | 87 (2.0%) |
| $2,500 to $4,999 | 16 (0.3%) | 112 (2.5%) |
| $5,000 to $7,499 | 45 (0.8%) | 208 (4.7%) |
| $7,500 to $9,999 | 224 (3.9%) | 212 (4.8%) |
| $10,000 to $12,499 | 88 (1.5%) | 0 (0.0%) |
| $12,500 to $14,999 | 256 (4.4%) | 32 (0.7%) |
| $15,000 to $17,499 | 173 (3.0%) | 60 (1.4%) |
| $17,500 to $19,999 | 0 (0.0%) | 163 (3.7%) |
| $20,000 to $22,499 | 110 (1.9%) | 63 (1.4%) |
| $22,500 to $24,999 | 101 (1.7%) | 145 (3.3%) |
| $25,000 to $29,999 | 75 (1.3%) | 347 (7.9%) |
| $30,000 to $34,999 | 247 (4.3%) | 229 (5.2%) |
| $35,000 to $39,999 | 99 (1.7%) | 195 (4.4%) |
| $40,000 to $44,999 | 90 (1.5%) | 202 (4.6%) |
| $45,000 to $49,999 | 222 (3.8%) | 179 (4.1%) |
| $50,000 to $54,999 | 146 (2.5%) | 169 (3.8%) |
| $55,000 to $64,999 | 466 (8.0%) | 340 (7.7%) |
| $65,000 to $74,999 | 790 (13.6%) | 562 (12.8%) |
| $75,000 to $99,999 | 874 (15.0%) | 323 (7.3%) |
| $100,000+ | 1,725 (29.7%) | 774 (17.6%) |
| Total | 5,809 (100.0%) | 4,402 (100.0%) |
Earnings by Sex by Educational Attainment in Johnstown
Average earnings in Johnstown are $76,422 for men and $61,237 for women, a difference of 19.9%. Men with an educational attainment of bachelor's degree enjoy the highest average annual earnings of $100,240, while those with less than high school education earn the least with $41,404. Women with an educational attainment of graduate degree earn the most with the average annual earnings of $69,316, while those with less than high school education have the smallest earnings of $29,323.
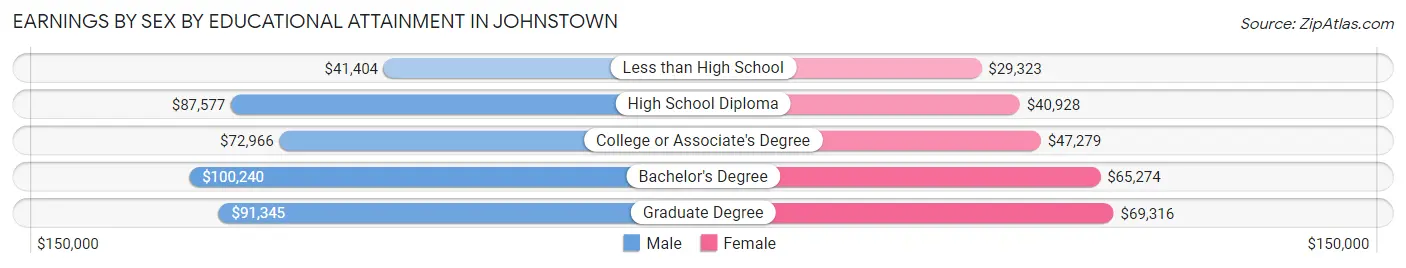
| Educational Attainment | Male Income | Female Income |
| Less than High School | $41,404 | $29,323 |
| High School Diploma | $87,577 | $40,928 |
| College or Associate's Degree | $72,966 | $47,279 |
| Bachelor's Degree | $100,240 | $65,274 |
| Graduate Degree | $91,345 | $69,316 |
| Total | $76,422 | $61,237 |
Family Income in Johnstown
Family Income Brackets in Johnstown
According to the Johnstown family income data, there are 1,423 families falling into the $100,000 to $149,999 income range, which is the most common income bracket and makes up 30.5% of all families.
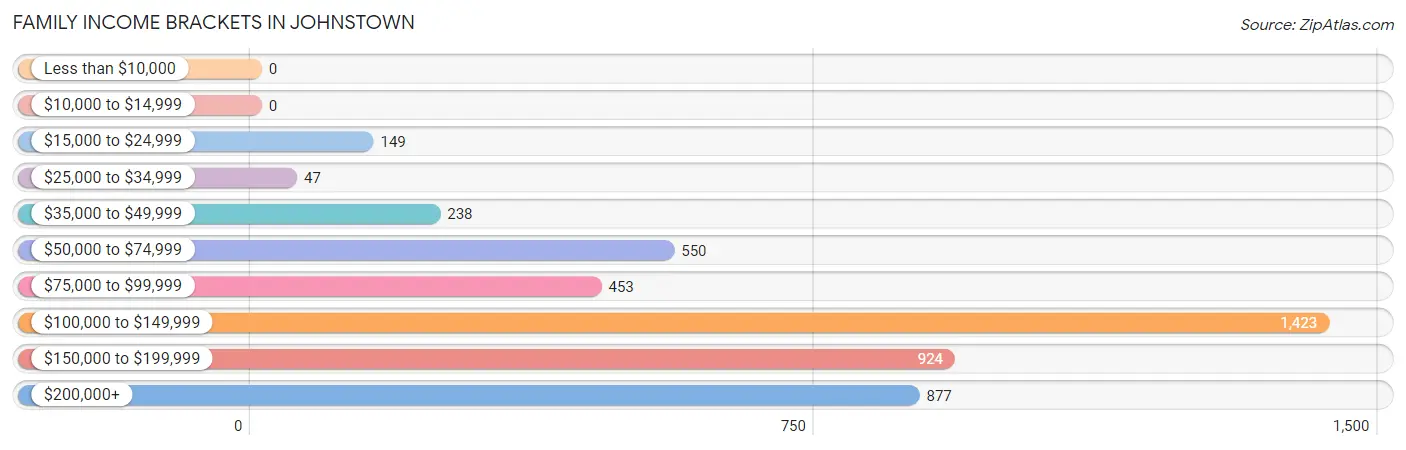
| Income Bracket | # Families | % Families |
| Less than $10,000 | 0 | 0.0% |
| $10,000 to $14,999 | 0 | 0.0% |
| $15,000 to $24,999 | 149 | 3.2% |
| $25,000 to $34,999 | 47 | 1.0% |
| $35,000 to $49,999 | 238 | 5.1% |
| $50,000 to $74,999 | 550 | 11.8% |
| $75,000 to $99,999 | 453 | 9.7% |
| $100,000 to $149,999 | 1,423 | 30.5% |
| $150,000 to $199,999 | 924 | 19.8% |
| $200,000+ | 877 | 18.8% |
Family Income by Famaliy Size in Johnstown
4-person families (1,058 | 22.7%) account for the highest median family income in Johnstown with $153,100 per family, while 2-person families (1,909 | 40.9%) have the highest median income of $58,478 per family member.
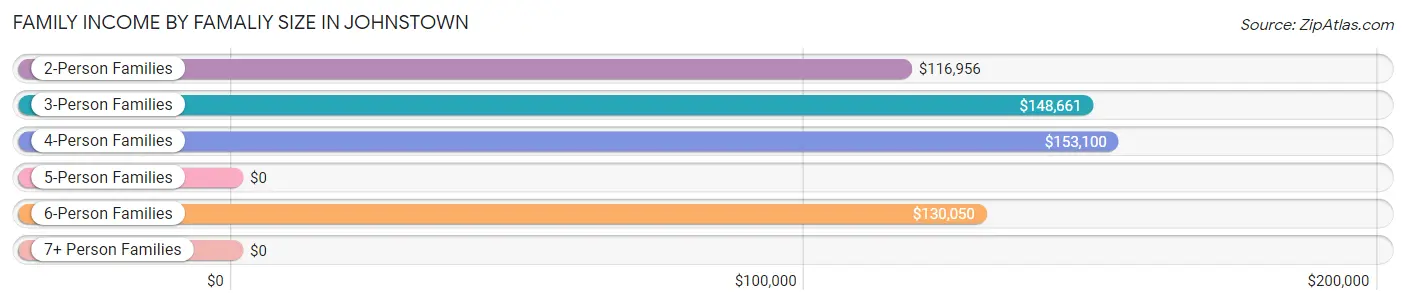
| Income Bracket | # Families | Median Income |
| 2-Person Families | 1,909 (40.9%) | $116,956 |
| 3-Person Families | 989 (21.2%) | $148,661 |
| 4-Person Families | 1,058 (22.7%) | $153,100 |
| 5-Person Families | 360 (7.7%) | $0 |
| 6-Person Families | 349 (7.5%) | $130,050 |
| 7+ Person Families | 0 (0.0%) | $0 |
| Total | 4,665 (100.0%) | $132,296 |
Family Income by Number of Earners in Johnstown
The median family income in Johnstown is $132,296, with families comprising 3+ earners (703) having the highest median family income of $196,537, while families with no earners (436) have the lowest median family income of $72,939, accounting for 15.1% and 9.3% of families, respectively.
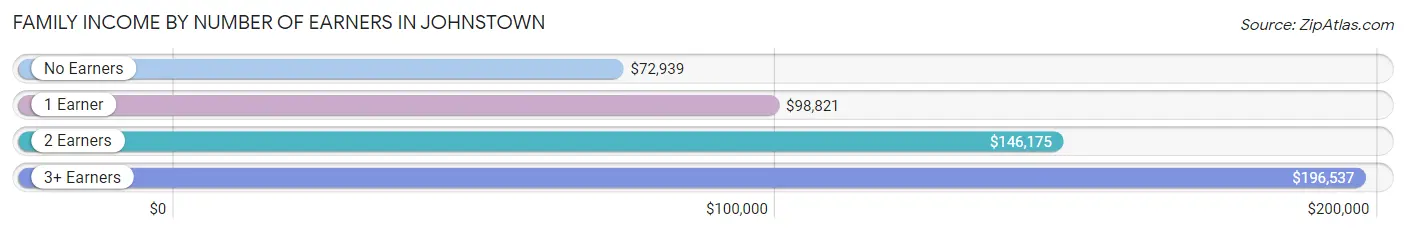
| Number of Earners | # Families | Median Income |
| No Earners | 436 (9.3%) | $72,939 |
| 1 Earner | 1,127 (24.2%) | $98,821 |
| 2 Earners | 2,399 (51.4%) | $146,175 |
| 3+ Earners | 703 (15.1%) | $196,537 |
| Total | 4,665 (100.0%) | $132,296 |
Household Income in Johnstown
Household Income Brackets in Johnstown
With 1,729 households falling in the category, the $100,000 to $149,999 income range is the most frequent in Johnstown, accounting for 26.5% of all households.
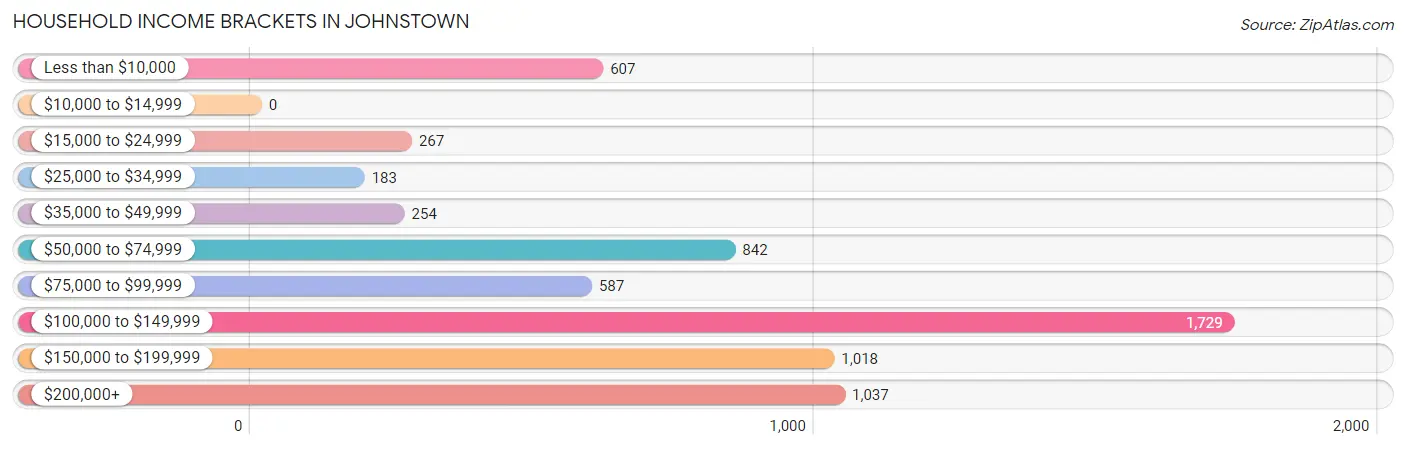
| Income Bracket | # Households | % Households |
| Less than $10,000 | 607 | 9.3% |
| $10,000 to $14,999 | 0 | 0.0% |
| $15,000 to $24,999 | 267 | 4.1% |
| $25,000 to $34,999 | 183 | 2.8% |
| $35,000 to $49,999 | 254 | 3.9% |
| $50,000 to $74,999 | 842 | 12.9% |
| $75,000 to $99,999 | 587 | 9.0% |
| $100,000 to $149,999 | 1,729 | 26.5% |
| $150,000 to $199,999 | 1,018 | 15.6% |
| $200,000+ | 1,037 | 15.9% |
Household Income by Householder Age in Johnstown
The median household income in Johnstown is $120,395, with the highest median household income of $136,826 found in the 45 to 64 years age bracket for the primary householder. A total of 2,233 households (34.2%) fall into this category. Meanwhile, the 15 to 24 years age bracket for the primary householder has the lowest median household income of $0, with 834 households (12.8%) in this group.
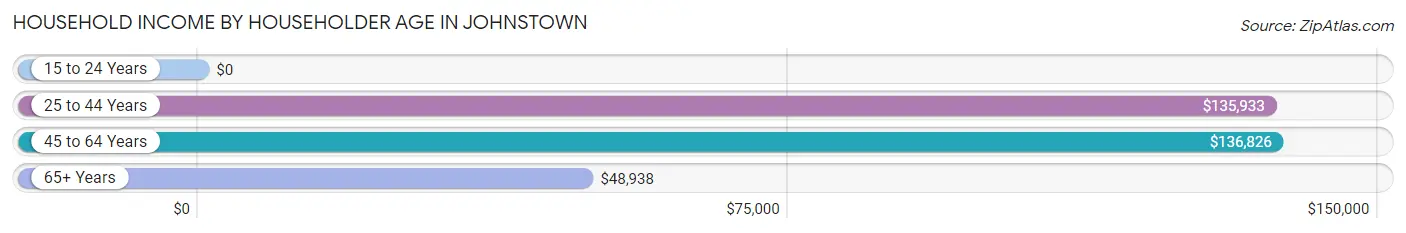
| Income Bracket | # Households | Median Income |
| 15 to 24 Years | 834 (12.8%) | $0 |
| 25 to 44 Years | 2,572 (39.4%) | $135,933 |
| 45 to 64 Years | 2,233 (34.2%) | $136,826 |
| 65+ Years | 885 (13.6%) | $48,938 |
| Total | 6,524 (100.0%) | $120,395 |
Poverty in Johnstown
Income Below Poverty by Sex and Age in Johnstown
With 9.5% poverty level for males and 4.0% for females among the residents of Johnstown, 18 to 24 year old males and 75 year old and over females are the most vulnerable to poverty, with 499 males (45.2%) and 39 females (9.7%) in their respective age groups living below the poverty level.
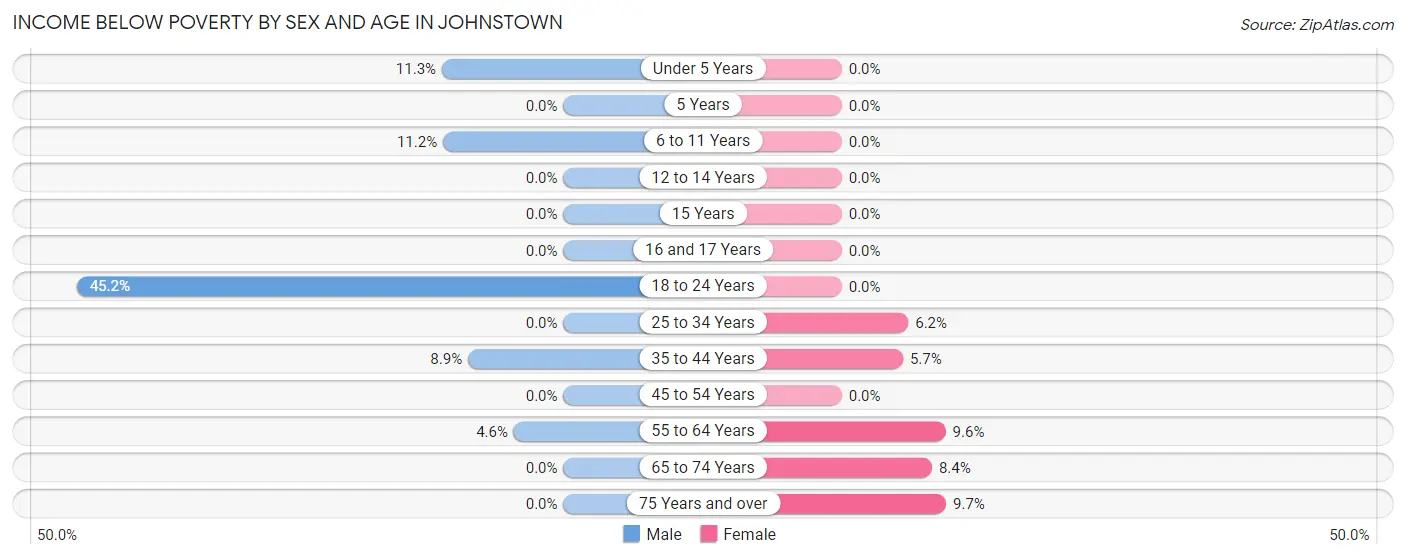
| Age Bracket | Male | Female |
| Under 5 Years | 103 (11.3%) | 0 (0.0%) |
| 5 Years | 0 (0.0%) | 0 (0.0%) |
| 6 to 11 Years | 109 (11.2%) | 0 (0.0%) |
| 12 to 14 Years | 0 (0.0%) | 0 (0.0%) |
| 15 Years | 0 (0.0%) | 0 (0.0%) |
| 16 and 17 Years | 0 (0.0%) | 0 (0.0%) |
| 18 to 24 Years | 499 (45.2%) | 0 (0.0%) |
| 25 to 34 Years | 0 (0.0%) | 71 (6.2%) |
| 35 to 44 Years | 144 (8.8%) | 71 (5.7%) |
| 45 to 54 Years | 0 (0.0%) | 0 (0.0%) |
| 55 to 64 Years | 46 (4.6%) | 91 (9.6%) |
| 65 to 74 Years | 0 (0.0%) | 37 (8.4%) |
| 75 Years and over | 0 (0.0%) | 39 (9.7%) |
| Total | 901 (9.5%) | 309 (4.0%) |
Income Above Poverty by Sex and Age in Johnstown
According to the poverty statistics in Johnstown, males aged 5 years and females aged under 5 years are the age groups that are most secure financially, with 100.0% of males and 100.0% of females in these age groups living above the poverty line.
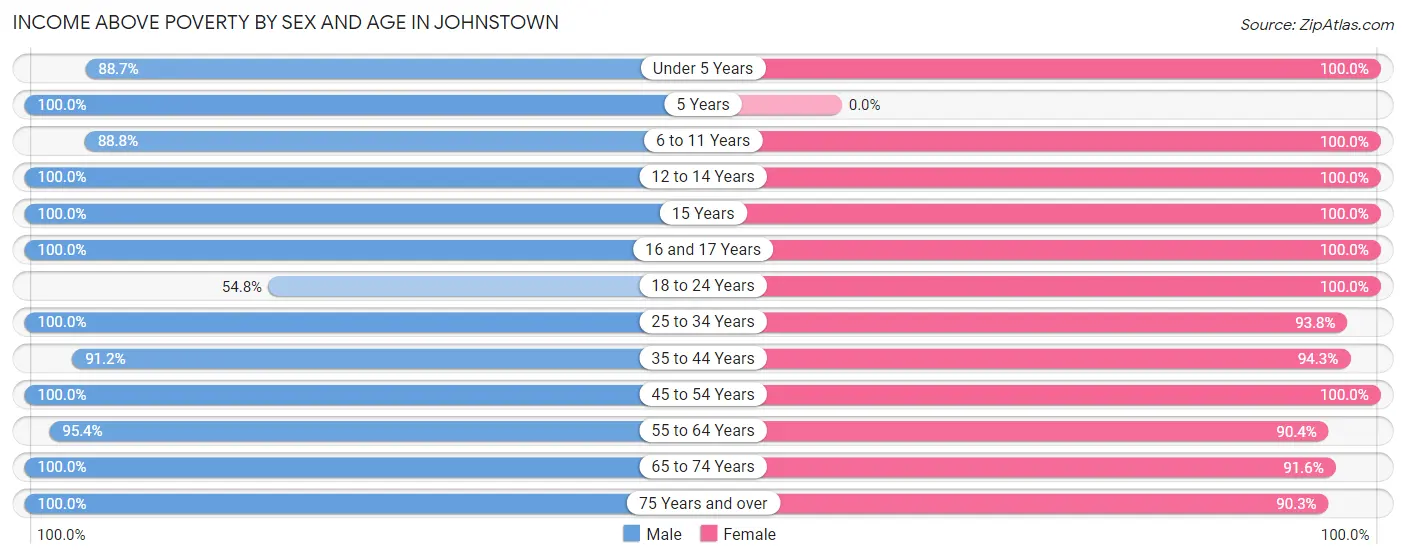
| Age Bracket | Male | Female |
| Under 5 Years | 811 (88.7%) | 460 (100.0%) |
| 5 Years | 133 (100.0%) | 0 (0.0%) |
| 6 to 11 Years | 867 (88.8%) | 887 (100.0%) |
| 12 to 14 Years | 415 (100.0%) | 147 (100.0%) |
| 15 Years | 156 (100.0%) | 49 (100.0%) |
| 16 and 17 Years | 114 (100.0%) | 127 (100.0%) |
| 18 to 24 Years | 606 (54.8%) | 910 (100.0%) |
| 25 to 34 Years | 1,015 (100.0%) | 1,079 (93.8%) |
| 35 to 44 Years | 1,484 (91.1%) | 1,179 (94.3%) |
| 45 to 54 Years | 1,321 (100.0%) | 972 (100.0%) |
| 55 to 64 Years | 954 (95.4%) | 853 (90.4%) |
| 65 to 74 Years | 443 (100.0%) | 405 (91.6%) |
| 75 Years and over | 314 (100.0%) | 364 (90.3%) |
| Total | 8,633 (90.5%) | 7,432 (96.0%) |
Income Below Poverty Among Married-Couple Families in Johnstown
The poverty statistics for married-couple families in Johnstown show that 2.9% or 123 of the total 4,254 families live below the poverty line. Families with 1 or 2 children have the highest poverty rate of 7.1%, comprising of 123 families. On the other hand, families with no children have the lowest poverty rate of 0.0%, which includes 0 families.
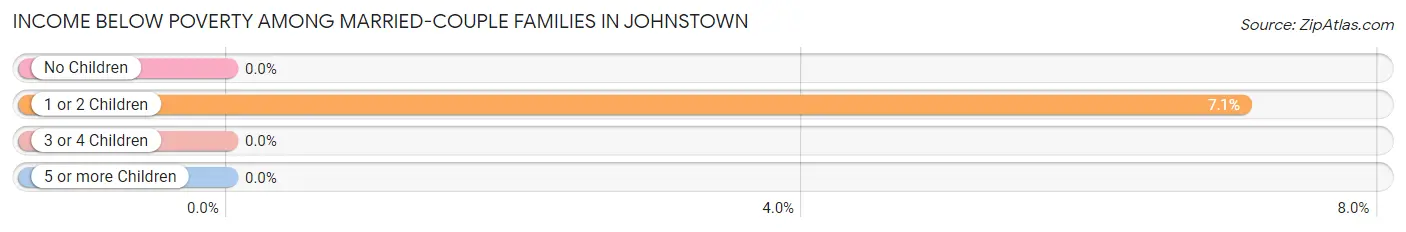
| Children | Above Poverty | Below Poverty |
| No Children | 2,110 (100.0%) | 0 (0.0%) |
| 1 or 2 Children | 1,618 (92.9%) | 123 (7.1%) |
| 3 or 4 Children | 403 (100.0%) | 0 (0.0%) |
| 5 or more Children | 0 (0.0%) | 0 (0.0%) |
| Total | 4,131 (97.1%) | 123 (2.9%) |
Income Below Poverty Among Single-Parent Households in Johnstown
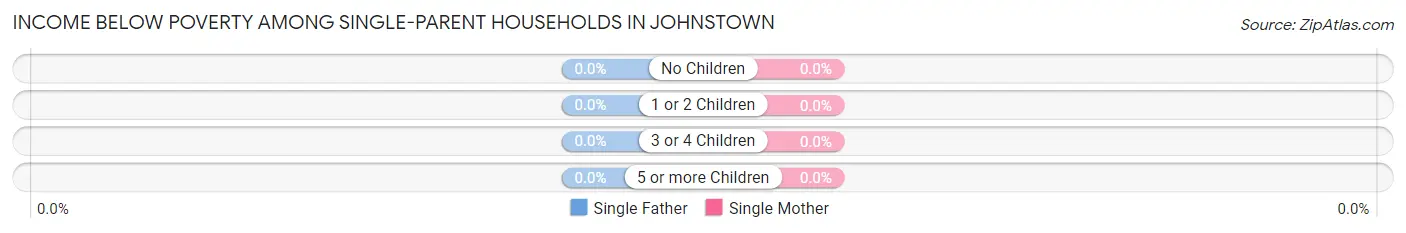
| Children | Single Father | Single Mother |
| No Children | 0 (0.0%) | 0 (0.0%) |
| 1 or 2 Children | 0 (0.0%) | 0 (0.0%) |
| 3 or 4 Children | 0 (0.0%) | 0 (0.0%) |
| 5 or more Children | 0 (0.0%) | 0 (0.0%) |
| Total | 0 (0.0%) | 0 (0.0%) |
Income Below Poverty Among Married-Couple vs Single-Parent Households in Johnstown
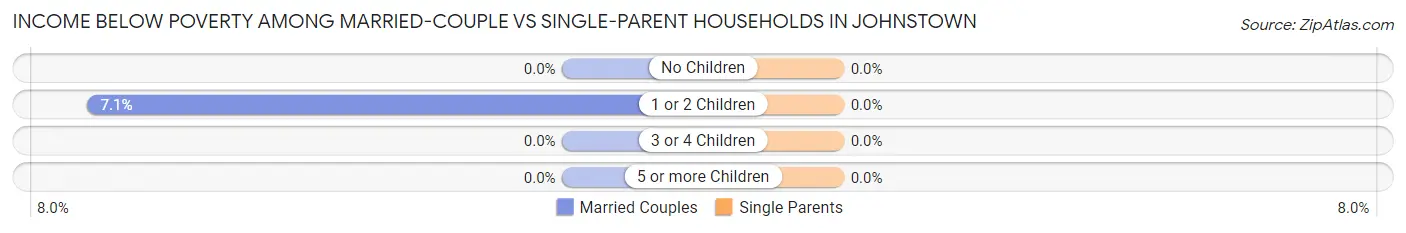
| Children | Married-Couple Families | Single-Parent Households |
| No Children | 0 (0.0%) | 0 (0.0%) |
| 1 or 2 Children | 123 (7.1%) | 0 (0.0%) |
| 3 or 4 Children | 0 (0.0%) | 0 (0.0%) |
| 5 or more Children | 0 (0.0%) | 0 (0.0%) |
| Total | 123 (2.9%) | 0 (0.0%) |
Race in Johnstown
The most populous races in Johnstown are White / Caucasian (14,326 | 82.7%), Hispanic or Latino (2,730 | 15.8%), and Two or more Races (1,383 | 8.0%).
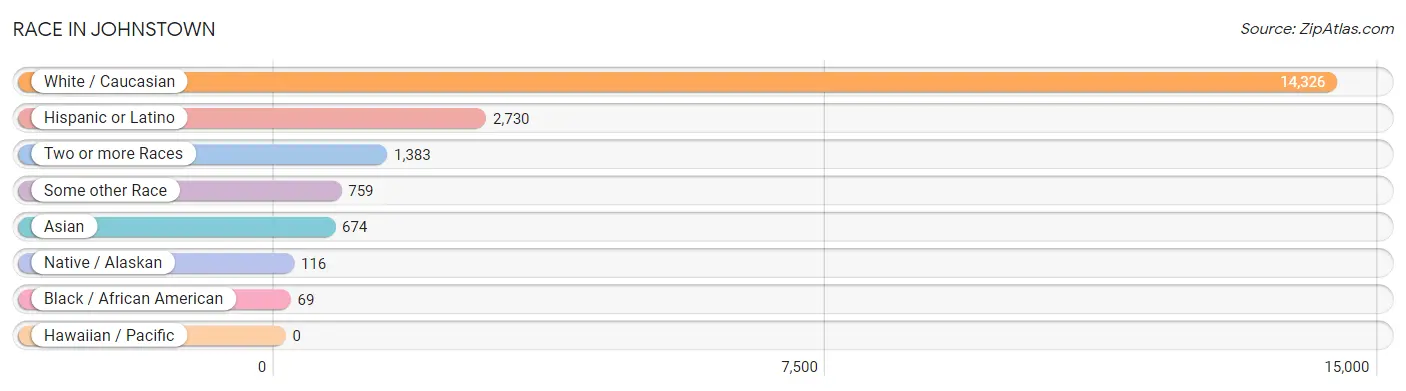
| Race | # Population | % Population |
| Asian | 674 | 3.9% |
| Black / African American | 69 | 0.4% |
| Hawaiian / Pacific | 0 | 0.0% |
| Hispanic or Latino | 2,730 | 15.8% |
| Native / Alaskan | 116 | 0.7% |
| White / Caucasian | 14,326 | 82.7% |
| Two or more Races | 1,383 | 8.0% |
| Some other Race | 759 | 4.4% |
| Total | 17,327 | 100.0% |
Ancestry in Johnstown
The most populous ancestries reported in Johnstown are German (3,915 | 22.6%), English (3,474 | 20.1%), Irish (2,529 | 14.6%), Mexican (1,929 | 11.1%), and Swedish (1,024 | 5.9%), together accounting for 74.3% of all Johnstown residents.
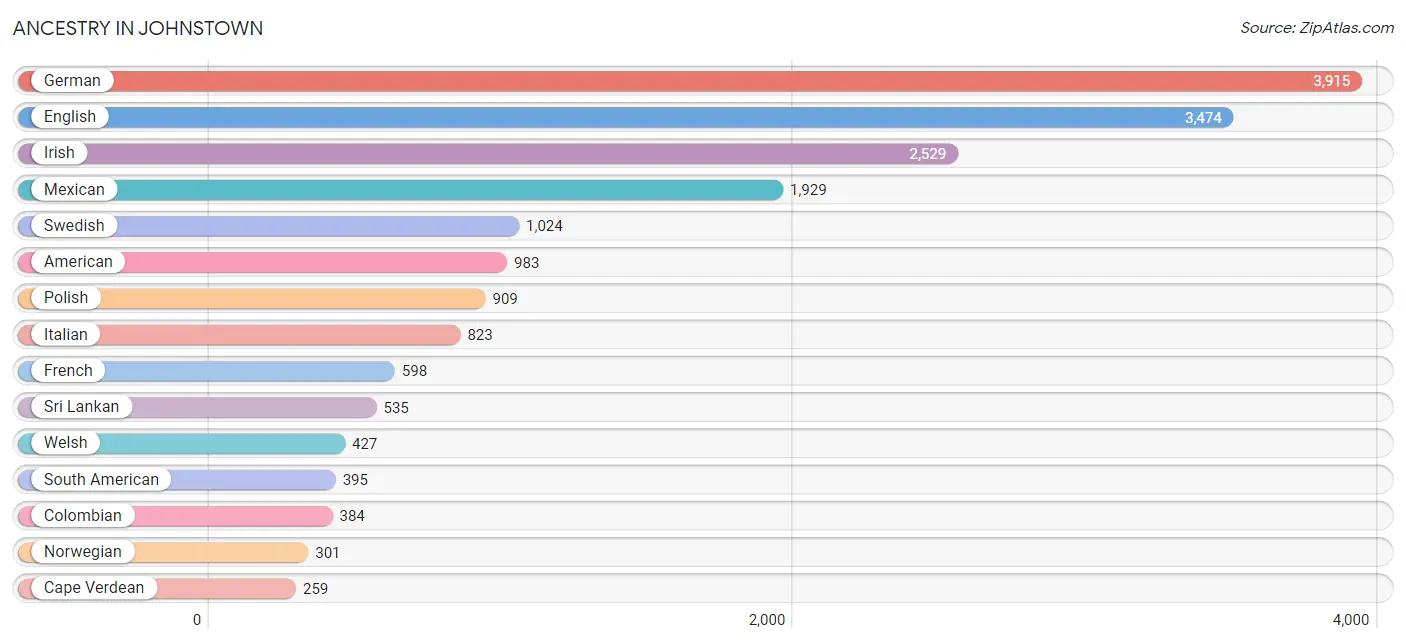
| Ancestry | # Population | % Population |
| American | 983 | 5.7% |
| Arab | 66 | 0.4% |
| Austrian | 19 | 0.1% |
| Belgian | 19 | 0.1% |
| Bhutanese | 8 | 0.1% |
| Bolivian | 11 | 0.1% |
| Brazilian | 45 | 0.3% |
| British | 95 | 0.5% |
| Bulgarian | 147 | 0.9% |
| Cape Verdean | 259 | 1.5% |
| Central American | 14 | 0.1% |
| Cherokee | 48 | 0.3% |
| Colombian | 384 | 2.2% |
| Cuban | 70 | 0.4% |
| Czech | 139 | 0.8% |
| Czechoslovakian | 54 | 0.3% |
| Danish | 187 | 1.1% |
| Dutch | 223 | 1.3% |
| Eastern European | 19 | 0.1% |
| English | 3,474 | 20.1% |
| European | 256 | 1.5% |
| Finnish | 16 | 0.1% |
| French | 598 | 3.5% |
| French Canadian | 36 | 0.2% |
| German | 3,915 | 22.6% |
| Greek | 25 | 0.1% |
| Guatemalan | 14 | 0.1% |
| Indian (Asian) | 40 | 0.2% |
| Irish | 2,529 | 14.6% |
| Italian | 823 | 4.8% |
| Korean | 191 | 1.1% |
| Lebanese | 27 | 0.2% |
| Lithuanian | 16 | 0.1% |
| Malaysian | 39 | 0.2% |
| Mexican | 1,929 | 11.1% |
| Mexican American Indian | 105 | 0.6% |
| Norwegian | 301 | 1.7% |
| Pennsylvania German | 6 | 0.0% |
| Polish | 909 | 5.2% |
| Puerto Rican | 34 | 0.2% |
| Russian | 150 | 0.9% |
| Scandinavian | 137 | 0.8% |
| Scotch-Irish | 166 | 1.0% |
| Scottish | 192 | 1.1% |
| Sioux | 14 | 0.1% |
| South American | 395 | 2.3% |
| South American Indian | 11 | 0.1% |
| Spaniard | 200 | 1.1% |
| Spanish | 54 | 0.3% |
| Spanish American | 16 | 0.1% |
| Sri Lankan | 535 | 3.1% |
| Subsaharan African | 259 | 1.5% |
| Swedish | 1,024 | 5.9% |
| Swiss | 62 | 0.4% |
| Thai | 16 | 0.1% |
| Ukrainian | 54 | 0.3% |
| Welsh | 427 | 2.5% | View All 57 Rows |
Immigrants in Johnstown
The most numerous immigrant groups reported in Johnstown came from Latin America (555 | 3.2%), Central America (403 | 2.3%), Mexico (389 | 2.2%), Asia (154 | 0.9%), and South America (152 | 0.9%), together accounting for 9.6% of all Johnstown residents.
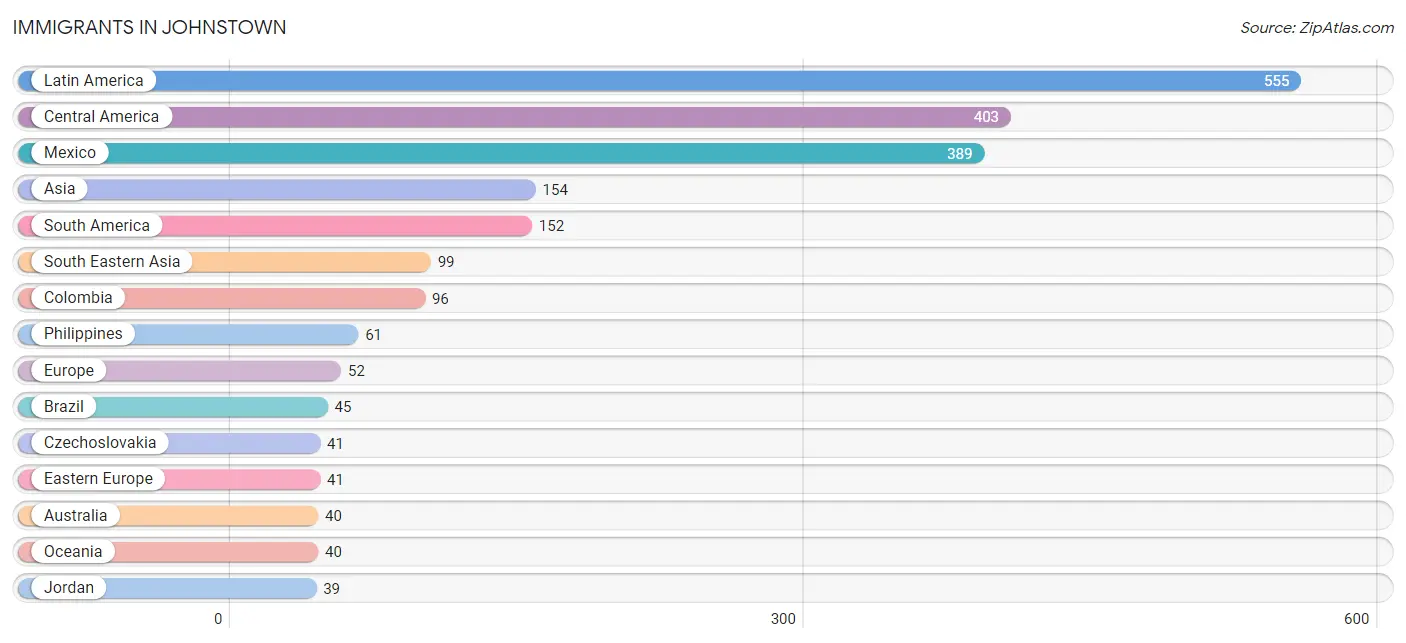
| Immigration Origin | # Population | % Population |
| Asia | 154 | 0.9% |
| Australia | 40 | 0.2% |
| Bolivia | 11 | 0.1% |
| Brazil | 45 | 0.3% |
| Central America | 403 | 2.3% |
| Colombia | 96 | 0.5% |
| Czechoslovakia | 41 | 0.2% |
| Eastern Europe | 41 | 0.2% |
| Europe | 52 | 0.3% |
| Guatemala | 14 | 0.1% |
| India | 16 | 0.1% |
| Ireland | 11 | 0.1% |
| Jordan | 39 | 0.2% |
| Latin America | 555 | 3.2% |
| Mexico | 389 | 2.2% |
| Northern Europe | 11 | 0.1% |
| Oceania | 40 | 0.2% |
| Philippines | 61 | 0.4% |
| South America | 152 | 0.9% |
| South Central Asia | 16 | 0.1% |
| South Eastern Asia | 99 | 0.6% |
| Vietnam | 38 | 0.2% |
| Western Asia | 39 | 0.2% | View All 23 Rows |
Sex and Age in Johnstown
Sex and Age in Johnstown
The most populous age groups in Johnstown are 10 to 14 Years (1,005 | 10.5%) for men and 30 to 34 Years (754 | 9.7%) for women.
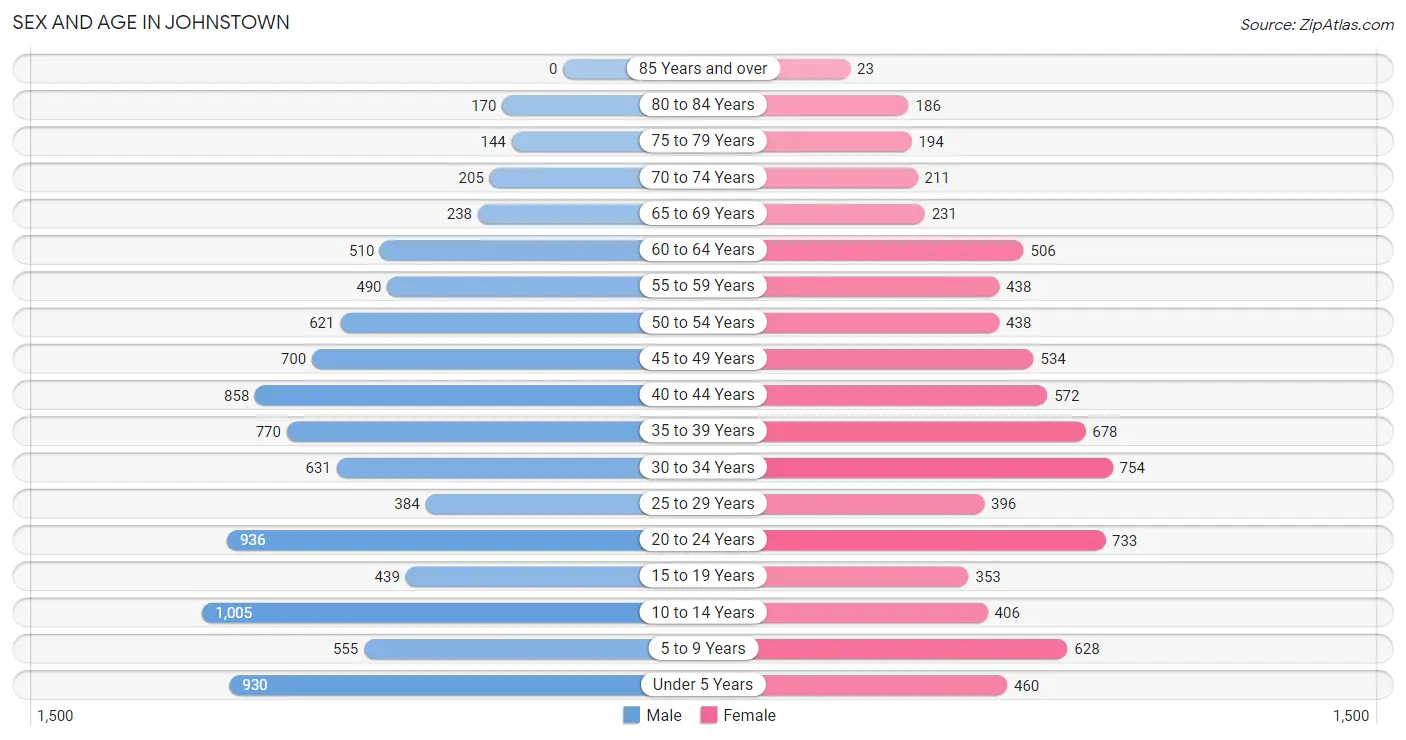
| Age Bracket | Male | Female |
| Under 5 Years | 930 (9.7%) | 460 (5.9%) |
| 5 to 9 Years | 555 (5.8%) | 628 (8.1%) |
| 10 to 14 Years | 1,005 (10.5%) | 406 (5.2%) |
| 15 to 19 Years | 439 (4.6%) | 353 (4.6%) |
| 20 to 24 Years | 936 (9.8%) | 733 (9.5%) |
| 25 to 29 Years | 384 (4.0%) | 396 (5.1%) |
| 30 to 34 Years | 631 (6.6%) | 754 (9.7%) |
| 35 to 39 Years | 770 (8.0%) | 678 (8.8%) |
| 40 to 44 Years | 858 (8.9%) | 572 (7.4%) |
| 45 to 49 Years | 700 (7.3%) | 534 (6.9%) |
| 50 to 54 Years | 621 (6.5%) | 438 (5.7%) |
| 55 to 59 Years | 490 (5.1%) | 438 (5.7%) |
| 60 to 64 Years | 510 (5.3%) | 506 (6.5%) |
| 65 to 69 Years | 238 (2.5%) | 231 (3.0%) |
| 70 to 74 Years | 205 (2.1%) | 211 (2.7%) |
| 75 to 79 Years | 144 (1.5%) | 194 (2.5%) |
| 80 to 84 Years | 170 (1.8%) | 186 (2.4%) |
| 85 Years and over | 0 (0.0%) | 23 (0.3%) |
| Total | 9,586 (100.0%) | 7,741 (100.0%) |
Families and Households in Johnstown
Median Family Size in Johnstown
The median family size in Johnstown is 3.12 persons per family, with married-couple families (4,254 | 91.2%) accounting for the largest median family size of 3.14 persons per family. On the other hand, single male/father families (138 | 3.0%) represent the smallest median family size with 2.75 persons per family.
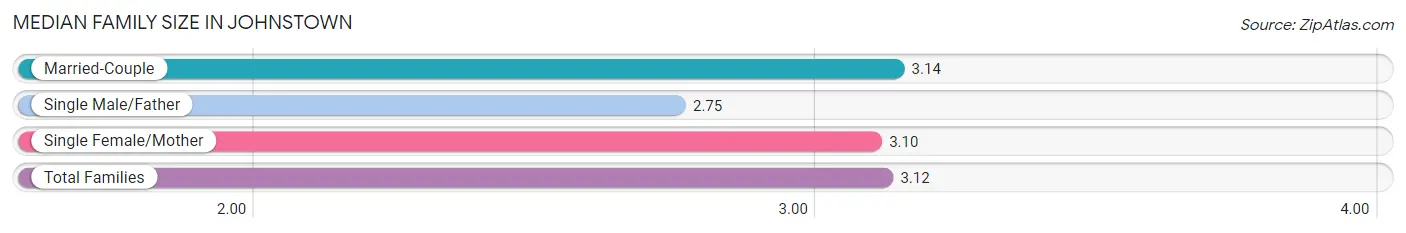
| Family Type | # Families | Family Size |
| Married-Couple | 4,254 (91.2%) | 3.14 |
| Single Male/Father | 138 (3.0%) | 2.75 |
| Single Female/Mother | 273 (5.9%) | 3.10 |
| Total Families | 4,665 (100.0%) | 3.12 |
Median Household Size in Johnstown
The median household size in Johnstown is 2.66 persons per household, with single female/mother households (273 | 4.2%) accounting for the largest median household size of 3.76 persons per household. non-family households (1,859 | 28.5%) represent the smallest median household size with 1.30 persons per household.
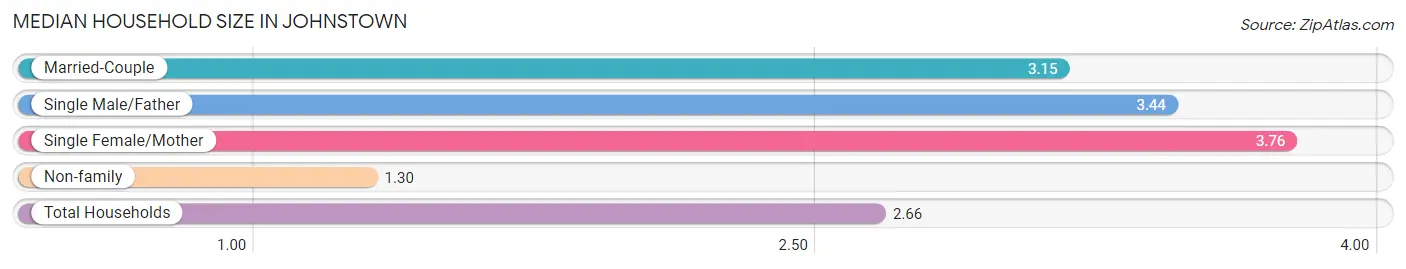
| Household Type | # Households | Household Size |
| Married-Couple | 4,254 (65.2%) | 3.15 |
| Single Male/Father | 138 (2.1%) | 3.44 |
| Single Female/Mother | 273 (4.2%) | 3.76 |
| Non-family | 1,859 (28.5%) | 1.30 |
| Total Households | 6,524 (100.0%) | 2.66 |
Household Size by Marriage Status in Johnstown
Out of a total of 6,524 households in Johnstown, 4,665 (71.5%) are family households, while 1,859 (28.5%) are nonfamily households. The most numerous type of family households are 2-person households, comprising 1,694, and the most common type of nonfamily households are 1-person households, comprising 1,384.
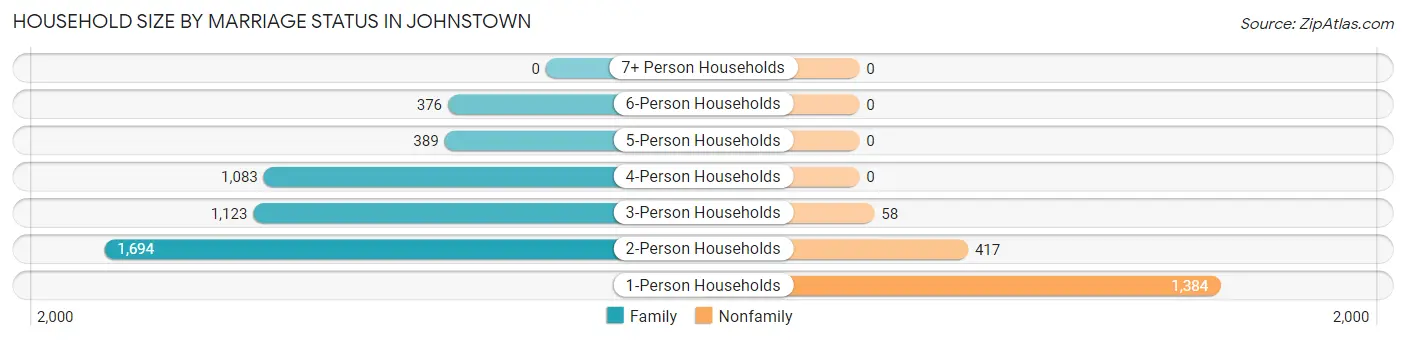
| Household Size | Family Households | Nonfamily Households |
| 1-Person Households | - | 1,384 (21.2%) |
| 2-Person Households | 1,694 (26.0%) | 417 (6.4%) |
| 3-Person Households | 1,123 (17.2%) | 58 (0.9%) |
| 4-Person Households | 1,083 (16.6%) | 0 (0.0%) |
| 5-Person Households | 389 (6.0%) | 0 (0.0%) |
| 6-Person Households | 376 (5.8%) | 0 (0.0%) |
| 7+ Person Households | 0 (0.0%) | 0 (0.0%) |
| Total | 4,665 (71.5%) | 1,859 (28.5%) |
Female Fertility in Johnstown
Fertility by Age in Johnstown
Average fertility rate in Johnstown is 66.0 births per 1,000 women. Women in the age bracket of 20 to 34 years have the highest fertility rate with 106.0 births per 1,000 women. Women in the age bracket of 20 to 34 years acount for 73.3% of all women with births.
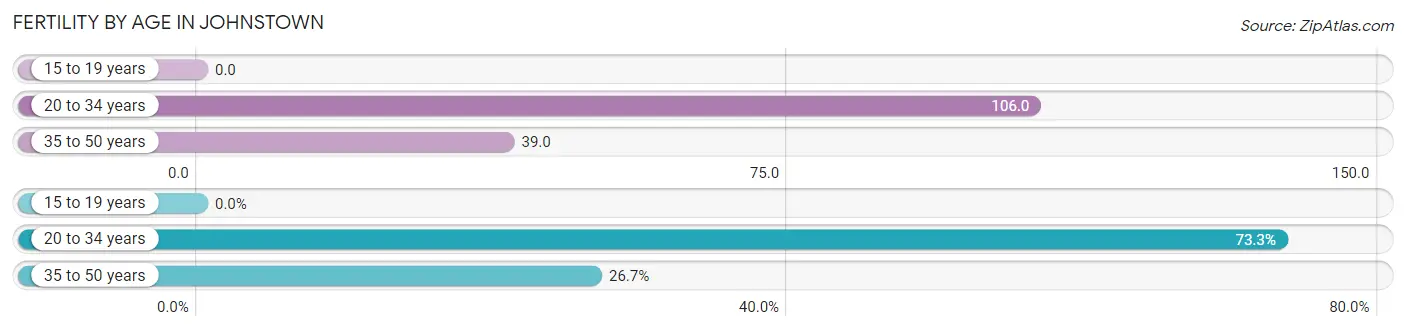
| Age Bracket | Women with Births | Births / 1,000 Women |
| 15 to 19 years | 0 (0.0%) | 0.0 |
| 20 to 34 years | 200 (73.3%) | 106.0 |
| 35 to 50 years | 73 (26.7%) | 39.0 |
| Total | 273 (100.0%) | 66.0 |
Fertility by Age by Marriage Status in Johnstown
74.4% of women with births (273) in Johnstown are married. The highest percentage of unmarried women with births falls into 20 to 34 years age bracket with 35.0% of them unmarried at the time of birth, while the lowest percentage of unmarried women with births belong to 35 to 50 years age bracket with 0.0% of them unmarried.
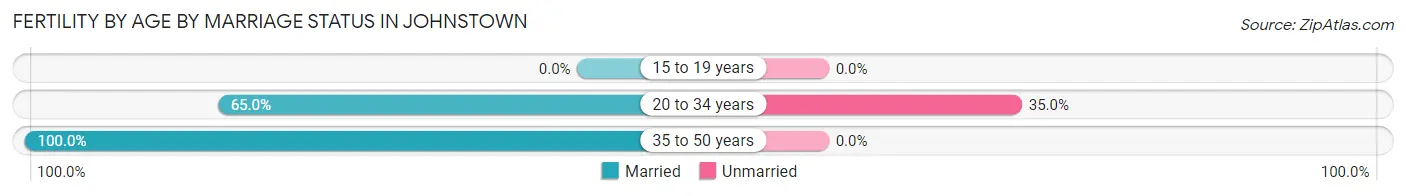
| Age Bracket | Married | Unmarried |
| 15 to 19 years | 0 (0.0%) | 0 (0.0%) |
| 20 to 34 years | 130 (65.0%) | 70 (35.0%) |
| 35 to 50 years | 73 (100.0%) | 0 (0.0%) |
| Total | 203 (74.4%) | 70 (25.6%) |
Fertility by Education in Johnstown
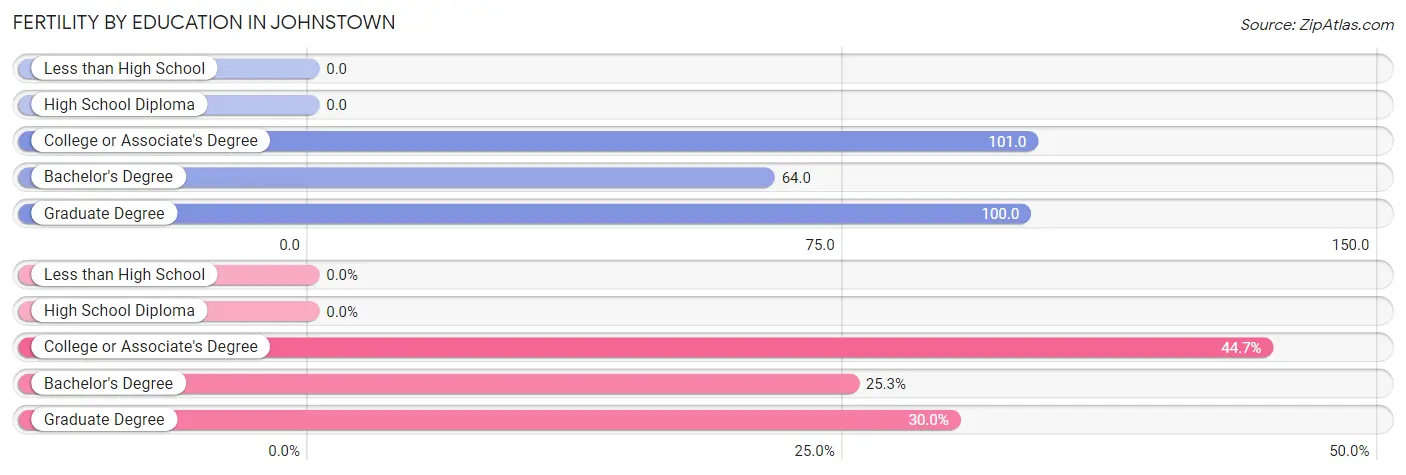
| Educational Attainment | Women with Births | Births / 1,000 Women |
| Less than High School | 0 (0.0%) | 0.0 |
| High School Diploma | 0 (0.0%) | 0.0 |
| College or Associate's Degree | 122 (44.7%) | 101.0 |
| Bachelor's Degree | 69 (25.3%) | 64.0 |
| Graduate Degree | 82 (30.0%) | 100.0 |
| Total | 273 (100.0%) | 66.0 |
Fertility by Education by Marriage Status in Johnstown
25.6% of women with births in Johnstown are unmarried. Women with the educational attainment of bachelor's degree are most likely to be married with 100.0% of them married at childbirth, while women with the educational attainment of college or associate's degree are least likely to be married with 57.4% of them unmarried at childbirth.
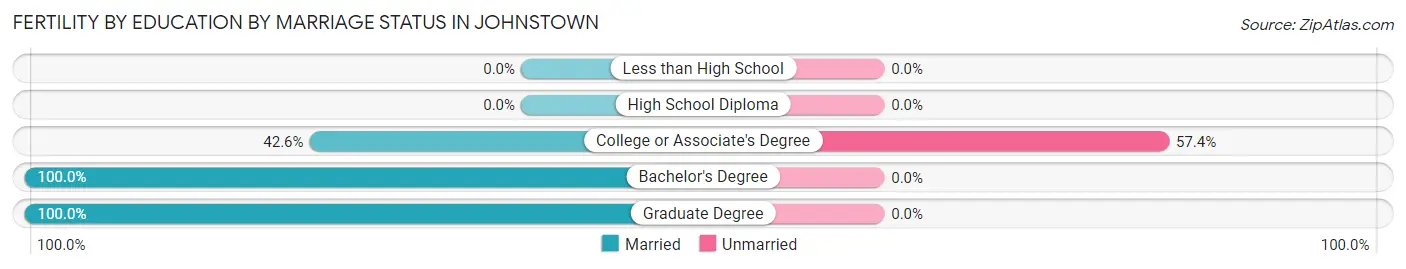
| Educational Attainment | Married | Unmarried |
| Less than High School | 0 (0.0%) | 0 (0.0%) |
| High School Diploma | 0 (0.0%) | 0 (0.0%) |
| College or Associate's Degree | 52 (42.6%) | 70 (57.4%) |
| Bachelor's Degree | 69 (100.0%) | 0 (0.0%) |
| Graduate Degree | 82 (100.0%) | 0 (0.0%) |
| Total | 203 (74.4%) | 70 (25.6%) |
Employment Characteristics in Johnstown
Employment by Class of Employer in Johnstown
Among the 9,486 employed individuals in Johnstown, private company employees (6,728 | 70.9%), local government employees (922 | 9.7%), and self-employed (not incorporated) (597 | 6.3%) make up the most common classes of employment.
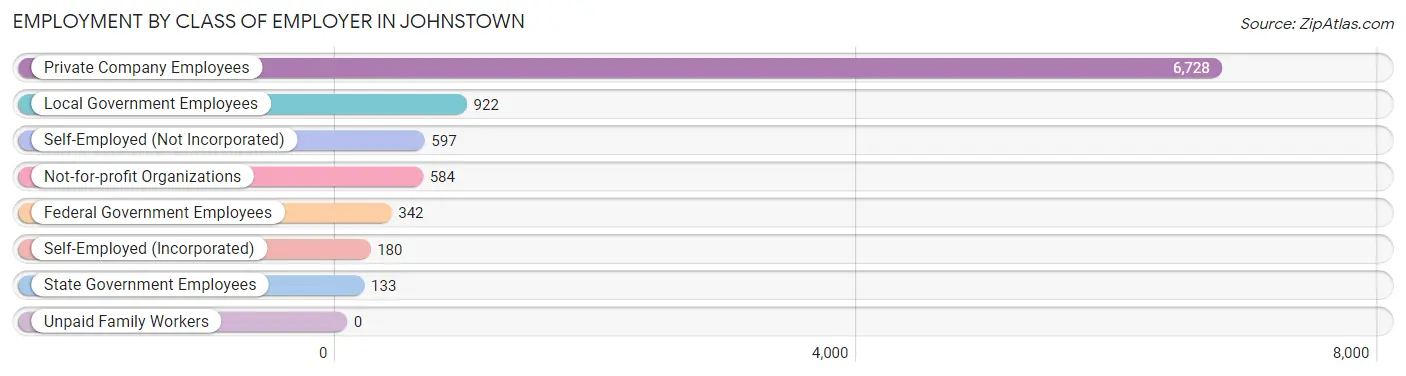
| Employer Class | # Employees | % Employees |
| Private Company Employees | 6,728 | 70.9% |
| Self-Employed (Incorporated) | 180 | 1.9% |
| Self-Employed (Not Incorporated) | 597 | 6.3% |
| Not-for-profit Organizations | 584 | 6.2% |
| Local Government Employees | 922 | 9.7% |
| State Government Employees | 133 | 1.4% |
| Federal Government Employees | 342 | 3.6% |
| Unpaid Family Workers | 0 | 0.0% |
| Total | 9,486 | 100.0% |
Employment Status by Age in Johnstown
According to the labor force statistics for Johnstown, out of the total population over 16 years of age (13,138), 76.5% or 10,051 individuals are in the labor force, with 5.4% or 543 of them unemployed. The age group with the highest labor force participation rate is 55 to 59 years, with 94.2% or 874 individuals in the labor force. Within the labor force, the 16 to 19 years age range has the highest percentage of unemployed individuals, with 14.6% or 54 of them being unemployed.
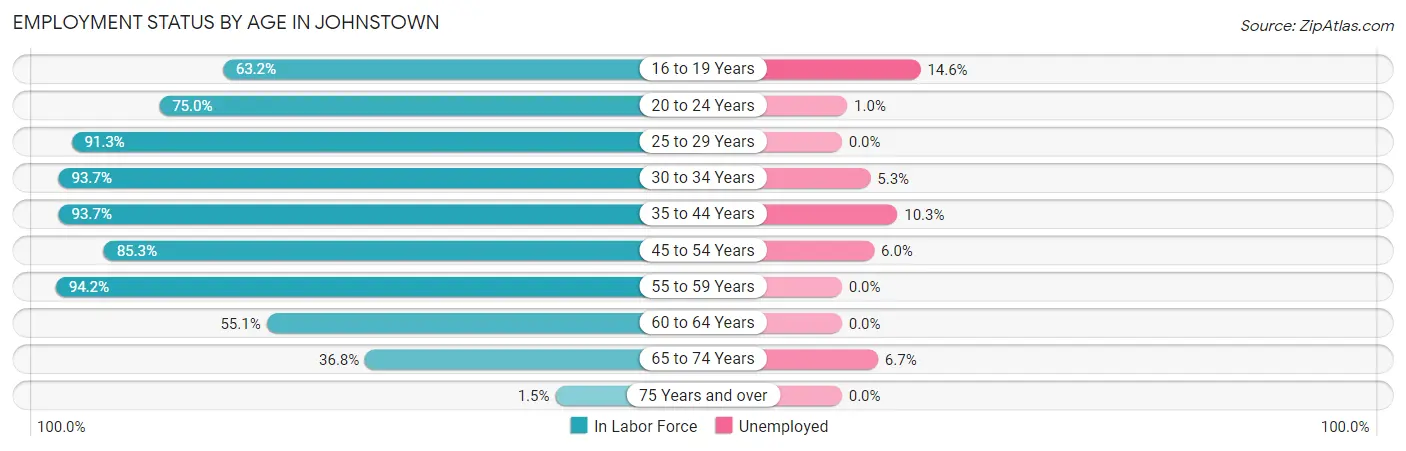
| Age Bracket | In Labor Force | Unemployed |
| 16 to 19 Years | 371 (63.2%) | 54 (14.6%) |
| 20 to 24 Years | 1,252 (75.0%) | 13 (1.0%) |
| 25 to 29 Years | 712 (91.3%) | 0 (0.0%) |
| 30 to 34 Years | 1,298 (93.7%) | 69 (5.3%) |
| 35 to 44 Years | 2,697 (93.7%) | 278 (10.3%) |
| 45 to 54 Years | 1,956 (85.3%) | 117 (6.0%) |
| 55 to 59 Years | 874 (94.2%) | 0 (0.0%) |
| 60 to 64 Years | 560 (55.1%) | 0 (0.0%) |
| 65 to 74 Years | 326 (36.8%) | 22 (6.7%) |
| 75 Years and over | 11 (1.5%) | 0 (0.0%) |
| Total | 10,051 (76.5%) | 543 (5.4%) |
Employment Status by Educational Attainment in Johnstown
According to labor force statistics for Johnstown, 87.3% of individuals (8,101) out of the total population between 25 and 64 years of age (9,280) are in the labor force, with 5.6% or 454 of them being unemployed. The group with the highest labor force participation rate are those with the educational attainment of college / associate degree, with 93.8% or 3,021 individuals in the labor force. Within the labor force, individuals with less than high school education have the highest percentage of unemployment, with 21.2% or 56 of them being unemployed.
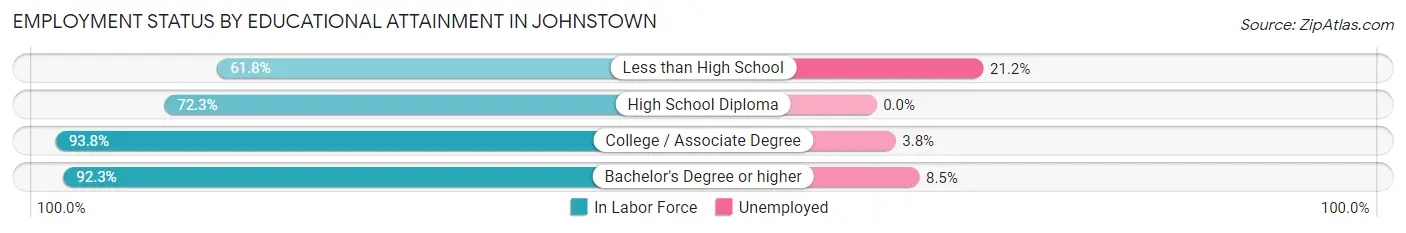
| Educational Attainment | In Labor Force | Unemployed |
| Less than High School | 264 (61.8%) | 91 (21.2%) |
| High School Diploma | 1,392 (72.3%) | 0 (0.0%) |
| College / Associate Degree | 3,021 (93.8%) | 122 (3.8%) |
| Bachelor's Degree or higher | 3,421 (92.3%) | 315 (8.5%) |
| Total | 8,101 (87.3%) | 520 (5.6%) |
Employment Occupations by Sex in Johnstown
Management, Business, Science and Arts Occupations
The most common Management, Business, Science and Arts occupations in Johnstown are Management (1,593 | 17.0%), Community & Social Service (807 | 8.6%), Computers, Engineering & Science (791 | 8.5%), Health Diagnosing & Treating (645 | 6.9%), and Education Instruction & Library (498 | 5.3%).
Management, Business, Science and Arts Occupations by Sex
Within the Management, Business, Science and Arts occupations in Johnstown, the most male-oriented occupations are Architecture & Engineering (85.8%), Computers, Engineering & Science (79.0%), and Computers & Mathematics (77.7%), while the most female-oriented occupations are Legal Services & Support (100.0%), Health Diagnosing & Treating (96.6%), and Health Technologists (95.3%).
| Occupation | Male | Female |
| Management | 1,174 (73.7%) | 419 (26.3%) |
| Business & Financial | 131 (46.6%) | 150 (53.4%) |
| Computers, Engineering & Science | 625 (79.0%) | 166 (21.0%) |
| Computers & Mathematics | 248 (77.7%) | 71 (22.3%) |
| Architecture & Engineering | 327 (85.8%) | 54 (14.2%) |
| Life, Physical & Social Science | 50 (54.9%) | 41 (45.1%) |
| Community & Social Service | 217 (26.9%) | 590 (73.1%) |
| Education, Arts & Media | 105 (50.5%) | 103 (49.5%) |
| Legal Services & Support | 0 (0.0%) | 15 (100.0%) |
| Education Instruction & Library | 86 (17.3%) | 412 (82.7%) |
| Arts, Media & Entertainment | 26 (30.2%) | 60 (69.8%) |
| Health Diagnosing & Treating | 22 (3.4%) | 623 (96.6%) |
| Health Technologists | 22 (4.7%) | 450 (95.3%) |
| Total (Category) | 2,169 (52.7%) | 1,948 (47.3%) |
| Total (Overall) | 5,295 (56.6%) | 4,055 (43.4%) |
Services Occupations
The most common Services occupations in Johnstown are Personal Care & Service (261 | 2.8%), Security & Protection (245 | 2.6%), Food Preparation & Serving (206 | 2.2%), Healthcare Support (202 | 2.2%), and Firefighting & Prevention (140 | 1.5%).
Services Occupations by Sex
Within the Services occupations in Johnstown, the most male-oriented occupations are Security & Protection (100.0%), Firefighting & Prevention (100.0%), and Law Enforcement (100.0%), while the most female-oriented occupations are Healthcare Support (100.0%), Food Preparation & Serving (83.0%), and Personal Care & Service (67.8%).
| Occupation | Male | Female |
| Healthcare Support | 0 (0.0%) | 202 (100.0%) |
| Security & Protection | 245 (100.0%) | 0 (0.0%) |
| Firefighting & Prevention | 140 (100.0%) | 0 (0.0%) |
| Law Enforcement | 105 (100.0%) | 0 (0.0%) |
| Food Preparation & Serving | 35 (17.0%) | 171 (83.0%) |
| Cleaning & Maintenance | 39 (67.2%) | 19 (32.8%) |
| Personal Care & Service | 84 (32.2%) | 177 (67.8%) |
| Total (Category) | 403 (41.5%) | 569 (58.5%) |
| Total (Overall) | 5,295 (56.6%) | 4,055 (43.4%) |
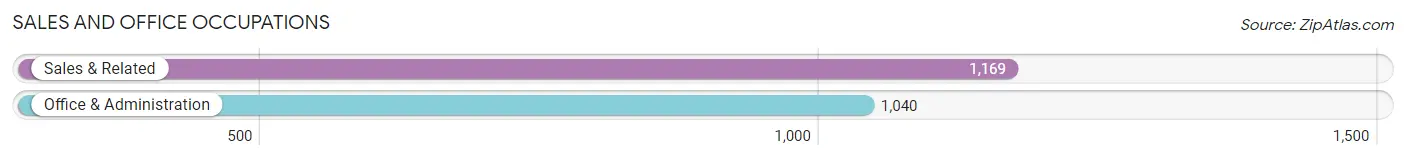
Sales and Office Occupations
The most common Sales and Office occupations in Johnstown are Sales & Related (1,169 | 12.5%), and Office & Administration (1,040 | 11.1%).
Sales and Office Occupations by Sex
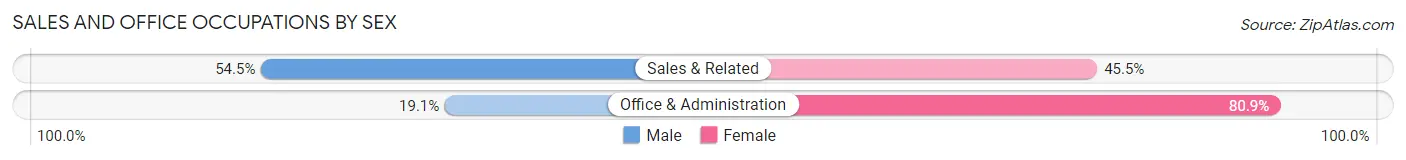
| Occupation | Male | Female |
| Sales & Related | 637 (54.5%) | 532 (45.5%) |
| Office & Administration | 199 (19.1%) | 841 (80.9%) |
| Total (Category) | 836 (37.9%) | 1,373 (62.2%) |
| Total (Overall) | 5,295 (56.6%) | 4,055 (43.4%) |
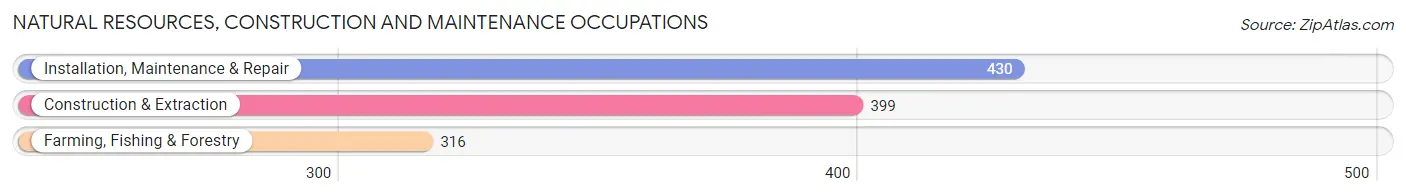
Natural Resources, Construction and Maintenance Occupations
The most common Natural Resources, Construction and Maintenance occupations in Johnstown are Installation, Maintenance & Repair (430 | 4.6%), Construction & Extraction (399 | 4.3%), and Farming, Fishing & Forestry (316 | 3.4%).
Natural Resources, Construction and Maintenance Occupations by Sex
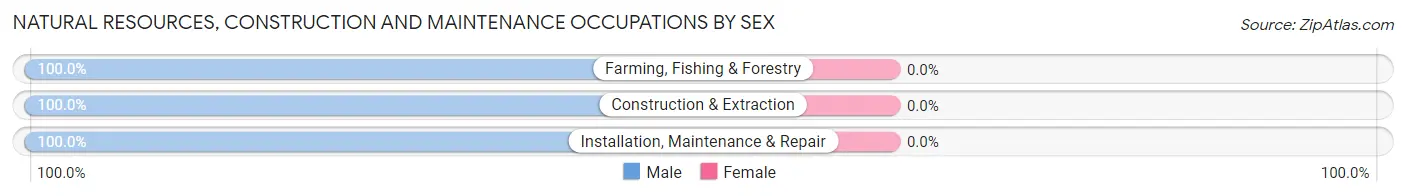
| Occupation | Male | Female |
| Farming, Fishing & Forestry | 316 (100.0%) | 0 (0.0%) |
| Construction & Extraction | 399 (100.0%) | 0 (0.0%) |
| Installation, Maintenance & Repair | 430 (100.0%) | 0 (0.0%) |
| Total (Category) | 1,145 (100.0%) | 0 (0.0%) |
| Total (Overall) | 5,295 (56.6%) | 4,055 (43.4%) |
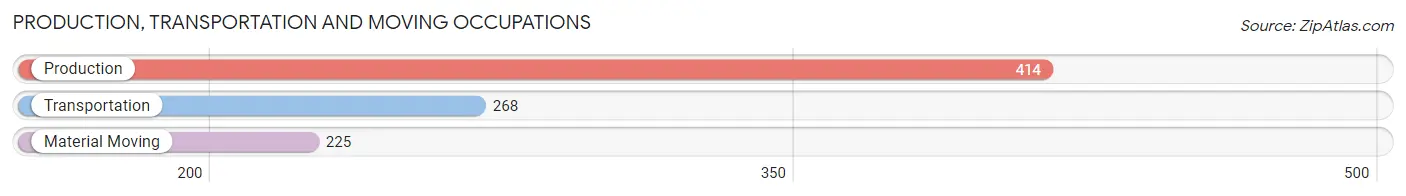
Production, Transportation and Moving Occupations
The most common Production, Transportation and Moving occupations in Johnstown are Production (414 | 4.4%), Transportation (268 | 2.9%), and Material Moving (225 | 2.4%).
Production, Transportation and Moving Occupations by Sex
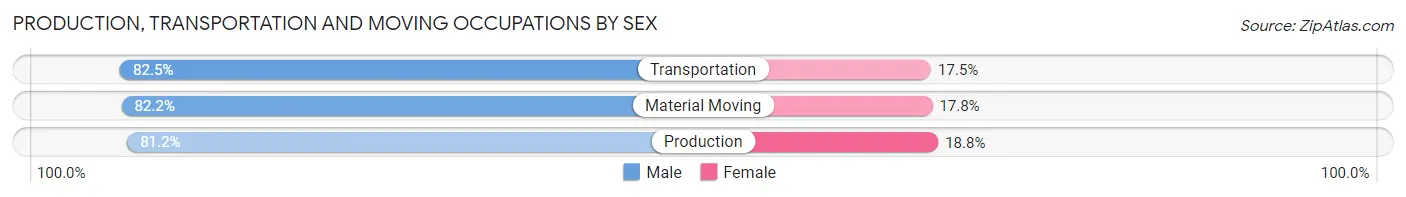
| Occupation | Male | Female |
| Production | 336 (81.2%) | 78 (18.8%) |
| Transportation | 221 (82.5%) | 47 (17.5%) |
| Material Moving | 185 (82.2%) | 40 (17.8%) |
| Total (Category) | 742 (81.8%) | 165 (18.2%) |
| Total (Overall) | 5,295 (56.6%) | 4,055 (43.4%) |
Employment Industries by Sex in Johnstown
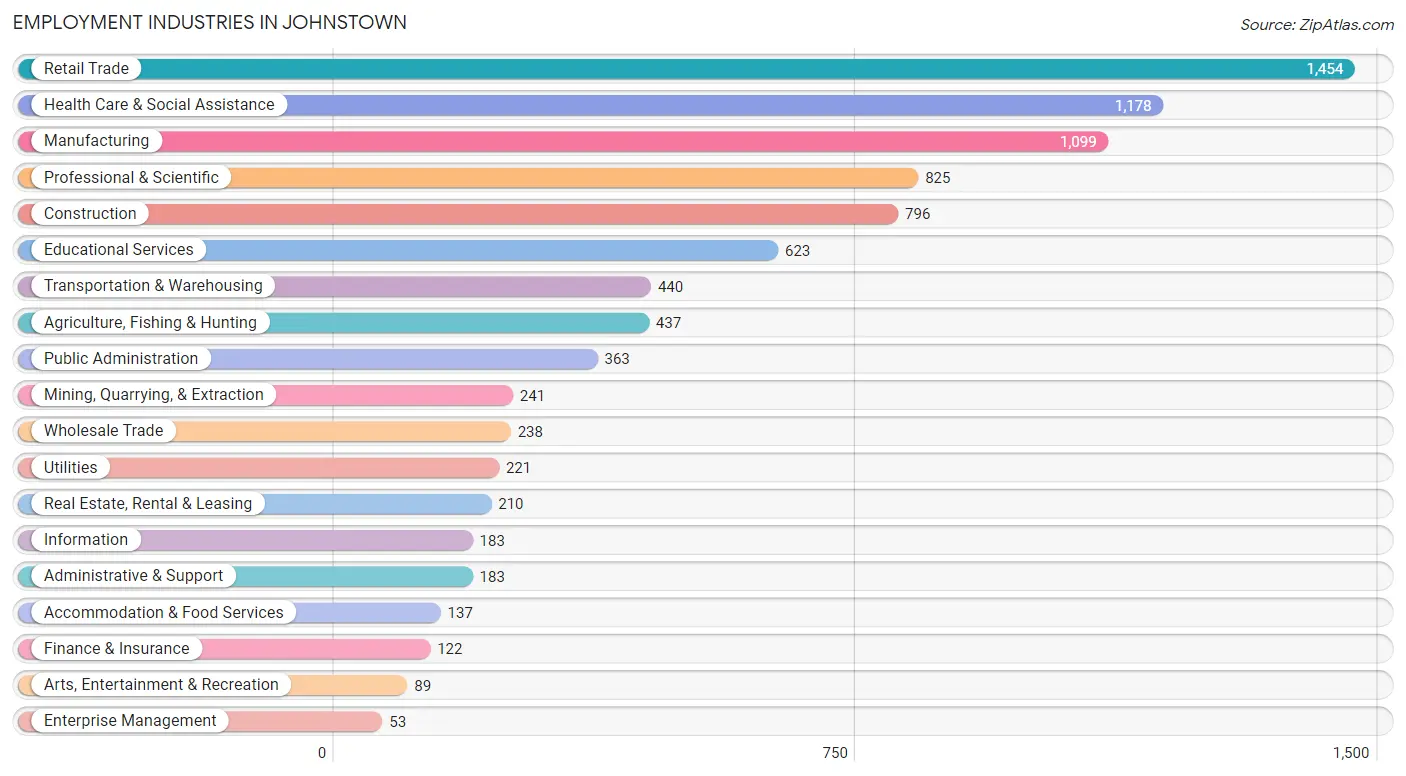
Employment Industries in Johnstown
The major employment industries in Johnstown include Retail Trade (1,454 | 15.5%), Health Care & Social Assistance (1,178 | 12.6%), Manufacturing (1,099 | 11.7%), Professional & Scientific (825 | 8.8%), and Construction (796 | 8.5%).
Employment Industries by Sex in Johnstown
The Johnstown industries that see more men than women are Mining, Quarrying, & Extraction (100.0%), Enterprise Management (100.0%), and Agriculture, Fishing & Hunting (84.4%), whereas the industries that tend to have a higher number of women are Arts, Entertainment & Recreation (100.0%), Health Care & Social Assistance (85.9%), and Educational Services (82.5%).
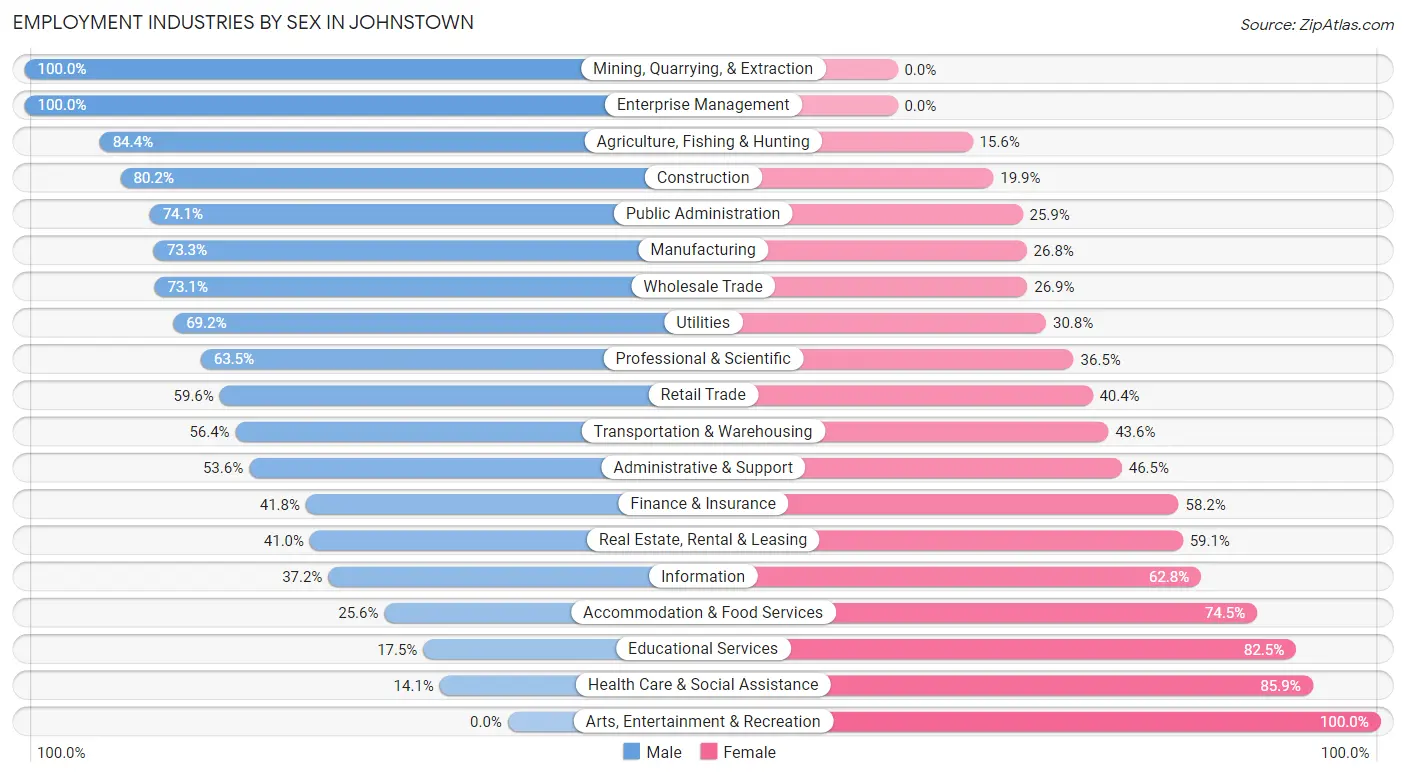
| Industry | Male | Female |
| Agriculture, Fishing & Hunting | 369 (84.4%) | 68 (15.6%) |
| Mining, Quarrying, & Extraction | 241 (100.0%) | 0 (0.0%) |
| Construction | 638 (80.1%) | 158 (19.9%) |
| Manufacturing | 805 (73.3%) | 294 (26.8%) |
| Wholesale Trade | 174 (73.1%) | 64 (26.9%) |
| Retail Trade | 867 (59.6%) | 587 (40.4%) |
| Transportation & Warehousing | 248 (56.4%) | 192 (43.6%) |
| Utilities | 153 (69.2%) | 68 (30.8%) |
| Information | 68 (37.2%) | 115 (62.8%) |
| Finance & Insurance | 51 (41.8%) | 71 (58.2%) |
| Real Estate, Rental & Leasing | 86 (40.9%) | 124 (59.1%) |
| Professional & Scientific | 524 (63.5%) | 301 (36.5%) |
| Enterprise Management | 53 (100.0%) | 0 (0.0%) |
| Administrative & Support | 98 (53.5%) | 85 (46.5%) |
| Educational Services | 109 (17.5%) | 514 (82.5%) |
| Health Care & Social Assistance | 166 (14.1%) | 1,012 (85.9%) |
| Arts, Entertainment & Recreation | 0 (0.0%) | 89 (100.0%) |
| Accommodation & Food Services | 35 (25.6%) | 102 (74.5%) |
| Public Administration | 269 (74.1%) | 94 (25.9%) |
| Total | 5,295 (56.6%) | 4,055 (43.4%) |
Education in Johnstown
School Enrollment in Johnstown
The most common levels of schooling among the 3,919 students in Johnstown are elementary school (1,069 | 27.3%), middle school (1,034 | 26.4%), and college / undergraduate (744 | 19.0%).
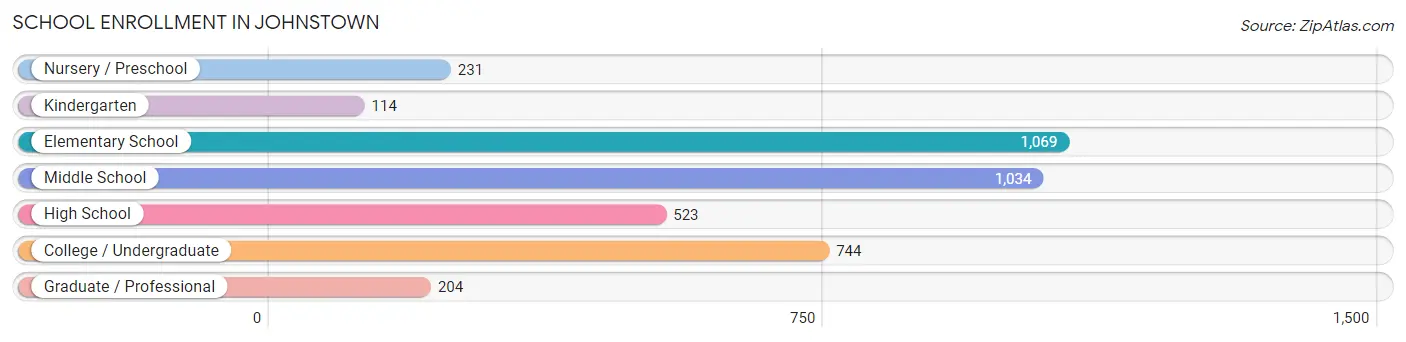
| School Level | # Students | % Students |
| Nursery / Preschool | 231 | 5.9% |
| Kindergarten | 114 | 2.9% |
| Elementary School | 1,069 | 27.3% |
| Middle School | 1,034 | 26.4% |
| High School | 523 | 13.4% |
| College / Undergraduate | 744 | 19.0% |
| Graduate / Professional | 204 | 5.2% |
| Total | 3,919 | 100.0% |
School Enrollment by Age by Funding Source in Johnstown
Out of a total of 3,919 students who are enrolled in schools in Johnstown, 662 (16.9%) attend a private institution, while the remaining 3,257 (83.1%) are enrolled in public schools. The age group of 3 to 4 year olds has the highest likelihood of being enrolled in private schools, with 105 (61.1% in the age bracket) enrolled. Conversely, the age group of 35 years and over has the lowest likelihood of being enrolled in a private school, with 205 (100.0% in the age bracket) attending a public institution.
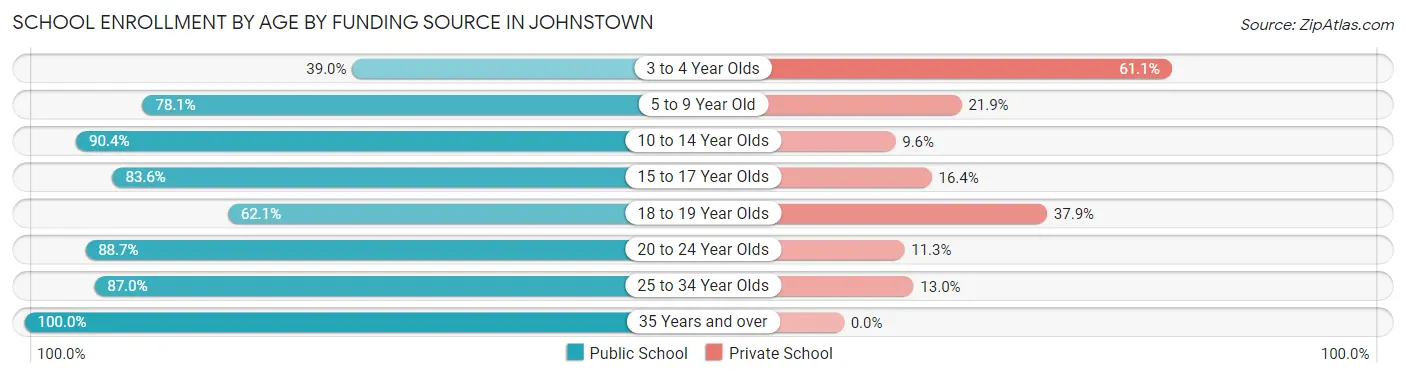
| Age Bracket | Public School | Private School |
| 3 to 4 Year Olds | 67 (39.0%) | 105 (61.1%) |
| 5 to 9 Year Old | 854 (78.1%) | 240 (21.9%) |
| 10 to 14 Year Olds | 1,138 (90.4%) | 121 (9.6%) |
| 15 to 17 Year Olds | 373 (83.6%) | 73 (16.4%) |
| 18 to 19 Year Olds | 87 (62.1%) | 53 (37.9%) |
| 20 to 24 Year Olds | 330 (88.7%) | 42 (11.3%) |
| 25 to 34 Year Olds | 201 (87.0%) | 30 (13.0%) |
| 35 Years and over | 205 (100.0%) | 0 (0.0%) |
| Total | 3,257 (83.1%) | 662 (16.9%) |
Educational Attainment by Field of Study in Johnstown
Engineering (767 | 16.1%), business (689 | 14.4%), science & technology (677 | 14.2%), education (515 | 10.8%), and arts & humanities (419 | 8.8%) are the most common fields of study among 4,767 individuals in Johnstown who have obtained a bachelor's degree or higher.
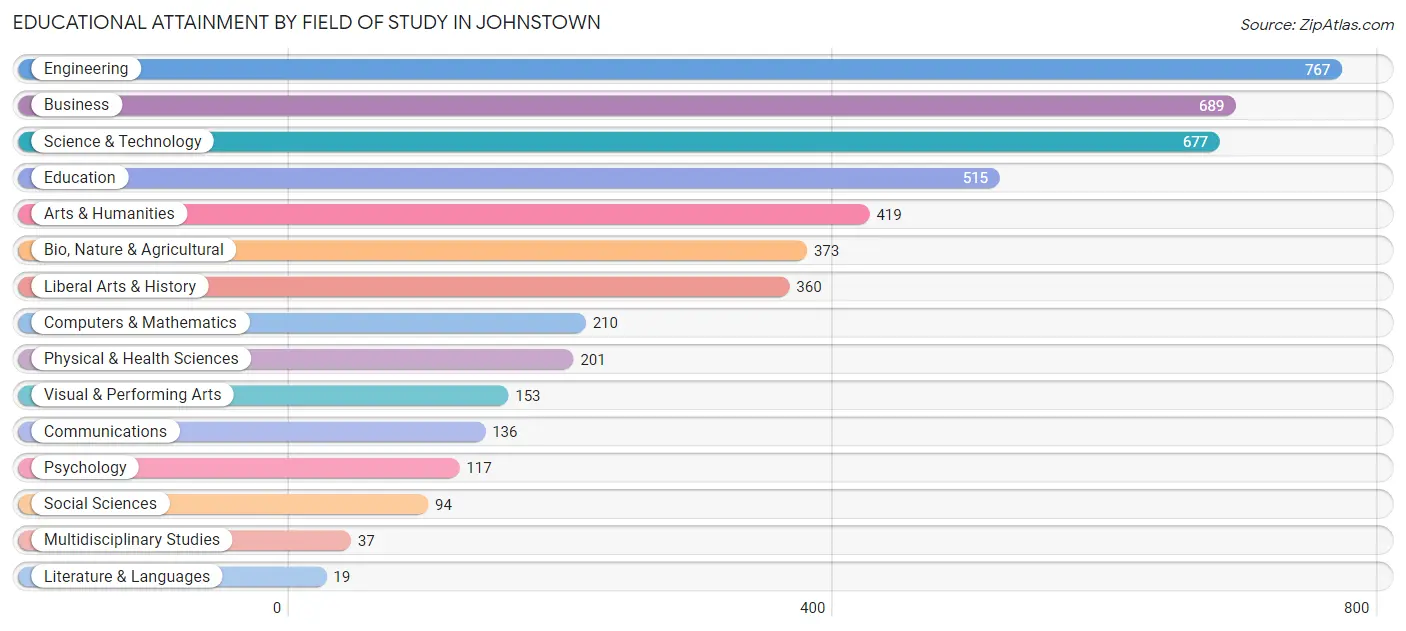
| Field of Study | # Graduates | % Graduates |
| Computers & Mathematics | 210 | 4.4% |
| Bio, Nature & Agricultural | 373 | 7.8% |
| Physical & Health Sciences | 201 | 4.2% |
| Psychology | 117 | 2.5% |
| Social Sciences | 94 | 2.0% |
| Engineering | 767 | 16.1% |
| Multidisciplinary Studies | 37 | 0.8% |
| Science & Technology | 677 | 14.2% |
| Business | 689 | 14.4% |
| Education | 515 | 10.8% |
| Literature & Languages | 19 | 0.4% |
| Liberal Arts & History | 360 | 7.5% |
| Visual & Performing Arts | 153 | 3.2% |
| Communications | 136 | 2.9% |
| Arts & Humanities | 419 | 8.8% |
| Total | 4,767 | 100.0% |
Transportation & Commute in Johnstown
Vehicle Availability by Sex in Johnstown
The most prevalent vehicle ownership categories in Johnstown are males with 2 vehicles (2,316, accounting for 42.6%) and females with 2 vehicles (1,830, making up 57.1%).
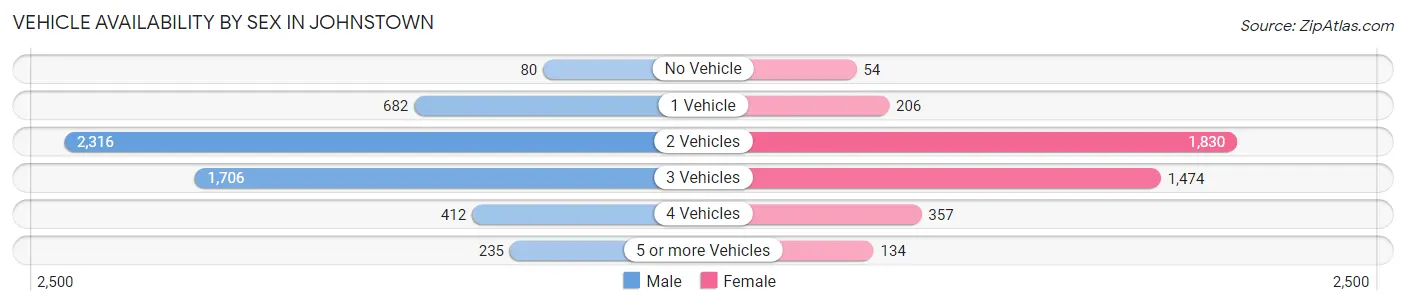
| Vehicles Available | Male | Female |
| No Vehicle | 80 (1.5%) | 54 (1.3%) |
| 1 Vehicle | 682 (12.6%) | 206 (5.1%) |
| 2 Vehicles | 2,316 (42.6%) | 1,830 (45.1%) |
| 3 Vehicles | 1,706 (31.4%) | 1,474 (36.3%) |
| 4 Vehicles | 412 (7.6%) | 357 (8.8%) |
| 5 or more Vehicles | 235 (4.3%) | 134 (3.3%) |
| Total | 5,431 (100.0%) | 4,055 (100.0%) |
Commute Time in Johnstown
The most frequently occuring commute durations in Johnstown are 20 to 24 minutes (1,995 commuters, 24.4%), 30 to 34 minutes (1,475 commuters, 18.1%), and 45 to 59 minutes (1,042 commuters, 12.8%).
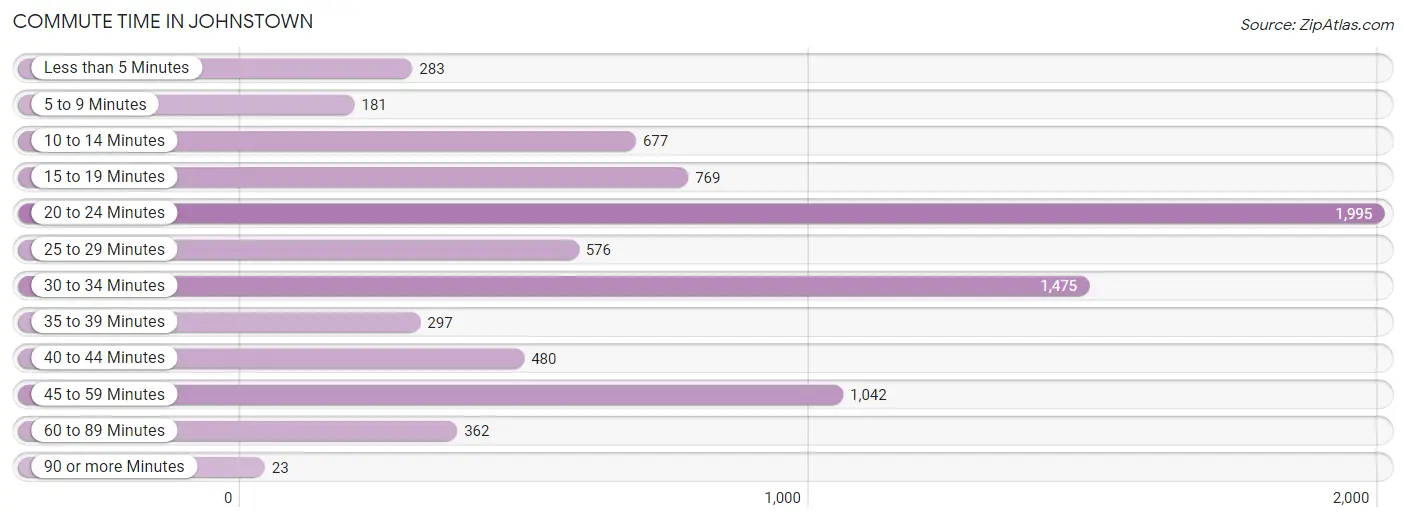
| Commute Time | # Commuters | % Commuters |
| Less than 5 Minutes | 283 | 3.5% |
| 5 to 9 Minutes | 181 | 2.2% |
| 10 to 14 Minutes | 677 | 8.3% |
| 15 to 19 Minutes | 769 | 9.4% |
| 20 to 24 Minutes | 1,995 | 24.4% |
| 25 to 29 Minutes | 576 | 7.1% |
| 30 to 34 Minutes | 1,475 | 18.1% |
| 35 to 39 Minutes | 297 | 3.6% |
| 40 to 44 Minutes | 480 | 5.9% |
| 45 to 59 Minutes | 1,042 | 12.8% |
| 60 to 89 Minutes | 362 | 4.4% |
| 90 or more Minutes | 23 | 0.3% |
Commute Time by Sex in Johnstown
The most common commute times in Johnstown are 20 to 24 minutes (1,093 commuters, 22.5%) for males and 20 to 24 minutes (902 commuters, 27.4%) for females.
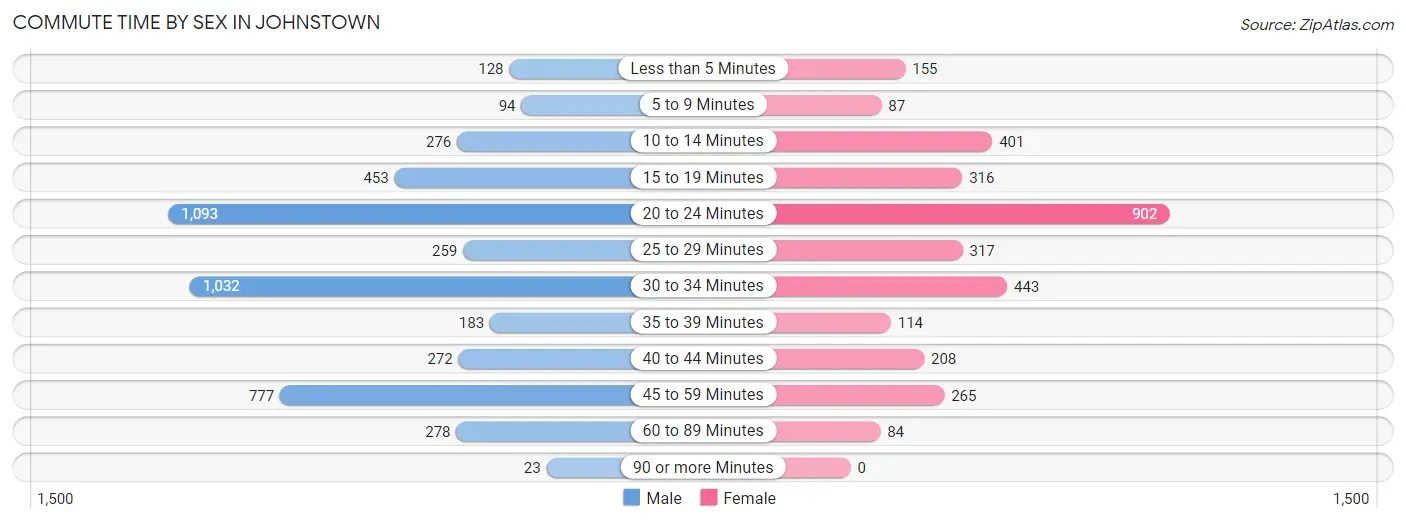
| Commute Time | Male | Female |
| Less than 5 Minutes | 128 (2.6%) | 155 (4.7%) |
| 5 to 9 Minutes | 94 (1.9%) | 87 (2.6%) |
| 10 to 14 Minutes | 276 (5.7%) | 401 (12.2%) |
| 15 to 19 Minutes | 453 (9.3%) | 316 (9.6%) |
| 20 to 24 Minutes | 1,093 (22.5%) | 902 (27.4%) |
| 25 to 29 Minutes | 259 (5.3%) | 317 (9.6%) |
| 30 to 34 Minutes | 1,032 (21.2%) | 443 (13.5%) |
| 35 to 39 Minutes | 183 (3.8%) | 114 (3.5%) |
| 40 to 44 Minutes | 272 (5.6%) | 208 (6.3%) |
| 45 to 59 Minutes | 777 (16.0%) | 265 (8.1%) |
| 60 to 89 Minutes | 278 (5.7%) | 84 (2.5%) |
| 90 or more Minutes | 23 (0.5%) | 0 (0.0%) |
Time of Departure to Work by Sex in Johnstown
The most frequent times of departure to work in Johnstown are 6:00 AM to 6:29 AM (744, 15.3%) for males and 7:30 AM to 7:59 AM (872, 26.5%) for females.
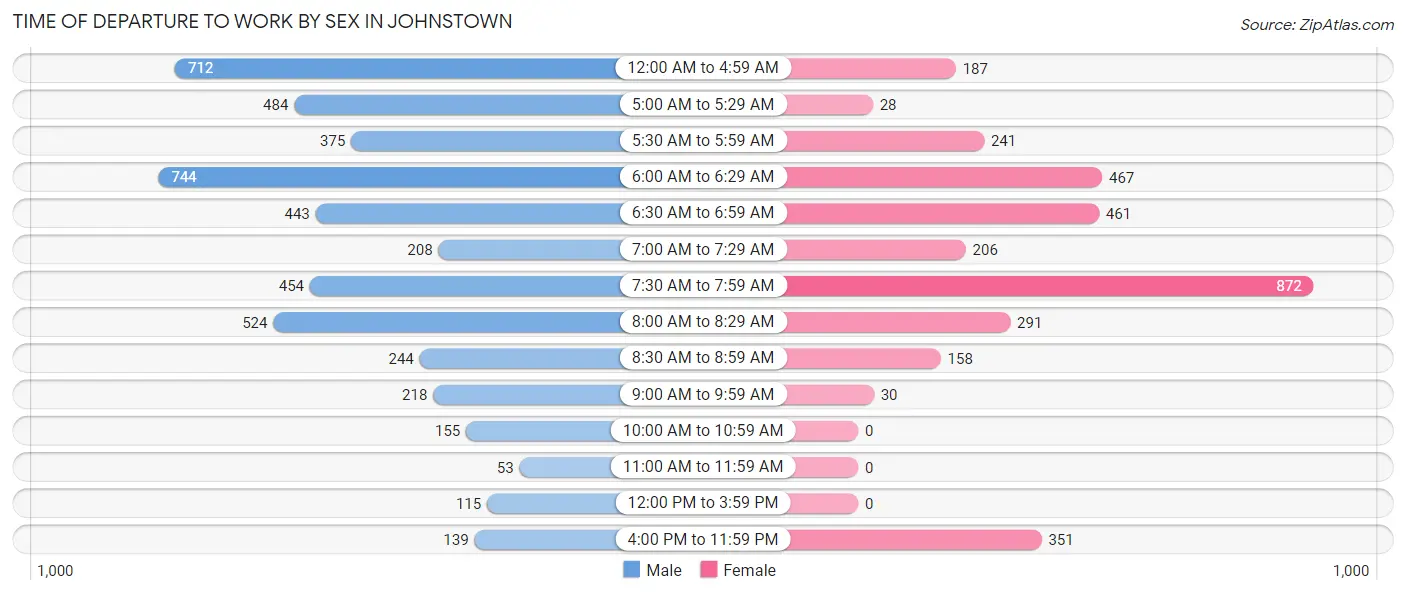
| Time of Departure | Male | Female |
| 12:00 AM to 4:59 AM | 712 (14.6%) | 187 (5.7%) |
| 5:00 AM to 5:29 AM | 484 (9.9%) | 28 (0.9%) |
| 5:30 AM to 5:59 AM | 375 (7.7%) | 241 (7.3%) |
| 6:00 AM to 6:29 AM | 744 (15.3%) | 467 (14.2%) |
| 6:30 AM to 6:59 AM | 443 (9.1%) | 461 (14.0%) |
| 7:00 AM to 7:29 AM | 208 (4.3%) | 206 (6.3%) |
| 7:30 AM to 7:59 AM | 454 (9.3%) | 872 (26.5%) |
| 8:00 AM to 8:29 AM | 524 (10.8%) | 291 (8.8%) |
| 8:30 AM to 8:59 AM | 244 (5.0%) | 158 (4.8%) |
| 9:00 AM to 9:59 AM | 218 (4.5%) | 30 (0.9%) |
| 10:00 AM to 10:59 AM | 155 (3.2%) | 0 (0.0%) |
| 11:00 AM to 11:59 AM | 53 (1.1%) | 0 (0.0%) |
| 12:00 PM to 3:59 PM | 115 (2.4%) | 0 (0.0%) |
| 4:00 PM to 11:59 PM | 139 (2.9%) | 351 (10.7%) |
| Total | 4,868 (100.0%) | 3,292 (100.0%) |
Housing Occupancy in Johnstown
Occupancy by Ownership in Johnstown
Of the total 6,524 dwellings in Johnstown, owner-occupied units account for 4,914 (75.3%), while renter-occupied units make up 1,610 (24.7%).
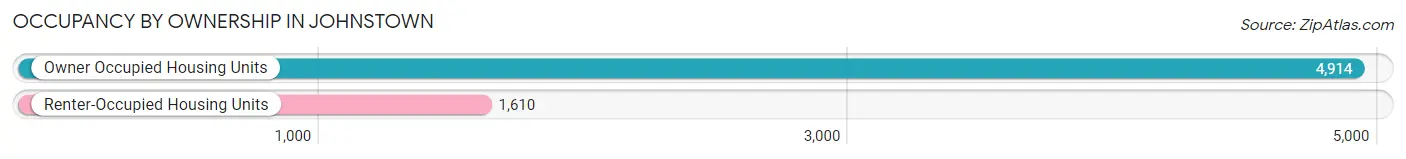
| Occupancy | # Housing Units | % Housing Units |
| Owner Occupied Housing Units | 4,914 | 75.3% |
| Renter-Occupied Housing Units | 1,610 | 24.7% |
| Total Occupied Housing Units | 6,524 | 100.0% |
Occupancy by Household Size in Johnstown
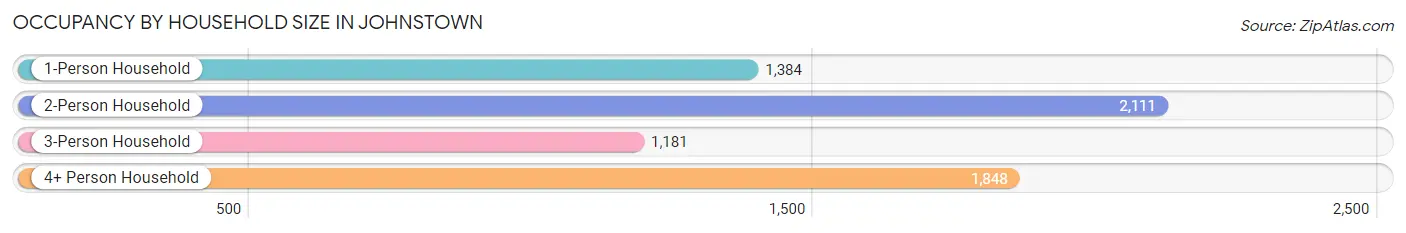
| Household Size | # Housing Units | % Housing Units |
| 1-Person Household | 1,384 | 21.2% |
| 2-Person Household | 2,111 | 32.4% |
| 3-Person Household | 1,181 | 18.1% |
| 4+ Person Household | 1,848 | 28.3% |
| Total Housing Units | 6,524 | 100.0% |
Occupancy by Ownership by Household Size in Johnstown
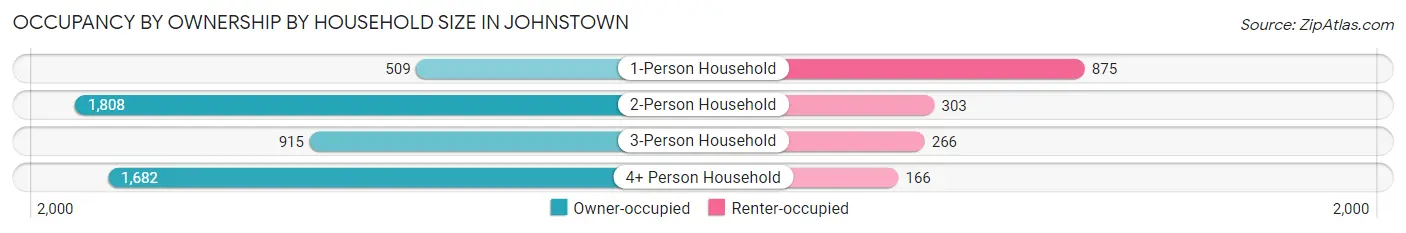
| Household Size | Owner-occupied | Renter-occupied |
| 1-Person Household | 509 (36.8%) | 875 (63.2%) |
| 2-Person Household | 1,808 (85.7%) | 303 (14.3%) |
| 3-Person Household | 915 (77.5%) | 266 (22.5%) |
| 4+ Person Household | 1,682 (91.0%) | 166 (9.0%) |
| Total Housing Units | 4,914 (75.3%) | 1,610 (24.7%) |
Occupancy by Educational Attainment in Johnstown
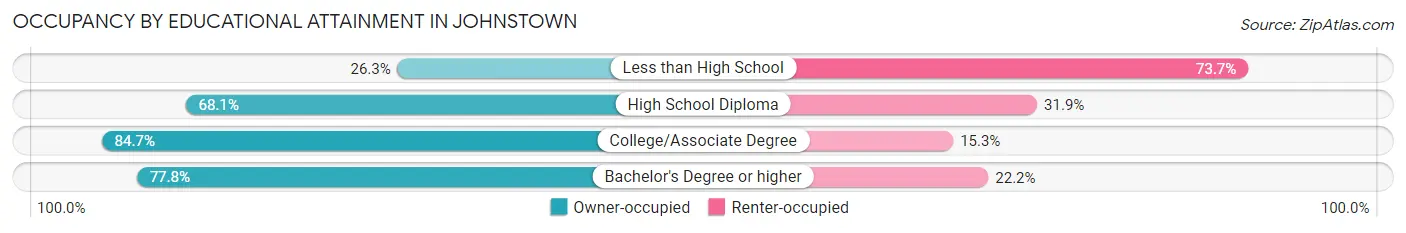
| Household Size | Owner-occupied | Renter-occupied |
| Less than High School | 120 (26.3%) | 337 (73.7%) |
| High School Diploma | 674 (68.1%) | 316 (31.9%) |
| College/Associate Degree | 2,092 (84.7%) | 377 (15.3%) |
| Bachelor's Degree or higher | 2,028 (77.8%) | 580 (22.2%) |
Occupancy by Age of Householder in Johnstown
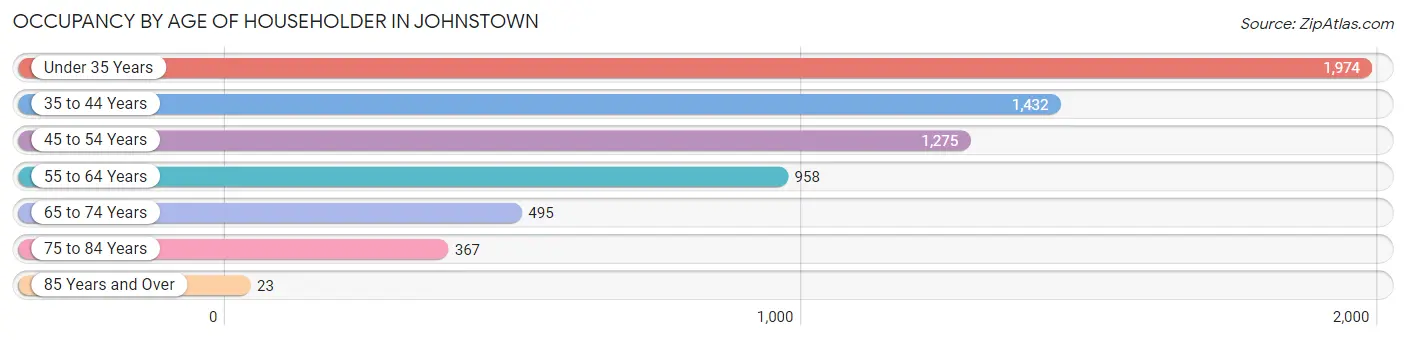
| Age Bracket | # Households | % Households |
| Under 35 Years | 1,974 | 30.3% |
| 35 to 44 Years | 1,432 | 22.0% |
| 45 to 54 Years | 1,275 | 19.5% |
| 55 to 64 Years | 958 | 14.7% |
| 65 to 74 Years | 495 | 7.6% |
| 75 to 84 Years | 367 | 5.6% |
| 85 Years and Over | 23 | 0.4% |
| Total | 6,524 | 100.0% |
Housing Finances in Johnstown
Median Income by Occupancy in Johnstown
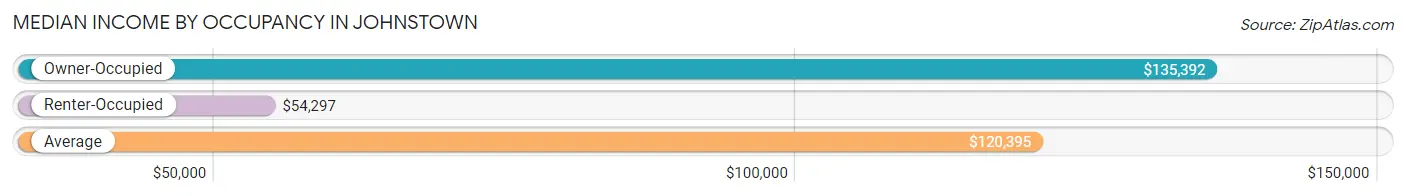
| Occupancy Type | # Households | Median Income |
| Owner-Occupied | 4,914 (75.3%) | $135,392 |
| Renter-Occupied | 1,610 (24.7%) | $54,297 |
| Average | 6,524 (100.0%) | $120,395 |
Occupancy by Householder Income Bracket in Johnstown
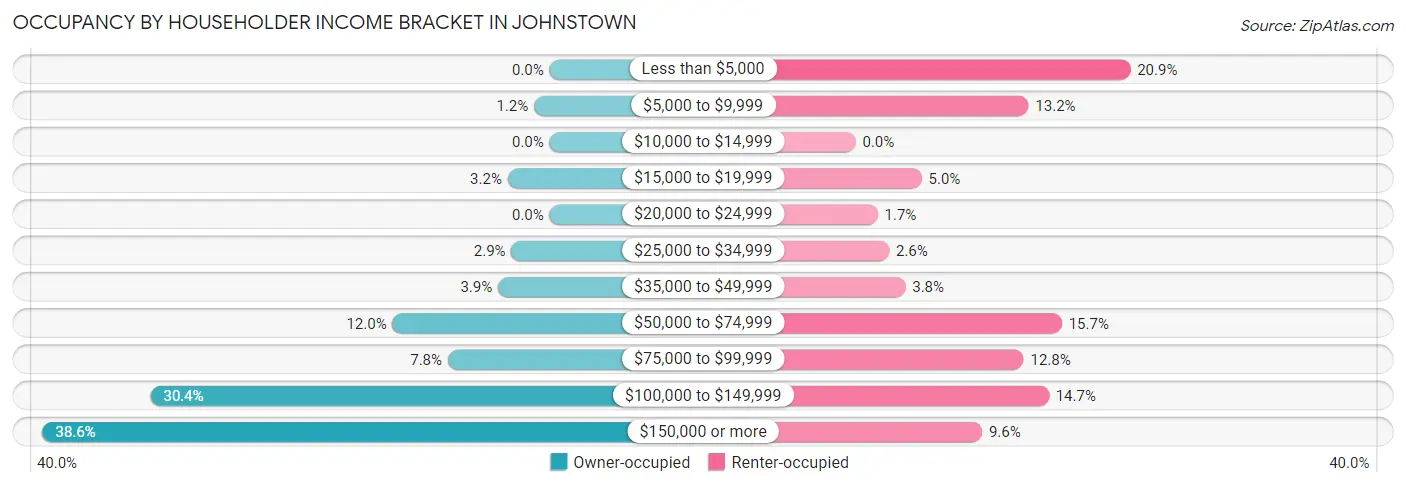
| Income Bracket | Owner-occupied | Renter-occupied |
| Less than $5,000 | 0 (0.0%) | 337 (20.9%) |
| $5,000 to $9,999 | 58 (1.2%) | 212 (13.2%) |
| $10,000 to $14,999 | 0 (0.0%) | 0 (0.0%) |
| $15,000 to $19,999 | 157 (3.2%) | 81 (5.0%) |
| $20,000 to $24,999 | 0 (0.0%) | 27 (1.7%) |
| $25,000 to $34,999 | 143 (2.9%) | 41 (2.5%) |
| $35,000 to $49,999 | 193 (3.9%) | 61 (3.8%) |
| $50,000 to $74,999 | 588 (12.0%) | 253 (15.7%) |
| $75,000 to $99,999 | 381 (7.7%) | 206 (12.8%) |
| $100,000 to $149,999 | 1,495 (30.4%) | 237 (14.7%) |
| $150,000 or more | 1,899 (38.6%) | 155 (9.6%) |
| Total | 4,914 (100.0%) | 1,610 (100.0%) |
Monthly Housing Cost Tiers in Johnstown
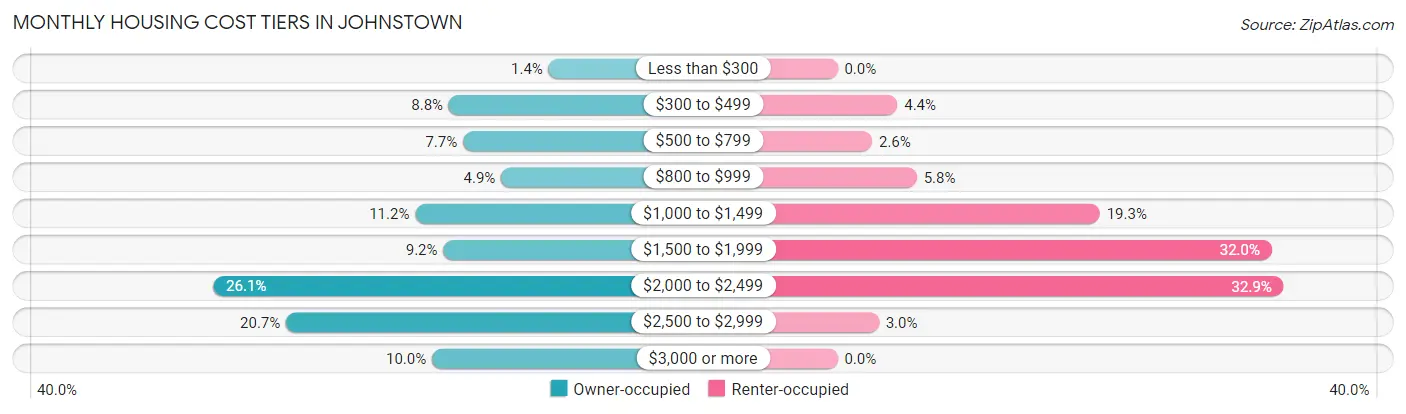
| Monthly Cost | Owner-occupied | Renter-occupied |
| Less than $300 | 69 (1.4%) | 0 (0.0%) |
| $300 to $499 | 430 (8.7%) | 71 (4.4%) |
| $500 to $799 | 379 (7.7%) | 41 (2.5%) |
| $800 to $999 | 241 (4.9%) | 94 (5.8%) |
| $1,000 to $1,499 | 552 (11.2%) | 311 (19.3%) |
| $1,500 to $1,999 | 450 (9.2%) | 515 (32.0%) |
| $2,000 to $2,499 | 1,283 (26.1%) | 529 (32.9%) |
| $2,500 to $2,999 | 1,019 (20.7%) | 49 (3.0%) |
| $3,000 or more | 491 (10.0%) | 0 (0.0%) |
| Total | 4,914 (100.0%) | 1,610 (100.0%) |
Physical Housing Characteristics in Johnstown
Housing Structures in Johnstown
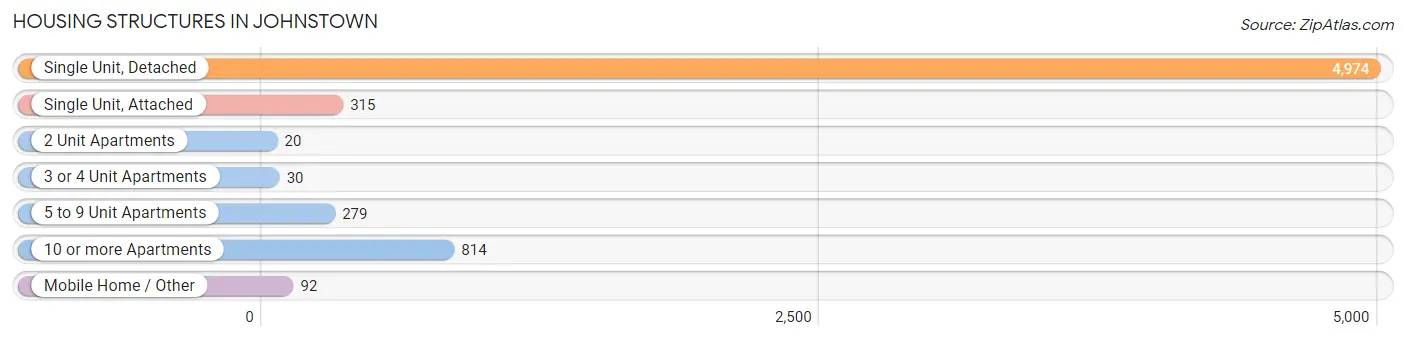
| Structure Type | # Housing Units | % Housing Units |
| Single Unit, Detached | 4,974 | 76.2% |
| Single Unit, Attached | 315 | 4.8% |
| 2 Unit Apartments | 20 | 0.3% |
| 3 or 4 Unit Apartments | 30 | 0.5% |
| 5 to 9 Unit Apartments | 279 | 4.3% |
| 10 or more Apartments | 814 | 12.5% |
| Mobile Home / Other | 92 | 1.4% |
| Total | 6,524 | 100.0% |
Housing Structures by Occupancy in Johnstown
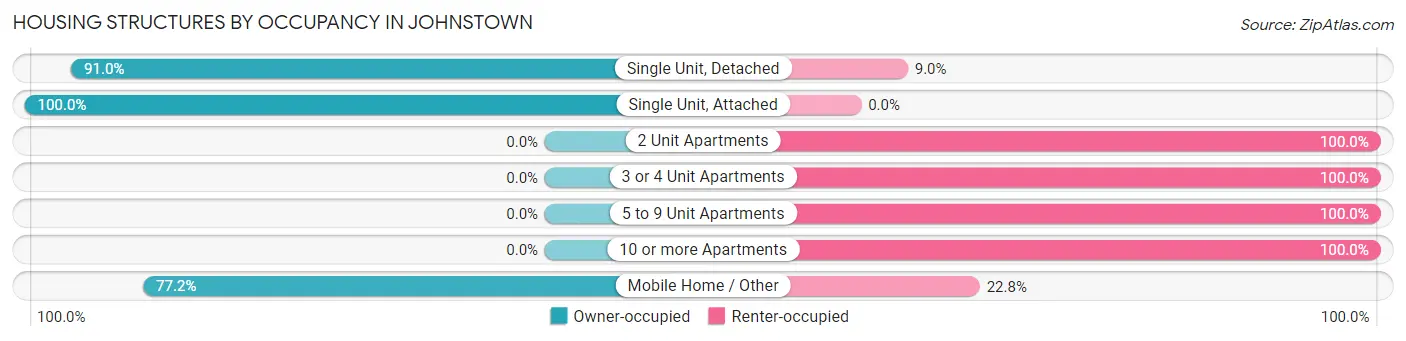
| Structure Type | Owner-occupied | Renter-occupied |
| Single Unit, Detached | 4,528 (91.0%) | 446 (9.0%) |
| Single Unit, Attached | 315 (100.0%) | 0 (0.0%) |
| 2 Unit Apartments | 0 (0.0%) | 20 (100.0%) |
| 3 or 4 Unit Apartments | 0 (0.0%) | 30 (100.0%) |
| 5 to 9 Unit Apartments | 0 (0.0%) | 279 (100.0%) |
| 10 or more Apartments | 0 (0.0%) | 814 (100.0%) |
| Mobile Home / Other | 71 (77.2%) | 21 (22.8%) |
| Total | 4,914 (75.3%) | 1,610 (24.7%) |
Housing Structures by Number of Rooms in Johnstown
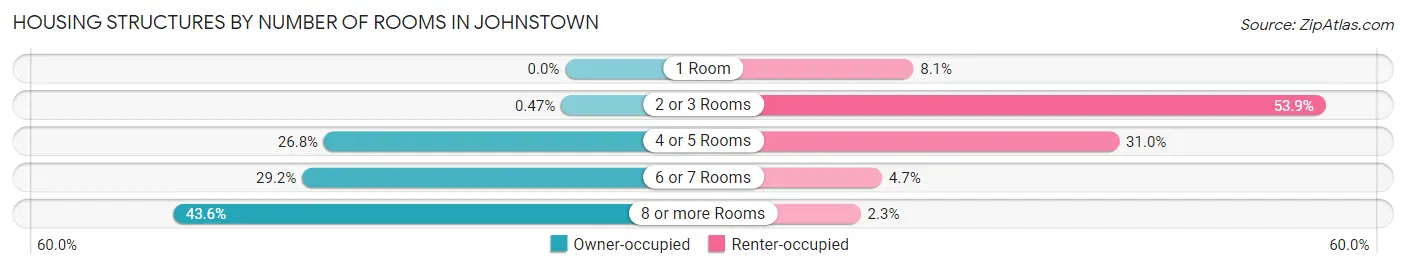
| Number of Rooms | Owner-occupied | Renter-occupied |
| 1 Room | 0 (0.0%) | 131 (8.1%) |
| 2 or 3 Rooms | 23 (0.5%) | 868 (53.9%) |
| 4 or 5 Rooms | 1,316 (26.8%) | 499 (31.0%) |
| 6 or 7 Rooms | 1,435 (29.2%) | 75 (4.7%) |
| 8 or more Rooms | 2,140 (43.5%) | 37 (2.3%) |
| Total | 4,914 (100.0%) | 1,610 (100.0%) |
Housing Structure by Heating Type in Johnstown
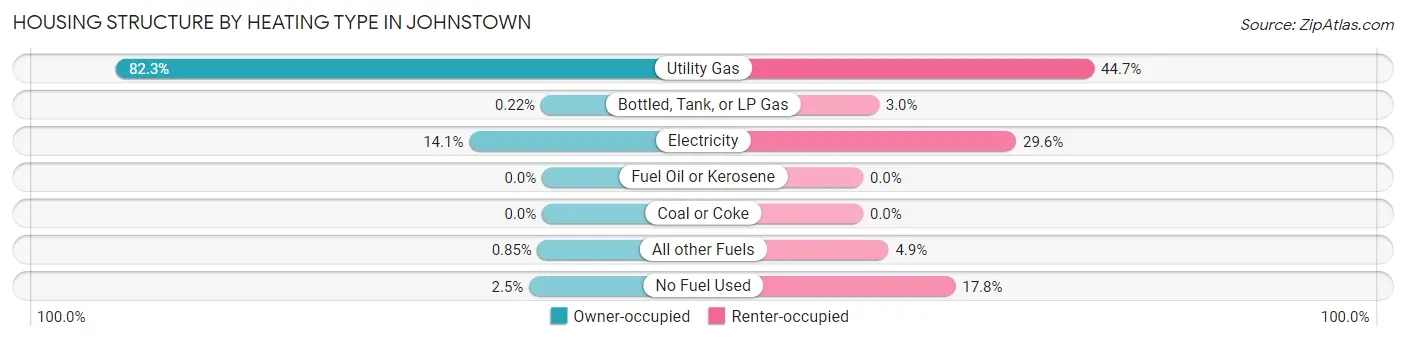
| Heating Type | Owner-occupied | Renter-occupied |
| Utility Gas | 4,046 (82.3%) | 719 (44.7%) |
| Bottled, Tank, or LP Gas | 11 (0.2%) | 49 (3.0%) |
| Electricity | 692 (14.1%) | 476 (29.6%) |
| Fuel Oil or Kerosene | 0 (0.0%) | 0 (0.0%) |
| Coal or Coke | 0 (0.0%) | 0 (0.0%) |
| All other Fuels | 42 (0.9%) | 79 (4.9%) |
| No Fuel Used | 123 (2.5%) | 287 (17.8%) |
| Total | 4,914 (100.0%) | 1,610 (100.0%) |
Household Vehicle Usage in Johnstown
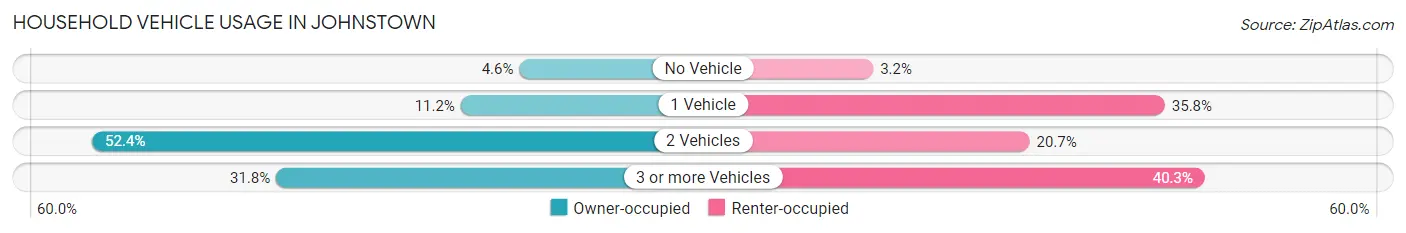
| Vehicles per Household | Owner-occupied | Renter-occupied |
| No Vehicle | 225 (4.6%) | 51 (3.2%) |
| 1 Vehicle | 548 (11.2%) | 577 (35.8%) |
| 2 Vehicles | 2,577 (52.4%) | 333 (20.7%) |
| 3 or more Vehicles | 1,564 (31.8%) | 649 (40.3%) |
| Total | 4,914 (100.0%) | 1,610 (100.0%) |
Real Estate & Mortgages in Johnstown
Real Estate and Mortgage Overview in Johnstown
| Characteristic | Without Mortgage | With Mortgage |
| Housing Units | 1,045 | 3,869 |
| Median Property Value | $444,800 | $463,700 |
| Median Household Income | $98,750 | $1,564 |
| Monthly Housing Costs | $529 | $491 |
| Real Estate Taxes | $2,424 | $75 |
Property Value by Mortgage Status in Johnstown
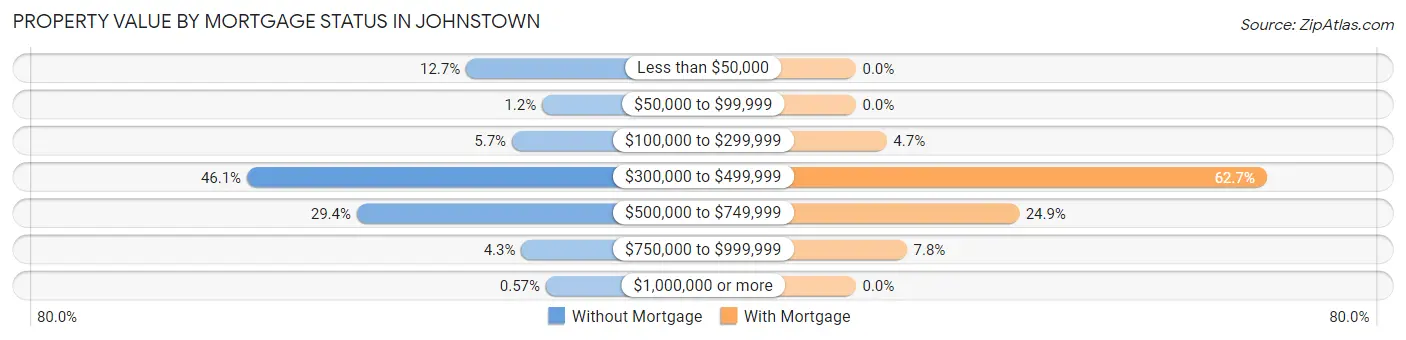
| Property Value | Without Mortgage | With Mortgage |
| Less than $50,000 | 133 (12.7%) | 0 (0.0%) |
| $50,000 to $99,999 | 12 (1.1%) | 0 (0.0%) |
| $100,000 to $299,999 | 60 (5.7%) | 182 (4.7%) |
| $300,000 to $499,999 | 482 (46.1%) | 2,424 (62.6%) |
| $500,000 to $749,999 | 307 (29.4%) | 962 (24.9%) |
| $750,000 to $999,999 | 45 (4.3%) | 301 (7.8%) |
| $1,000,000 or more | 6 (0.6%) | 0 (0.0%) |
| Total | 1,045 (100.0%) | 3,869 (100.0%) |
Household Income by Mortgage Status in Johnstown
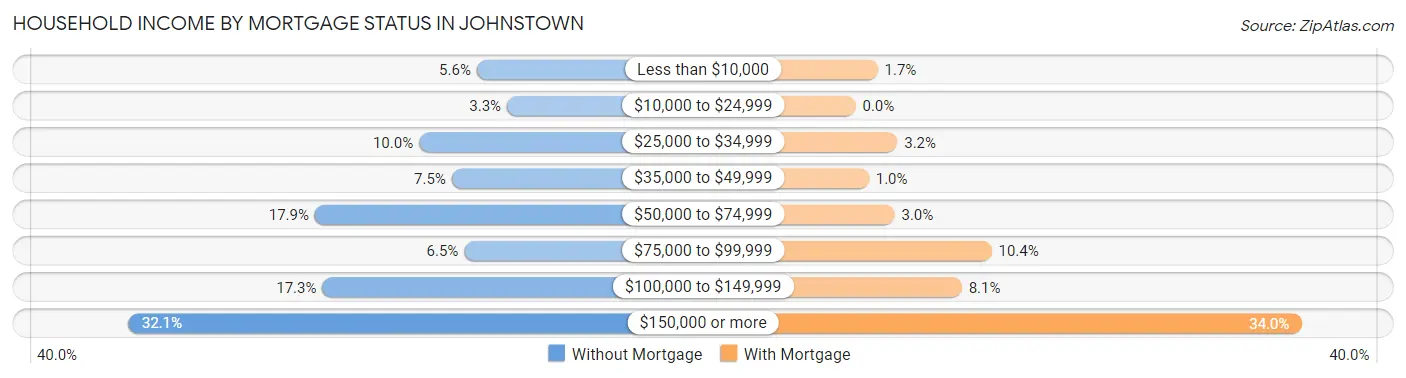
| Household Income | Without Mortgage | With Mortgage |
| Less than $10,000 | 58 (5.6%) | 65 (1.7%) |
| $10,000 to $24,999 | 34 (3.3%) | 0 (0.0%) |
| $25,000 to $34,999 | 104 (10.0%) | 123 (3.2%) |
| $35,000 to $49,999 | 78 (7.5%) | 39 (1.0%) |
| $50,000 to $74,999 | 187 (17.9%) | 115 (3.0%) |
| $75,000 to $99,999 | 68 (6.5%) | 401 (10.4%) |
| $100,000 to $149,999 | 181 (17.3%) | 313 (8.1%) |
| $150,000 or more | 335 (32.1%) | 1,314 (34.0%) |
| Total | 1,045 (100.0%) | 3,869 (100.0%) |
Property Value to Household Income Ratio in Johnstown
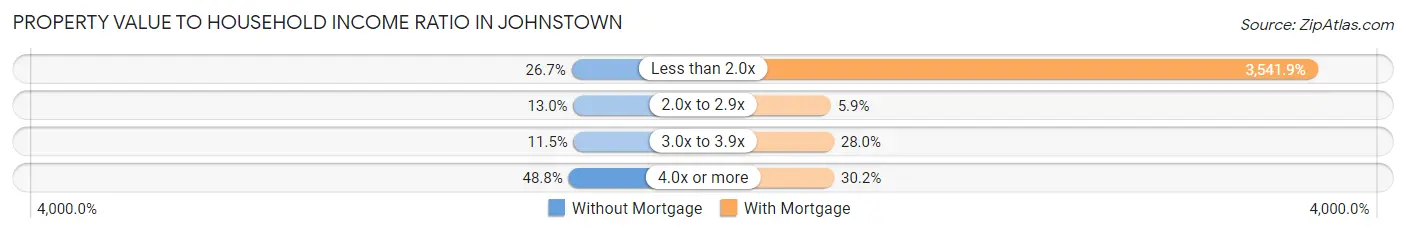
| Value-to-Income Ratio | Without Mortgage | With Mortgage |
| Less than 2.0x | 279 (26.7%) | 137,034 (3,541.9%) |
| 2.0x to 2.9x | 136 (13.0%) | 228 (5.9%) |
| 3.0x to 3.9x | 120 (11.5%) | 1,083 (28.0%) |
| 4.0x or more | 510 (48.8%) | 1,167 (30.2%) |
| Total | 1,045 (100.0%) | 3,869 (100.0%) |
Real Estate Taxes by Mortgage Status in Johnstown
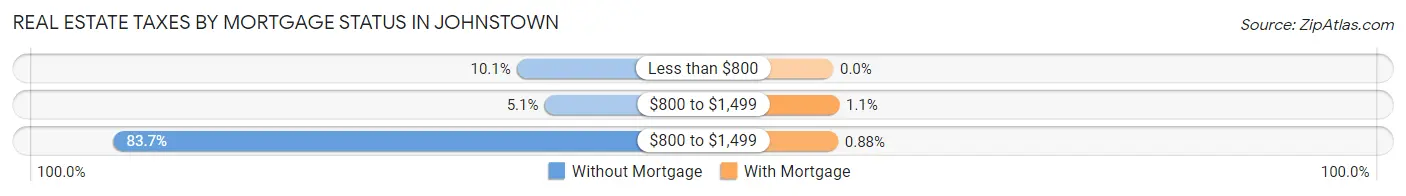
| Property Taxes | Without Mortgage | With Mortgage |
| Less than $800 | 106 (10.1%) | 0 (0.0%) |
| $800 to $1,499 | 53 (5.1%) | 42 (1.1%) |
| $800 to $1,499 | 875 (83.7%) | 34 (0.9%) |
| Total | 1,045 (100.0%) | 3,869 (100.0%) |
Health & Disability in Johnstown
Health Insurance Coverage by Age in Johnstown
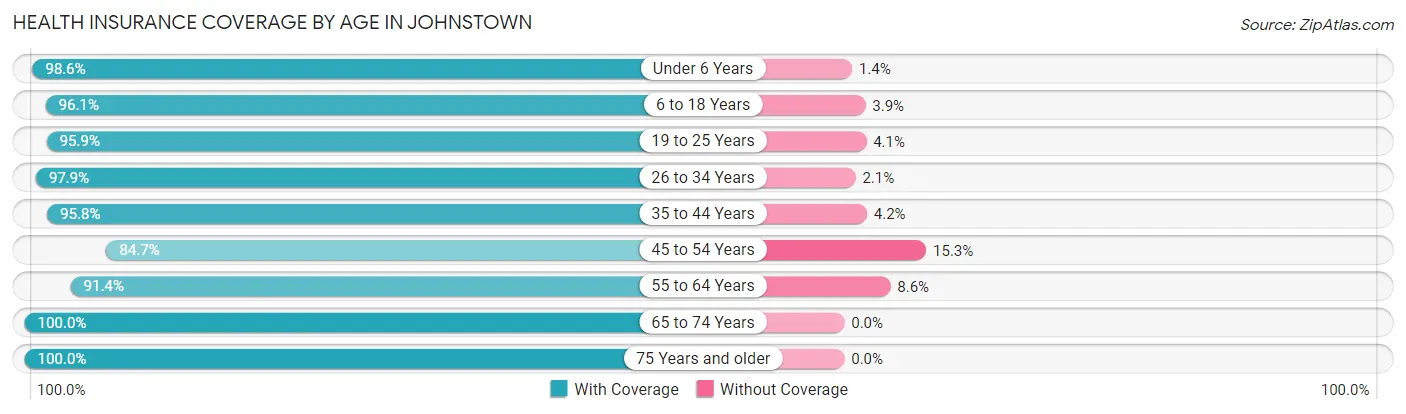
| Age Bracket | With Coverage | Without Coverage |
| Under 6 Years | 1,501 (98.6%) | 22 (1.4%) |
| 6 to 18 Years | 2,992 (96.1%) | 122 (3.9%) |
| 19 to 25 Years | 2,158 (95.9%) | 92 (4.1%) |
| 26 to 34 Years | 1,687 (97.9%) | 36 (2.1%) |
| 35 to 44 Years | 2,593 (95.8%) | 114 (4.2%) |
| 45 to 54 Years | 1,943 (84.7%) | 350 (15.3%) |
| 55 to 64 Years | 1,777 (91.4%) | 167 (8.6%) |
| 65 to 74 Years | 885 (100.0%) | 0 (0.0%) |
| 75 Years and older | 717 (100.0%) | 0 (0.0%) |
| Total | 16,253 (94.7%) | 903 (5.3%) |
Health Insurance Coverage by Citizenship Status in Johnstown
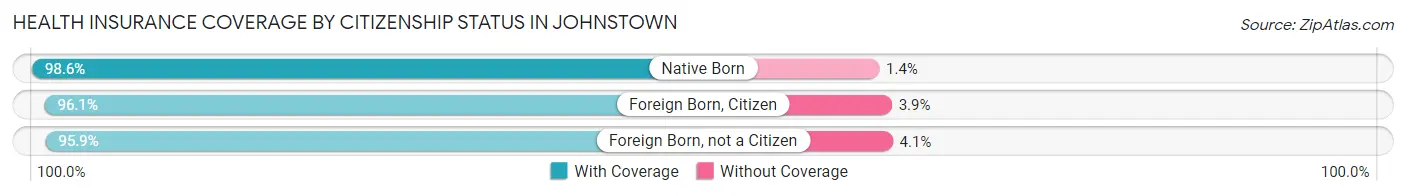
| Citizenship Status | With Coverage | Without Coverage |
| Native Born | 1,501 (98.6%) | 22 (1.4%) |
| Foreign Born, Citizen | 2,992 (96.1%) | 122 (3.9%) |
| Foreign Born, not a Citizen | 2,158 (95.9%) | 92 (4.1%) |
Health Insurance Coverage by Household Income in Johnstown
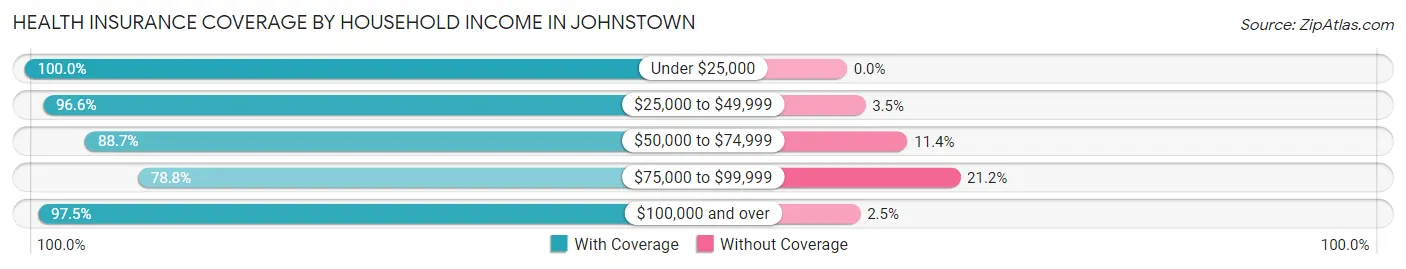
| Household Income | With Coverage | Without Coverage |
| Under $25,000 | 1,276 (100.0%) | 0 (0.0%) |
| $25,000 to $49,999 | 756 (96.6%) | 27 (3.5%) |
| $50,000 to $74,999 | 1,766 (88.6%) | 226 (11.4%) |
| $75,000 to $99,999 | 1,347 (78.8%) | 363 (21.2%) |
| $100,000 and over | 11,108 (97.5%) | 287 (2.5%) |
Public vs Private Health Insurance Coverage by Age in Johnstown
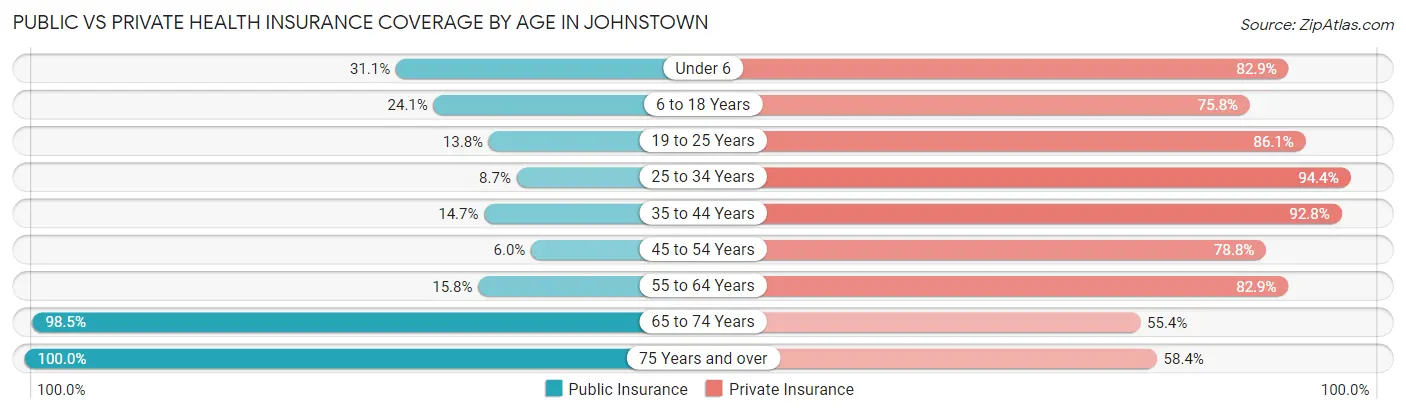
| Age Bracket | Public Insurance | Private Insurance |
| Under 6 | 473 (31.1%) | 1,263 (82.9%) |
| 6 to 18 Years | 750 (24.1%) | 2,359 (75.7%) |
| 19 to 25 Years | 311 (13.8%) | 1,937 (86.1%) |
| 25 to 34 Years | 149 (8.6%) | 1,627 (94.4%) |
| 35 to 44 Years | 397 (14.7%) | 2,511 (92.8%) |
| 45 to 54 Years | 137 (6.0%) | 1,806 (78.8%) |
| 55 to 64 Years | 307 (15.8%) | 1,611 (82.9%) |
| 65 to 74 Years | 872 (98.5%) | 490 (55.4%) |
| 75 Years and over | 717 (100.0%) | 419 (58.4%) |
| Total | 4,113 (24.0%) | 14,023 (81.7%) |
Disability Status by Sex by Age in Johnstown
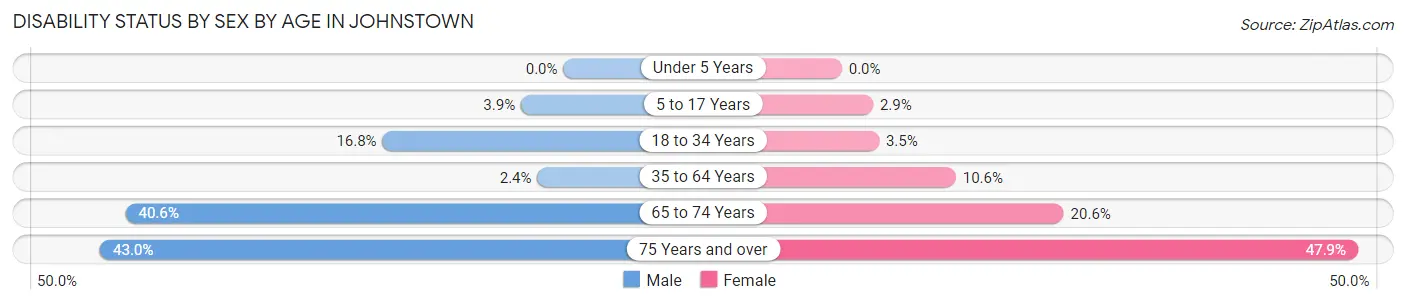
| Age Bracket | Male | Female |
| Under 5 Years | 0 (0.0%) | 0 (0.0%) |
| 5 to 17 Years | 72 (3.9%) | 35 (2.9%) |
| 18 to 34 Years | 356 (16.8%) | 71 (3.5%) |
| 35 to 64 Years | 91 (2.4%) | 335 (10.6%) |
| 65 to 74 Years | 180 (40.6%) | 91 (20.6%) |
| 75 Years and over | 135 (43.0%) | 193 (47.9%) |
Disability Class by Sex by Age in Johnstown
Disability Class: Hearing Difficulty
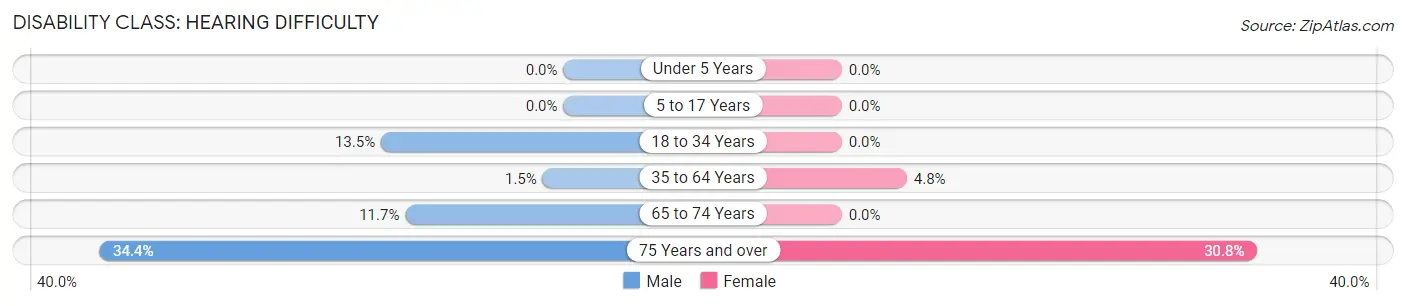
| Age Bracket | Male | Female |
| Under 5 Years | 0 (0.0%) | 0 (0.0%) |
| 5 to 17 Years | 0 (0.0%) | 0 (0.0%) |
| 18 to 34 Years | 287 (13.5%) | 0 (0.0%) |
| 35 to 64 Years | 58 (1.5%) | 153 (4.8%) |
| 65 to 74 Years | 52 (11.7%) | 0 (0.0%) |
| 75 Years and over | 108 (34.4%) | 124 (30.8%) |
Disability Class: Vision Difficulty
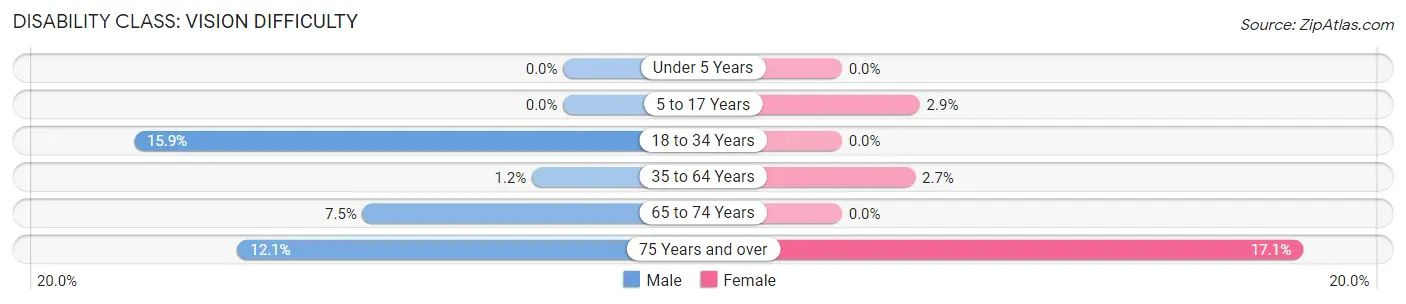
| Age Bracket | Male | Female |
| Under 5 Years | 0 (0.0%) | 0 (0.0%) |
| 5 to 17 Years | 0 (0.0%) | 35 (2.9%) |
| 18 to 34 Years | 338 (15.9%) | 0 (0.0%) |
| 35 to 64 Years | 44 (1.2%) | 86 (2.7%) |
| 65 to 74 Years | 33 (7.4%) | 0 (0.0%) |
| 75 Years and over | 38 (12.1%) | 69 (17.1%) |
Disability Class: Cognitive Difficulty
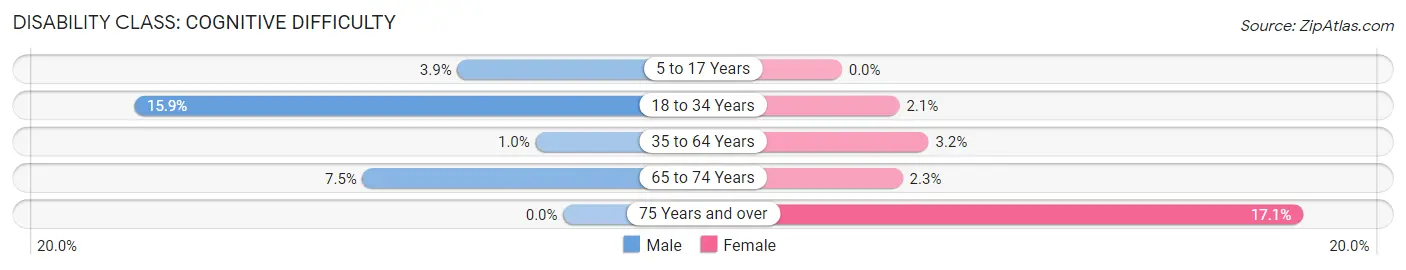
| Age Bracket | Male | Female |
| 5 to 17 Years | 72 (3.9%) | 0 (0.0%) |
| 18 to 34 Years | 338 (15.9%) | 44 (2.1%) |
| 35 to 64 Years | 39 (1.0%) | 102 (3.2%) |
| 65 to 74 Years | 33 (7.4%) | 10 (2.3%) |
| 75 Years and over | 0 (0.0%) | 69 (17.1%) |
Disability Class: Ambulatory Difficulty
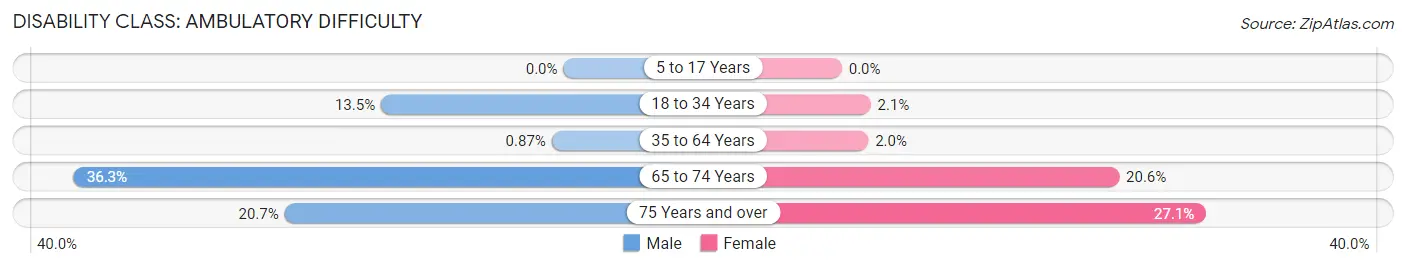
| Age Bracket | Male | Female |
| 5 to 17 Years | 0 (0.0%) | 0 (0.0%) |
| 18 to 34 Years | 287 (13.5%) | 44 (2.1%) |
| 35 to 64 Years | 33 (0.9%) | 62 (2.0%) |
| 65 to 74 Years | 161 (36.3%) | 91 (20.6%) |
| 75 Years and over | 65 (20.7%) | 109 (27.1%) |
Disability Class: Self-Care Difficulty
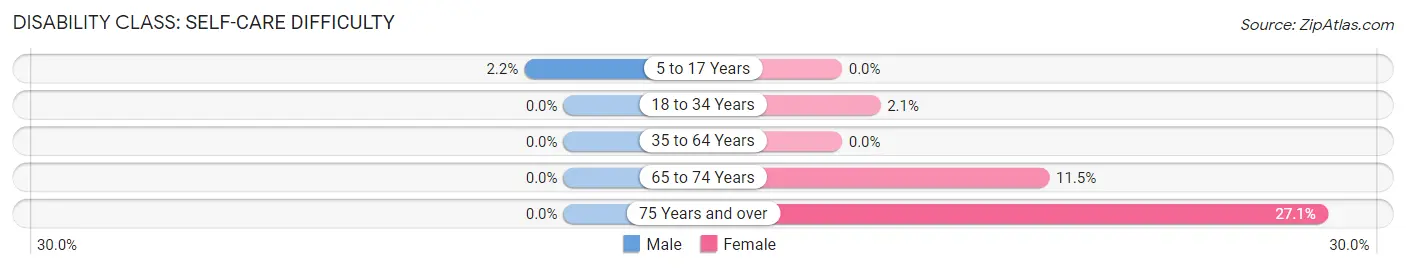
| Age Bracket | Male | Female |
| 5 to 17 Years | 40 (2.2%) | 0 (0.0%) |
| 18 to 34 Years | 0 (0.0%) | 44 (2.1%) |
| 35 to 64 Years | 0 (0.0%) | 0 (0.0%) |
| 65 to 74 Years | 0 (0.0%) | 51 (11.5%) |
| 75 Years and over | 0 (0.0%) | 109 (27.1%) |
Technology Access in Johnstown
Computing Device Access in Johnstown
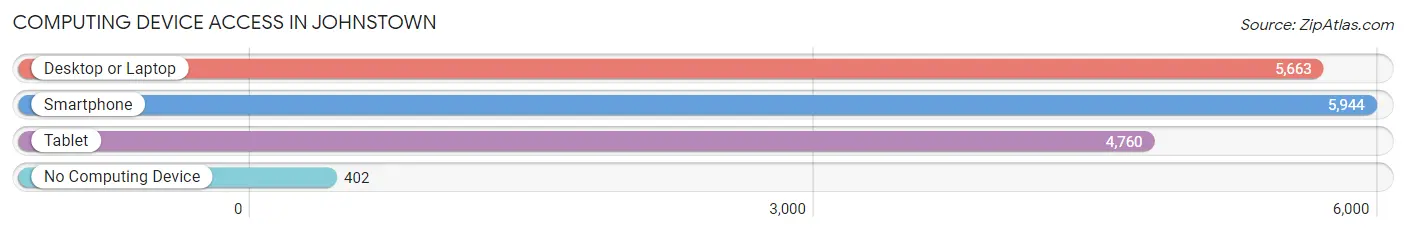
| Device Type | # Households | % Households |
| Desktop or Laptop | 5,663 | 86.8% |
| Smartphone | 5,944 | 91.1% |
| Tablet | 4,760 | 73.0% |
| No Computing Device | 402 | 6.2% |
| Total | 6,524 | 100.0% |
Internet Access in Johnstown
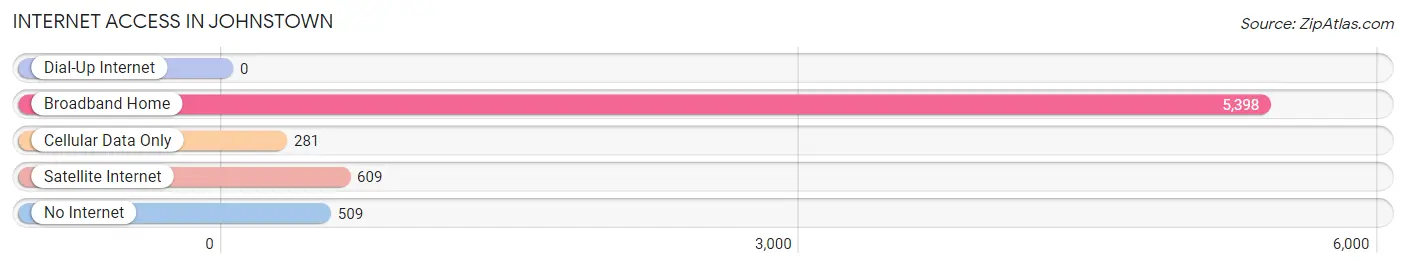
| Internet Type | # Households | % Households |
| Dial-Up Internet | 0 | 0.0% |
| Broadband Home | 5,398 | 82.7% |
| Cellular Data Only | 281 | 4.3% |
| Satellite Internet | 609 | 9.3% |
| No Internet | 509 | 7.8% |
| Total | 6,524 | 100.0% |
Johnstown Summary
Johnstown, Colorado is a small town located in Weld County, Colorado, United States. It is situated along the Big Thompson River, approximately 30 miles northeast of Denver. The town was founded in 1881 and incorporated in 1906. As of the 2010 census, the population of Johnstown was 8,744.
History
Johnstown was founded in 1881 by John Martin, a rancher from Nebraska. Martin named the town after himself and began to build a small settlement. The town was officially incorporated in 1906.
In the early 1900s, Johnstown was a thriving agricultural community. The town was home to several grain elevators, a flour mill, and a creamery. The town also had a railroad station, which allowed for the transport of goods and people.
In the 1950s, Johnstown began to experience a population boom. This was due to the construction of the Big Thompson Dam, which provided irrigation water to the area. The dam also created a recreational lake, which attracted many visitors to the area.
In the 1970s, Johnstown began to experience a decline in population. This was due to the closure of the railroad station and the decline of the agricultural industry. However, the town has since experienced a resurgence in population due to the growth of the Denver metropolitan area.
Geography
Johnstown is located in Weld County, Colorado, United States. It is situated along the Big Thompson River, approximately 30 miles northeast of Denver. The town has a total area of 4.2 square miles, all of which is land.
The town is located in the foothills of the Rocky Mountains. The elevation of Johnstown is 5,092 feet above sea level. The town is located in a semi-arid climate, with hot summers and cold winters.
Economy
Johnstown’s economy is largely based on agriculture and tourism. The town is home to several grain elevators, a flour mill, and a creamery. The town also has several restaurants, bars, and shops.
The town is also home to several manufacturing companies, including a plastics manufacturer and a metal fabrication company. The town is also home to several technology companies, including a software development company and a web design company.
The town is also home to several educational institutions, including a community college and a vocational school.
Demographics
As of the 2010 census, the population of Johnstown was 8,744. The racial makeup of the town was 87.3% White, 0.7% African American, 0.7% Native American, 0.7% Asian, 0.1% Pacific Islander, 8.7% from other races, and 2.6% from two or more races. Hispanic or Latino of any race were 16.3% of the population.
The median income for a household in Johnstown was $50,945, and the median income for a family was $60,945. The per capita income for the town was $25,945. About 8.7% of families and 11.3% of the population were below the poverty line, including 15.3% of those under age 18 and 8.7% of those age 65 or over.
Common Questions
What is Per Capita Income in Johnstown?
Per Capita income in Johnstown is $47,480.
What is the Median Family Income in Johnstown?
Median Family Income in Johnstown is $132,296.
What is the Median Household income in Johnstown?
Median Household Income in Johnstown is $120,395.
What is Income or Wage Gap in Johnstown?
Income or Wage Gap in Johnstown is 32.2%.
Women in Johnstown earn 67.8 cents for every dollar earned by a man.
What is Inequality or Gini Index in Johnstown?
Inequality or Gini Index in Johnstown is 0.39.
What is the Total Population of Johnstown?
Total Population of Johnstown is 17,327.
What is the Total Male Population of Johnstown?
Total Male Population of Johnstown is 9,586.
What is the Total Female Population of Johnstown?
Total Female Population of Johnstown is 7,741.
What is the Ratio of Males per 100 Females in Johnstown?
There are 123.83 Males per 100 Females in Johnstown.
What is the Ratio of Females per 100 Males in Johnstown?
There are 80.75 Females per 100 Males in Johnstown.
What is the Median Population Age in Johnstown?
Median Population Age in Johnstown is 35.1 Years.
What is the Average Family Size in Johnstown
Average Family Size in Johnstown is 3.1 People.
What is the Average Household Size in Johnstown
Average Household Size in Johnstown is 2.7 People.
How Large is the Labor Force in Johnstown?
There are 10,051 People in the Labor Forcein in Johnstown.
What is the Percentage of People in the Labor Force in Johnstown?
76.5% of People are in the Labor Force in Johnstown.
What is the Unemployment Rate in Johnstown?
Unemployment Rate in Johnstown is 5.4%.