Aspen Park, CO Map & Demographics
Aspen Park Map
Aspen Park Overview
$64,699
PER CAPITA INCOME
$196,563
AVG FAMILY INCOME
$111,964
AVG HOUSEHOLD INCOME
27.7%
WAGE / INCOME GAP [ % ]
72.3¢/ $1
WAGE / INCOME GAP [ $ ]
0.46
INEQUALITY / GINI INDEX
1,006
TOTAL POPULATION
506
MALE POPULATION
500
FEMALE POPULATION
101.20
MALES / 100 FEMALES
98.81
FEMALES / 100 MALES
43.9
MEDIAN AGE
3.2
AVG FAMILY SIZE
2.6
AVG HOUSEHOLD SIZE
509
LABOR FORCE [ PEOPLE ]
68.6%
PERCENT IN LABOR FORCE
Income in Aspen Park
Income Overview in Aspen Park
Per Capita Income in Aspen Park is $64,699, while median incomes of families and households are $196,563 and $111,964 respectively.
| Characteristic | Number | Measure |
| Per Capita Income | 1,006 | $64,699 |
| Median Family Income | 272 | $196,563 |
| Mean Family Income | 272 | $214,195 |
| Median Household Income | 381 | $111,964 |
| Mean Household Income | 381 | $164,927 |
| Income Deficit | 272 | $0 |
| Wage / Income Gap (%) | 1,006 | 27.67% |
| Wage / Income Gap ($) | 1,006 | 72.33¢ per $1 |
| Gini / Inequality Index | 1,006 | 0.46 |
Earnings by Sex in Aspen Park
Average Earnings in Aspen Park are $79,542, $94,559 for men and $68,393 for women, a difference of 27.7%.
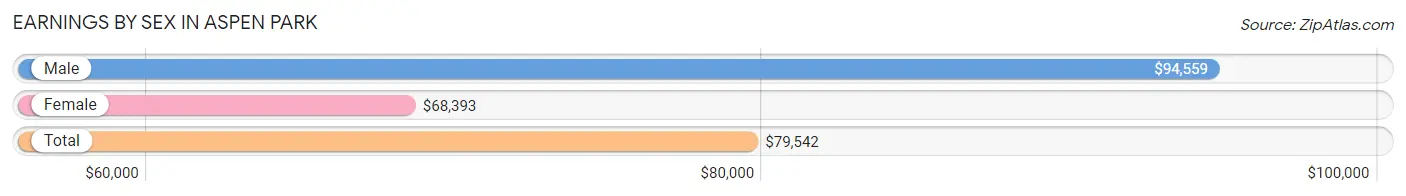
| Sex | Number | Average Earnings |
| Male | 252 (49.5%) | $94,559 |
| Female | 257 (50.5%) | $68,393 |
| Total | 509 (100.0%) | $79,542 |
Earnings by Sex by Income Bracket in Aspen Park
The most common earnings brackets in Aspen Park are $100,000+ for men (120 | 47.6%) and $75,000 to $99,999 for women (78 | 30.3%).
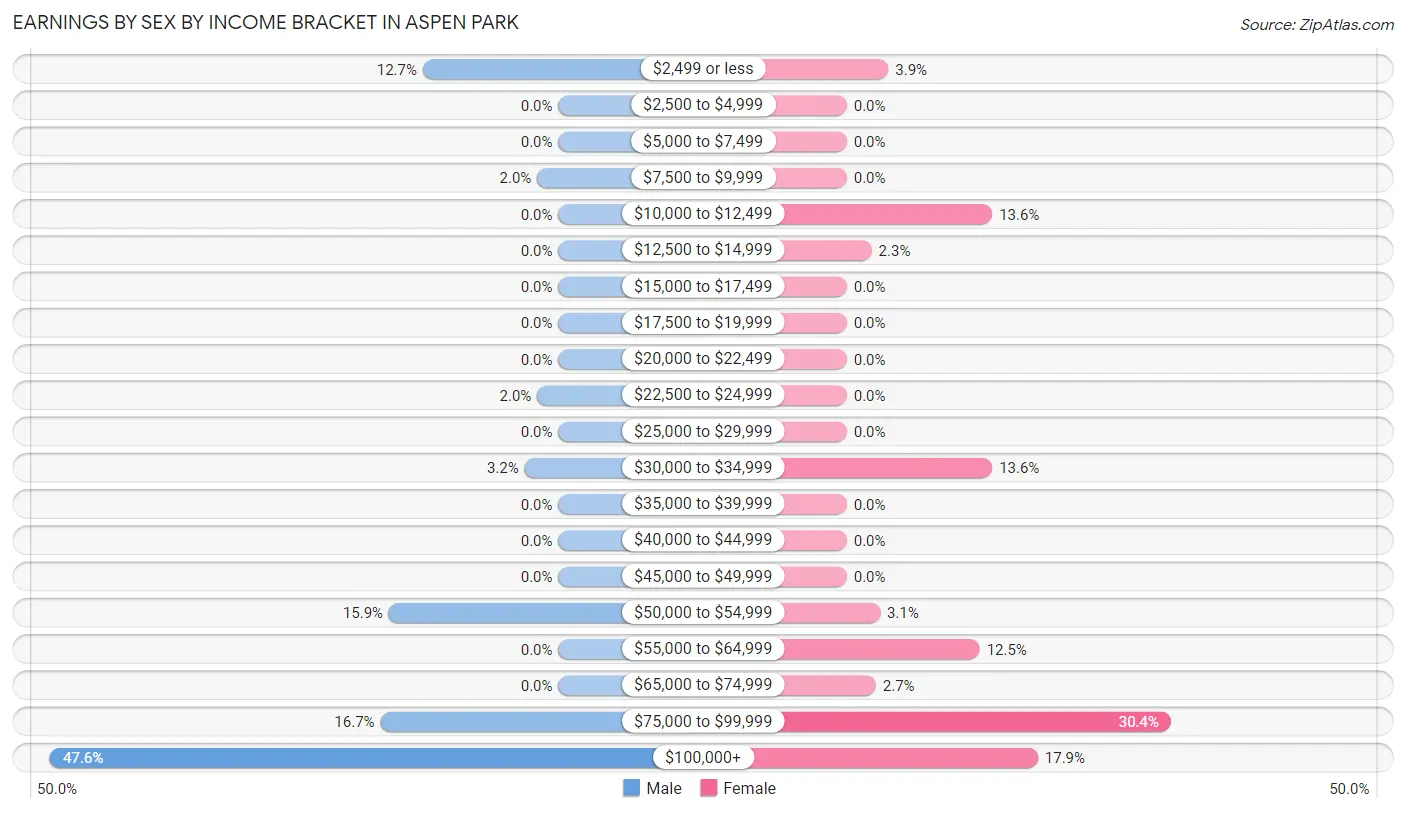
| Income | Male | Female |
| $2,499 or less | 32 (12.7%) | 10 (3.9%) |
| $2,500 to $4,999 | 0 (0.0%) | 0 (0.0%) |
| $5,000 to $7,499 | 0 (0.0%) | 0 (0.0%) |
| $7,500 to $9,999 | 5 (2.0%) | 0 (0.0%) |
| $10,000 to $12,499 | 0 (0.0%) | 35 (13.6%) |
| $12,500 to $14,999 | 0 (0.0%) | 6 (2.3%) |
| $15,000 to $17,499 | 0 (0.0%) | 0 (0.0%) |
| $17,500 to $19,999 | 0 (0.0%) | 0 (0.0%) |
| $20,000 to $22,499 | 0 (0.0%) | 0 (0.0%) |
| $22,500 to $24,999 | 5 (2.0%) | 0 (0.0%) |
| $25,000 to $29,999 | 0 (0.0%) | 0 (0.0%) |
| $30,000 to $34,999 | 8 (3.2%) | 35 (13.6%) |
| $35,000 to $39,999 | 0 (0.0%) | 0 (0.0%) |
| $40,000 to $44,999 | 0 (0.0%) | 0 (0.0%) |
| $45,000 to $49,999 | 0 (0.0%) | 0 (0.0%) |
| $50,000 to $54,999 | 40 (15.9%) | 8 (3.1%) |
| $55,000 to $64,999 | 0 (0.0%) | 32 (12.4%) |
| $65,000 to $74,999 | 0 (0.0%) | 7 (2.7%) |
| $75,000 to $99,999 | 42 (16.7%) | 78 (30.3%) |
| $100,000+ | 120 (47.6%) | 46 (17.9%) |
| Total | 252 (100.0%) | 257 (100.0%) |
Earnings by Sex by Educational Attainment in Aspen Park
Average earnings in Aspen Park are $104,063 for men and $78,417 for women, a difference of 24.6%. Men with an educational attainment of high school diploma enjoy the highest average annual earnings of $53,813, while those with high school diploma education earn the least with $53,813. Women with an educational attainment of bachelor's degree earn the most with the average annual earnings of $79,792, while those with college or associate's degree education have the smallest earnings of $58,047.
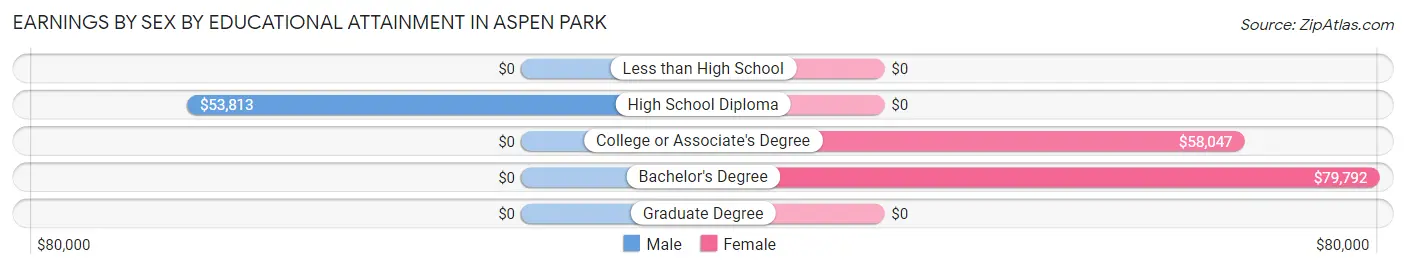
| Educational Attainment | Male Income | Female Income |
| Less than High School | - | - |
| High School Diploma | $53,813 | $0 |
| College or Associate's Degree | - | - |
| Bachelor's Degree | - | - |
| Graduate Degree | - | - |
| Total | $104,063 | $78,417 |
Family Income in Aspen Park
Family Income Brackets in Aspen Park
According to the Aspen Park family income data, there are 123 families falling into the $200,000+ income range, which is the most common income bracket and makes up 45.2% of all families.
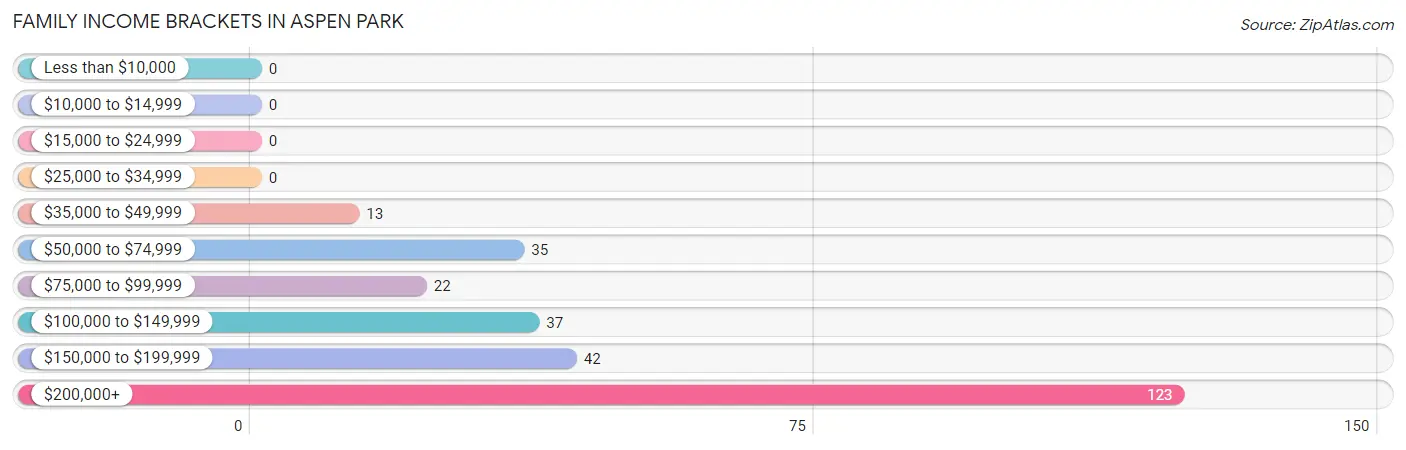
| Income Bracket | # Families | % Families |
| Less than $10,000 | 0 | 0.0% |
| $10,000 to $14,999 | 0 | 0.0% |
| $15,000 to $24,999 | 0 | 0.0% |
| $25,000 to $34,999 | 0 | 0.0% |
| $35,000 to $49,999 | 13 | 4.8% |
| $50,000 to $74,999 | 35 | 12.9% |
| $75,000 to $99,999 | 22 | 8.1% |
| $100,000 to $149,999 | 37 | 13.6% |
| $150,000 to $199,999 | 42 | 15.4% |
| $200,000+ | 123 | 45.2% |
Family Income by Famaliy Size in Aspen Park
4-person families (109 | 40.1%) account for the highest median family income in Aspen Park with $220,898 per family, while 4-person families (109 | 40.1%) have the highest median income of $55,224 per family member.
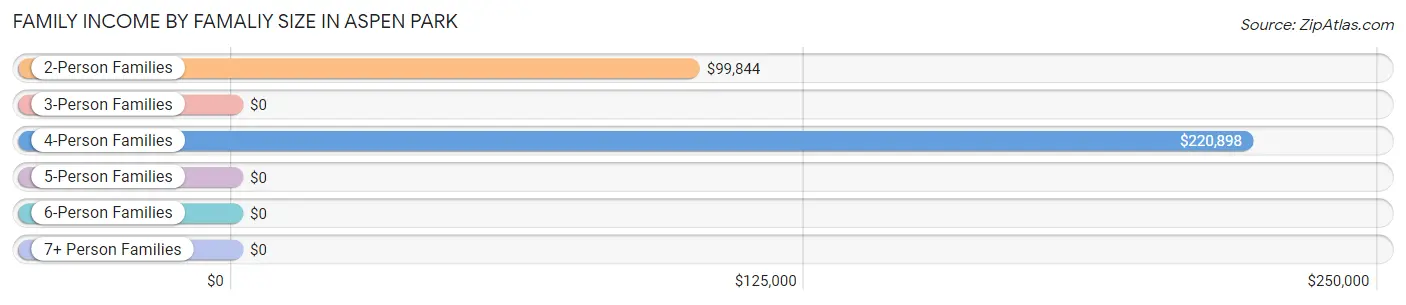
| Income Bracket | # Families | Median Income |
| 2-Person Families | 127 (46.7%) | $99,844 |
| 3-Person Families | 11 (4.0%) | $0 |
| 4-Person Families | 109 (40.1%) | $220,898 |
| 5-Person Families | 25 (9.2%) | $0 |
| 6-Person Families | 0 (0.0%) | $0 |
| 7+ Person Families | 0 (0.0%) | $0 |
| Total | 272 (100.0%) | $196,563 |
Family Income by Number of Earners in Aspen Park
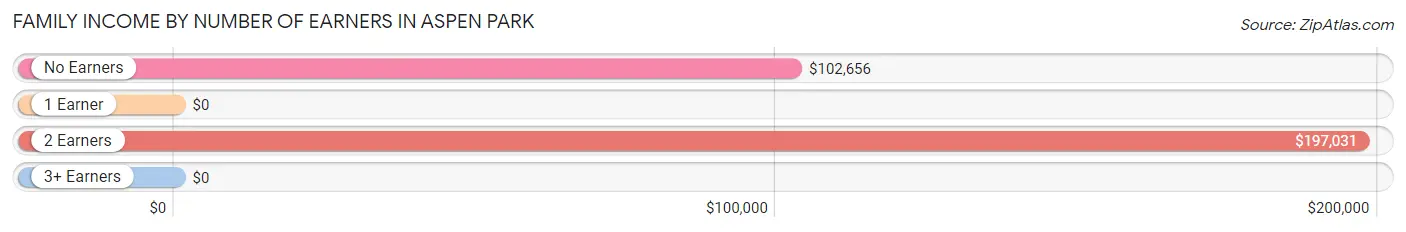
| Number of Earners | # Families | Median Income |
| No Earners | 43 (15.8%) | $102,656 |
| 1 Earner | 55 (20.2%) | $0 |
| 2 Earners | 132 (48.5%) | $197,031 |
| 3+ Earners | 42 (15.4%) | $0 |
| Total | 272 (100.0%) | $196,563 |
Household Income in Aspen Park
Household Income Brackets in Aspen Park
With 123 households falling in the category, the $200,000+ income range is the most frequent in Aspen Park, accounting for 32.3% of all households.
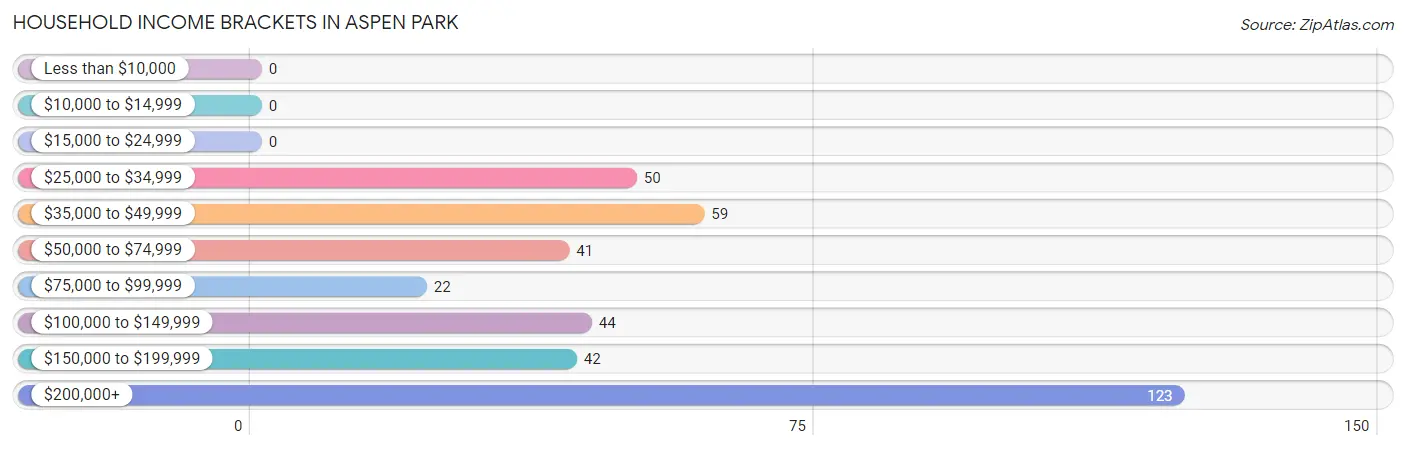
| Income Bracket | # Households | % Households |
| Less than $10,000 | 0 | 0.0% |
| $10,000 to $14,999 | 0 | 0.0% |
| $15,000 to $24,999 | 0 | 0.0% |
| $25,000 to $34,999 | 50 | 13.1% |
| $35,000 to $49,999 | 59 | 15.5% |
| $50,000 to $74,999 | 41 | 10.8% |
| $75,000 to $99,999 | 22 | 5.8% |
| $100,000 to $149,999 | 44 | 11.5% |
| $150,000 to $199,999 | 42 | 11.0% |
| $200,000+ | 123 | 32.3% |
Household Income by Householder Age in Aspen Park
The median household income in Aspen Park is $111,964, with the highest median household income of $250,001 found in the 25 to 44 years age bracket for the primary householder. A total of 58 households (15.2%) fall into this category. Meanwhile, the 15 to 24 years age bracket for the primary householder has the lowest median household income of $0, with 35 households (9.2%) in this group.
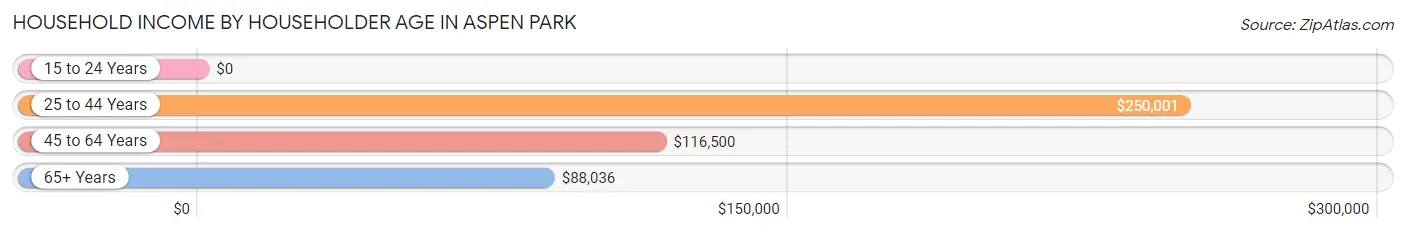
| Income Bracket | # Households | Median Income |
| 15 to 24 Years | 35 (9.2%) | $0 |
| 25 to 44 Years | 58 (15.2%) | $250,001 |
| 45 to 64 Years | 236 (61.9%) | $116,500 |
| 65+ Years | 52 (13.7%) | $88,036 |
| Total | 381 (100.0%) | $111,964 |
Poverty in Aspen Park
Income Below Poverty by Sex and Age in Aspen Park
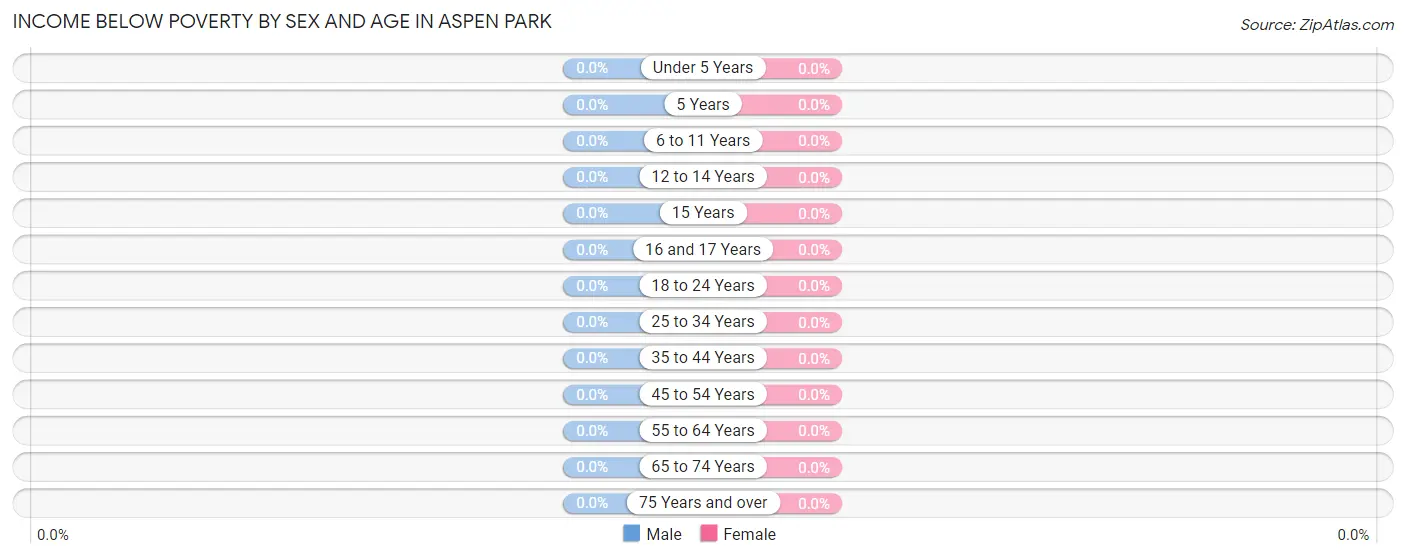
| Age Bracket | Male | Female |
| Under 5 Years | 0 (0.0%) | 0 (0.0%) |
| 5 Years | 0 (0.0%) | 0 (0.0%) |
| 6 to 11 Years | 0 (0.0%) | 0 (0.0%) |
| 12 to 14 Years | 0 (0.0%) | 0 (0.0%) |
| 15 Years | 0 (0.0%) | 0 (0.0%) |
| 16 and 17 Years | 0 (0.0%) | 0 (0.0%) |
| 18 to 24 Years | 0 (0.0%) | 0 (0.0%) |
| 25 to 34 Years | 0 (0.0%) | 0 (0.0%) |
| 35 to 44 Years | 0 (0.0%) | 0 (0.0%) |
| 45 to 54 Years | 0 (0.0%) | 0 (0.0%) |
| 55 to 64 Years | 0 (0.0%) | 0 (0.0%) |
| 65 to 74 Years | 0 (0.0%) | 0 (0.0%) |
| 75 Years and over | 0 (0.0%) | 0 (0.0%) |
| Total | 0 (0.0%) | 0 (0.0%) |
Income Above Poverty by Sex and Age in Aspen Park
According to the poverty statistics in Aspen Park, males aged under 5 years and females aged under 5 years are the age groups that are most secure financially, with 100.0% of males and 100.0% of females in these age groups living above the poverty line.
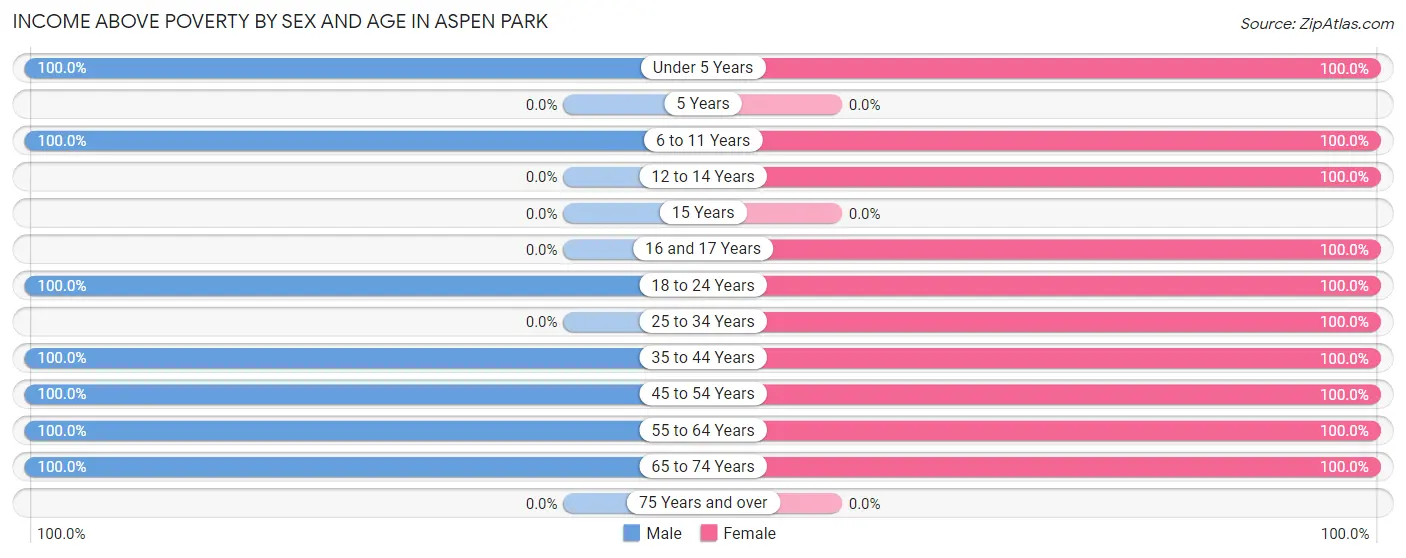
| Age Bracket | Male | Female |
| Under 5 Years | 119 (100.0%) | 29 (100.0%) |
| 5 Years | 0 (0.0%) | 0 (0.0%) |
| 6 to 11 Years | 53 (100.0%) | 21 (100.0%) |
| 12 to 14 Years | 0 (0.0%) | 42 (100.0%) |
| 15 Years | 0 (0.0%) | 0 (0.0%) |
| 16 and 17 Years | 0 (0.0%) | 23 (100.0%) |
| 18 to 24 Years | 32 (100.0%) | 35 (100.0%) |
| 25 to 34 Years | 0 (0.0%) | 50 (100.0%) |
| 35 to 44 Years | 58 (100.0%) | 51 (100.0%) |
| 45 to 54 Years | 70 (100.0%) | 92 (100.0%) |
| 55 to 64 Years | 106 (100.0%) | 131 (100.0%) |
| 65 to 74 Years | 68 (100.0%) | 26 (100.0%) |
| 75 Years and over | 0 (0.0%) | 0 (0.0%) |
| Total | 506 (100.0%) | 500 (100.0%) |
Income Below Poverty Among Married-Couple Families in Aspen Park
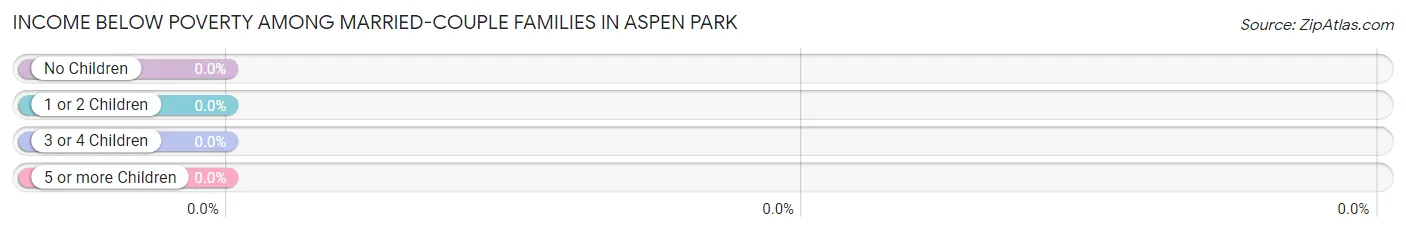
| Children | Above Poverty | Below Poverty |
| No Children | 76 (100.0%) | 0 (0.0%) |
| 1 or 2 Children | 139 (100.0%) | 0 (0.0%) |
| 3 or 4 Children | 0 (0.0%) | 0 (0.0%) |
| 5 or more Children | 0 (0.0%) | 0 (0.0%) |
| Total | 215 (100.0%) | 0 (0.0%) |
Income Below Poverty Among Single-Parent Households in Aspen Park
| Children | Single Father | Single Mother |
| No Children | 0 (0.0%) | 0 (0.0%) |
| 1 or 2 Children | 0 (0.0%) | 0 (0.0%) |
| 3 or 4 Children | 0 (0.0%) | 0 (0.0%) |
| 5 or more Children | 0 (0.0%) | 0 (0.0%) |
| Total | 0 (0.0%) | 0 (0.0%) |
Income Below Poverty Among Married-Couple vs Single-Parent Households in Aspen Park
| Children | Married-Couple Families | Single-Parent Households |
| No Children | 0 (0.0%) | 0 (0.0%) |
| 1 or 2 Children | 0 (0.0%) | 0 (0.0%) |
| 3 or 4 Children | 0 (0.0%) | 0 (0.0%) |
| 5 or more Children | 0 (0.0%) | 0 (0.0%) |
| Total | 0 (0.0%) | 0 (0.0%) |
Race in Aspen Park
The most populous races in Aspen Park are White / Caucasian (934 | 92.8%), Hispanic or Latino (119 | 11.8%), and Some other Race (35 | 3.5%).
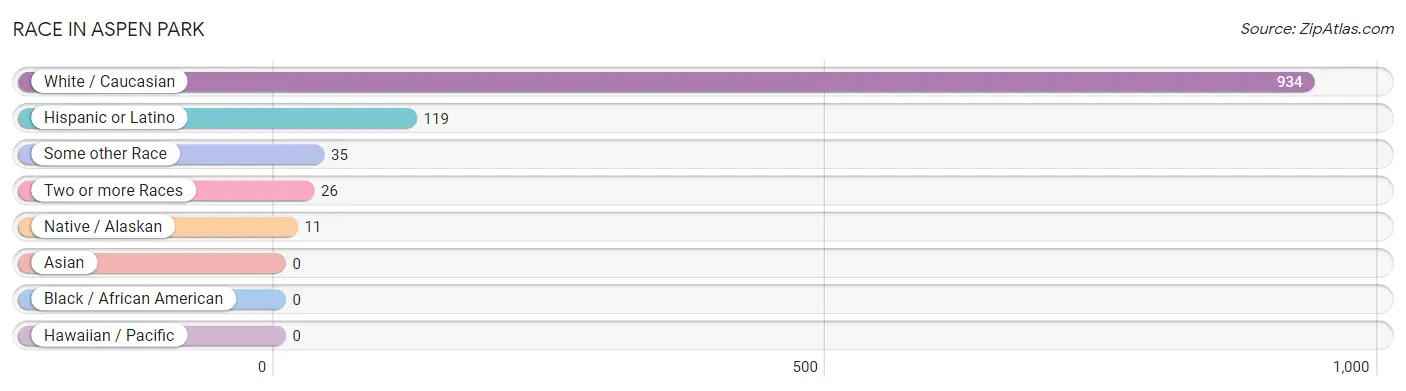
| Race | # Population | % Population |
| Asian | 0 | 0.0% |
| Black / African American | 0 | 0.0% |
| Hawaiian / Pacific | 0 | 0.0% |
| Hispanic or Latino | 119 | 11.8% |
| Native / Alaskan | 11 | 1.1% |
| White / Caucasian | 934 | 92.8% |
| Two or more Races | 26 | 2.6% |
| Some other Race | 35 | 3.5% |
| Total | 1,006 | 100.0% |
Ancestry in Aspen Park
The most populous ancestries reported in Aspen Park are German (411 | 40.8%), English (208 | 20.7%), Irish (128 | 12.7%), Mexican (112 | 11.1%), and Czech (75 | 7.5%), together accounting for 92.8% of all Aspen Park residents.
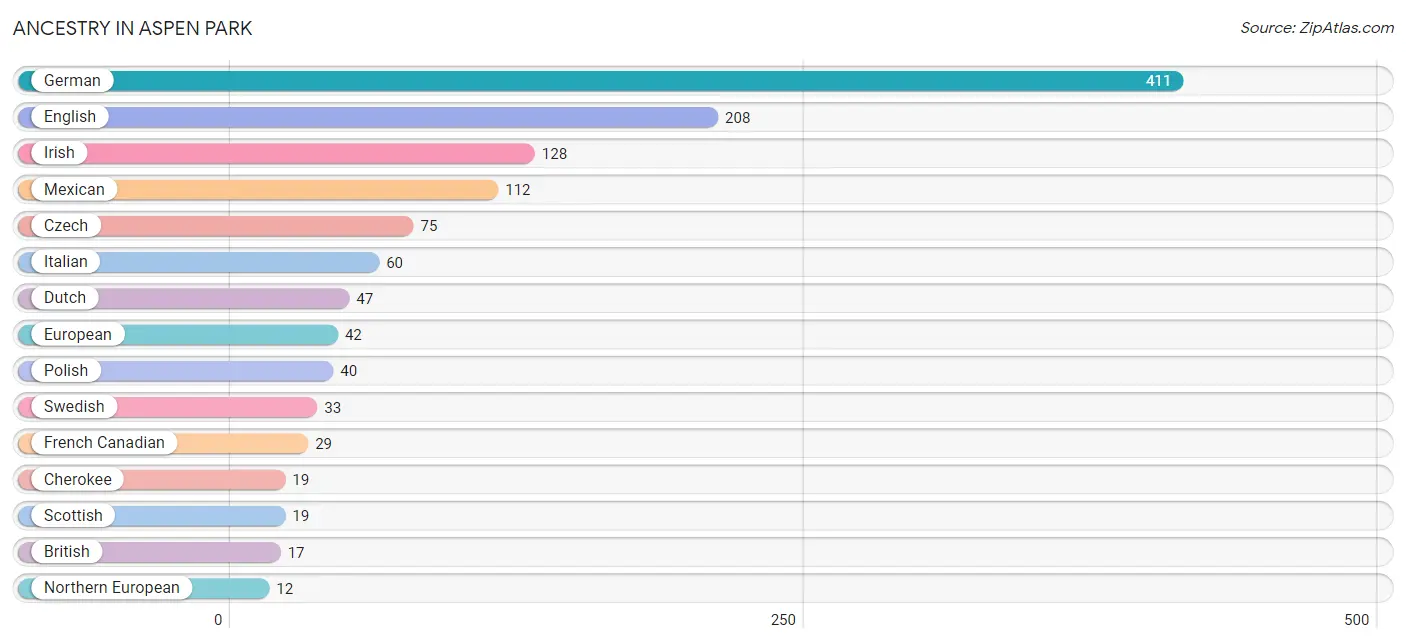
| Ancestry | # Population | % Population |
| American | 9 | 0.9% |
| British | 17 | 1.7% |
| Cherokee | 19 | 1.9% |
| Czech | 75 | 7.5% |
| Danish | 7 | 0.7% |
| Dutch | 47 | 4.7% |
| English | 208 | 20.7% |
| European | 42 | 4.2% |
| French Canadian | 29 | 2.9% |
| German | 411 | 40.8% |
| Irish | 128 | 12.7% |
| Italian | 60 | 6.0% |
| Mexican | 112 | 11.1% |
| Northern European | 12 | 1.2% |
| Polish | 40 | 4.0% |
| Scotch-Irish | 8 | 0.8% |
| Scottish | 19 | 1.9% |
| Spanish | 7 | 0.7% |
| Swedish | 33 | 3.3% |
| Welsh | 12 | 1.2% | View All 20 Rows |
Immigrants in Aspen Park
The most numerous immigrant groups reported in Aspen Park came from Europe (30 | 3.0%), Western Europe (24 | 2.4%), Germany (14 | 1.4%), Netherlands (10 | 1.0%), and Central America (7 | 0.7%), together accounting for 8.5% of all Aspen Park residents.
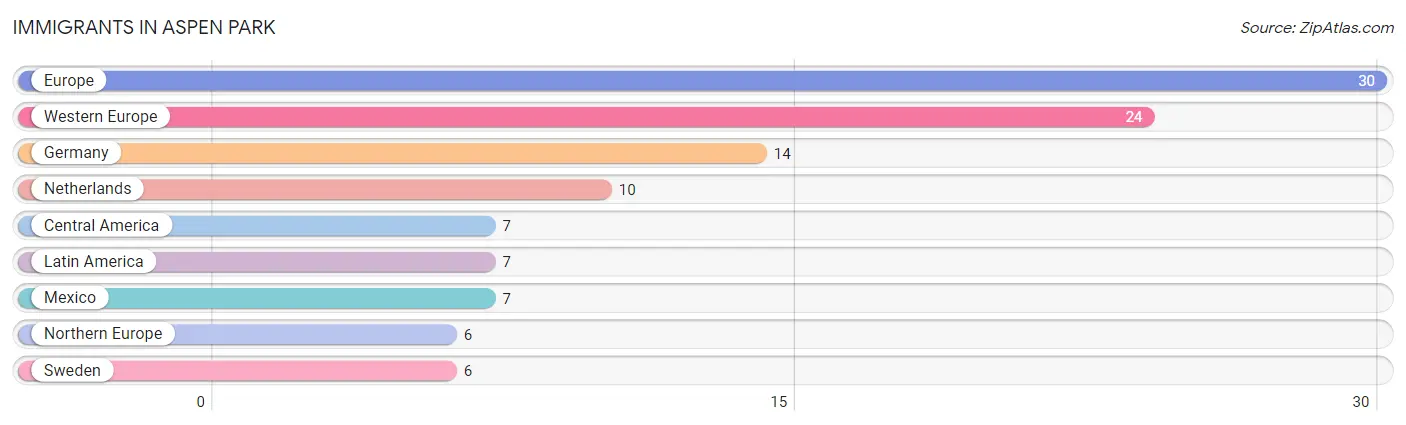
| Immigration Origin | # Population | % Population |
| Central America | 7 | 0.7% |
| Europe | 30 | 3.0% |
| Germany | 14 | 1.4% |
| Latin America | 7 | 0.7% |
| Mexico | 7 | 0.7% |
| Netherlands | 10 | 1.0% |
| Northern Europe | 6 | 0.6% |
| Sweden | 6 | 0.6% |
| Western Europe | 24 | 2.4% | View All 9 Rows |
Sex and Age in Aspen Park
Sex and Age in Aspen Park
The most populous age groups in Aspen Park are Under 5 Years (119 | 23.5%) for men and 60 to 64 Years (109 | 21.8%) for women.
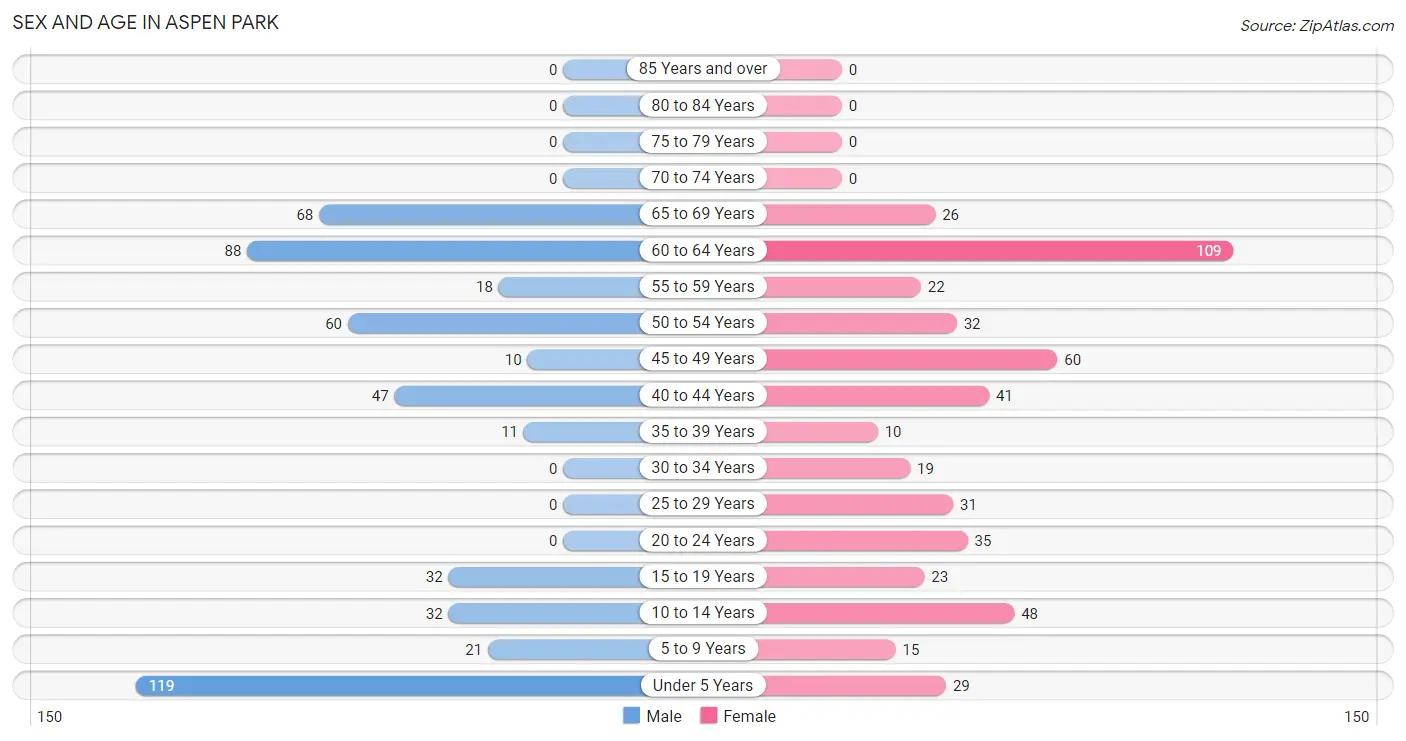
| Age Bracket | Male | Female |
| Under 5 Years | 119 (23.5%) | 29 (5.8%) |
| 5 to 9 Years | 21 (4.2%) | 15 (3.0%) |
| 10 to 14 Years | 32 (6.3%) | 48 (9.6%) |
| 15 to 19 Years | 32 (6.3%) | 23 (4.6%) |
| 20 to 24 Years | 0 (0.0%) | 35 (7.0%) |
| 25 to 29 Years | 0 (0.0%) | 31 (6.2%) |
| 30 to 34 Years | 0 (0.0%) | 19 (3.8%) |
| 35 to 39 Years | 11 (2.2%) | 10 (2.0%) |
| 40 to 44 Years | 47 (9.3%) | 41 (8.2%) |
| 45 to 49 Years | 10 (2.0%) | 60 (12.0%) |
| 50 to 54 Years | 60 (11.9%) | 32 (6.4%) |
| 55 to 59 Years | 18 (3.6%) | 22 (4.4%) |
| 60 to 64 Years | 88 (17.4%) | 109 (21.8%) |
| 65 to 69 Years | 68 (13.4%) | 26 (5.2%) |
| 70 to 74 Years | 0 (0.0%) | 0 (0.0%) |
| 75 to 79 Years | 0 (0.0%) | 0 (0.0%) |
| 80 to 84 Years | 0 (0.0%) | 0 (0.0%) |
| 85 Years and over | 0 (0.0%) | 0 (0.0%) |
| Total | 506 (100.0%) | 500 (100.0%) |
Families and Households in Aspen Park
Median Family Size in Aspen Park
The median family size in Aspen Park is 3.24 persons per family, with married-couple families (215 | 79.0%) accounting for the largest median family size of 3.49 persons per family. On the other hand, single male/father families (6 | 2.2%) represent the smallest median family size with 2.00 persons per family.
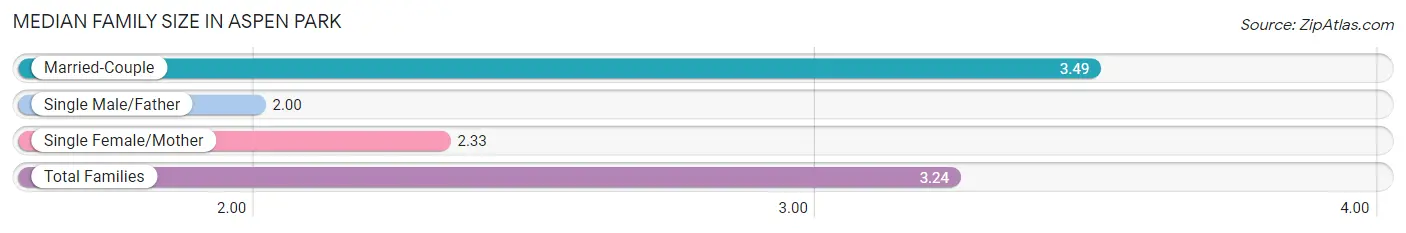
| Family Type | # Families | Family Size |
| Married-Couple | 215 (79.0%) | 3.49 |
| Single Male/Father | 6 (2.2%) | 2.00 |
| Single Female/Mother | 51 (18.8%) | 2.33 |
| Total Families | 272 (100.0%) | 3.24 |
Median Household Size in Aspen Park
The median household size in Aspen Park is 2.64 persons per household, with married-couple households (215 | 56.4%) accounting for the largest median household size of 3.49 persons per household. non-family households (109 | 28.6%) represent the smallest median household size with 1.14 persons per household.
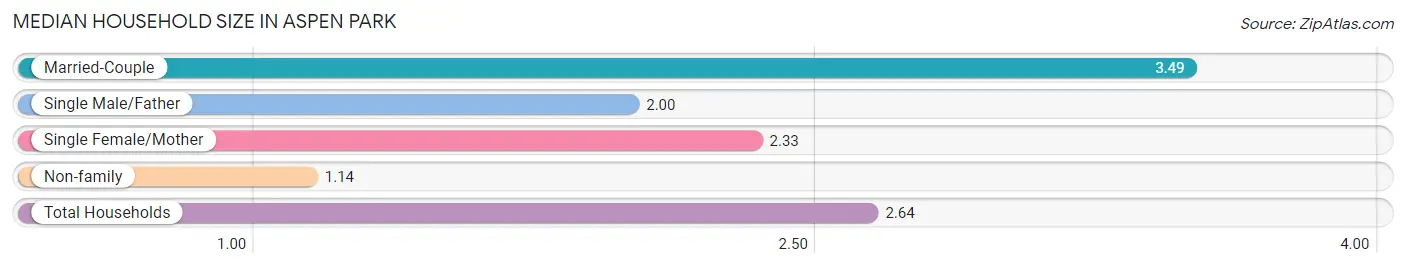
| Household Type | # Households | Household Size |
| Married-Couple | 215 (56.4%) | 3.49 |
| Single Male/Father | 6 (1.6%) | 2.00 |
| Single Female/Mother | 51 (13.4%) | 2.33 |
| Non-family | 109 (28.6%) | 1.14 |
| Total Households | 381 (100.0%) | 2.64 |
Household Size by Marriage Status in Aspen Park
Out of a total of 381 households in Aspen Park, 272 (71.4%) are family households, while 109 (28.6%) are nonfamily households. The most numerous type of family households are 2-person households, comprising 127, and the most common type of nonfamily households are 1-person households, comprising 95.
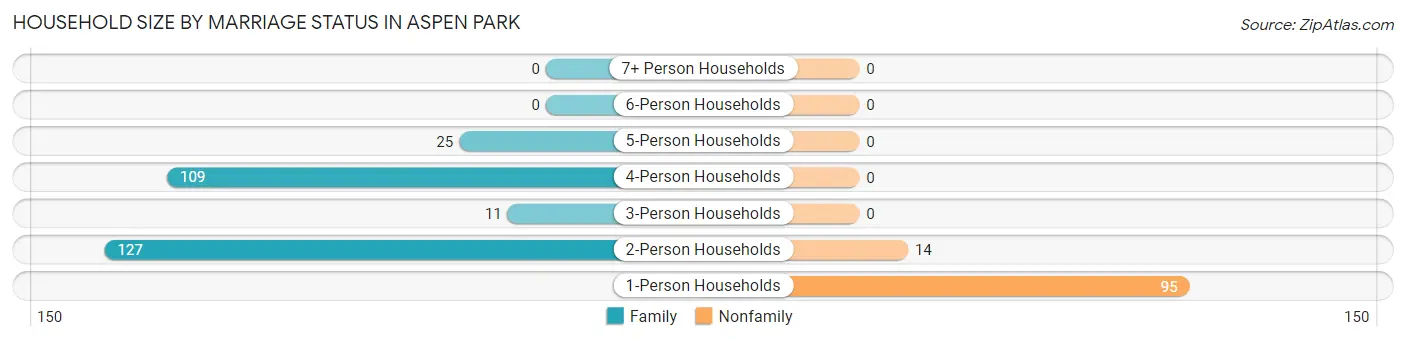
| Household Size | Family Households | Nonfamily Households |
| 1-Person Households | - | 95 (24.9%) |
| 2-Person Households | 127 (33.3%) | 14 (3.7%) |
| 3-Person Households | 11 (2.9%) | 0 (0.0%) |
| 4-Person Households | 109 (28.6%) | 0 (0.0%) |
| 5-Person Households | 25 (6.6%) | 0 (0.0%) |
| 6-Person Households | 0 (0.0%) | 0 (0.0%) |
| 7+ Person Households | 0 (0.0%) | 0 (0.0%) |
| Total | 272 (71.4%) | 109 (28.6%) |
Female Fertility in Aspen Park
Fertility by Age in Aspen Park
| Age Bracket | Women with Births | Births / 1,000 Women |
| 15 to 19 years | 0 (0.0%) | 0.0 |
| 20 to 34 years | 0 (0.0%) | 0.0 |
| 35 to 50 years | 0 (0.0%) | 0.0 |
| Total | 0 (0.0%) | 0.0 |
Fertility by Age by Marriage Status in Aspen Park
| Age Bracket | Married | Unmarried |
| 15 to 19 years | 0 (0.0%) | 0 (0.0%) |
| 20 to 34 years | 0 (0.0%) | 0 (0.0%) |
| 35 to 50 years | 0 (0.0%) | 0 (0.0%) |
| Total | 0 (0.0%) | 0 (0.0%) |
Fertility by Education in Aspen Park
| Educational Attainment | Women with Births | Births / 1,000 Women |
| Less than High School | 0 (0.0%) | 0.0 |
| High School Diploma | 0 (0.0%) | 0.0 |
| College or Associate's Degree | 0 (0.0%) | 0.0 |
| Bachelor's Degree | 0 (0.0%) | 0.0 |
| Graduate Degree | 0 (0.0%) | 0.0 |
| Total | 0 (0.0%) | 0.0 |
Fertility by Education by Marriage Status in Aspen Park
| Educational Attainment | Married | Unmarried |
| Less than High School | 0 (0.0%) | 0 (0.0%) |
| High School Diploma | 0 (0.0%) | 0 (0.0%) |
| College or Associate's Degree | 0 (0.0%) | 0 (0.0%) |
| Bachelor's Degree | 0 (0.0%) | 0 (0.0%) |
| Graduate Degree | 0 (0.0%) | 0 (0.0%) |
| Total | 0 (0.0%) | 0 (0.0%) |
Employment Characteristics in Aspen Park
Employment by Class of Employer in Aspen Park
Among the 509 employed individuals in Aspen Park, private company employees (223 | 43.8%), self-employed (incorporated) (105 | 20.6%), and not-for-profit organizations (101 | 19.8%) make up the most common classes of employment.
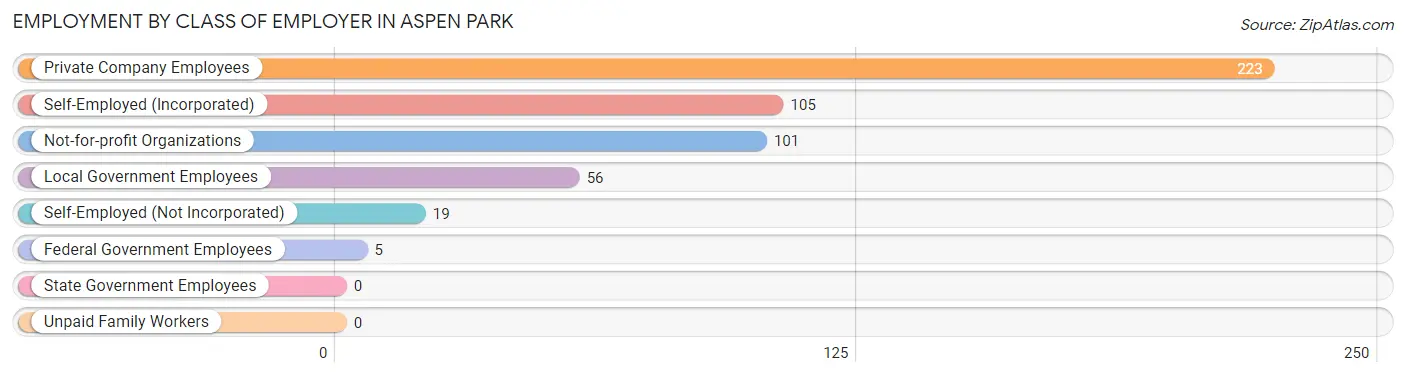
| Employer Class | # Employees | % Employees |
| Private Company Employees | 223 | 43.8% |
| Self-Employed (Incorporated) | 105 | 20.6% |
| Self-Employed (Not Incorporated) | 19 | 3.7% |
| Not-for-profit Organizations | 101 | 19.8% |
| Local Government Employees | 56 | 11.0% |
| State Government Employees | 0 | 0.0% |
| Federal Government Employees | 5 | 1.0% |
| Unpaid Family Workers | 0 | 0.0% |
| Total | 509 | 100.0% |
Employment Status by Age in Aspen Park
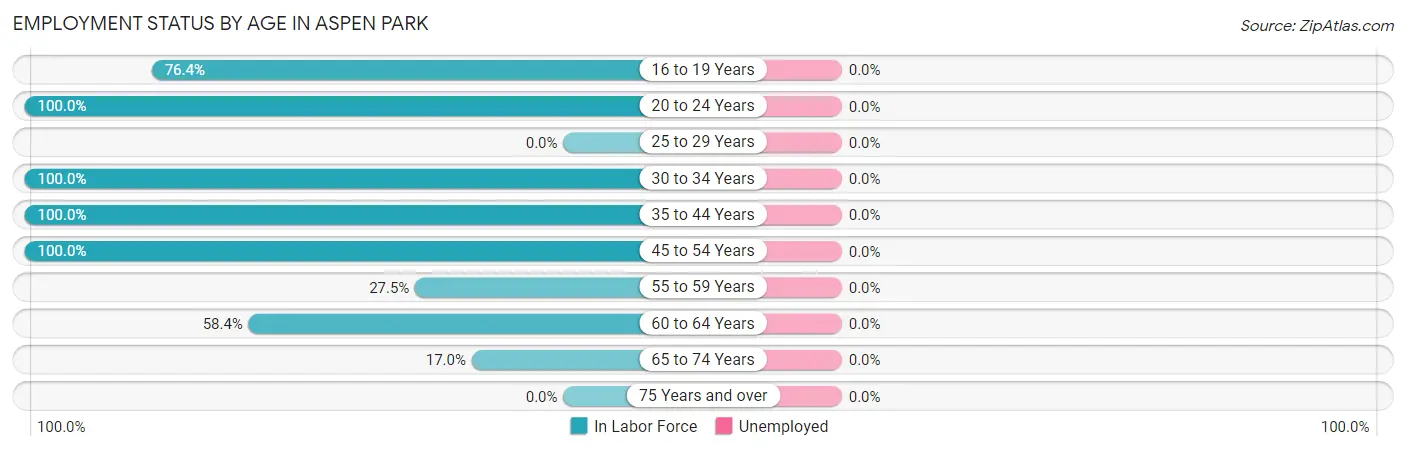
| Age Bracket | In Labor Force | Unemployed |
| 16 to 19 Years | 42 (76.4%) | 0 (0.0%) |
| 20 to 24 Years | 35 (100.0%) | 0 (0.0%) |
| 25 to 29 Years | 0 (0.0%) | 0 (0.0%) |
| 30 to 34 Years | 19 (100.0%) | 0 (0.0%) |
| 35 to 44 Years | 109 (100.0%) | 0 (0.0%) |
| 45 to 54 Years | 162 (100.0%) | 0 (0.0%) |
| 55 to 59 Years | 11 (27.5%) | 0 (0.0%) |
| 60 to 64 Years | 115 (58.4%) | 0 (0.0%) |
| 65 to 74 Years | 16 (17.0%) | 0 (0.0%) |
| 75 Years and over | 0 (0.0%) | 0 (0.0%) |
| Total | 509 (68.6%) | 0 (0.0%) |
Employment Status by Educational Attainment in Aspen Park
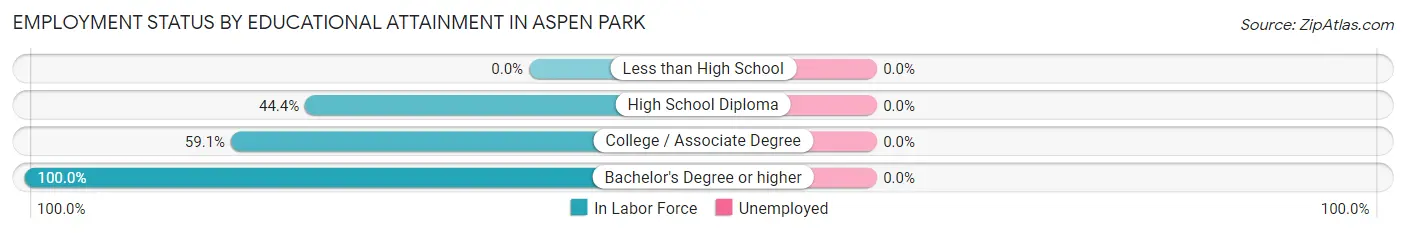
| Educational Attainment | In Labor Force | Unemployed |
| Less than High School | 0 (0.0%) | 0 (0.0%) |
| High School Diploma | 60 (44.4%) | 0 (0.0%) |
| College / Associate Degree | 97 (59.1%) | 0 (0.0%) |
| Bachelor's Degree or higher | 259 (100.0%) | 0 (0.0%) |
| Total | 416 (74.6%) | 0 (0.0%) |
Employment Occupations by Sex in Aspen Park
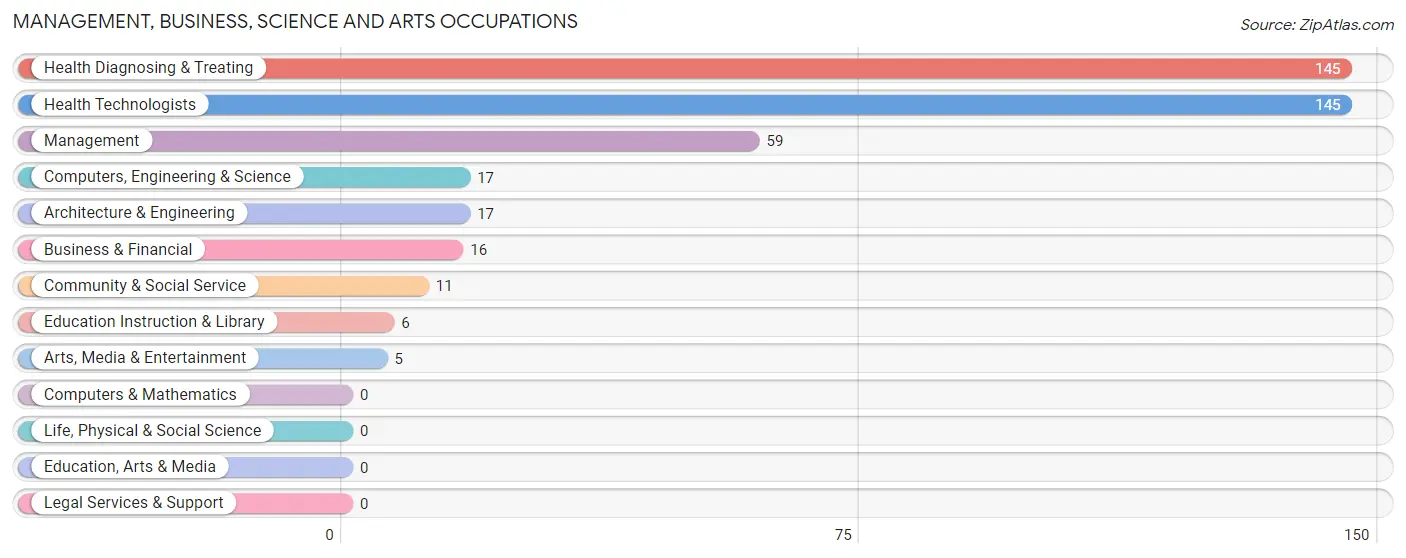
Management, Business, Science and Arts Occupations
The most common Management, Business, Science and Arts occupations in Aspen Park are Health Diagnosing & Treating (145 | 28.5%), Health Technologists (145 | 28.5%), Management (59 | 11.6%), Computers, Engineering & Science (17 | 3.3%), and Architecture & Engineering (17 | 3.3%).
Management, Business, Science and Arts Occupations by Sex
Within the Management, Business, Science and Arts occupations in Aspen Park, the most male-oriented occupations are Management (100.0%), Business & Financial (100.0%), and Arts, Media & Entertainment (100.0%), while the most female-oriented occupations are Education Instruction & Library (100.0%), Health Diagnosing & Treating (65.5%), and Health Technologists (65.5%).
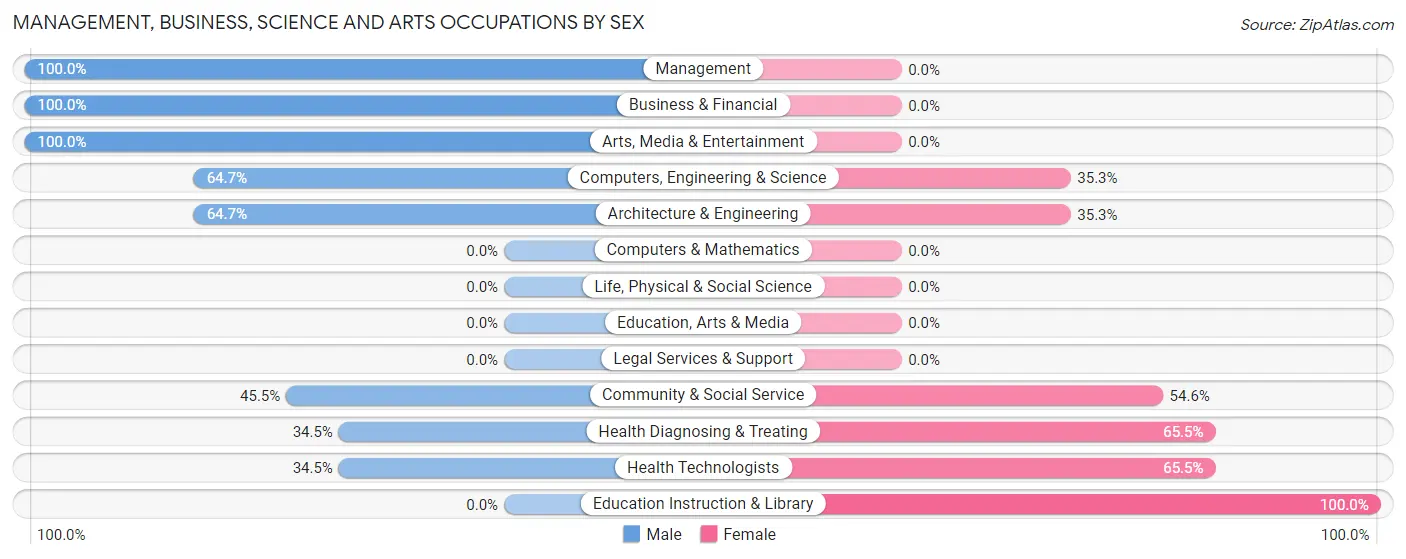
| Occupation | Male | Female |
| Management | 59 (100.0%) | 0 (0.0%) |
| Business & Financial | 16 (100.0%) | 0 (0.0%) |
| Computers, Engineering & Science | 11 (64.7%) | 6 (35.3%) |
| Computers & Mathematics | 0 (0.0%) | 0 (0.0%) |
| Architecture & Engineering | 11 (64.7%) | 6 (35.3%) |
| Life, Physical & Social Science | 0 (0.0%) | 0 (0.0%) |
| Community & Social Service | 5 (45.5%) | 6 (54.5%) |
| Education, Arts & Media | 0 (0.0%) | 0 (0.0%) |
| Legal Services & Support | 0 (0.0%) | 0 (0.0%) |
| Education Instruction & Library | 0 (0.0%) | 6 (100.0%) |
| Arts, Media & Entertainment | 5 (100.0%) | 0 (0.0%) |
| Health Diagnosing & Treating | 50 (34.5%) | 95 (65.5%) |
| Health Technologists | 50 (34.5%) | 95 (65.5%) |
| Total (Category) | 141 (56.9%) | 107 (43.1%) |
| Total (Overall) | 252 (49.5%) | 257 (50.5%) |
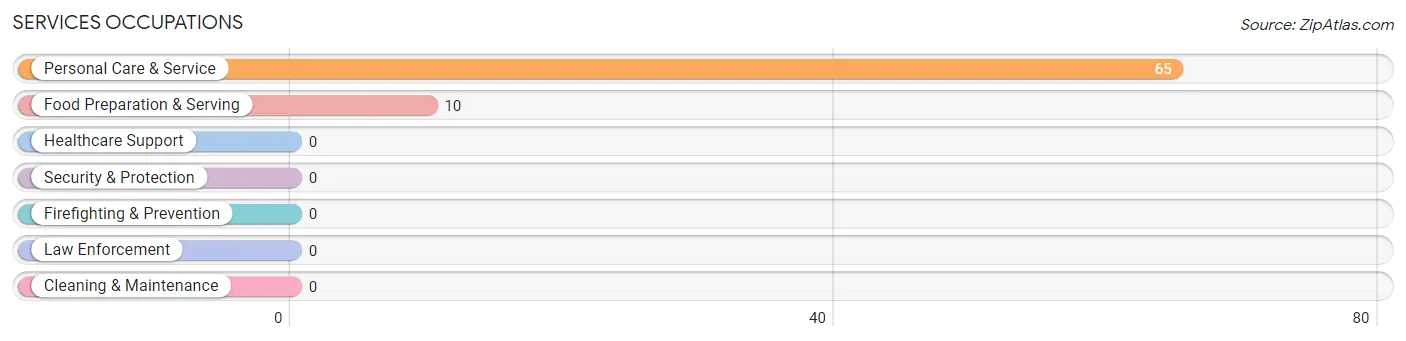
Services Occupations
The most common Services occupations in Aspen Park are Personal Care & Service (65 | 12.8%), and Food Preparation & Serving (10 | 2.0%).
Services Occupations by Sex
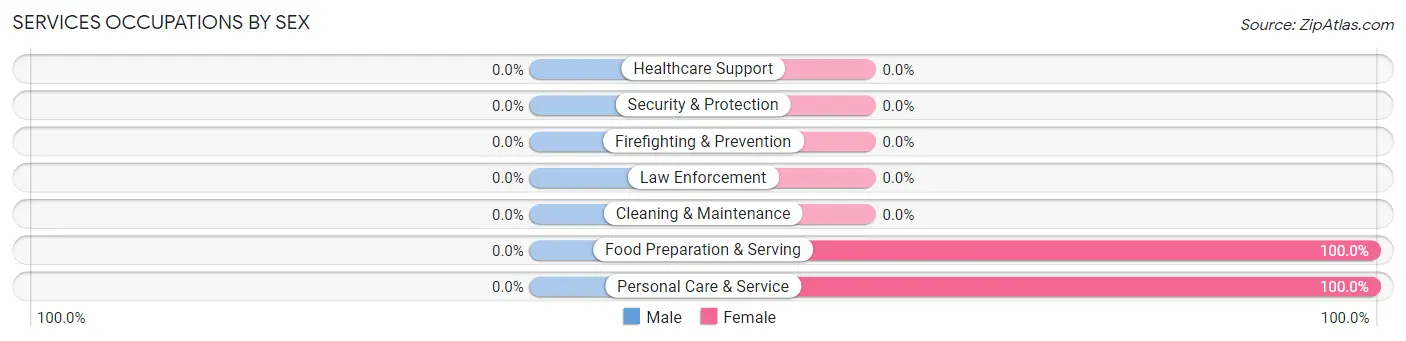
| Occupation | Male | Female |
| Healthcare Support | 0 (0.0%) | 0 (0.0%) |
| Security & Protection | 0 (0.0%) | 0 (0.0%) |
| Firefighting & Prevention | 0 (0.0%) | 0 (0.0%) |
| Law Enforcement | 0 (0.0%) | 0 (0.0%) |
| Food Preparation & Serving | 0 (0.0%) | 10 (100.0%) |
| Cleaning & Maintenance | 0 (0.0%) | 0 (0.0%) |
| Personal Care & Service | 0 (0.0%) | 65 (100.0%) |
| Total (Category) | 0 (0.0%) | 75 (100.0%) |
| Total (Overall) | 252 (49.5%) | 257 (50.5%) |
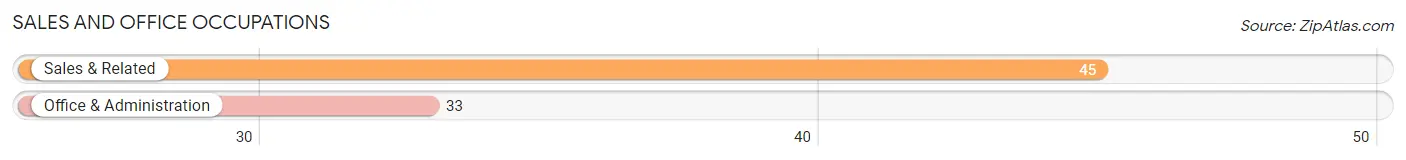
Sales and Office Occupations
The most common Sales and Office occupations in Aspen Park are Sales & Related (45 | 8.8%), and Office & Administration (33 | 6.5%).
Sales and Office Occupations by Sex
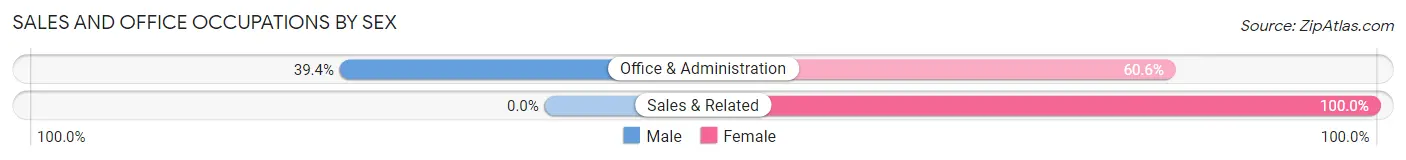
| Occupation | Male | Female |
| Sales & Related | 0 (0.0%) | 45 (100.0%) |
| Office & Administration | 13 (39.4%) | 20 (60.6%) |
| Total (Category) | 13 (16.7%) | 65 (83.3%) |
| Total (Overall) | 252 (49.5%) | 257 (50.5%) |
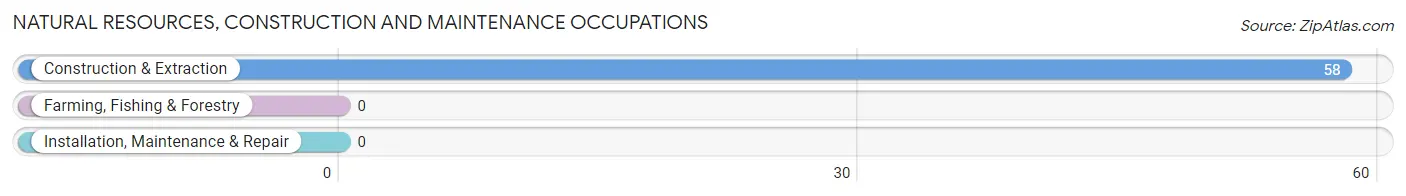
Natural Resources, Construction and Maintenance Occupations
The most common Natural Resources, Construction and Maintenance occupations in Aspen Park are , and Construction & Extraction (58 | 11.4%).
Natural Resources, Construction and Maintenance Occupations by Sex
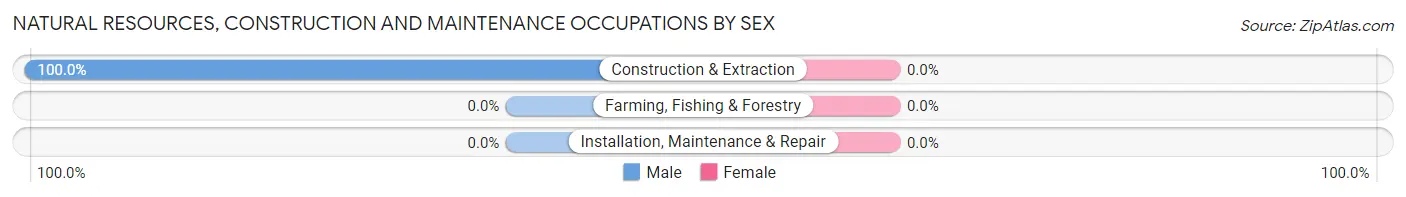
| Occupation | Male | Female |
| Farming, Fishing & Forestry | 0 (0.0%) | 0 (0.0%) |
| Construction & Extraction | 58 (100.0%) | 0 (0.0%) |
| Installation, Maintenance & Repair | 0 (0.0%) | 0 (0.0%) |
| Total (Category) | 58 (100.0%) | 0 (0.0%) |
| Total (Overall) | 252 (49.5%) | 257 (50.5%) |
Production, Transportation and Moving Occupations
The most common Production, Transportation and Moving occupations in Aspen Park are Material Moving (32 | 6.3%), Transportation (10 | 2.0%), and Production (8 | 1.6%).
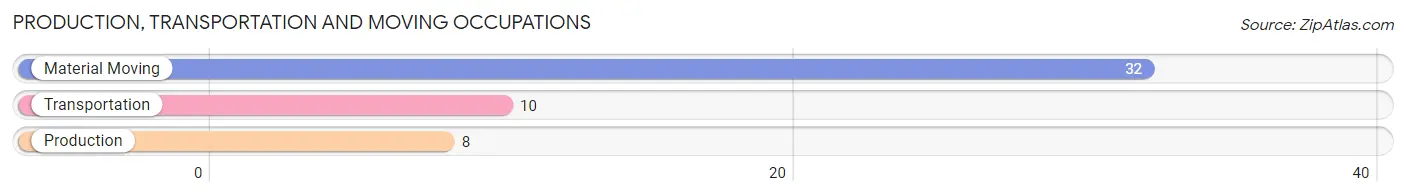
Production, Transportation and Moving Occupations by Sex
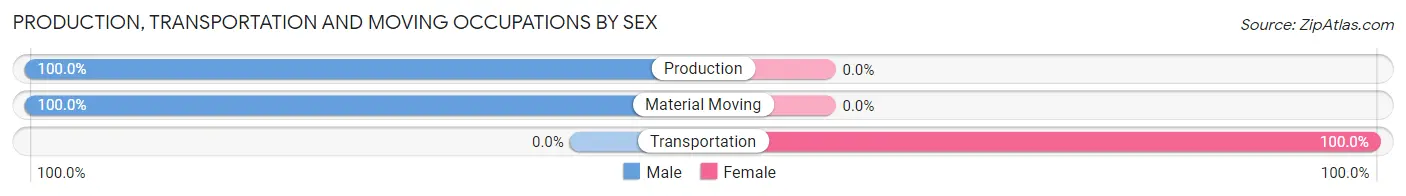
| Occupation | Male | Female |
| Production | 8 (100.0%) | 0 (0.0%) |
| Transportation | 0 (0.0%) | 10 (100.0%) |
| Material Moving | 32 (100.0%) | 0 (0.0%) |
| Total (Category) | 40 (80.0%) | 10 (20.0%) |
| Total (Overall) | 252 (49.5%) | 257 (50.5%) |
Employment Industries by Sex in Aspen Park
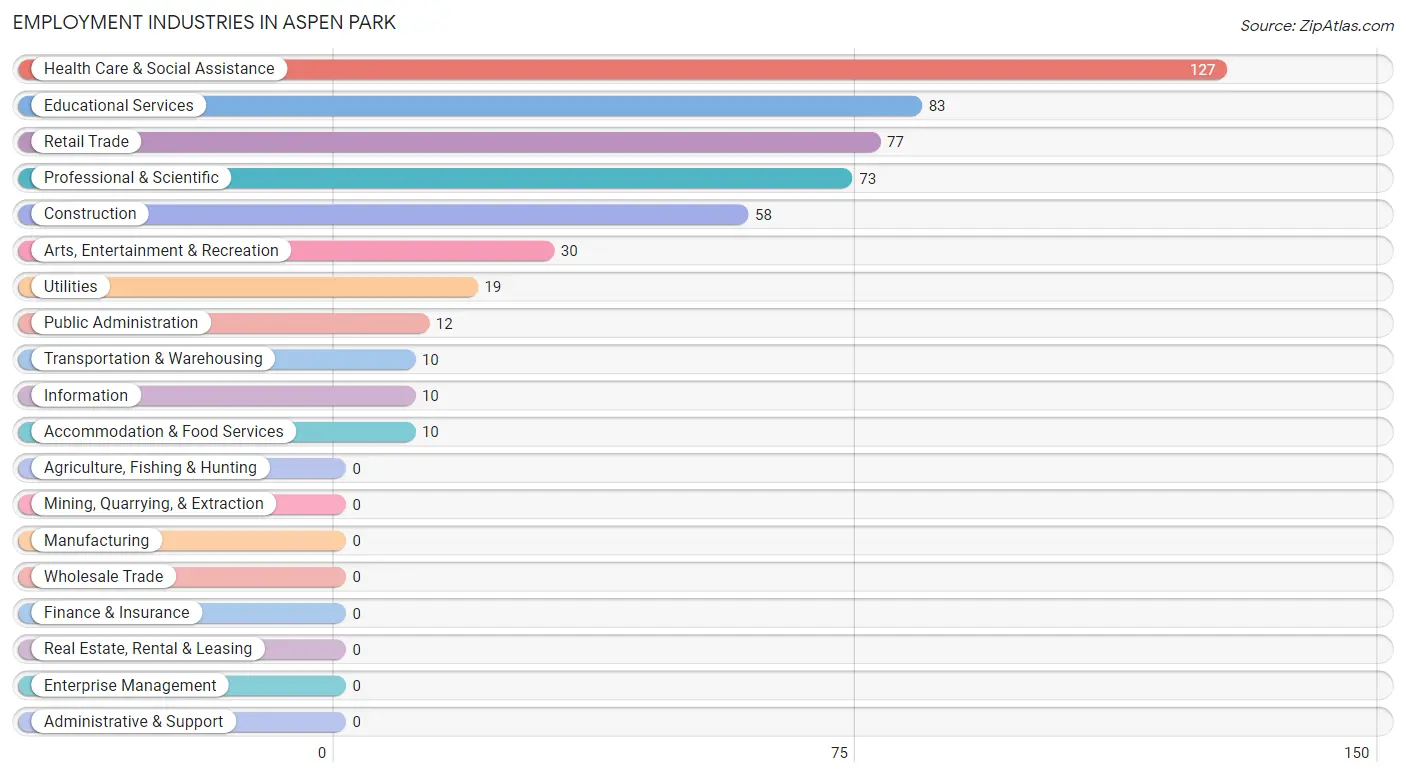
Employment Industries in Aspen Park
The major employment industries in Aspen Park include Health Care & Social Assistance (127 | 24.9%), Educational Services (83 | 16.3%), Retail Trade (77 | 15.1%), Professional & Scientific (73 | 14.3%), and Construction (58 | 11.4%).
Employment Industries by Sex in Aspen Park
The Aspen Park industries that see more men than women are Construction (100.0%), Utilities (100.0%), and Public Administration (100.0%), whereas the industries that tend to have a higher number of women are Transportation & Warehousing (100.0%), Arts, Entertainment & Recreation (100.0%), and Accommodation & Food Services (100.0%).
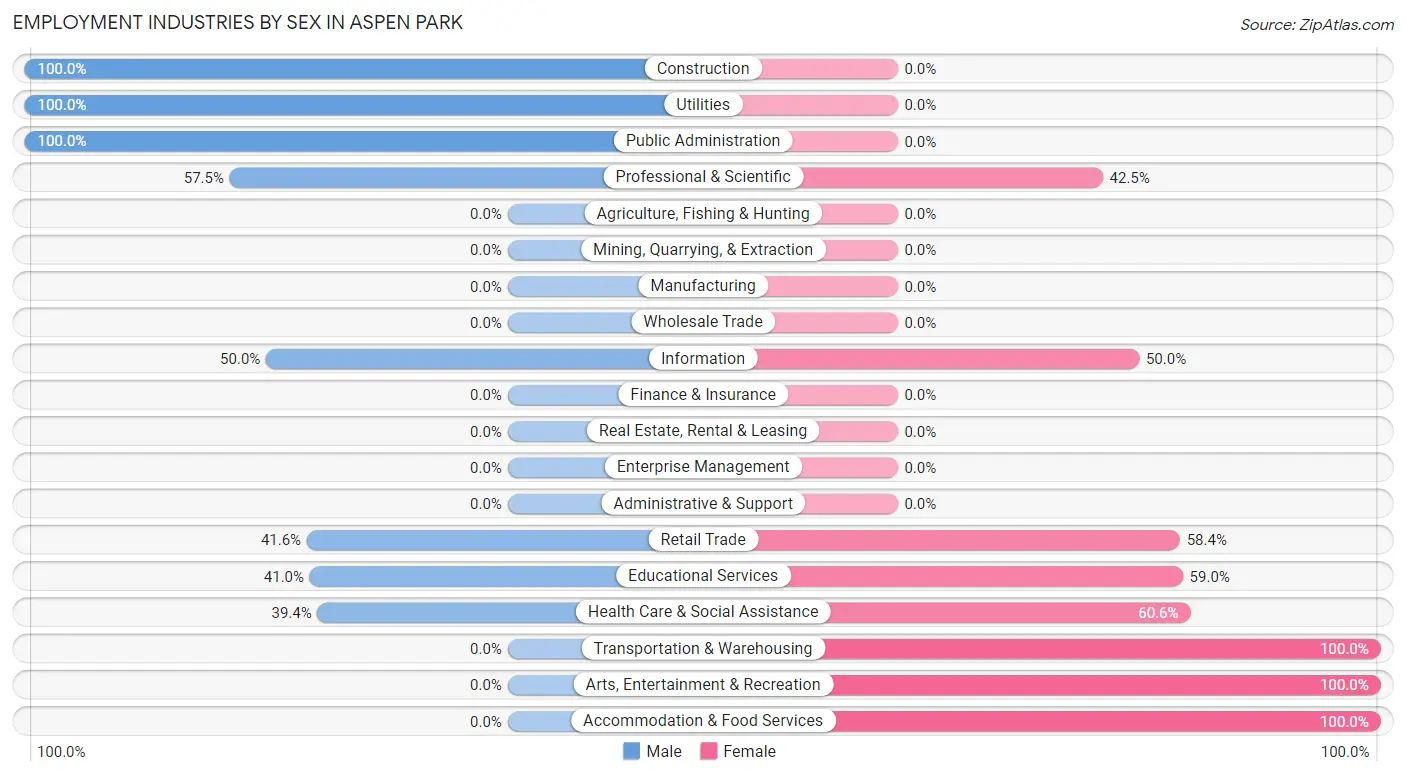
| Industry | Male | Female |
| Agriculture, Fishing & Hunting | 0 (0.0%) | 0 (0.0%) |
| Mining, Quarrying, & Extraction | 0 (0.0%) | 0 (0.0%) |
| Construction | 58 (100.0%) | 0 (0.0%) |
| Manufacturing | 0 (0.0%) | 0 (0.0%) |
| Wholesale Trade | 0 (0.0%) | 0 (0.0%) |
| Retail Trade | 32 (41.6%) | 45 (58.4%) |
| Transportation & Warehousing | 0 (0.0%) | 10 (100.0%) |
| Utilities | 19 (100.0%) | 0 (0.0%) |
| Information | 5 (50.0%) | 5 (50.0%) |
| Finance & Insurance | 0 (0.0%) | 0 (0.0%) |
| Real Estate, Rental & Leasing | 0 (0.0%) | 0 (0.0%) |
| Professional & Scientific | 42 (57.5%) | 31 (42.5%) |
| Enterprise Management | 0 (0.0%) | 0 (0.0%) |
| Administrative & Support | 0 (0.0%) | 0 (0.0%) |
| Educational Services | 34 (41.0%) | 49 (59.0%) |
| Health Care & Social Assistance | 50 (39.4%) | 77 (60.6%) |
| Arts, Entertainment & Recreation | 0 (0.0%) | 30 (100.0%) |
| Accommodation & Food Services | 0 (0.0%) | 10 (100.0%) |
| Public Administration | 12 (100.0%) | 0 (0.0%) |
| Total | 252 (49.5%) | 257 (50.5%) |
Education in Aspen Park
School Enrollment in Aspen Park
The most common levels of schooling among the 217 students in Aspen Park are middle school (68 | 31.3%), elementary school (36 | 16.6%), and high school (35 | 16.1%).
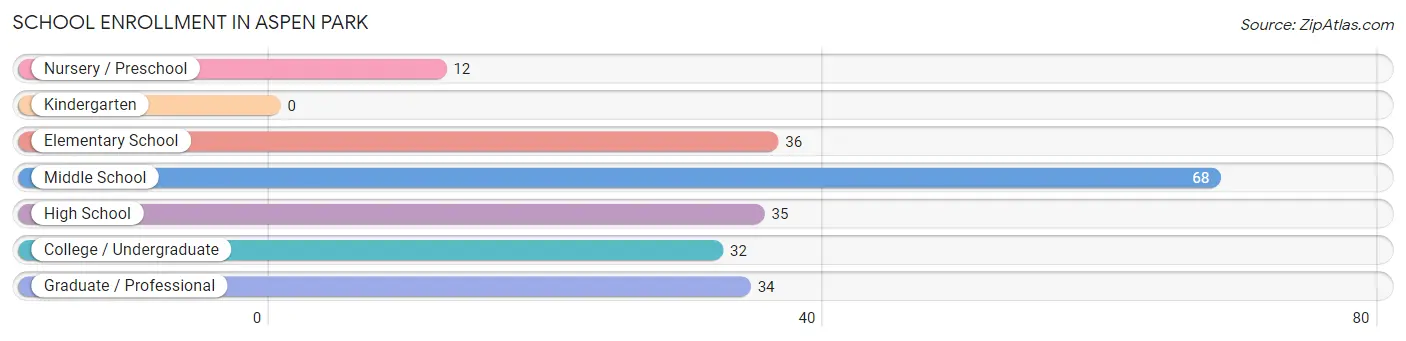
| School Level | # Students | % Students |
| Nursery / Preschool | 12 | 5.5% |
| Kindergarten | 0 | 0.0% |
| Elementary School | 36 | 16.6% |
| Middle School | 68 | 31.3% |
| High School | 35 | 16.1% |
| College / Undergraduate | 32 | 14.7% |
| Graduate / Professional | 34 | 15.7% |
| Total | 217 | 100.0% |
School Enrollment by Age by Funding Source in Aspen Park
Out of a total of 217 students who are enrolled in schools in Aspen Park, 82 (37.8%) attend a private institution, while the remaining 135 (62.2%) are enrolled in public schools. The age group of 3 to 4 year olds has the highest likelihood of being enrolled in private schools, with 12 (100.0% in the age bracket) enrolled. Conversely, the age group of 15 to 17 year olds has the lowest likelihood of being enrolled in a private school, with 23 (100.0% in the age bracket) attending a public institution.
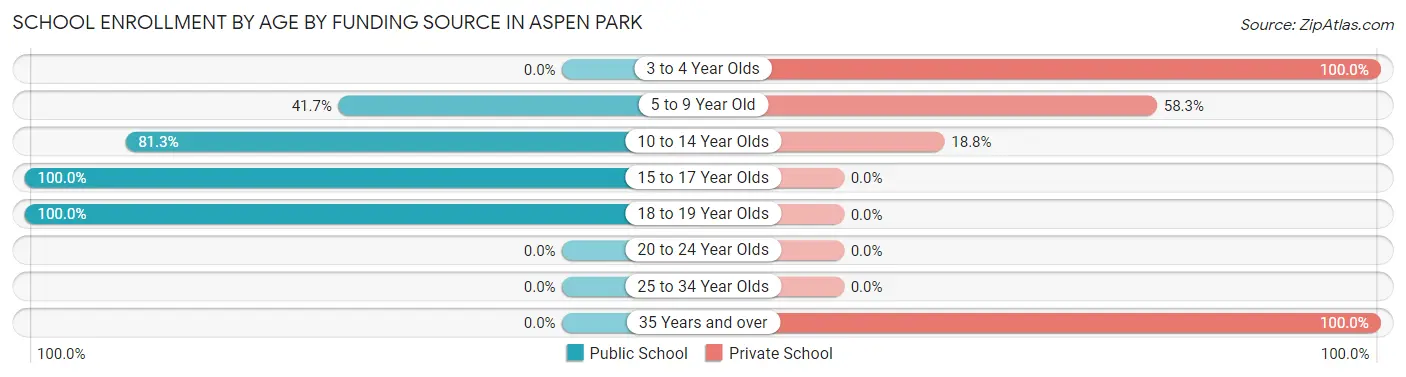
| Age Bracket | Public School | Private School |
| 3 to 4 Year Olds | 0 (0.0%) | 12 (100.0%) |
| 5 to 9 Year Old | 15 (41.7%) | 21 (58.3%) |
| 10 to 14 Year Olds | 65 (81.2%) | 15 (18.8%) |
| 15 to 17 Year Olds | 23 (100.0%) | 0 (0.0%) |
| 18 to 19 Year Olds | 32 (100.0%) | 0 (0.0%) |
| 20 to 24 Year Olds | 0 (0.0%) | 0 (0.0%) |
| 25 to 34 Year Olds | 0 (0.0%) | 0 (0.0%) |
| 35 Years and over | 0 (0.0%) | 34 (100.0%) |
| Total | 135 (62.2%) | 82 (37.8%) |
Educational Attainment by Field of Study in Aspen Park
Bio, nature & agricultural (98 | 31.7%), arts & humanities (74 | 23.9%), engineering (31 | 10.0%), science & technology (22 | 7.1%), and computers & mathematics (18 | 5.8%) are the most common fields of study among 309 individuals in Aspen Park who have obtained a bachelor's degree or higher.
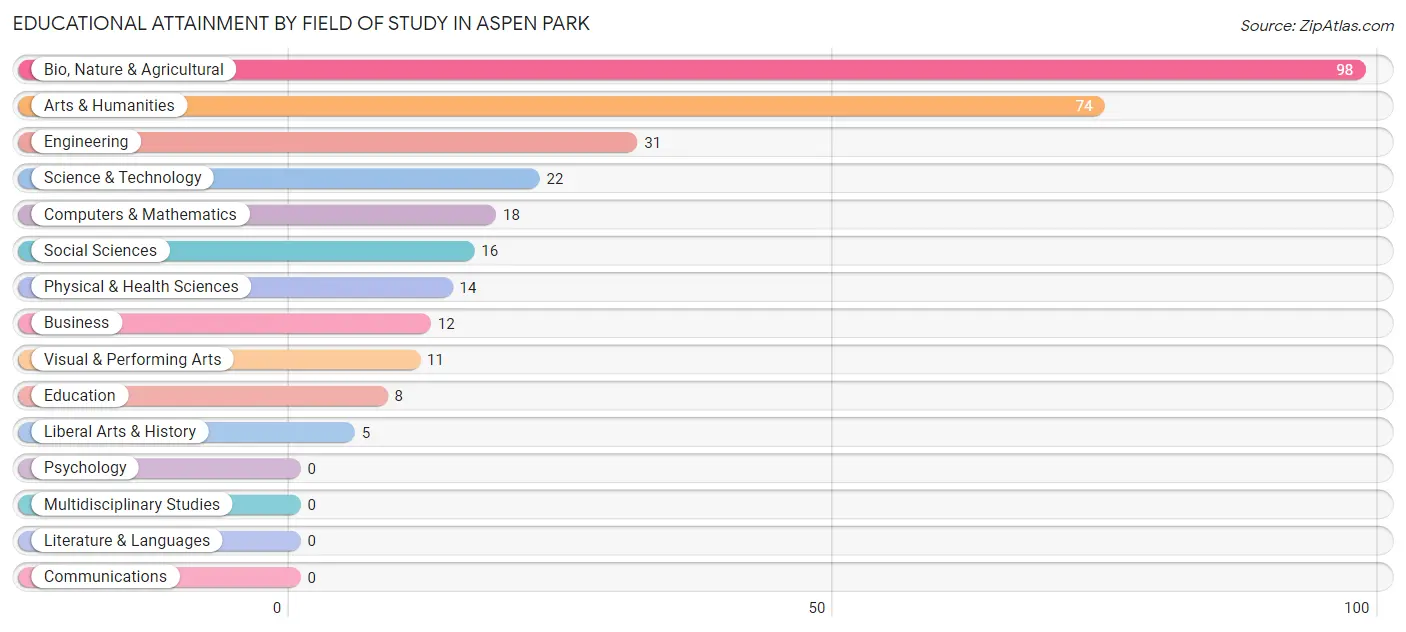
| Field of Study | # Graduates | % Graduates |
| Computers & Mathematics | 18 | 5.8% |
| Bio, Nature & Agricultural | 98 | 31.7% |
| Physical & Health Sciences | 14 | 4.5% |
| Psychology | 0 | 0.0% |
| Social Sciences | 16 | 5.2% |
| Engineering | 31 | 10.0% |
| Multidisciplinary Studies | 0 | 0.0% |
| Science & Technology | 22 | 7.1% |
| Business | 12 | 3.9% |
| Education | 8 | 2.6% |
| Literature & Languages | 0 | 0.0% |
| Liberal Arts & History | 5 | 1.6% |
| Visual & Performing Arts | 11 | 3.6% |
| Communications | 0 | 0.0% |
| Arts & Humanities | 74 | 23.9% |
| Total | 309 | 100.0% |
Transportation & Commute in Aspen Park
Vehicle Availability by Sex in Aspen Park
The most prevalent vehicle ownership categories in Aspen Park are males with 3 vehicles (128, accounting for 50.8%) and females with 3 vehicles (93, making up 49.8%).
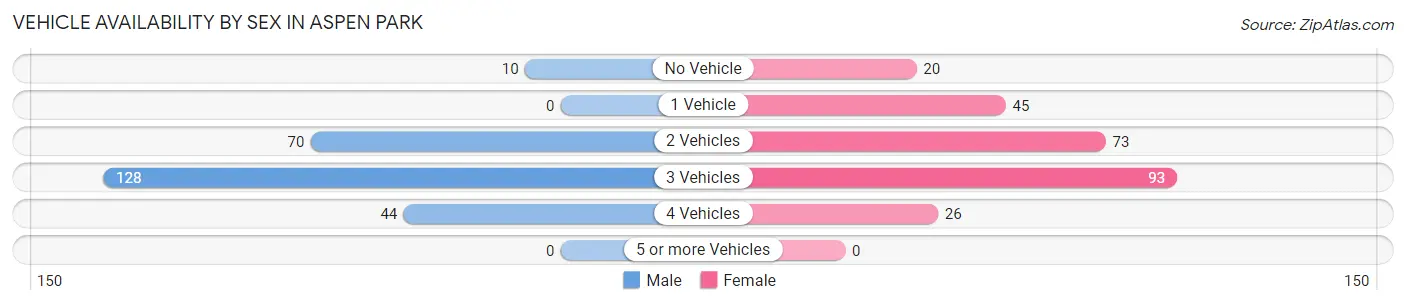
| Vehicles Available | Male | Female |
| No Vehicle | 10 (4.0%) | 20 (7.8%) |
| 1 Vehicle | 0 (0.0%) | 45 (17.5%) |
| 2 Vehicles | 70 (27.8%) | 73 (28.4%) |
| 3 Vehicles | 128 (50.8%) | 93 (36.2%) |
| 4 Vehicles | 44 (17.5%) | 26 (10.1%) |
| 5 or more Vehicles | 0 (0.0%) | 0 (0.0%) |
| Total | 252 (100.0%) | 257 (100.0%) |
Commute Time in Aspen Park
The most frequently occuring commute durations in Aspen Park are 5 to 9 minutes (136 commuters, 29.2%), 30 to 34 minutes (87 commuters, 18.7%), and 60 to 89 minutes (66 commuters, 14.2%).
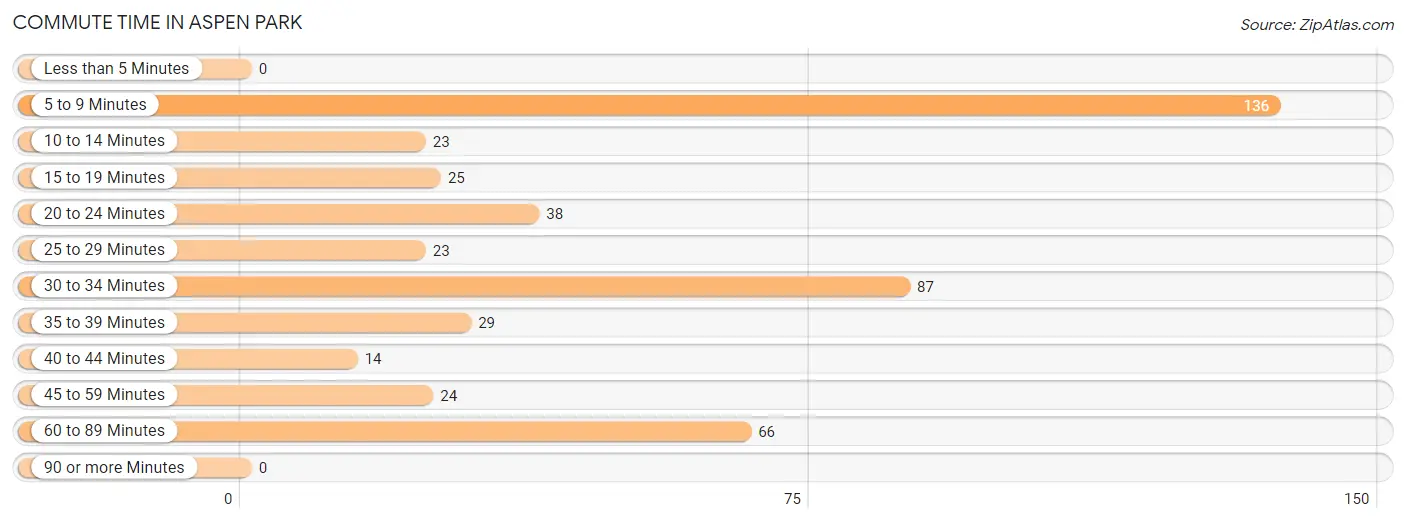
| Commute Time | # Commuters | % Commuters |
| Less than 5 Minutes | 0 | 0.0% |
| 5 to 9 Minutes | 136 | 29.2% |
| 10 to 14 Minutes | 23 | 5.0% |
| 15 to 19 Minutes | 25 | 5.4% |
| 20 to 24 Minutes | 38 | 8.2% |
| 25 to 29 Minutes | 23 | 5.0% |
| 30 to 34 Minutes | 87 | 18.7% |
| 35 to 39 Minutes | 29 | 6.2% |
| 40 to 44 Minutes | 14 | 3.0% |
| 45 to 59 Minutes | 24 | 5.2% |
| 60 to 89 Minutes | 66 | 14.2% |
| 90 or more Minutes | 0 | 0.0% |
Commute Time by Sex in Aspen Park
The most common commute times in Aspen Park are 5 to 9 minutes (66 commuters, 30.3%) for males and 5 to 9 minutes (70 commuters, 28.3%) for females.
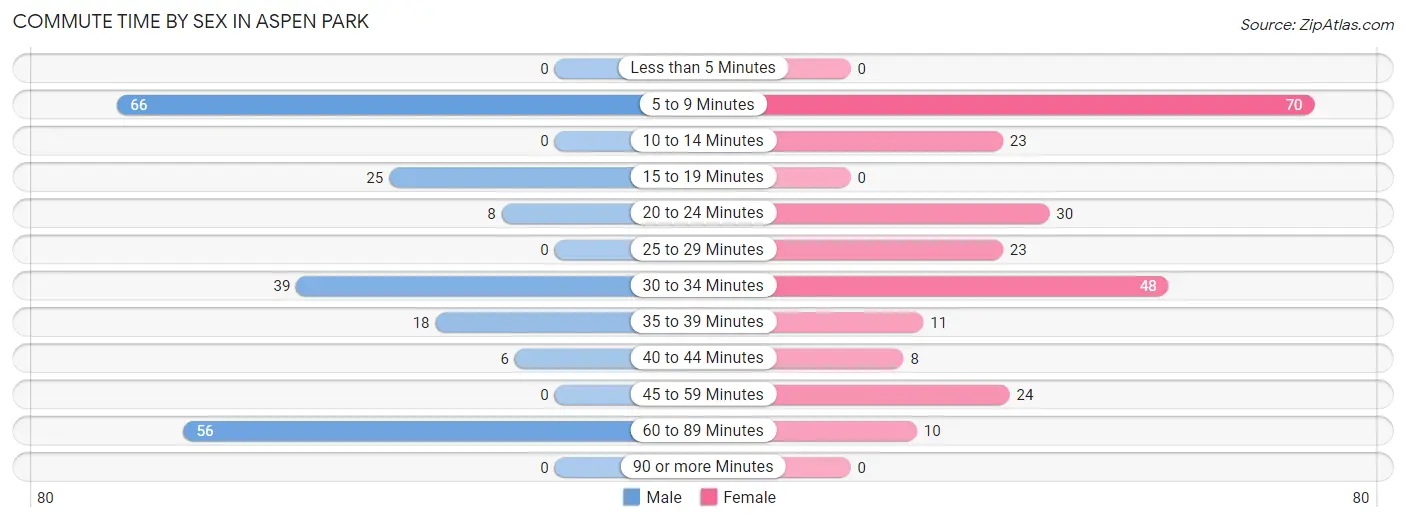
| Commute Time | Male | Female |
| Less than 5 Minutes | 0 (0.0%) | 0 (0.0%) |
| 5 to 9 Minutes | 66 (30.3%) | 70 (28.3%) |
| 10 to 14 Minutes | 0 (0.0%) | 23 (9.3%) |
| 15 to 19 Minutes | 25 (11.5%) | 0 (0.0%) |
| 20 to 24 Minutes | 8 (3.7%) | 30 (12.1%) |
| 25 to 29 Minutes | 0 (0.0%) | 23 (9.3%) |
| 30 to 34 Minutes | 39 (17.9%) | 48 (19.4%) |
| 35 to 39 Minutes | 18 (8.3%) | 11 (4.4%) |
| 40 to 44 Minutes | 6 (2.8%) | 8 (3.2%) |
| 45 to 59 Minutes | 0 (0.0%) | 24 (9.7%) |
| 60 to 89 Minutes | 56 (25.7%) | 10 (4.1%) |
| 90 or more Minutes | 0 (0.0%) | 0 (0.0%) |
Time of Departure to Work by Sex in Aspen Park
The most frequent times of departure to work in Aspen Park are 6:00 AM to 6:29 AM (59, 27.1%) for males and 6:30 AM to 6:59 AM (86, 34.8%) for females.
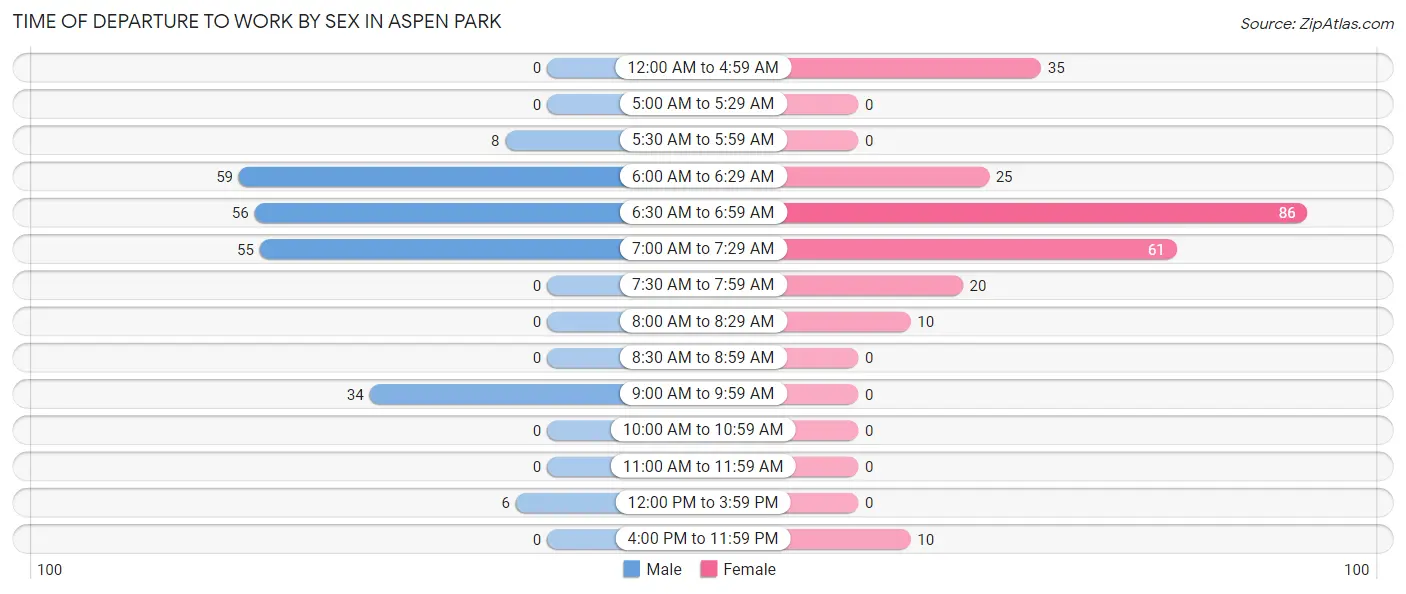
| Time of Departure | Male | Female |
| 12:00 AM to 4:59 AM | 0 (0.0%) | 35 (14.2%) |
| 5:00 AM to 5:29 AM | 0 (0.0%) | 0 (0.0%) |
| 5:30 AM to 5:59 AM | 8 (3.7%) | 0 (0.0%) |
| 6:00 AM to 6:29 AM | 59 (27.1%) | 25 (10.1%) |
| 6:30 AM to 6:59 AM | 56 (25.7%) | 86 (34.8%) |
| 7:00 AM to 7:29 AM | 55 (25.2%) | 61 (24.7%) |
| 7:30 AM to 7:59 AM | 0 (0.0%) | 20 (8.1%) |
| 8:00 AM to 8:29 AM | 0 (0.0%) | 10 (4.1%) |
| 8:30 AM to 8:59 AM | 0 (0.0%) | 0 (0.0%) |
| 9:00 AM to 9:59 AM | 34 (15.6%) | 0 (0.0%) |
| 10:00 AM to 10:59 AM | 0 (0.0%) | 0 (0.0%) |
| 11:00 AM to 11:59 AM | 0 (0.0%) | 0 (0.0%) |
| 12:00 PM to 3:59 PM | 6 (2.8%) | 0 (0.0%) |
| 4:00 PM to 11:59 PM | 0 (0.0%) | 10 (4.1%) |
| Total | 218 (100.0%) | 247 (100.0%) |
Housing Occupancy in Aspen Park
Occupancy by Ownership in Aspen Park
Of the total 381 dwellings in Aspen Park, owner-occupied units account for 381 (100.0%), while renter-occupied units make up 0 (0.0%).
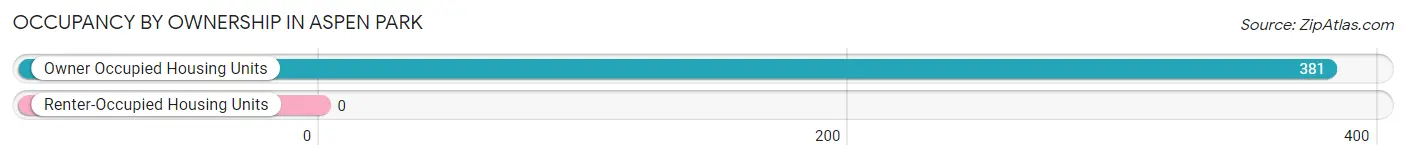
| Occupancy | # Housing Units | % Housing Units |
| Owner Occupied Housing Units | 381 | 100.0% |
| Renter-Occupied Housing Units | 0 | 0.0% |
| Total Occupied Housing Units | 381 | 100.0% |
Occupancy by Household Size in Aspen Park
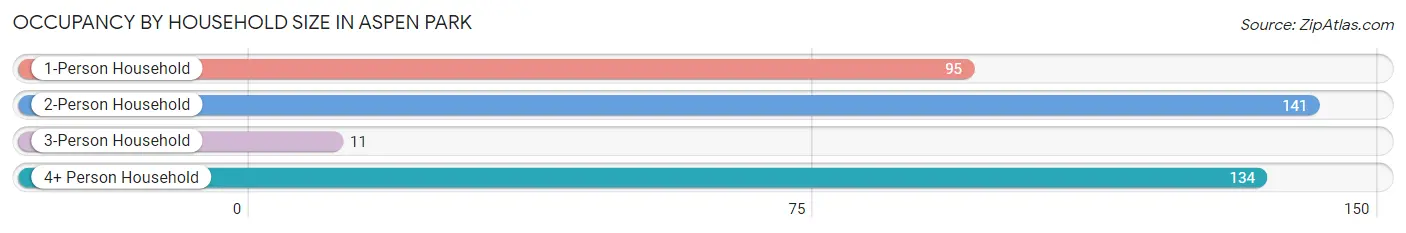
| Household Size | # Housing Units | % Housing Units |
| 1-Person Household | 95 | 24.9% |
| 2-Person Household | 141 | 37.0% |
| 3-Person Household | 11 | 2.9% |
| 4+ Person Household | 134 | 35.2% |
| Total Housing Units | 381 | 100.0% |
Occupancy by Ownership by Household Size in Aspen Park
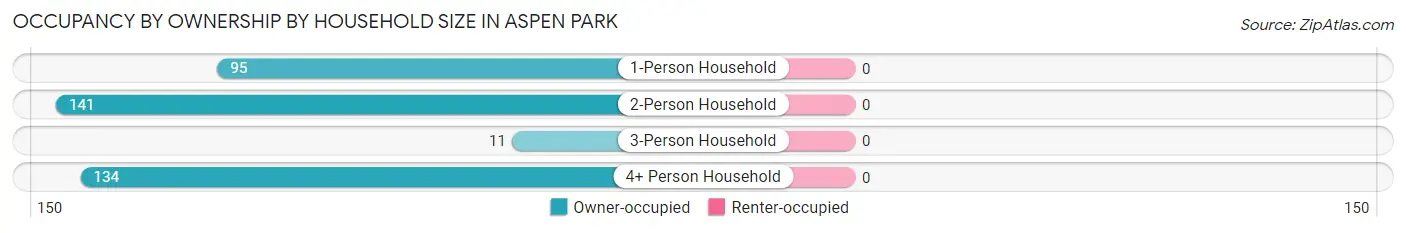
| Household Size | Owner-occupied | Renter-occupied |
| 1-Person Household | 95 (100.0%) | 0 (0.0%) |
| 2-Person Household | 141 (100.0%) | 0 (0.0%) |
| 3-Person Household | 11 (100.0%) | 0 (0.0%) |
| 4+ Person Household | 134 (100.0%) | 0 (0.0%) |
| Total Housing Units | 381 (100.0%) | 0 (0.0%) |
Occupancy by Educational Attainment in Aspen Park
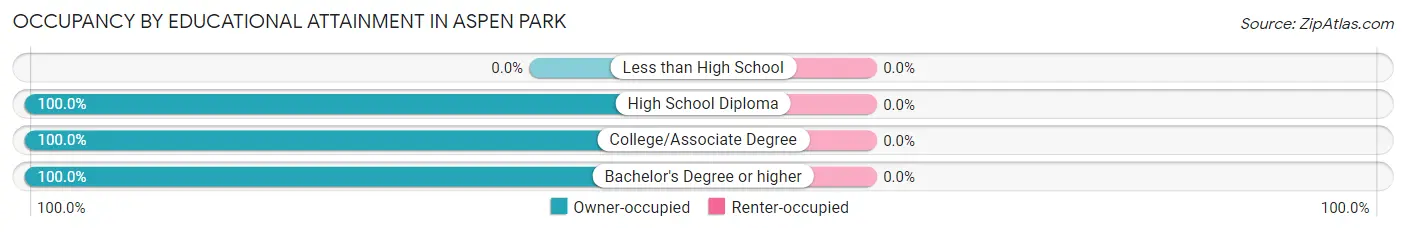
| Household Size | Owner-occupied | Renter-occupied |
| Less than High School | 0 (0.0%) | 0 (0.0%) |
| High School Diploma | 85 (100.0%) | 0 (0.0%) |
| College/Associate Degree | 124 (100.0%) | 0 (0.0%) |
| Bachelor's Degree or higher | 172 (100.0%) | 0 (0.0%) |
Occupancy by Age of Householder in Aspen Park
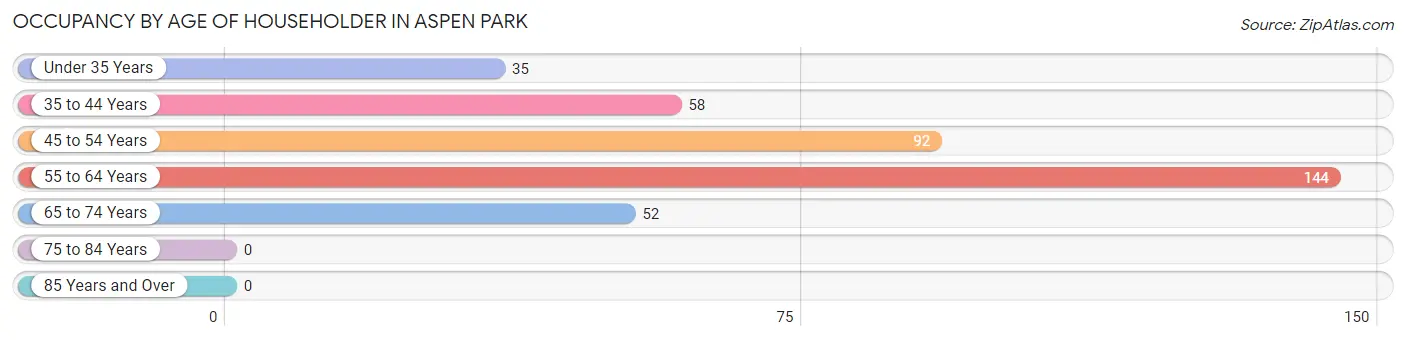
| Age Bracket | # Households | % Households |
| Under 35 Years | 35 | 9.2% |
| 35 to 44 Years | 58 | 15.2% |
| 45 to 54 Years | 92 | 24.1% |
| 55 to 64 Years | 144 | 37.8% |
| 65 to 74 Years | 52 | 13.7% |
| 75 to 84 Years | 0 | 0.0% |
| 85 Years and Over | 0 | 0.0% |
| Total | 381 | 100.0% |
Housing Finances in Aspen Park
Median Income by Occupancy in Aspen Park
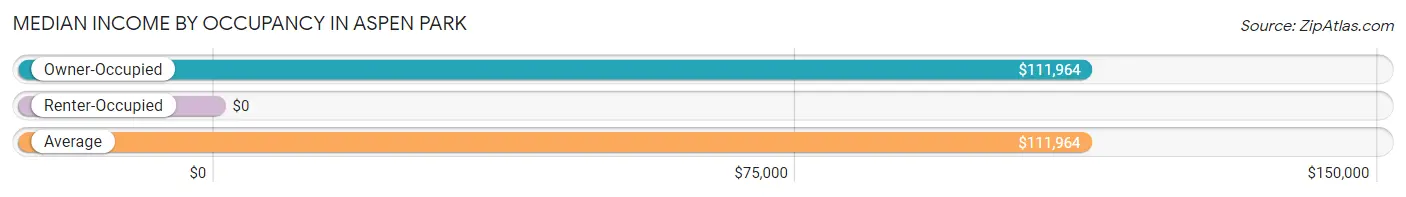
| Occupancy Type | # Households | Median Income |
| Owner-Occupied | 381 (100.0%) | $111,964 |
| Renter-Occupied | 0 (0.0%) | $0 |
| Average | 381 (100.0%) | $111,964 |
Occupancy by Householder Income Bracket in Aspen Park
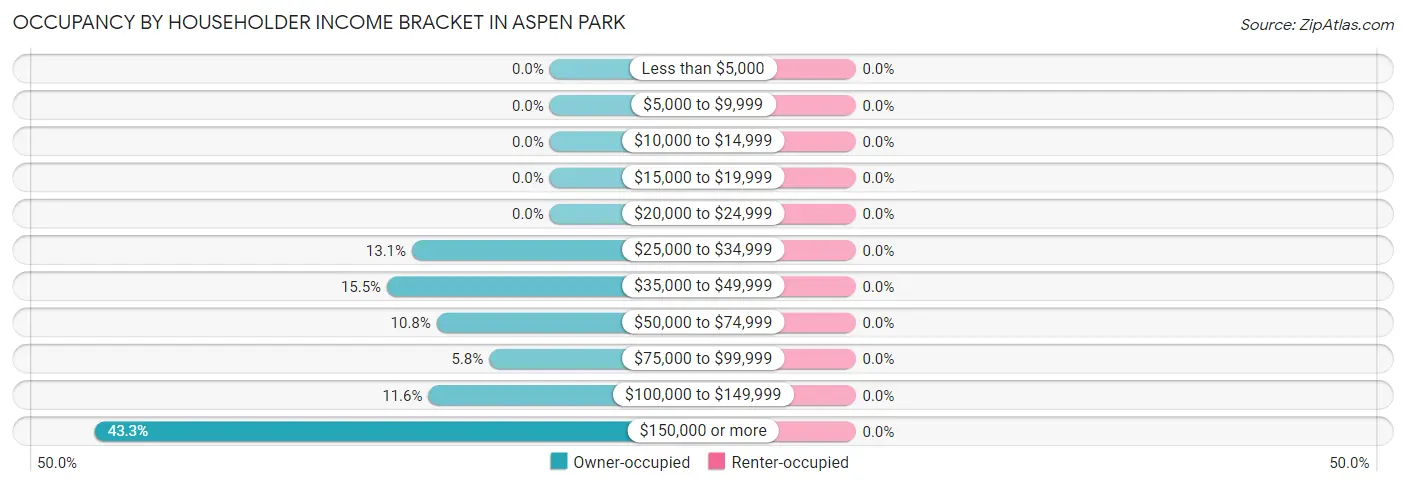
| Income Bracket | Owner-occupied | Renter-occupied |
| Less than $5,000 | 0 (0.0%) | 0 (0.0%) |
| $5,000 to $9,999 | 0 (0.0%) | 0 (0.0%) |
| $10,000 to $14,999 | 0 (0.0%) | 0 (0.0%) |
| $15,000 to $19,999 | 0 (0.0%) | 0 (0.0%) |
| $20,000 to $24,999 | 0 (0.0%) | 0 (0.0%) |
| $25,000 to $34,999 | 50 (13.1%) | 0 (0.0%) |
| $35,000 to $49,999 | 59 (15.5%) | 0 (0.0%) |
| $50,000 to $74,999 | 41 (10.8%) | 0 (0.0%) |
| $75,000 to $99,999 | 22 (5.8%) | 0 (0.0%) |
| $100,000 to $149,999 | 44 (11.6%) | 0 (0.0%) |
| $150,000 or more | 165 (43.3%) | 0 (0.0%) |
| Total | 381 (100.0%) | 0 (0.0%) |
Monthly Housing Cost Tiers in Aspen Park
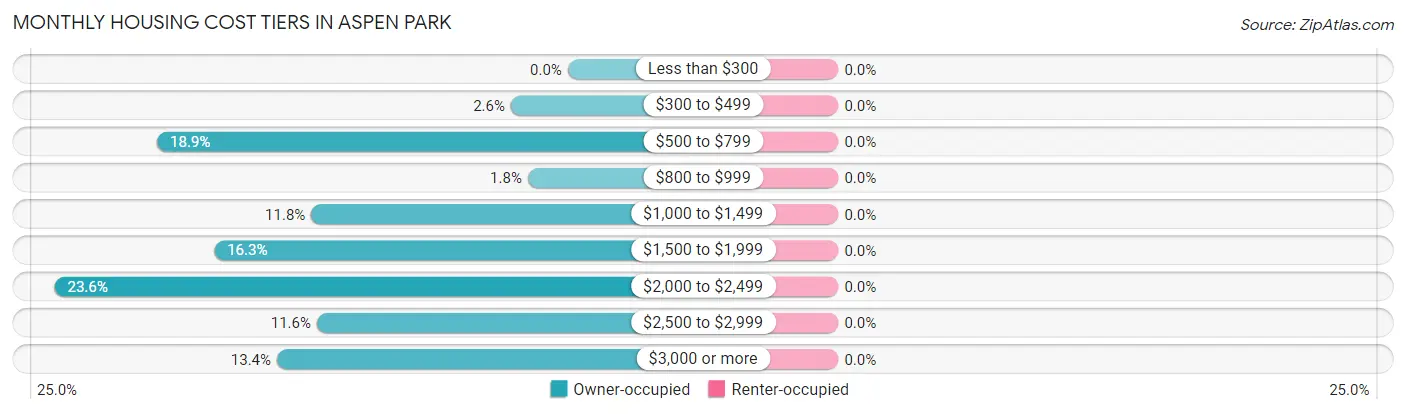
| Monthly Cost | Owner-occupied | Renter-occupied |
| Less than $300 | 0 (0.0%) | 0 (0.0%) |
| $300 to $499 | 10 (2.6%) | 0 (0.0%) |
| $500 to $799 | 72 (18.9%) | 0 (0.0%) |
| $800 to $999 | 7 (1.8%) | 0 (0.0%) |
| $1,000 to $1,499 | 45 (11.8%) | 0 (0.0%) |
| $1,500 to $1,999 | 62 (16.3%) | 0 (0.0%) |
| $2,000 to $2,499 | 90 (23.6%) | 0 (0.0%) |
| $2,500 to $2,999 | 44 (11.6%) | 0 (0.0%) |
| $3,000 or more | 51 (13.4%) | 0 (0.0%) |
| Total | 381 (100.0%) | 0 (0.0%) |
Physical Housing Characteristics in Aspen Park
Housing Structures in Aspen Park
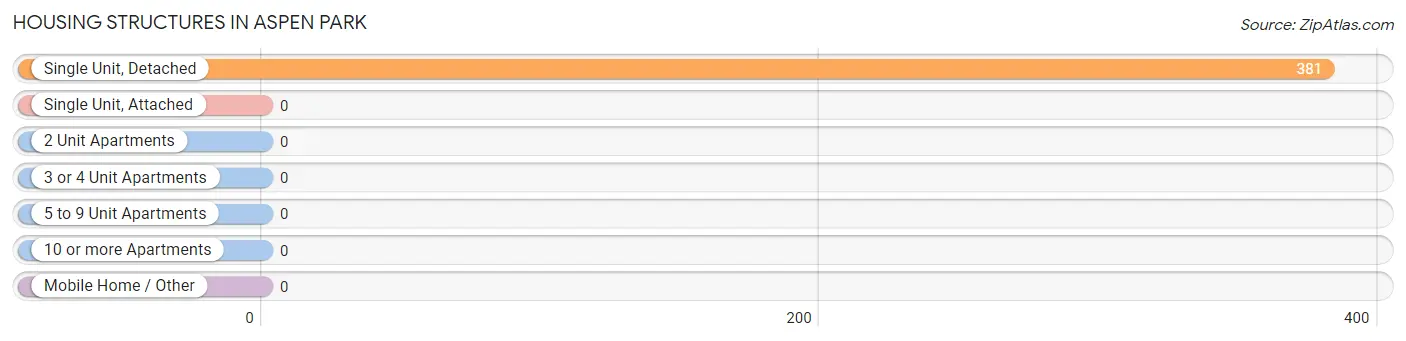
| Structure Type | # Housing Units | % Housing Units |
| Single Unit, Detached | 381 | 100.0% |
| Single Unit, Attached | 0 | 0.0% |
| 2 Unit Apartments | 0 | 0.0% |
| 3 or 4 Unit Apartments | 0 | 0.0% |
| 5 to 9 Unit Apartments | 0 | 0.0% |
| 10 or more Apartments | 0 | 0.0% |
| Mobile Home / Other | 0 | 0.0% |
| Total | 381 | 100.0% |
Housing Structures by Occupancy in Aspen Park
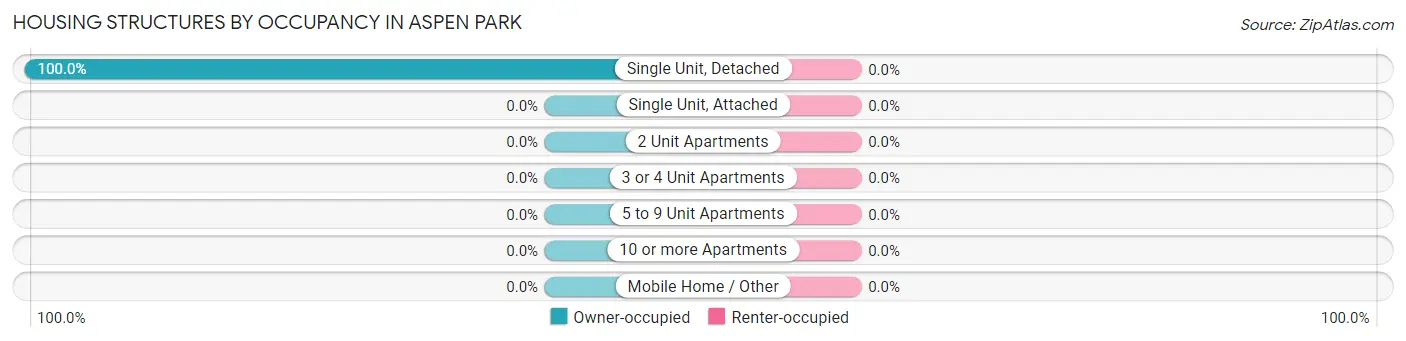
| Structure Type | Owner-occupied | Renter-occupied |
| Single Unit, Detached | 381 (100.0%) | 0 (0.0%) |
| Single Unit, Attached | 0 (0.0%) | 0 (0.0%) |
| 2 Unit Apartments | 0 (0.0%) | 0 (0.0%) |
| 3 or 4 Unit Apartments | 0 (0.0%) | 0 (0.0%) |
| 5 to 9 Unit Apartments | 0 (0.0%) | 0 (0.0%) |
| 10 or more Apartments | 0 (0.0%) | 0 (0.0%) |
| Mobile Home / Other | 0 (0.0%) | 0 (0.0%) |
| Total | 381 (100.0%) | 0 (0.0%) |
Housing Structures by Number of Rooms in Aspen Park
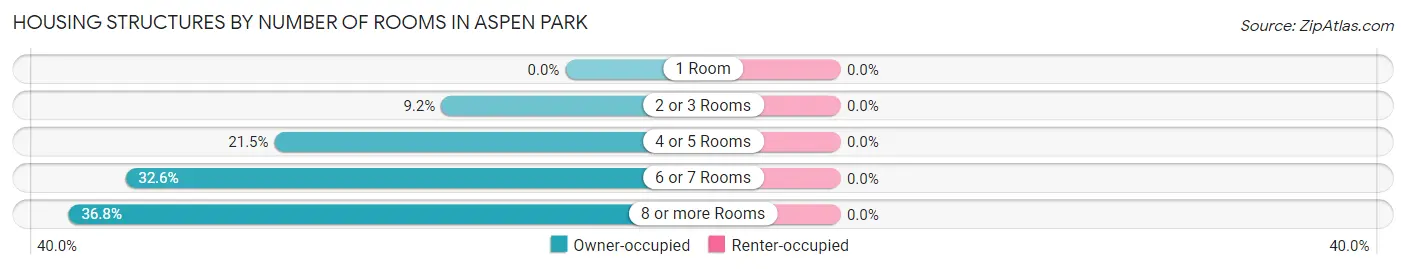
| Number of Rooms | Owner-occupied | Renter-occupied |
| 1 Room | 0 (0.0%) | 0 (0.0%) |
| 2 or 3 Rooms | 35 (9.2%) | 0 (0.0%) |
| 4 or 5 Rooms | 82 (21.5%) | 0 (0.0%) |
| 6 or 7 Rooms | 124 (32.6%) | 0 (0.0%) |
| 8 or more Rooms | 140 (36.7%) | 0 (0.0%) |
| Total | 381 (100.0%) | 0 (0.0%) |
Housing Structure by Heating Type in Aspen Park
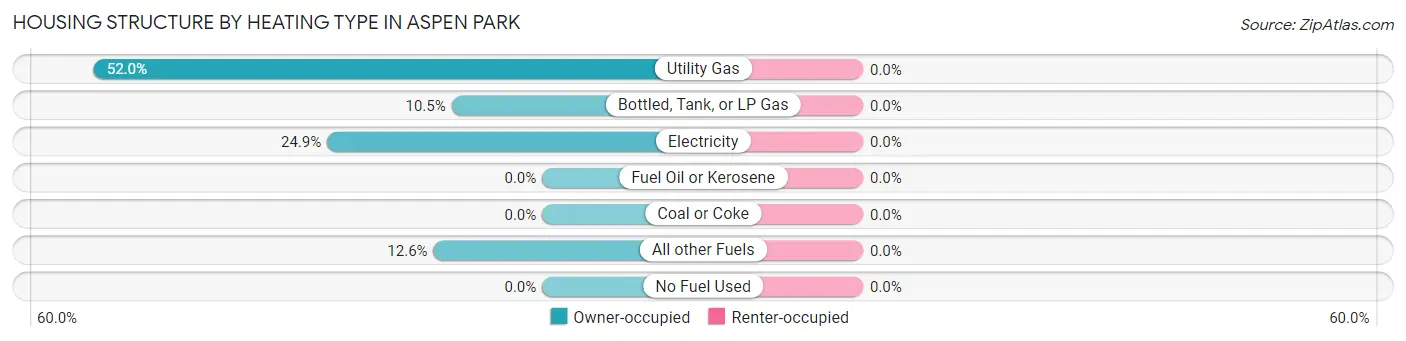
| Heating Type | Owner-occupied | Renter-occupied |
| Utility Gas | 198 (52.0%) | 0 (0.0%) |
| Bottled, Tank, or LP Gas | 40 (10.5%) | 0 (0.0%) |
| Electricity | 95 (24.9%) | 0 (0.0%) |
| Fuel Oil or Kerosene | 0 (0.0%) | 0 (0.0%) |
| Coal or Coke | 0 (0.0%) | 0 (0.0%) |
| All other Fuels | 48 (12.6%) | 0 (0.0%) |
| No Fuel Used | 0 (0.0%) | 0 (0.0%) |
| Total | 381 (100.0%) | 0 (0.0%) |
Household Vehicle Usage in Aspen Park
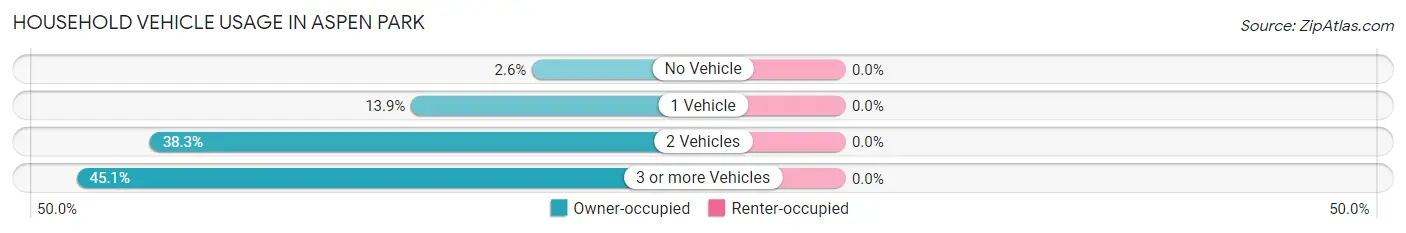
| Vehicles per Household | Owner-occupied | Renter-occupied |
| No Vehicle | 10 (2.6%) | 0 (0.0%) |
| 1 Vehicle | 53 (13.9%) | 0 (0.0%) |
| 2 Vehicles | 146 (38.3%) | 0 (0.0%) |
| 3 or more Vehicles | 172 (45.1%) | 0 (0.0%) |
| Total | 381 (100.0%) | 0 (0.0%) |
Real Estate & Mortgages in Aspen Park
Real Estate and Mortgage Overview in Aspen Park
| Characteristic | Without Mortgage | With Mortgage |
| Housing Units | 82 | 299 |
| Median Property Value | $580,000 | $612,000 |
| Median Household Income | - | - |
| Monthly Housing Costs | $584 | $51 |
| Real Estate Taxes | $2,603 | $0 |
Property Value by Mortgage Status in Aspen Park
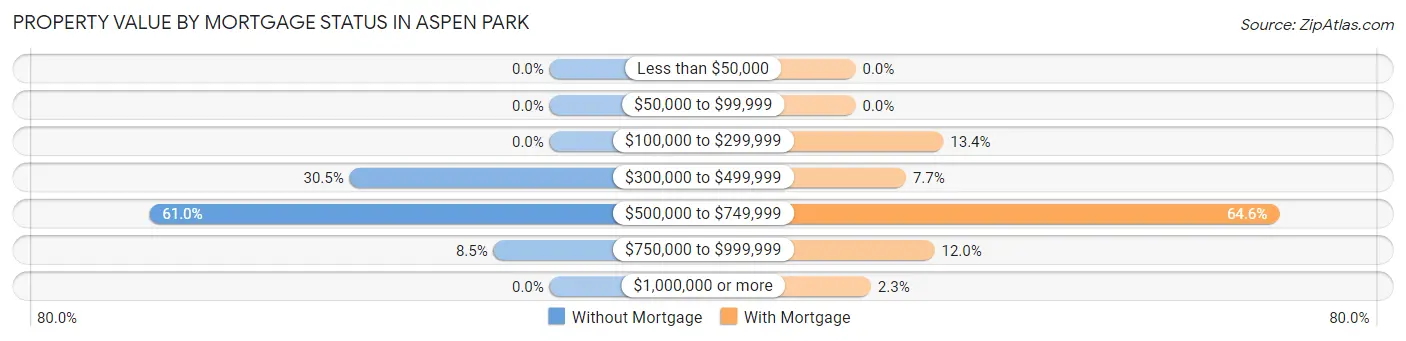
| Property Value | Without Mortgage | With Mortgage |
| Less than $50,000 | 0 (0.0%) | 0 (0.0%) |
| $50,000 to $99,999 | 0 (0.0%) | 0 (0.0%) |
| $100,000 to $299,999 | 0 (0.0%) | 40 (13.4%) |
| $300,000 to $499,999 | 25 (30.5%) | 23 (7.7%) |
| $500,000 to $749,999 | 50 (61.0%) | 193 (64.5%) |
| $750,000 to $999,999 | 7 (8.5%) | 36 (12.0%) |
| $1,000,000 or more | 0 (0.0%) | 7 (2.3%) |
| Total | 82 (100.0%) | 299 (100.0%) |
Household Income by Mortgage Status in Aspen Park
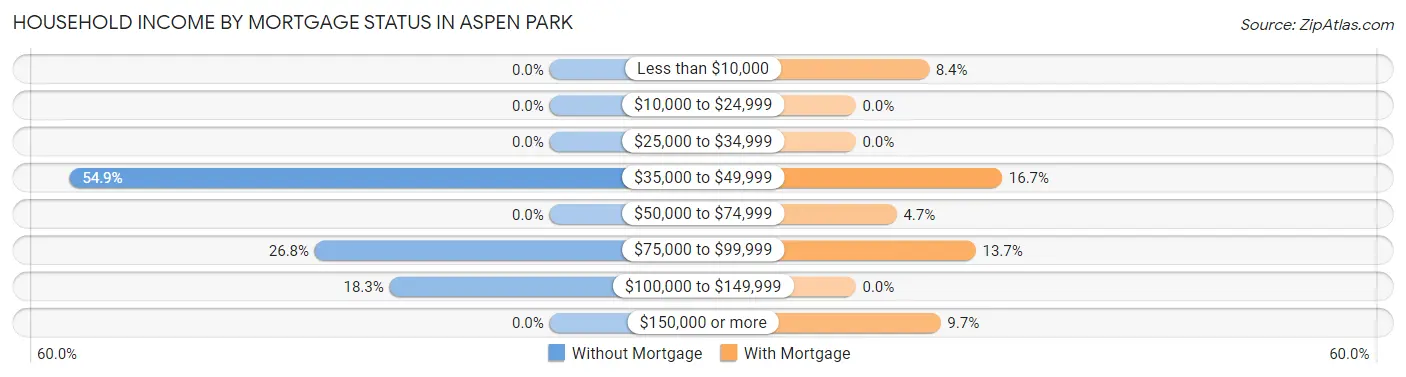
| Household Income | Without Mortgage | With Mortgage |
| Less than $10,000 | 0 (0.0%) | 25 (8.4%) |
| $10,000 to $24,999 | 0 (0.0%) | 0 (0.0%) |
| $25,000 to $34,999 | 0 (0.0%) | 0 (0.0%) |
| $35,000 to $49,999 | 45 (54.9%) | 50 (16.7%) |
| $50,000 to $74,999 | 0 (0.0%) | 14 (4.7%) |
| $75,000 to $99,999 | 22 (26.8%) | 41 (13.7%) |
| $100,000 to $149,999 | 15 (18.3%) | 0 (0.0%) |
| $150,000 or more | 0 (0.0%) | 29 (9.7%) |
| Total | 82 (100.0%) | 299 (100.0%) |
Property Value to Household Income Ratio in Aspen Park
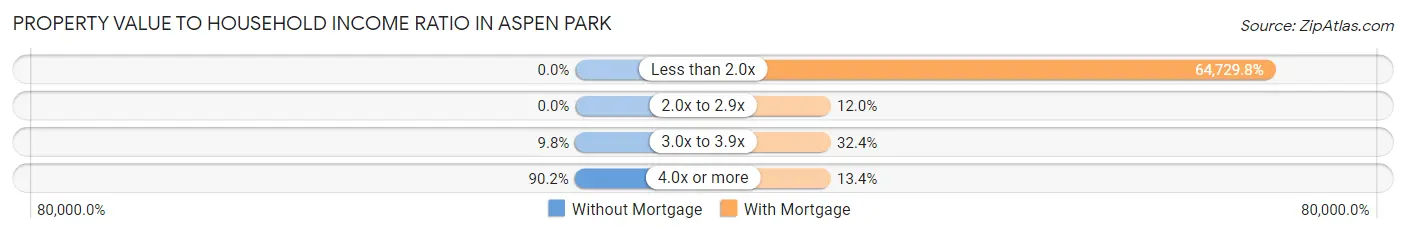
| Value-to-Income Ratio | Without Mortgage | With Mortgage |
| Less than 2.0x | 0 (0.0%) | 193,542 (64,729.8%) |
| 2.0x to 2.9x | 0 (0.0%) | 36 (12.0%) |
| 3.0x to 3.9x | 8 (9.8%) | 97 (32.4%) |
| 4.0x or more | 74 (90.2%) | 40 (13.4%) |
| Total | 82 (100.0%) | 299 (100.0%) |
Real Estate Taxes by Mortgage Status in Aspen Park
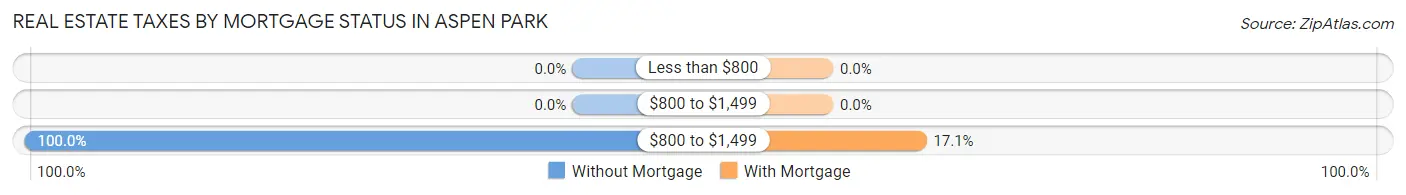
| Property Taxes | Without Mortgage | With Mortgage |
| Less than $800 | 0 (0.0%) | 0 (0.0%) |
| $800 to $1,499 | 0 (0.0%) | 0 (0.0%) |
| $800 to $1,499 | 82 (100.0%) | 51 (17.1%) |
| Total | 82 (100.0%) | 299 (100.0%) |
Health & Disability in Aspen Park
Health Insurance Coverage by Age in Aspen Park
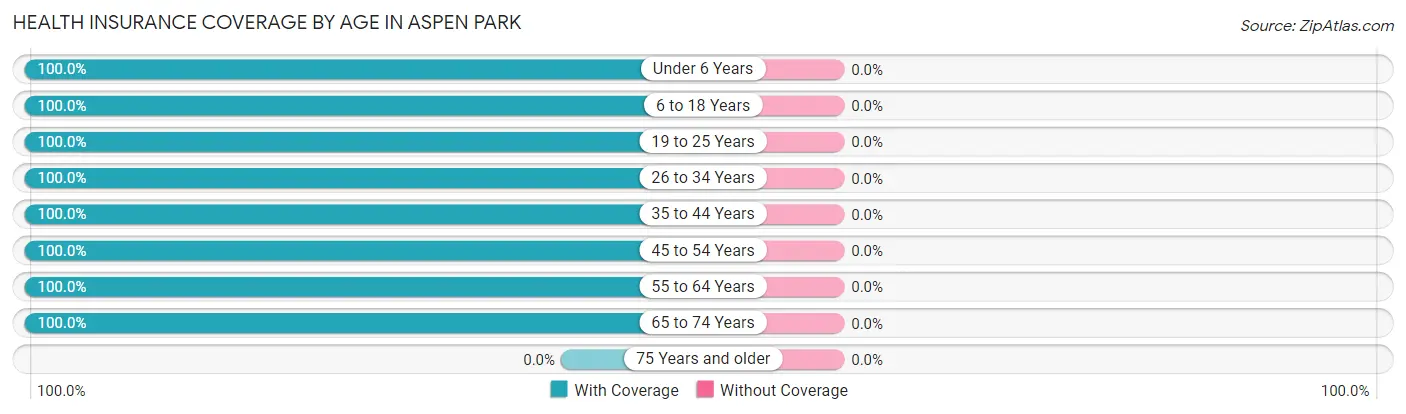
| Age Bracket | With Coverage | Without Coverage |
| Under 6 Years | 148 (100.0%) | 0 (0.0%) |
| 6 to 18 Years | 139 (100.0%) | 0 (0.0%) |
| 19 to 25 Years | 67 (100.0%) | 0 (0.0%) |
| 26 to 34 Years | 50 (100.0%) | 0 (0.0%) |
| 35 to 44 Years | 109 (100.0%) | 0 (0.0%) |
| 45 to 54 Years | 162 (100.0%) | 0 (0.0%) |
| 55 to 64 Years | 237 (100.0%) | 0 (0.0%) |
| 65 to 74 Years | 94 (100.0%) | 0 (0.0%) |
| 75 Years and older | 0 (0.0%) | 0 (0.0%) |
| Total | 1,006 (100.0%) | 0 (0.0%) |
Health Insurance Coverage by Citizenship Status in Aspen Park
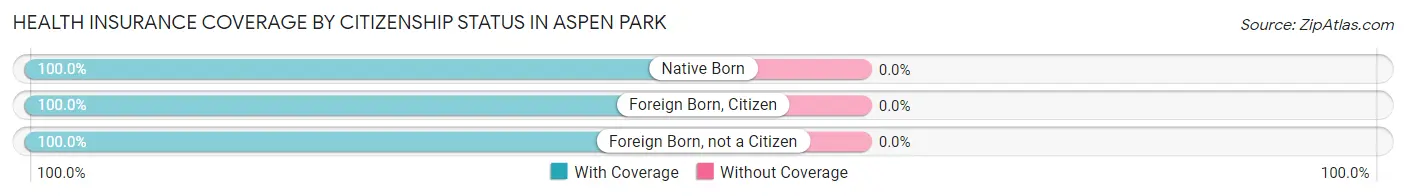
| Citizenship Status | With Coverage | Without Coverage |
| Native Born | 148 (100.0%) | 0 (0.0%) |
| Foreign Born, Citizen | 139 (100.0%) | 0 (0.0%) |
| Foreign Born, not a Citizen | 67 (100.0%) | 0 (0.0%) |
Health Insurance Coverage by Household Income in Aspen Park
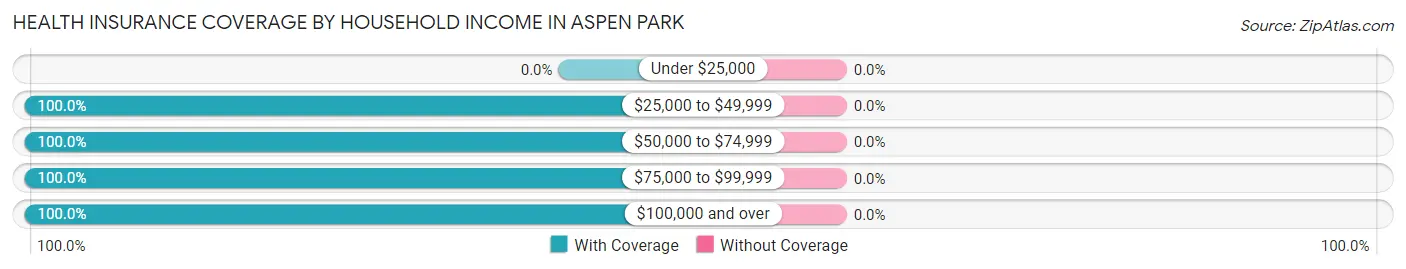
| Household Income | With Coverage | Without Coverage |
| Under $25,000 | 0 (0.0%) | 0 (0.0%) |
| $25,000 to $49,999 | 143 (100.0%) | 0 (0.0%) |
| $50,000 to $74,999 | 81 (100.0%) | 0 (0.0%) |
| $75,000 to $99,999 | 41 (100.0%) | 0 (0.0%) |
| $100,000 and over | 741 (100.0%) | 0 (0.0%) |
Public vs Private Health Insurance Coverage by Age in Aspen Park
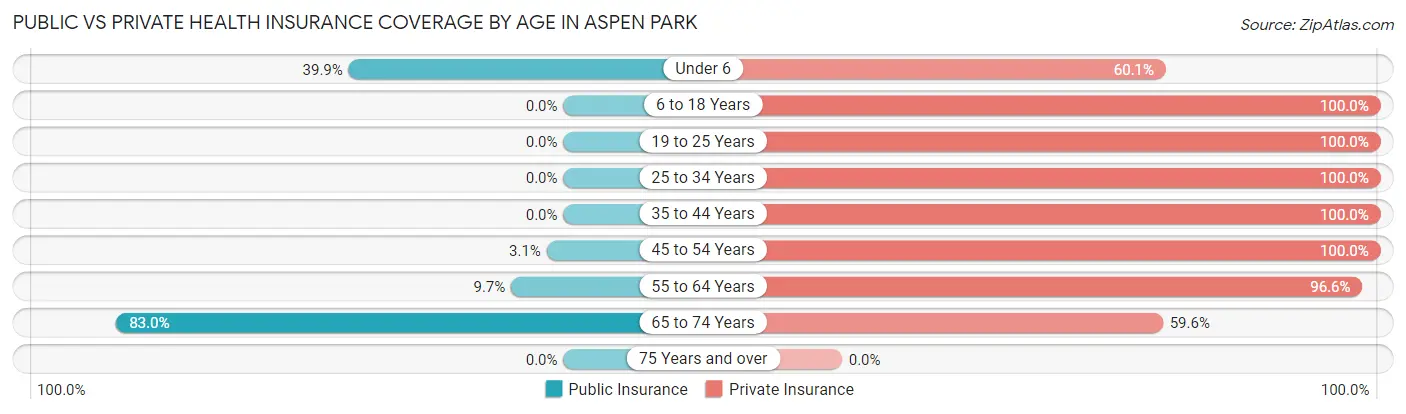
| Age Bracket | Public Insurance | Private Insurance |
| Under 6 | 59 (39.9%) | 89 (60.1%) |
| 6 to 18 Years | 0 (0.0%) | 139 (100.0%) |
| 19 to 25 Years | 0 (0.0%) | 67 (100.0%) |
| 25 to 34 Years | 0 (0.0%) | 50 (100.0%) |
| 35 to 44 Years | 0 (0.0%) | 109 (100.0%) |
| 45 to 54 Years | 5 (3.1%) | 162 (100.0%) |
| 55 to 64 Years | 23 (9.7%) | 229 (96.6%) |
| 65 to 74 Years | 78 (83.0%) | 56 (59.6%) |
| 75 Years and over | 0 (0.0%) | 0 (0.0%) |
| Total | 165 (16.4%) | 901 (89.6%) |
Disability Status by Sex by Age in Aspen Park
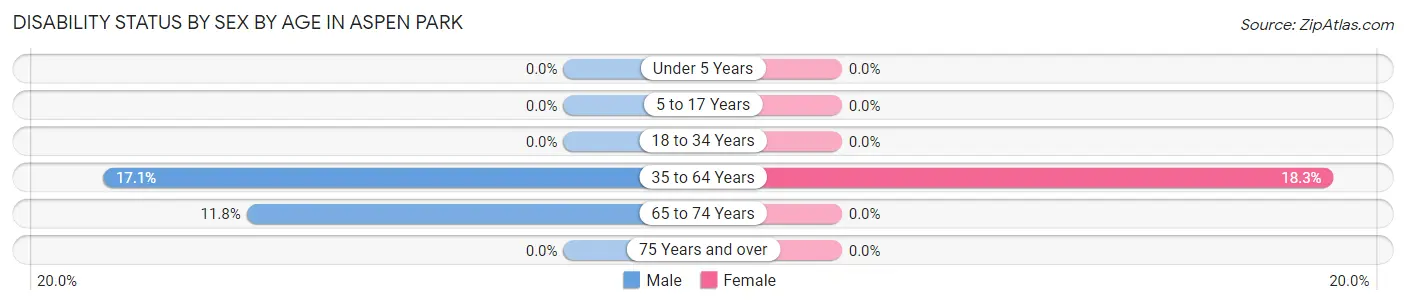
| Age Bracket | Male | Female |
| Under 5 Years | 0 (0.0%) | 0 (0.0%) |
| 5 to 17 Years | 0 (0.0%) | 0 (0.0%) |
| 18 to 34 Years | 0 (0.0%) | 0 (0.0%) |
| 35 to 64 Years | 40 (17.1%) | 50 (18.2%) |
| 65 to 74 Years | 8 (11.8%) | 0 (0.0%) |
| 75 Years and over | 0 (0.0%) | 0 (0.0%) |
Disability Class by Sex by Age in Aspen Park
Disability Class: Hearing Difficulty
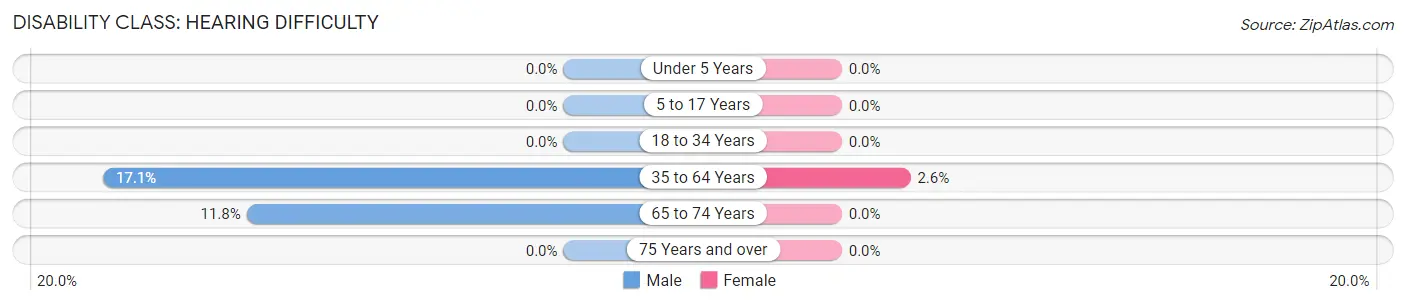
| Age Bracket | Male | Female |
| Under 5 Years | 0 (0.0%) | 0 (0.0%) |
| 5 to 17 Years | 0 (0.0%) | 0 (0.0%) |
| 18 to 34 Years | 0 (0.0%) | 0 (0.0%) |
| 35 to 64 Years | 40 (17.1%) | 7 (2.5%) |
| 65 to 74 Years | 8 (11.8%) | 0 (0.0%) |
| 75 Years and over | 0 (0.0%) | 0 (0.0%) |
Disability Class: Vision Difficulty
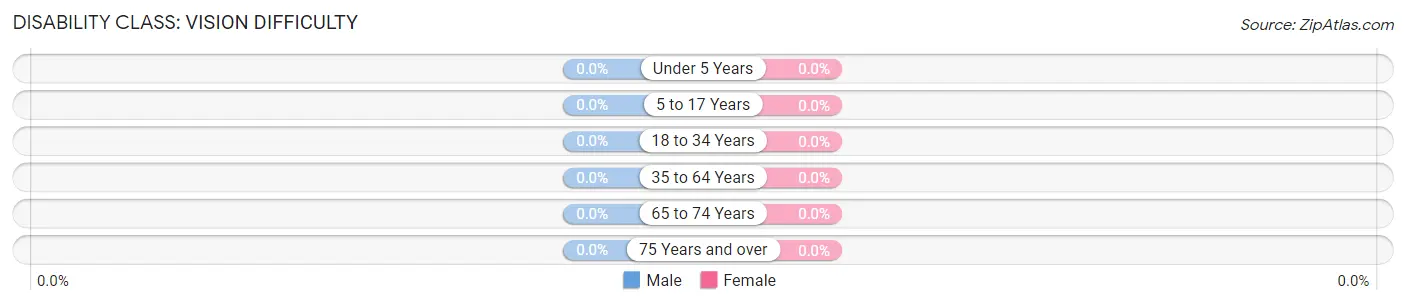
| Age Bracket | Male | Female |
| Under 5 Years | 0 (0.0%) | 0 (0.0%) |
| 5 to 17 Years | 0 (0.0%) | 0 (0.0%) |
| 18 to 34 Years | 0 (0.0%) | 0 (0.0%) |
| 35 to 64 Years | 0 (0.0%) | 0 (0.0%) |
| 65 to 74 Years | 0 (0.0%) | 0 (0.0%) |
| 75 Years and over | 0 (0.0%) | 0 (0.0%) |
Disability Class: Cognitive Difficulty
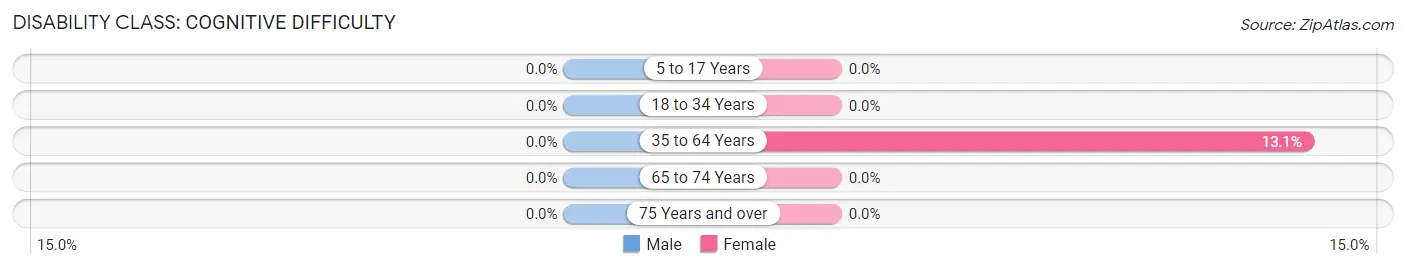
| Age Bracket | Male | Female |
| 5 to 17 Years | 0 (0.0%) | 0 (0.0%) |
| 18 to 34 Years | 0 (0.0%) | 0 (0.0%) |
| 35 to 64 Years | 0 (0.0%) | 36 (13.1%) |
| 65 to 74 Years | 0 (0.0%) | 0 (0.0%) |
| 75 Years and over | 0 (0.0%) | 0 (0.0%) |
Disability Class: Ambulatory Difficulty
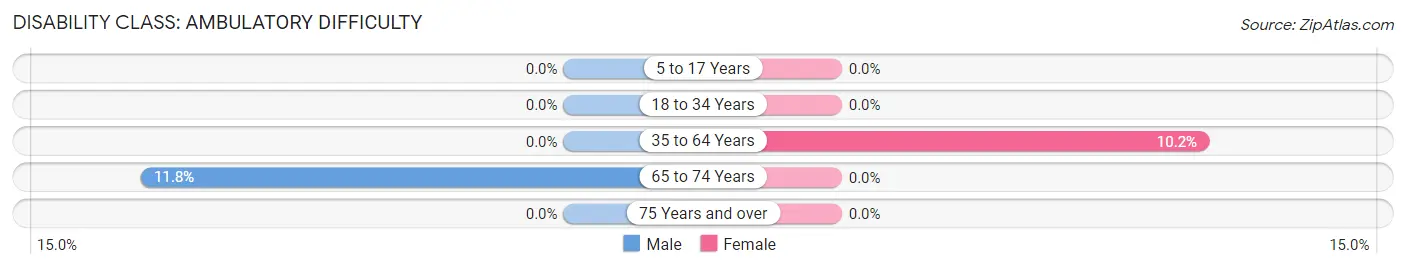
| Age Bracket | Male | Female |
| 5 to 17 Years | 0 (0.0%) | 0 (0.0%) |
| 18 to 34 Years | 0 (0.0%) | 0 (0.0%) |
| 35 to 64 Years | 0 (0.0%) | 28 (10.2%) |
| 65 to 74 Years | 8 (11.8%) | 0 (0.0%) |
| 75 Years and over | 0 (0.0%) | 0 (0.0%) |
Disability Class: Self-Care Difficulty

| Age Bracket | Male | Female |
| 5 to 17 Years | 0 (0.0%) | 0 (0.0%) |
| 18 to 34 Years | 0 (0.0%) | 0 (0.0%) |
| 35 to 64 Years | 0 (0.0%) | 21 (7.7%) |
| 65 to 74 Years | 0 (0.0%) | 0 (0.0%) |
| 75 Years and over | 0 (0.0%) | 0 (0.0%) |
Technology Access in Aspen Park
Computing Device Access in Aspen Park
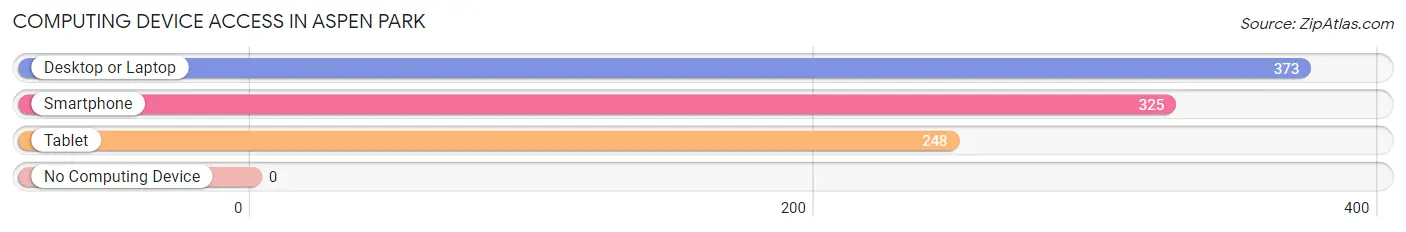
| Device Type | # Households | % Households |
| Desktop or Laptop | 373 | 97.9% |
| Smartphone | 325 | 85.3% |
| Tablet | 248 | 65.1% |
| No Computing Device | 0 | 0.0% |
| Total | 381 | 100.0% |
Internet Access in Aspen Park
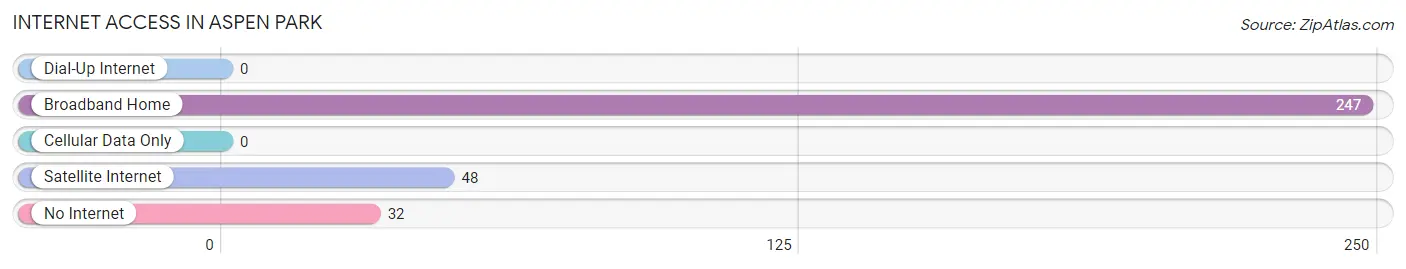
| Internet Type | # Households | % Households |
| Dial-Up Internet | 0 | 0.0% |
| Broadband Home | 247 | 64.8% |
| Cellular Data Only | 0 | 0.0% |
| Satellite Internet | 48 | 12.6% |
| No Internet | 32 | 8.4% |
| Total | 381 | 100.0% |
Aspen Park Summary
Aspen Park is a small unincorporated community located in the foothills of the Rocky Mountains in Jefferson County, Colorado. It is situated at an elevation of 8,000 feet and is surrounded by the Arapaho National Forest. The community is located approximately 25 miles west of Denver and is part of the Denver-Aurora-Lakewood Metropolitan Statistical Area.
History
Aspen Park was first settled in the late 1800s by miners and ranchers. The area was originally known as “Aspen Grove” and was home to a small sawmill. In the early 1900s, the area was renamed “Aspen Park” and the first post office was established in 1906. The town was officially incorporated in 1909 and the first mayor was elected in 1910.
The town grew slowly over the years and by the 1950s, it had a population of around 500 people. In the 1960s, the population began to decline as people moved away from the area in search of better job opportunities. By the 1970s, the population had dropped to around 200 people.
In the 1980s, the town began to experience a resurgence as people began to move back to the area. The population has since grown to around 1,000 people.
Geography
Aspen Park is located in the foothills of the Rocky Mountains in Jefferson County, Colorado. It is situated at an elevation of 8,000 feet and is surrounded by the Arapaho National Forest. The town is located approximately 25 miles west of Denver and is part of the Denver-Aurora-Lakewood Metropolitan Statistical Area.
The town is situated in a valley surrounded by mountains. The nearby mountains include Mount Evans, Mount Bierstadt, and Mount Evans Wilderness. The town is also located near the headwaters of the South Platte River.
Economy
Aspen Park’s economy is largely based on tourism. The town is a popular destination for outdoor recreation, such as hiking, camping, fishing, and skiing. The nearby Arapaho National Forest provides a variety of recreational opportunities.
The town is also home to several small businesses, including restaurants, shops, and lodging. The town is also home to a small airport, which serves as a base for private aircraft.
Demographics
As of the 2010 census, the population of Aspen Park was 1,039. The racial makeup of the town was 94.3% White, 0.7% African American, 0.3% Native American, 0.7% Asian, 0.1% Pacific Islander, 1.7% from other races, and 2.1% from two or more races. Hispanic or Latino of any race were 4.2% of the population.
The median household income in Aspen Park was $50,938 and the median family income was $54,844. The per capita income for the town was $25,945. About 8.3% of families and 10.2% of the population were below the poverty line, including 14.3% of those under age 18 and 4.2% of those age 65 or over.
Aspen Park is served by the Jefferson County School District. The town is home to one elementary school, one middle school, and one high school.
Common Questions
What is Per Capita Income in Aspen Park?
Per Capita income in Aspen Park is $64,699.
What is the Median Family Income in Aspen Park?
Median Family Income in Aspen Park is $196,563.
What is the Median Household income in Aspen Park?
Median Household Income in Aspen Park is $111,964.
What is Income or Wage Gap in Aspen Park?
Income or Wage Gap in Aspen Park is 27.7%.
Women in Aspen Park earn 72.3 cents for every dollar earned by a man.
What is Inequality or Gini Index in Aspen Park?
Inequality or Gini Index in Aspen Park is 0.46.
What is the Total Population of Aspen Park?
Total Population of Aspen Park is 1,006.
What is the Total Male Population of Aspen Park?
Total Male Population of Aspen Park is 506.
What is the Total Female Population of Aspen Park?
Total Female Population of Aspen Park is 500.
What is the Ratio of Males per 100 Females in Aspen Park?
There are 101.20 Males per 100 Females in Aspen Park.
What is the Ratio of Females per 100 Males in Aspen Park?
There are 98.81 Females per 100 Males in Aspen Park.
What is the Median Population Age in Aspen Park?
Median Population Age in Aspen Park is 43.9 Years.
What is the Average Family Size in Aspen Park
Average Family Size in Aspen Park is 3.2 People.
What is the Average Household Size in Aspen Park
Average Household Size in Aspen Park is 2.6 People.
How Large is the Labor Force in Aspen Park?
There are 509 People in the Labor Forcein in Aspen Park.
What is the Percentage of People in the Labor Force in Aspen Park?
68.6% of People are in the Labor Force in Aspen Park.