Columbine Valley, CO Map & Demographics
Columbine Valley Map
Columbine Valley Overview
$143,372
PER CAPITA INCOME
$250,001
AVG FAMILY INCOME
$250,001
AVG HOUSEHOLD INCOME
75.6%
WAGE / INCOME GAP [ % ]
24.4¢/ $1
WAGE / INCOME GAP [ $ ]
0.45
INEQUALITY / GINI INDEX
1,928
TOTAL POPULATION
961
MALE POPULATION
967
FEMALE POPULATION
99.38
MALES / 100 FEMALES
100.62
FEMALES / 100 MALES
51.7
MEDIAN AGE
2.9
AVG FAMILY SIZE
2.7
AVG HOUSEHOLD SIZE
816
LABOR FORCE [ PEOPLE ]
52.6%
PERCENT IN LABOR FORCE
0.5%
UNEMPLOYMENT RATE
Income in Columbine Valley
Income Overview in Columbine Valley
Per Capita Income in Columbine Valley is $143,372, while median incomes of families and households are $250,001 and $250,001 respectively.
| Characteristic | Number | Measure |
| Per Capita Income | 1,928 | $143,372 |
| Median Family Income | 630 | $250,001 |
| Mean Family Income | 630 | $399,327 |
| Median Household Income | 717 | $250,001 |
| Mean Household Income | 717 | $379,990 |
| Income Deficit | 630 | $0 |
| Wage / Income Gap (%) | 1,928 | 75.58% |
| Wage / Income Gap ($) | 1,928 | 24.42¢ per $1 |
| Gini / Inequality Index | 1,928 | 0.45 |
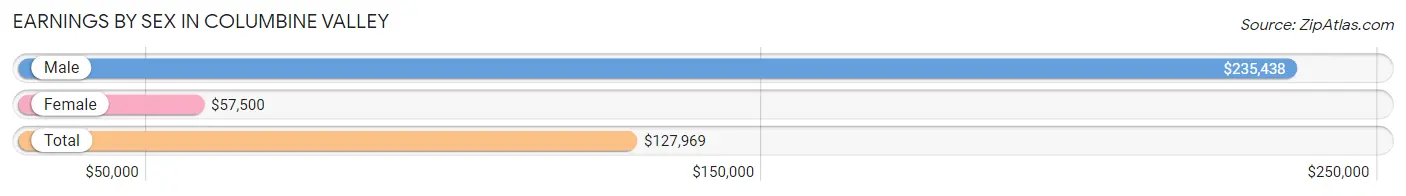
Earnings by Sex in Columbine Valley
Average Earnings in Columbine Valley are $127,969, $235,438 for men and $57,500 for women, a difference of 75.6%.
| Sex | Number | Average Earnings |
| Male | 571 (62.4%) | $235,438 |
| Female | 344 (37.6%) | $57,500 |
| Total | 915 (100.0%) | $127,969 |
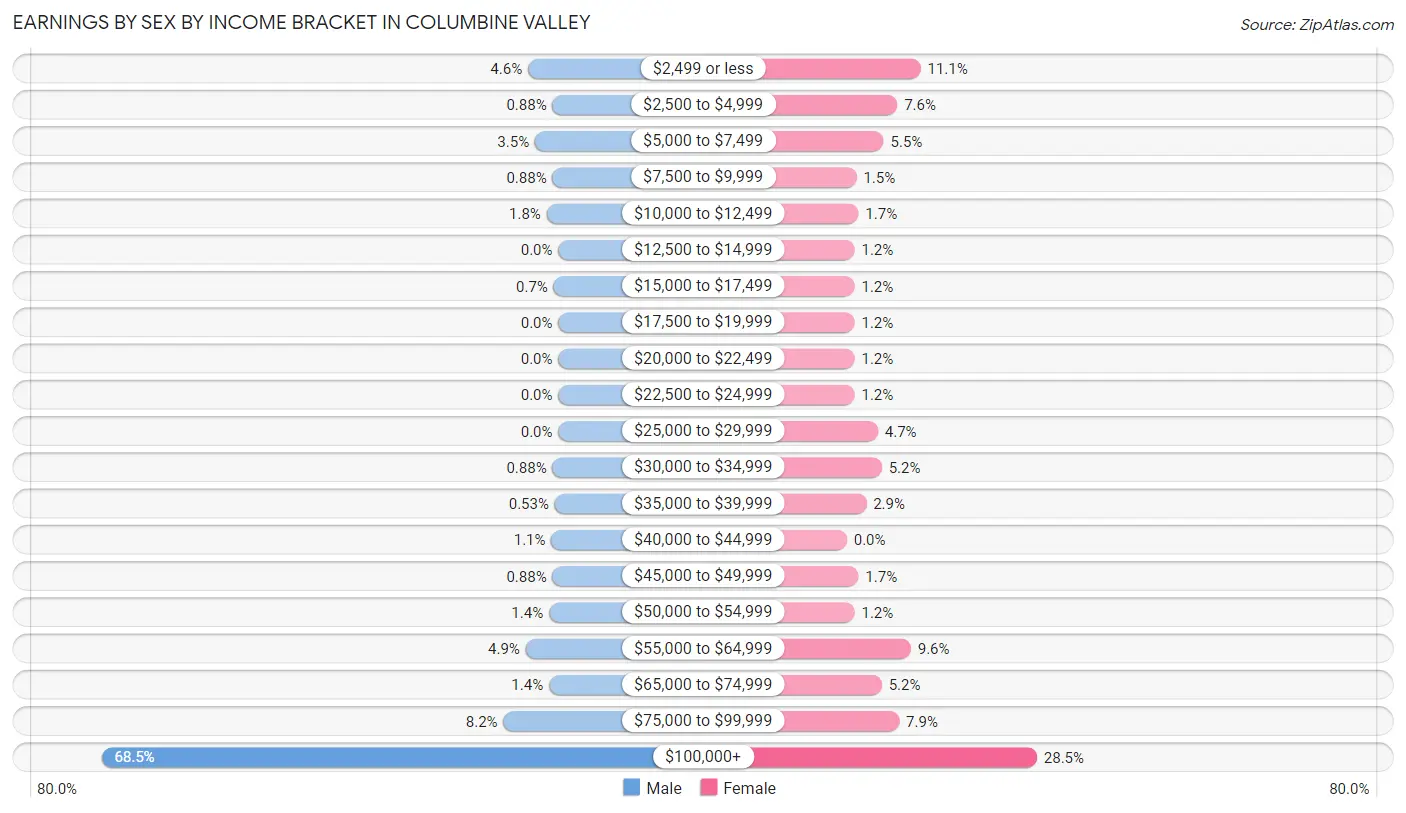
Earnings by Sex by Income Bracket in Columbine Valley
The most common earnings brackets in Columbine Valley are $100,000+ for men (391 | 68.5%) and $100,000+ for women (98 | 28.5%).
| Income | Male | Female |
| $2,499 or less | 26 (4.5%) | 38 (11.1%) |
| $2,500 to $4,999 | 5 (0.9%) | 26 (7.6%) |
| $5,000 to $7,499 | 20 (3.5%) | 19 (5.5%) |
| $7,500 to $9,999 | 5 (0.9%) | 5 (1.5%) |
| $10,000 to $12,499 | 10 (1.8%) | 6 (1.7%) |
| $12,500 to $14,999 | 0 (0.0%) | 4 (1.2%) |
| $15,000 to $17,499 | 4 (0.7%) | 4 (1.2%) |
| $17,500 to $19,999 | 0 (0.0%) | 4 (1.2%) |
| $20,000 to $22,499 | 0 (0.0%) | 4 (1.2%) |
| $22,500 to $24,999 | 0 (0.0%) | 4 (1.2%) |
| $25,000 to $29,999 | 0 (0.0%) | 16 (4.6%) |
| $30,000 to $34,999 | 5 (0.9%) | 18 (5.2%) |
| $35,000 to $39,999 | 3 (0.5%) | 10 (2.9%) |
| $40,000 to $44,999 | 6 (1.1%) | 0 (0.0%) |
| $45,000 to $49,999 | 5 (0.9%) | 6 (1.7%) |
| $50,000 to $54,999 | 8 (1.4%) | 4 (1.2%) |
| $55,000 to $64,999 | 28 (4.9%) | 33 (9.6%) |
| $65,000 to $74,999 | 8 (1.4%) | 18 (5.2%) |
| $75,000 to $99,999 | 47 (8.2%) | 27 (7.9%) |
| $100,000+ | 391 (68.5%) | 98 (28.5%) |
| Total | 571 (100.0%) | 344 (100.0%) |
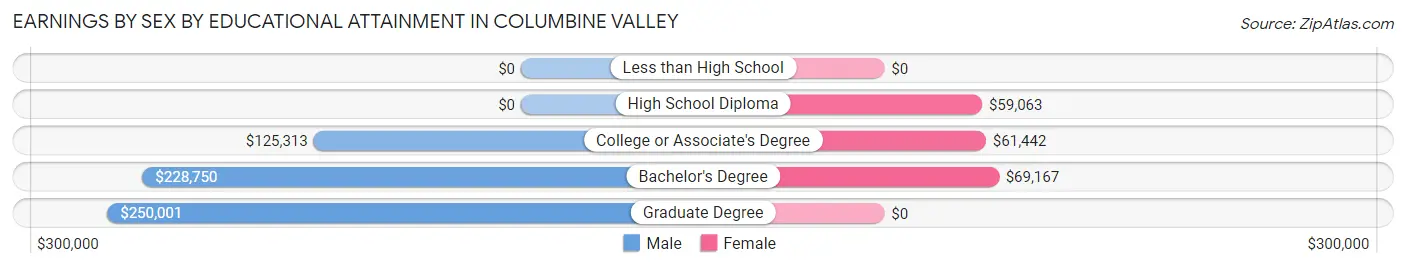
Earnings by Sex by Educational Attainment in Columbine Valley
Average earnings in Columbine Valley are $237,125 for men and $64,219 for women, a difference of 72.9%. Men with an educational attainment of graduate degree enjoy the highest average annual earnings of $250,001, while those with college or associate's degree education earn the least with $125,313. Women with an educational attainment of bachelor's degree earn the most with the average annual earnings of $69,167, while those with high school diploma education have the smallest earnings of $59,063.
| Educational Attainment | Male Income | Female Income |
| Less than High School | - | - |
| High School Diploma | - | - |
| College or Associate's Degree | $125,313 | $61,442 |
| Bachelor's Degree | $228,750 | $69,167 |
| Graduate Degree | $250,001 | $0 |
| Total | $237,125 | $64,219 |
Family Income in Columbine Valley
Family Income Brackets in Columbine Valley
According to the Columbine Valley family income data, there are 429 families falling into the $200,000+ income range, which is the most common income bracket and makes up 68.1% of all families.
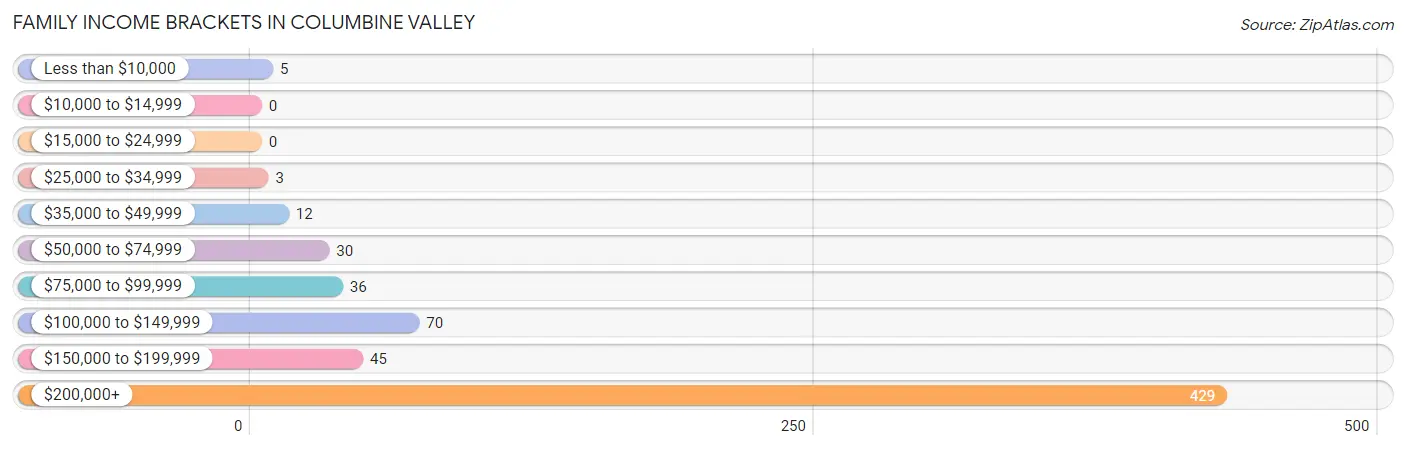
| Income Bracket | # Families | % Families |
| Less than $10,000 | 5 | 0.8% |
| $10,000 to $14,999 | 0 | 0.0% |
| $15,000 to $24,999 | 0 | 0.0% |
| $25,000 to $34,999 | 3 | 0.5% |
| $35,000 to $49,999 | 12 | 1.9% |
| $50,000 to $74,999 | 30 | 4.8% |
| $75,000 to $99,999 | 36 | 5.7% |
| $100,000 to $149,999 | 70 | 11.1% |
| $150,000 to $199,999 | 45 | 7.1% |
| $200,000+ | 429 | 68.1% |
Family Income by Famaliy Size in Columbine Valley
2-person families (349 | 55.4%) account for the highest median family income in Columbine Valley with $250,001 per family, while 2-person families (349 | 55.4%) have the highest median income of $125,000 per family member.
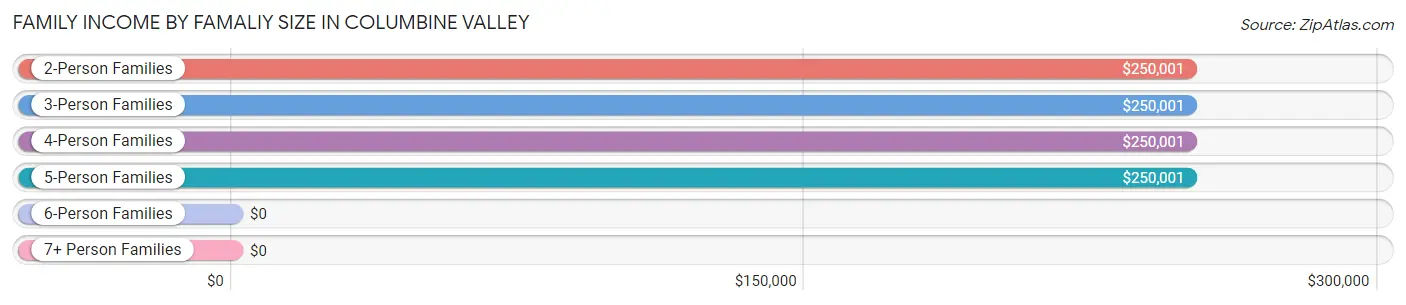
| Income Bracket | # Families | Median Income |
| 2-Person Families | 349 (55.4%) | $250,001 |
| 3-Person Families | 68 (10.8%) | $250,001 |
| 4-Person Families | 141 (22.4%) | $250,001 |
| 5-Person Families | 72 (11.4%) | $250,001 |
| 6-Person Families | 0 (0.0%) | $0 |
| 7+ Person Families | 0 (0.0%) | $0 |
| Total | 630 (100.0%) | $250,001 |
Family Income by Number of Earners in Columbine Valley
The median family income in Columbine Valley is $250,001, with families comprising 1 earner (284) having the highest median family income of $250,001, while families with no earners (90) have the lowest median family income of $107,500, accounting for 45.1% and 14.3% of families, respectively.
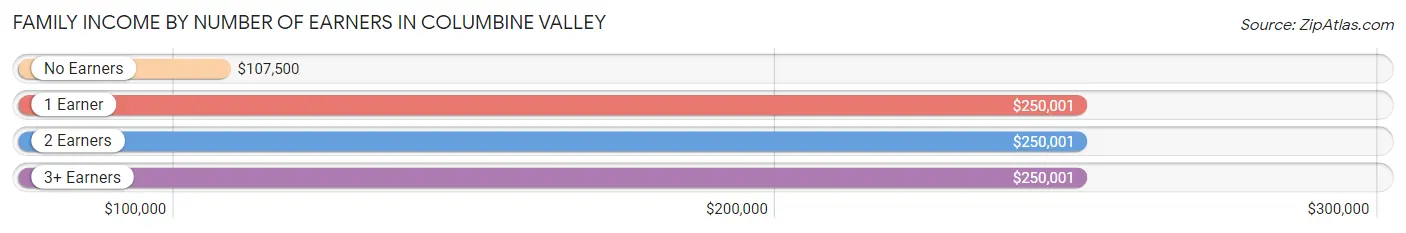
| Number of Earners | # Families | Median Income |
| No Earners | 90 (14.3%) | $107,500 |
| 1 Earner | 284 (45.1%) | $250,001 |
| 2 Earners | 201 (31.9%) | $250,001 |
| 3+ Earners | 55 (8.7%) | $250,001 |
| Total | 630 (100.0%) | $250,001 |
Household Income in Columbine Valley
Household Income Brackets in Columbine Valley
With 448 households falling in the category, the $200,000+ income range is the most frequent in Columbine Valley, accounting for 62.5% of all households.
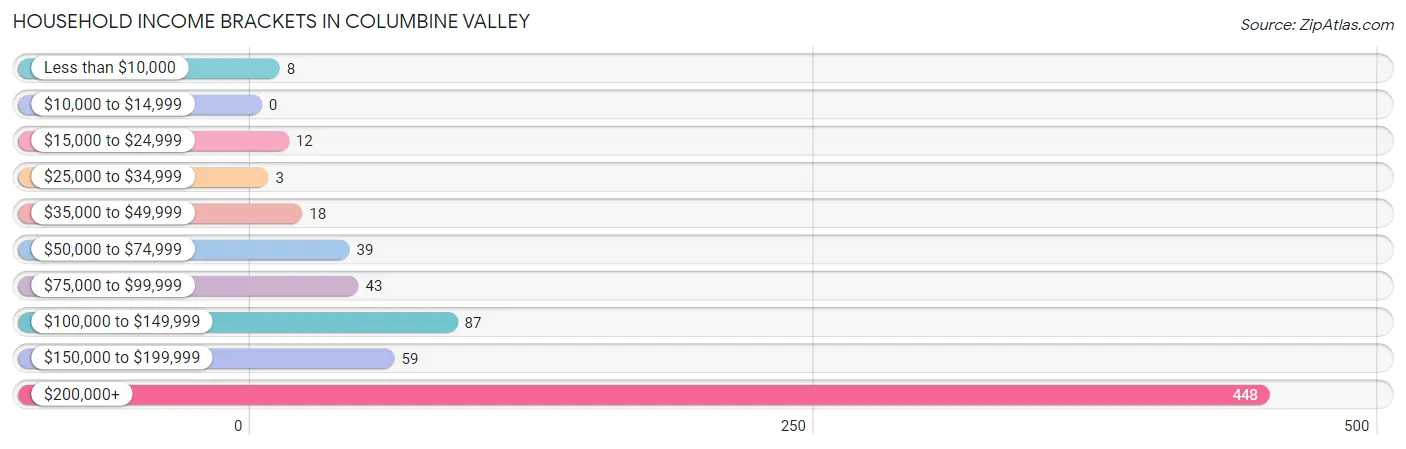
| Income Bracket | # Households | % Households |
| Less than $10,000 | 8 | 1.1% |
| $10,000 to $14,999 | 0 | 0.0% |
| $15,000 to $24,999 | 12 | 1.7% |
| $25,000 to $34,999 | 3 | 0.4% |
| $35,000 to $49,999 | 18 | 2.5% |
| $50,000 to $74,999 | 39 | 5.4% |
| $75,000 to $99,999 | 43 | 6.0% |
| $100,000 to $149,999 | 87 | 12.1% |
| $150,000 to $199,999 | 59 | 8.2% |
| $200,000+ | 448 | 62.5% |
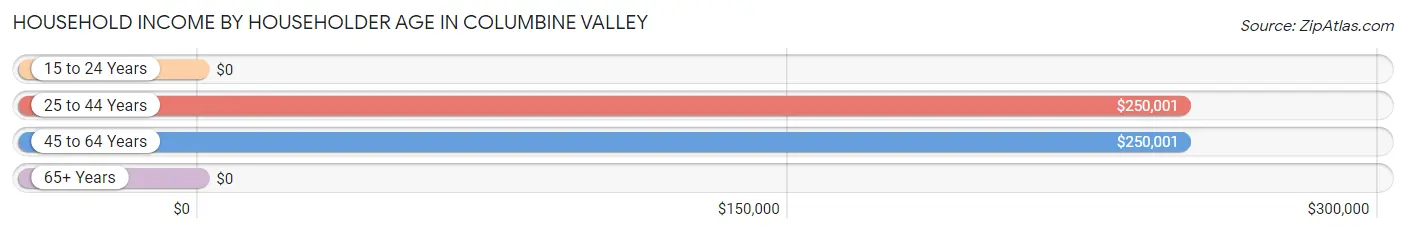
Household Income by Householder Age in Columbine Valley
The median household income in Columbine Valley is $250,001, with the highest median household income of $250,001 found in the 25 to 44 years age bracket for the primary householder. A total of 104 households (14.5%) fall into this category.
| Income Bracket | # Households | Median Income |
| 15 to 24 Years | 0 (0.0%) | $0 |
| 25 to 44 Years | 104 (14.5%) | $250,001 |
| 45 to 64 Years | 253 (35.3%) | $250,001 |
| 65+ Years | 360 (50.2%) | $0 |
| Total | 717 (100.0%) | $250,001 |
Poverty in Columbine Valley
Income Below Poverty by Sex and Age in Columbine Valley
With 0.5% poverty level for males and 1.2% for females among the residents of Columbine Valley, 65 to 74 year old males and 45 to 54 year old females are the most vulnerable to poverty, with 5 males (2.1%) and 5 females (4.1%) in their respective age groups living below the poverty level.
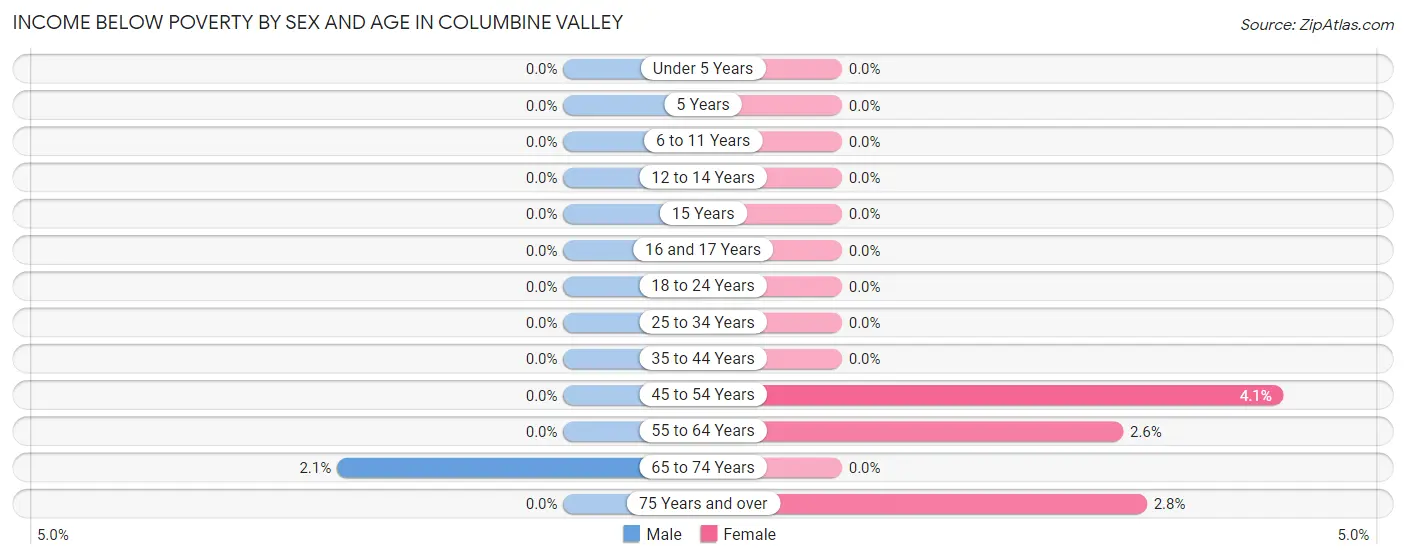
| Age Bracket | Male | Female |
| Under 5 Years | 0 (0.0%) | 0 (0.0%) |
| 5 Years | 0 (0.0%) | 0 (0.0%) |
| 6 to 11 Years | 0 (0.0%) | 0 (0.0%) |
| 12 to 14 Years | 0 (0.0%) | 0 (0.0%) |
| 15 Years | 0 (0.0%) | 0 (0.0%) |
| 16 and 17 Years | 0 (0.0%) | 0 (0.0%) |
| 18 to 24 Years | 0 (0.0%) | 0 (0.0%) |
| 25 to 34 Years | 0 (0.0%) | 0 (0.0%) |
| 35 to 44 Years | 0 (0.0%) | 0 (0.0%) |
| 45 to 54 Years | 0 (0.0%) | 5 (4.1%) |
| 55 to 64 Years | 0 (0.0%) | 4 (2.6%) |
| 65 to 74 Years | 5 (2.1%) | 0 (0.0%) |
| 75 Years and over | 0 (0.0%) | 3 (2.8%) |
| Total | 5 (0.5%) | 12 (1.2%) |
Income Above Poverty by Sex and Age in Columbine Valley
According to the poverty statistics in Columbine Valley, males aged under 5 years and females aged under 5 years are the age groups that are most secure financially, with 100.0% of males and 100.0% of females in these age groups living above the poverty line.
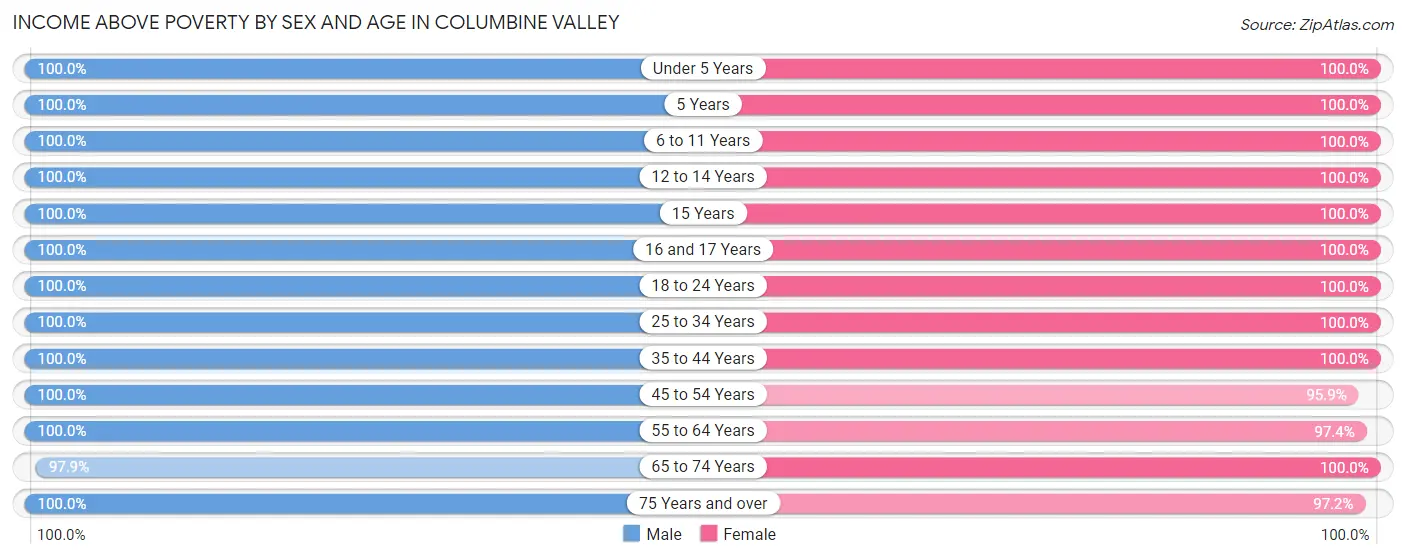
| Age Bracket | Male | Female |
| Under 5 Years | 26 (100.0%) | 44 (100.0%) |
| 5 Years | 17 (100.0%) | 4 (100.0%) |
| 6 to 11 Years | 97 (100.0%) | 84 (100.0%) |
| 12 to 14 Years | 52 (100.0%) | 39 (100.0%) |
| 15 Years | 3 (100.0%) | 11 (100.0%) |
| 16 and 17 Years | 24 (100.0%) | 17 (100.0%) |
| 18 to 24 Years | 52 (100.0%) | 64 (100.0%) |
| 25 to 34 Years | 2 (100.0%) | 20 (100.0%) |
| 35 to 44 Years | 122 (100.0%) | 116 (100.0%) |
| 45 to 54 Years | 115 (100.0%) | 117 (95.9%) |
| 55 to 64 Years | 141 (100.0%) | 149 (97.4%) |
| 65 to 74 Years | 233 (97.9%) | 187 (100.0%) |
| 75 Years and over | 72 (100.0%) | 103 (97.2%) |
| Total | 956 (99.5%) | 955 (98.8%) |
Income Below Poverty Among Married-Couple Families in Columbine Valley
The poverty statistics for married-couple families in Columbine Valley show that 0.8% or 5 of the total 599 families live below the poverty line. Families with no children have the highest poverty rate of 1.3%, comprising of 5 families. On the other hand, families with 1 or 2 children have the lowest poverty rate of 0.0%, which includes 0 families.
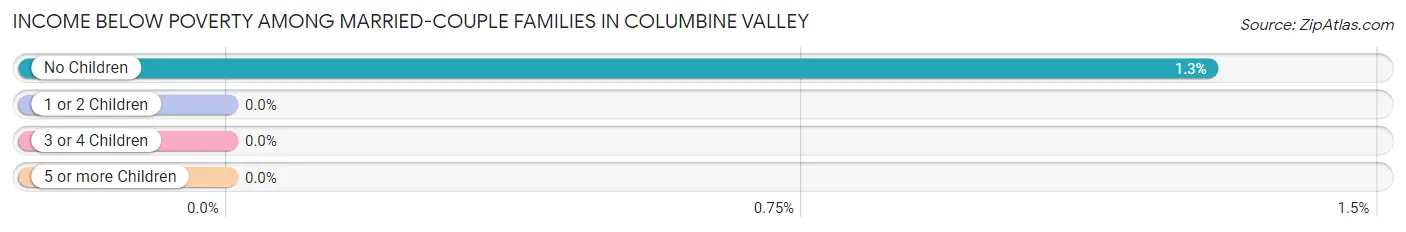
| Children | Above Poverty | Below Poverty |
| No Children | 387 (98.7%) | 5 (1.3%) |
| 1 or 2 Children | 151 (100.0%) | 0 (0.0%) |
| 3 or 4 Children | 56 (100.0%) | 0 (0.0%) |
| 5 or more Children | 0 (0.0%) | 0 (0.0%) |
| Total | 594 (99.2%) | 5 (0.8%) |
Income Below Poverty Among Single-Parent Households in Columbine Valley
| Children | Single Father | Single Mother |
| No Children | 0 (0.0%) | 0 (0.0%) |
| 1 or 2 Children | 0 (0.0%) | 0 (0.0%) |
| 3 or 4 Children | 0 (0.0%) | 0 (0.0%) |
| 5 or more Children | 0 (0.0%) | 0 (0.0%) |
| Total | 0 (0.0%) | 0 (0.0%) |
Income Below Poverty Among Married-Couple vs Single-Parent Households in Columbine Valley
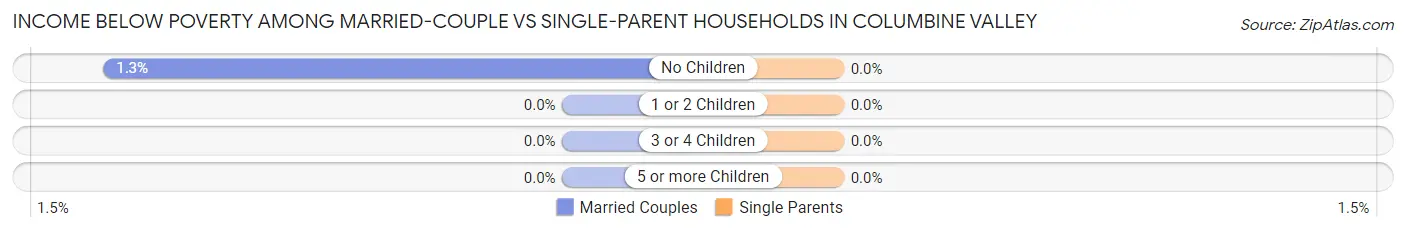
| Children | Married-Couple Families | Single-Parent Households |
| No Children | 5 (1.3%) | 0 (0.0%) |
| 1 or 2 Children | 0 (0.0%) | 0 (0.0%) |
| 3 or 4 Children | 0 (0.0%) | 0 (0.0%) |
| 5 or more Children | 0 (0.0%) | 0 (0.0%) |
| Total | 5 (0.8%) | 0 (0.0%) |
Race in Columbine Valley
The most populous races in Columbine Valley are White / Caucasian (1,828 | 94.8%), Two or more Races (71 | 3.7%), and Hispanic or Latino (37 | 1.9%).
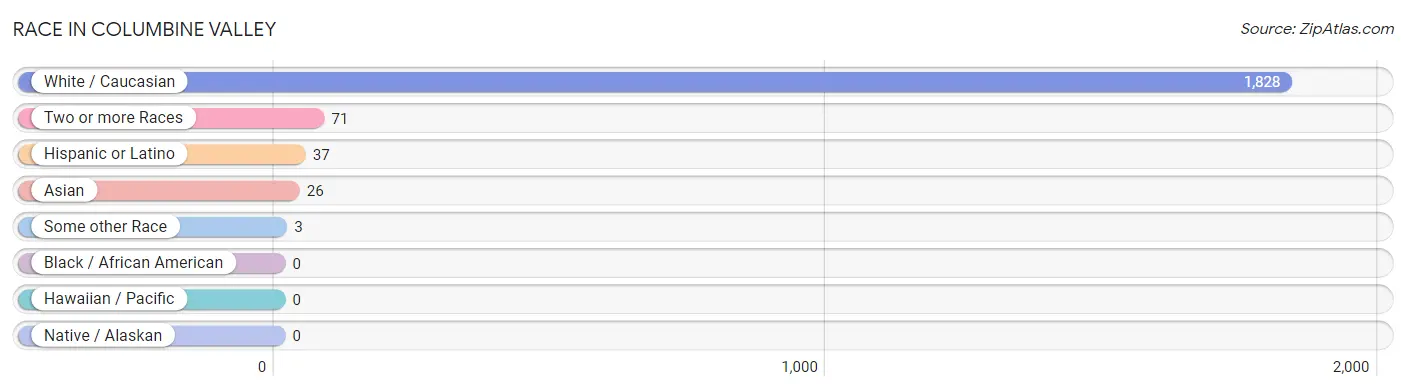
| Race | # Population | % Population |
| Asian | 26 | 1.3% |
| Black / African American | 0 | 0.0% |
| Hawaiian / Pacific | 0 | 0.0% |
| Hispanic or Latino | 37 | 1.9% |
| Native / Alaskan | 0 | 0.0% |
| White / Caucasian | 1,828 | 94.8% |
| Two or more Races | 71 | 3.7% |
| Some other Race | 3 | 0.2% |
| Total | 1,928 | 100.0% |
Ancestry in Columbine Valley
The most populous ancestries reported in Columbine Valley are German (622 | 32.3%), Irish (474 | 24.6%), English (275 | 14.3%), Italian (148 | 7.7%), and American (78 | 4.1%), together accounting for 82.8% of all Columbine Valley residents.
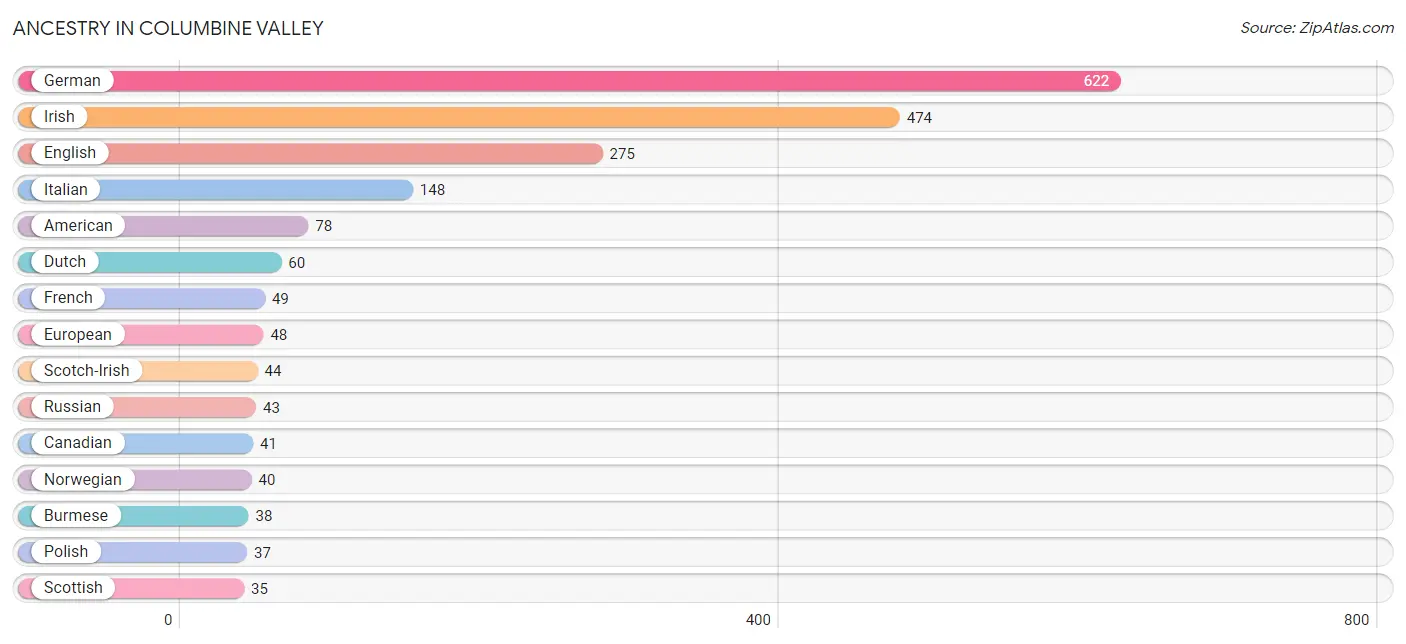
| Ancestry | # Population | % Population |
| American | 78 | 4.1% |
| Arab | 3 | 0.2% |
| Basque | 20 | 1.0% |
| Bhutanese | 4 | 0.2% |
| British | 4 | 0.2% |
| Bulgarian | 5 | 0.3% |
| Burmese | 38 | 2.0% |
| Canadian | 41 | 2.1% |
| Central American | 6 | 0.3% |
| Colombian | 15 | 0.8% |
| Costa Rican | 6 | 0.3% |
| Croatian | 3 | 0.2% |
| Czech | 9 | 0.5% |
| Danish | 6 | 0.3% |
| Dutch | 60 | 3.1% |
| Eastern European | 24 | 1.2% |
| English | 275 | 14.3% |
| European | 48 | 2.5% |
| French | 49 | 2.5% |
| German | 622 | 32.3% |
| Greek | 6 | 0.3% |
| Hungarian | 3 | 0.2% |
| Indian (Asian) | 23 | 1.2% |
| Irish | 474 | 24.6% |
| Israeli | 3 | 0.2% |
| Italian | 148 | 7.7% |
| Korean | 19 | 1.0% |
| Lebanese | 3 | 0.2% |
| Mexican | 16 | 0.8% |
| Navajo | 13 | 0.7% |
| Northern European | 10 | 0.5% |
| Norwegian | 40 | 2.1% |
| Polish | 37 | 1.9% |
| Russian | 43 | 2.2% |
| Scandinavian | 11 | 0.6% |
| Scotch-Irish | 44 | 2.3% |
| Scottish | 35 | 1.8% |
| Serbian | 13 | 0.7% |
| Slavic | 3 | 0.2% |
| South American | 15 | 0.8% |
| Swedish | 23 | 1.2% |
| Swiss | 18 | 0.9% |
| Welsh | 4 | 0.2% | View All 43 Rows |
Immigrants in Columbine Valley
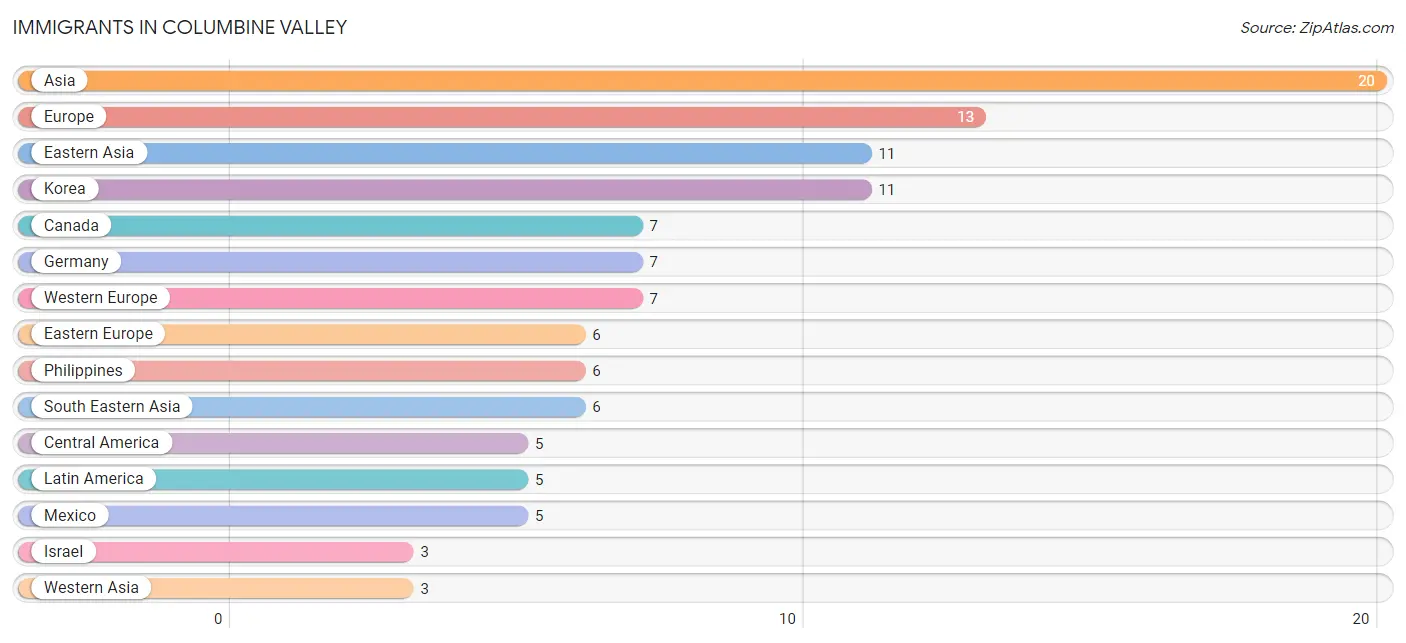
The most numerous immigrant groups reported in Columbine Valley came from Asia (20 | 1.0%), Europe (13 | 0.7%), Eastern Asia (11 | 0.6%), Korea (11 | 0.6%), and Canada (7 | 0.4%), together accounting for 3.2% of all Columbine Valley residents.
| Immigration Origin | # Population | % Population |
| Asia | 20 | 1.0% |
| Canada | 7 | 0.4% |
| Central America | 5 | 0.3% |
| Eastern Asia | 11 | 0.6% |
| Eastern Europe | 6 | 0.3% |
| Europe | 13 | 0.7% |
| Germany | 7 | 0.4% |
| Israel | 3 | 0.2% |
| Korea | 11 | 0.6% |
| Latin America | 5 | 0.3% |
| Mexico | 5 | 0.3% |
| Philippines | 6 | 0.3% |
| South Eastern Asia | 6 | 0.3% |
| Western Asia | 3 | 0.2% |
| Western Europe | 7 | 0.4% | View All 15 Rows |
Sex and Age in Columbine Valley
Sex and Age in Columbine Valley
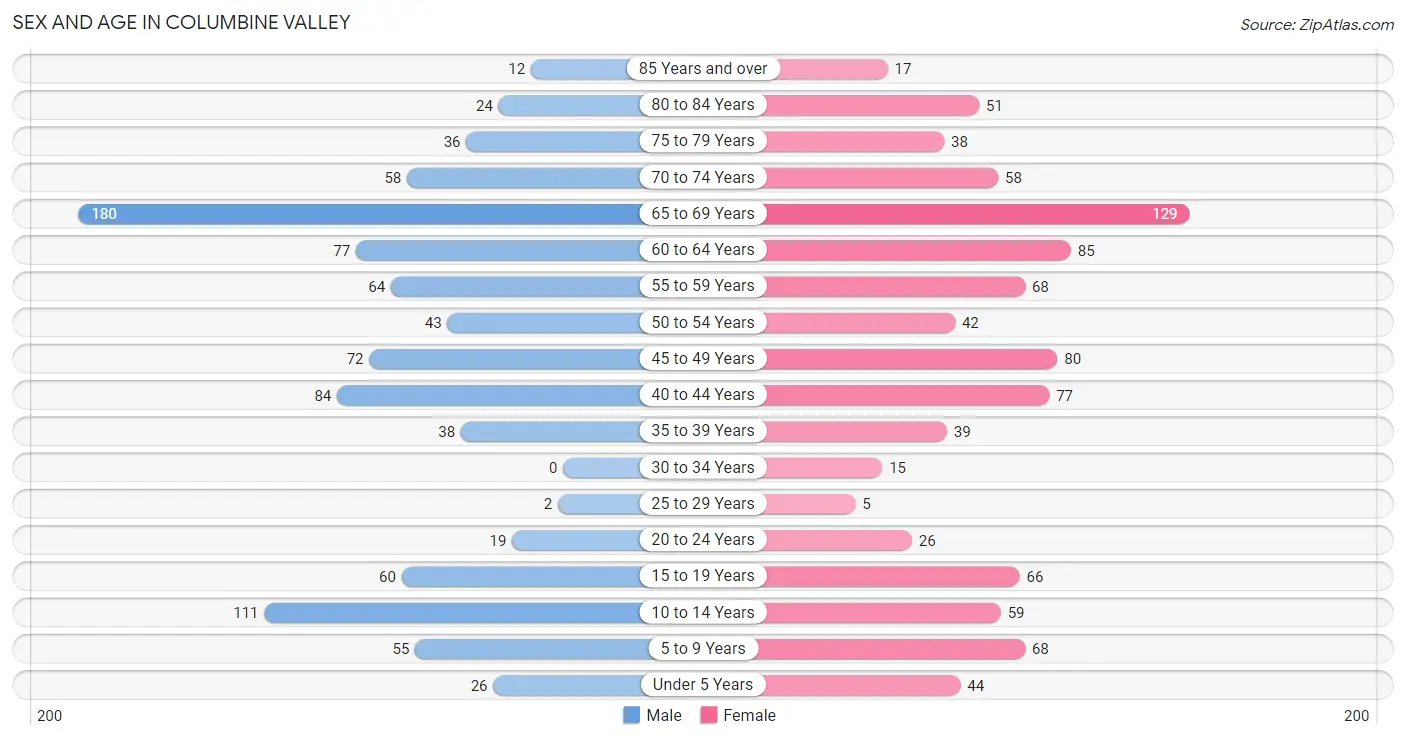
The most populous age groups in Columbine Valley are 65 to 69 Years (180 | 18.7%) for men and 65 to 69 Years (129 | 13.3%) for women.
| Age Bracket | Male | Female |
| Under 5 Years | 26 (2.7%) | 44 (4.5%) |
| 5 to 9 Years | 55 (5.7%) | 68 (7.0%) |
| 10 to 14 Years | 111 (11.6%) | 59 (6.1%) |
| 15 to 19 Years | 60 (6.2%) | 66 (6.8%) |
| 20 to 24 Years | 19 (2.0%) | 26 (2.7%) |
| 25 to 29 Years | 2 (0.2%) | 5 (0.5%) |
| 30 to 34 Years | 0 (0.0%) | 15 (1.5%) |
| 35 to 39 Years | 38 (4.0%) | 39 (4.0%) |
| 40 to 44 Years | 84 (8.7%) | 77 (8.0%) |
| 45 to 49 Years | 72 (7.5%) | 80 (8.3%) |
| 50 to 54 Years | 43 (4.5%) | 42 (4.3%) |
| 55 to 59 Years | 64 (6.7%) | 68 (7.0%) |
| 60 to 64 Years | 77 (8.0%) | 85 (8.8%) |
| 65 to 69 Years | 180 (18.7%) | 129 (13.3%) |
| 70 to 74 Years | 58 (6.0%) | 58 (6.0%) |
| 75 to 79 Years | 36 (3.7%) | 38 (3.9%) |
| 80 to 84 Years | 24 (2.5%) | 51 (5.3%) |
| 85 Years and over | 12 (1.3%) | 17 (1.8%) |
| Total | 961 (100.0%) | 967 (100.0%) |
Families and Households in Columbine Valley
Median Family Size in Columbine Valley
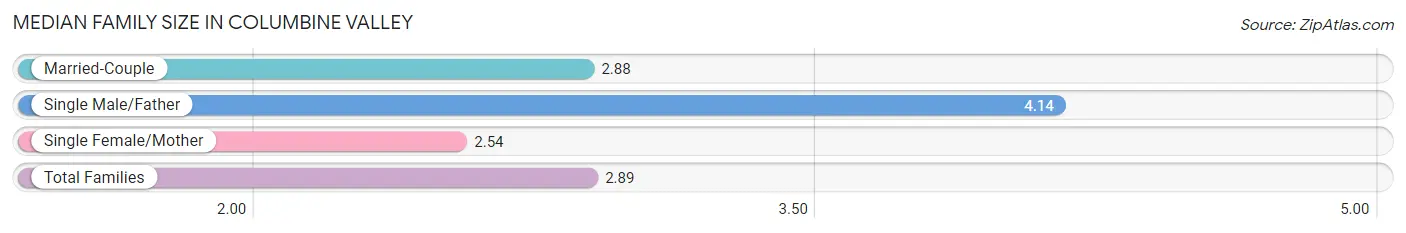
The median family size in Columbine Valley is 2.89 persons per family, with single male/father families (7 | 1.1%) accounting for the largest median family size of 4.14 persons per family. On the other hand, single female/mother families (24 | 3.8%) represent the smallest median family size with 2.54 persons per family.
| Family Type | # Families | Family Size |
| Married-Couple | 599 (95.1%) | 2.88 |
| Single Male/Father | 7 (1.1%) | 4.14 |
| Single Female/Mother | 24 (3.8%) | 2.54 |
| Total Families | 630 (100.0%) | 2.89 |
Median Household Size in Columbine Valley
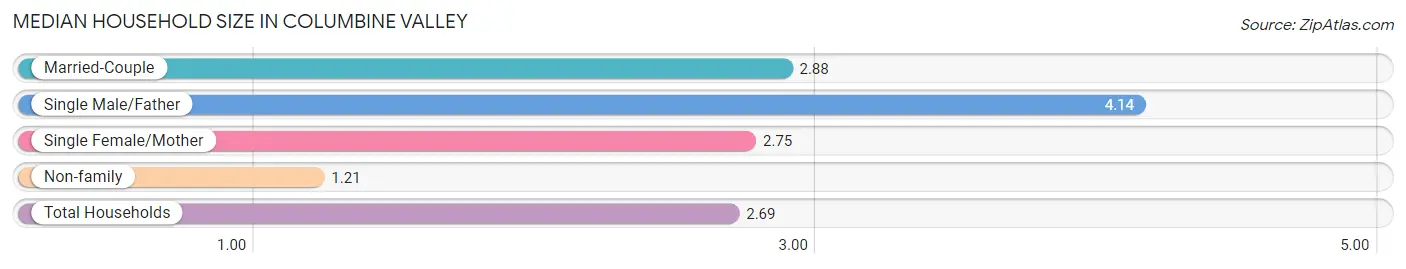
The median household size in Columbine Valley is 2.69 persons per household, with single male/father households (7 | 1.0%) accounting for the largest median household size of 4.14 persons per household. non-family households (87 | 12.1%) represent the smallest median household size with 1.21 persons per household.
| Household Type | # Households | Household Size |
| Married-Couple | 599 (83.5%) | 2.88 |
| Single Male/Father | 7 (1.0%) | 4.14 |
| Single Female/Mother | 24 (3.4%) | 2.75 |
| Non-family | 87 (12.1%) | 1.21 |
| Total Households | 717 (100.0%) | 2.69 |
Household Size by Marriage Status in Columbine Valley
Out of a total of 717 households in Columbine Valley, 630 (87.9%) are family households, while 87 (12.1%) are nonfamily households. The most numerous type of family households are 2-person households, comprising 345, and the most common type of nonfamily households are 1-person households, comprising 67.
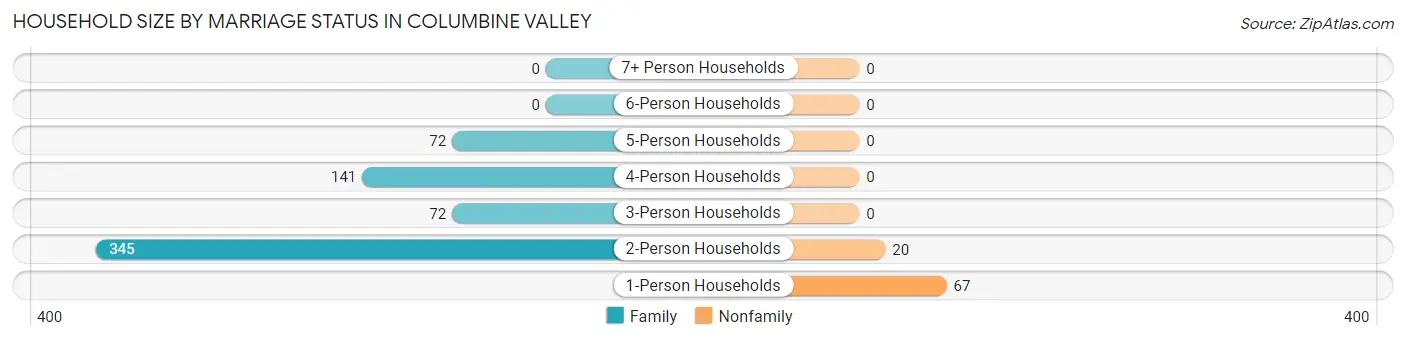
| Household Size | Family Households | Nonfamily Households |
| 1-Person Households | - | 67 (9.3%) |
| 2-Person Households | 345 (48.1%) | 20 (2.8%) |
| 3-Person Households | 72 (10.0%) | 0 (0.0%) |
| 4-Person Households | 141 (19.7%) | 0 (0.0%) |
| 5-Person Households | 72 (10.0%) | 0 (0.0%) |
| 6-Person Households | 0 (0.0%) | 0 (0.0%) |
| 7+ Person Households | 0 (0.0%) | 0 (0.0%) |
| Total | 630 (87.9%) | 87 (12.1%) |
Female Fertility in Columbine Valley
Fertility by Age in Columbine Valley
Average fertility rate in Columbine Valley is 13.0 births per 1,000 women. Women in the age bracket of 35 to 50 years have the highest fertility rate with 20.0 births per 1,000 women. Women in the age bracket of 35 to 50 years acount for 100.0% of all women with births.
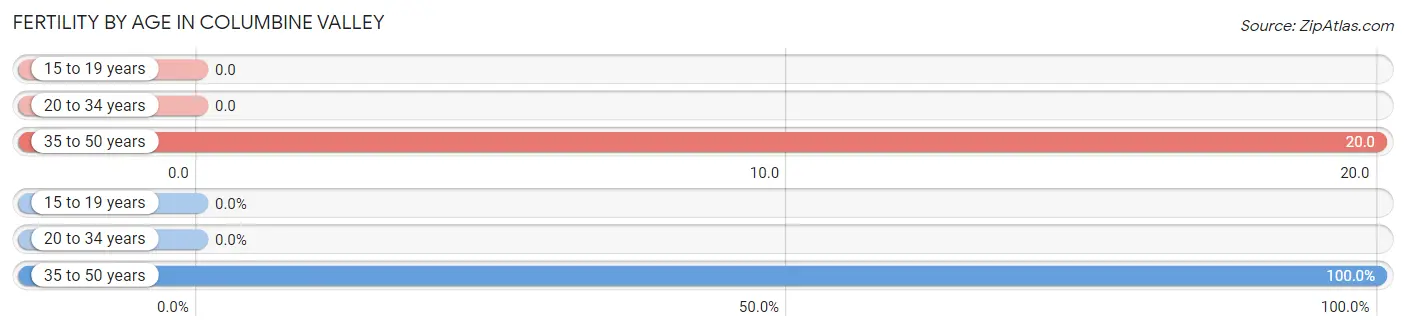
| Age Bracket | Women with Births | Births / 1,000 Women |
| 15 to 19 years | 0 (0.0%) | 0.0 |
| 20 to 34 years | 0 (0.0%) | 0.0 |
| 35 to 50 years | 4 (100.0%) | 20.0 |
| Total | 4 (100.0%) | 13.0 |
Fertility by Age by Marriage Status in Columbine Valley
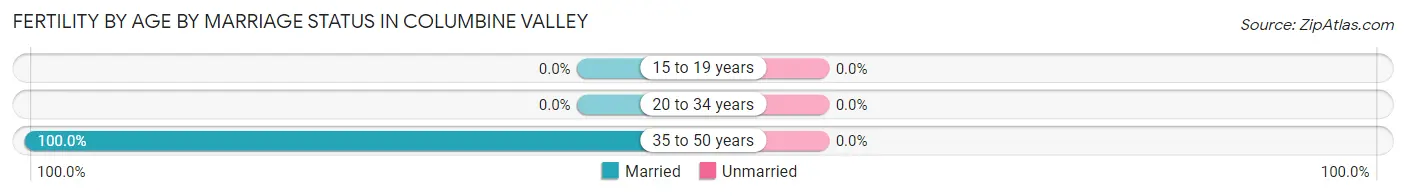
| Age Bracket | Married | Unmarried |
| 15 to 19 years | 0 (0.0%) | 0 (0.0%) |
| 20 to 34 years | 0 (0.0%) | 0 (0.0%) |
| 35 to 50 years | 4 (100.0%) | 0 (0.0%) |
| Total | 4 (100.0%) | 0 (0.0%) |
Fertility by Education in Columbine Valley
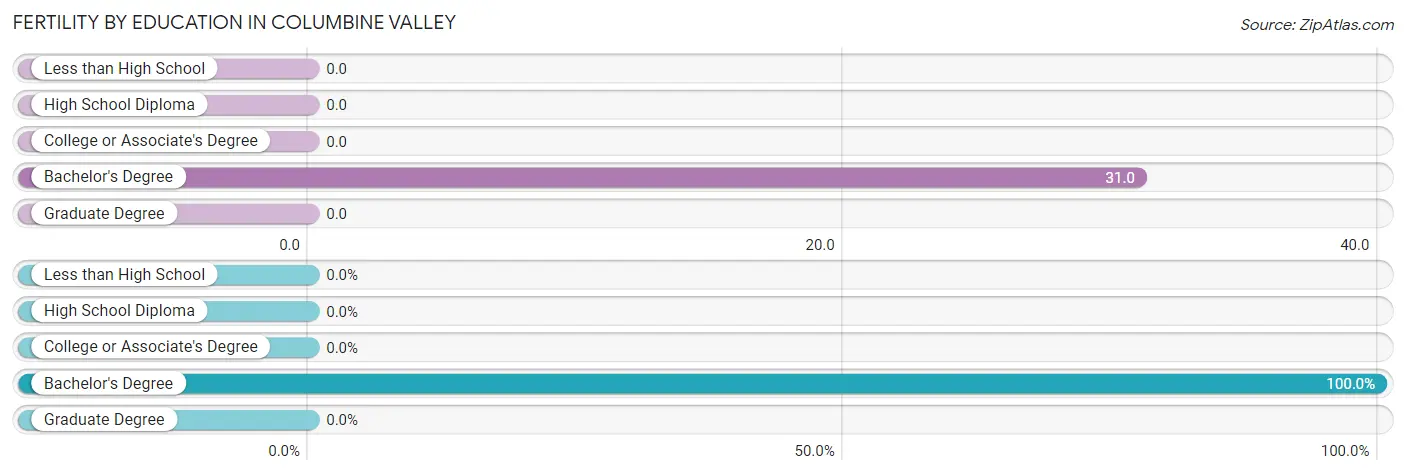
| Educational Attainment | Women with Births | Births / 1,000 Women |
| Less than High School | 0 (0.0%) | 0.0 |
| High School Diploma | 0 (0.0%) | 0.0 |
| College or Associate's Degree | 0 (0.0%) | 0.0 |
| Bachelor's Degree | 4 (100.0%) | 31.0 |
| Graduate Degree | 0 (0.0%) | 0.0 |
| Total | 4 (100.0%) | 13.0 |
Fertility by Education by Marriage Status in Columbine Valley
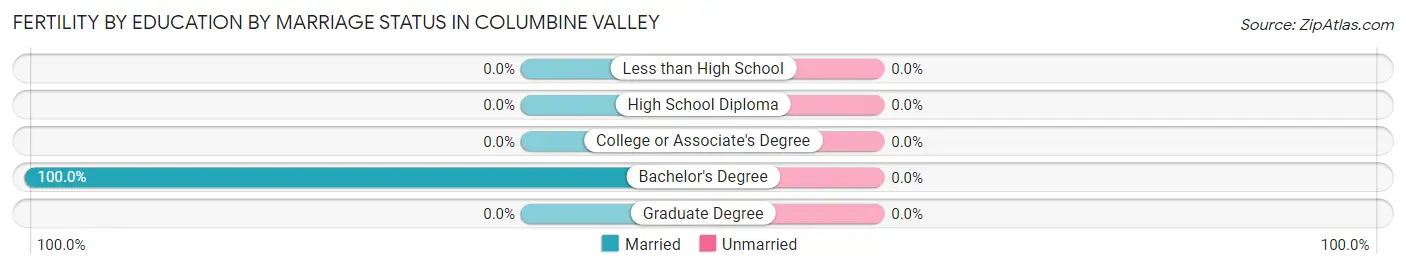
| Educational Attainment | Married | Unmarried |
| Less than High School | 0 (0.0%) | 0 (0.0%) |
| High School Diploma | 0 (0.0%) | 0 (0.0%) |
| College or Associate's Degree | 0 (0.0%) | 0 (0.0%) |
| Bachelor's Degree | 4 (100.0%) | 0 (0.0%) |
| Graduate Degree | 0 (0.0%) | 0 (0.0%) |
| Total | 4 (100.0%) | 0 (0.0%) |
Employment Characteristics in Columbine Valley
Employment by Class of Employer in Columbine Valley
Among the 800 employed individuals in Columbine Valley, private company employees (504 | 63.0%), self-employed (incorporated) (164 | 20.5%), and self-employed (not incorporated) (64 | 8.0%) make up the most common classes of employment.
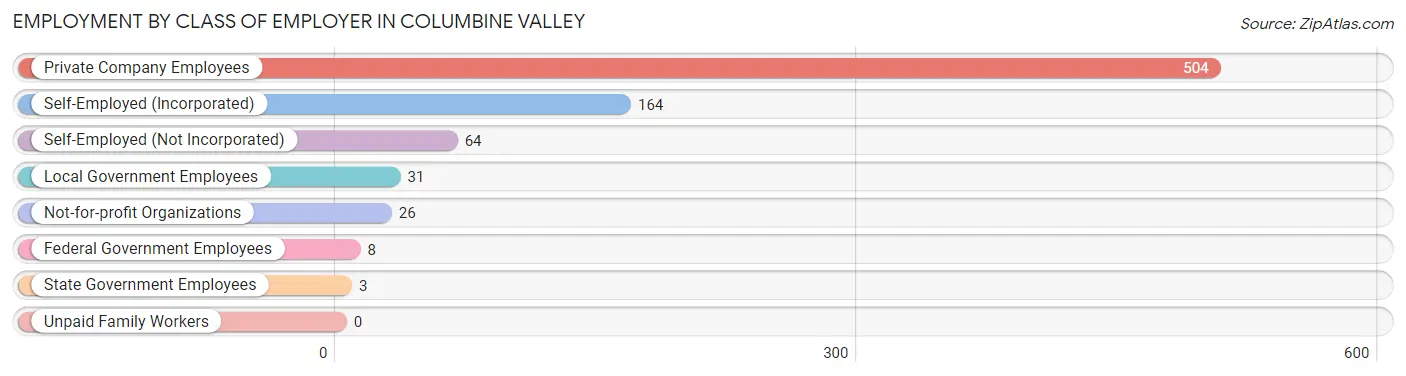
| Employer Class | # Employees | % Employees |
| Private Company Employees | 504 | 63.0% |
| Self-Employed (Incorporated) | 164 | 20.5% |
| Self-Employed (Not Incorporated) | 64 | 8.0% |
| Not-for-profit Organizations | 26 | 3.3% |
| Local Government Employees | 31 | 3.9% |
| State Government Employees | 3 | 0.4% |
| Federal Government Employees | 8 | 1.0% |
| Unpaid Family Workers | 0 | 0.0% |
| Total | 800 | 100.0% |
Employment Status by Age in Columbine Valley
According to the labor force statistics for Columbine Valley, out of the total population over 16 years of age (1,551), 52.6% or 816 individuals are in the labor force, with 0.5% or 4 of them unemployed. The age group with the highest labor force participation rate is 25 to 29 years, with 100.0% or 7 individuals in the labor force. Within the labor force, the 35 to 44 years age range has the highest percentage of unemployed individuals, with 2.2% or 4 of them being unemployed.
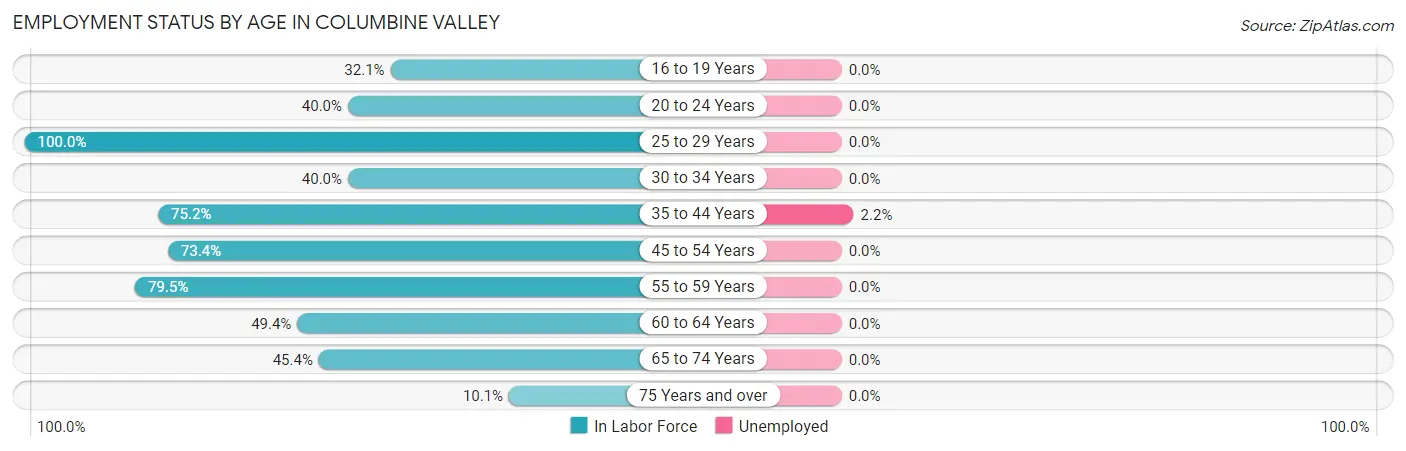
| Age Bracket | In Labor Force | Unemployed |
| 16 to 19 Years | 36 (32.1%) | 0 (0.0%) |
| 20 to 24 Years | 18 (40.0%) | 0 (0.0%) |
| 25 to 29 Years | 7 (100.0%) | 0 (0.0%) |
| 30 to 34 Years | 6 (40.0%) | 0 (0.0%) |
| 35 to 44 Years | 179 (75.2%) | 4 (2.2%) |
| 45 to 54 Years | 174 (73.4%) | 0 (0.0%) |
| 55 to 59 Years | 105 (79.5%) | 0 (0.0%) |
| 60 to 64 Years | 80 (49.4%) | 0 (0.0%) |
| 65 to 74 Years | 193 (45.4%) | 0 (0.0%) |
| 75 Years and over | 18 (10.1%) | 0 (0.0%) |
| Total | 816 (52.6%) | 4 (0.5%) |
Employment Status by Educational Attainment in Columbine Valley
According to labor force statistics for Columbine Valley, 69.7% of individuals (551) out of the total population between 25 and 64 years of age (791) are in the labor force, with 0.7% or 4 of them being unemployed. The group with the highest labor force participation rate are those with the educational attainment of bachelor's degree or higher, with 70.9% or 473 individuals in the labor force. Within the labor force, individuals with bachelor's degree or higher education have the highest percentage of unemployment, with 0.8% or 4 of them being unemployed.
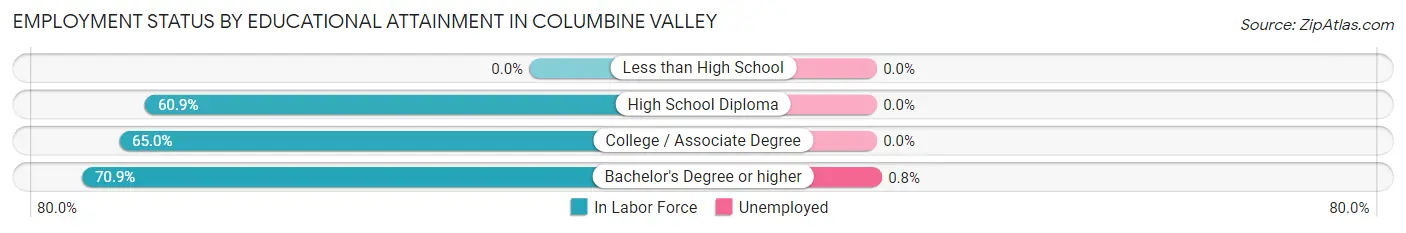
| Educational Attainment | In Labor Force | Unemployed |
| Less than High School | 0 (0.0%) | 0 (0.0%) |
| High School Diploma | 39 (60.9%) | 0 (0.0%) |
| College / Associate Degree | 39 (65.0%) | 0 (0.0%) |
| Bachelor's Degree or higher | 473 (70.9%) | 5 (0.8%) |
| Total | 551 (69.7%) | 6 (0.7%) |
Employment Occupations by Sex in Columbine Valley
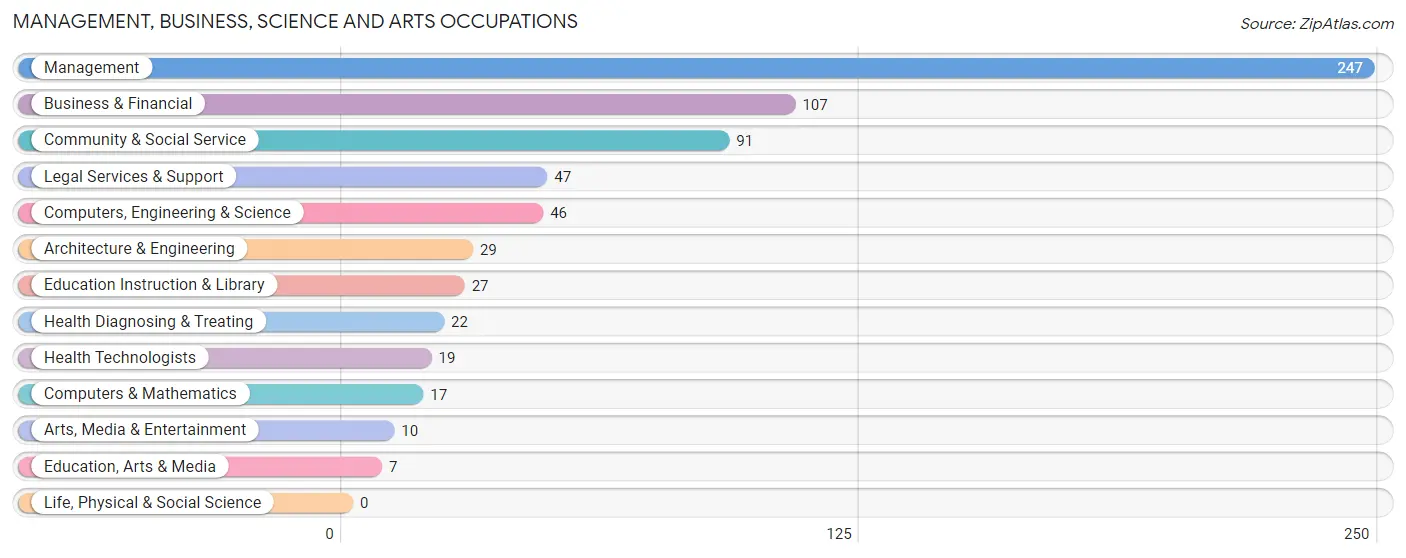
Management, Business, Science and Arts Occupations
The most common Management, Business, Science and Arts occupations in Columbine Valley are Management (247 | 30.4%), Business & Financial (107 | 13.2%), Community & Social Service (91 | 11.2%), Legal Services & Support (47 | 5.8%), and Computers, Engineering & Science (46 | 5.7%).
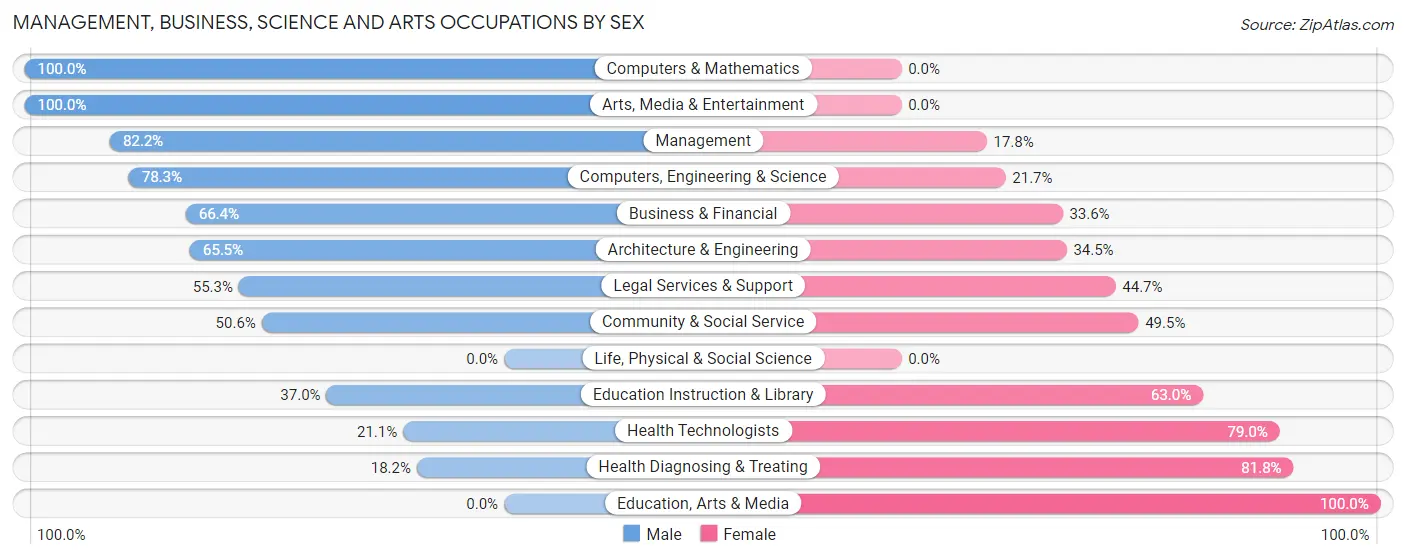
Management, Business, Science and Arts Occupations by Sex
Within the Management, Business, Science and Arts occupations in Columbine Valley, the most male-oriented occupations are Computers & Mathematics (100.0%), Arts, Media & Entertainment (100.0%), and Management (82.2%), while the most female-oriented occupations are Education, Arts & Media (100.0%), Health Diagnosing & Treating (81.8%), and Health Technologists (78.9%).
| Occupation | Male | Female |
| Management | 203 (82.2%) | 44 (17.8%) |
| Business & Financial | 71 (66.4%) | 36 (33.6%) |
| Computers, Engineering & Science | 36 (78.3%) | 10 (21.7%) |
| Computers & Mathematics | 17 (100.0%) | 0 (0.0%) |
| Architecture & Engineering | 19 (65.5%) | 10 (34.5%) |
| Life, Physical & Social Science | 0 (0.0%) | 0 (0.0%) |
| Community & Social Service | 46 (50.5%) | 45 (49.4%) |
| Education, Arts & Media | 0 (0.0%) | 7 (100.0%) |
| Legal Services & Support | 26 (55.3%) | 21 (44.7%) |
| Education Instruction & Library | 10 (37.0%) | 17 (63.0%) |
| Arts, Media & Entertainment | 10 (100.0%) | 0 (0.0%) |
| Health Diagnosing & Treating | 4 (18.2%) | 18 (81.8%) |
| Health Technologists | 4 (21.0%) | 15 (78.9%) |
| Total (Category) | 360 (70.2%) | 153 (29.8%) |
| Total (Overall) | 528 (65.0%) | 284 (35.0%) |
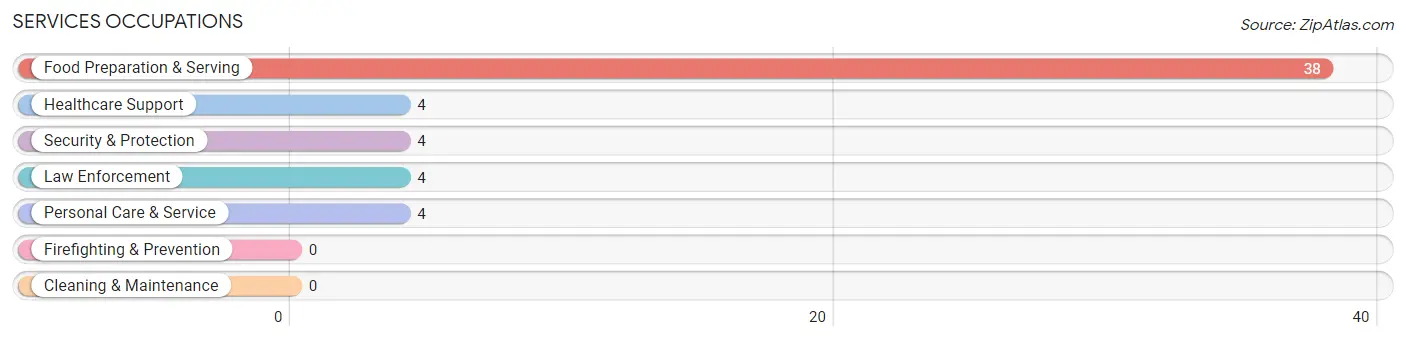
Services Occupations
The most common Services occupations in Columbine Valley are Food Preparation & Serving (38 | 4.7%), Healthcare Support (4 | 0.5%), Security & Protection (4 | 0.5%), Law Enforcement (4 | 0.5%), and Personal Care & Service (4 | 0.5%).
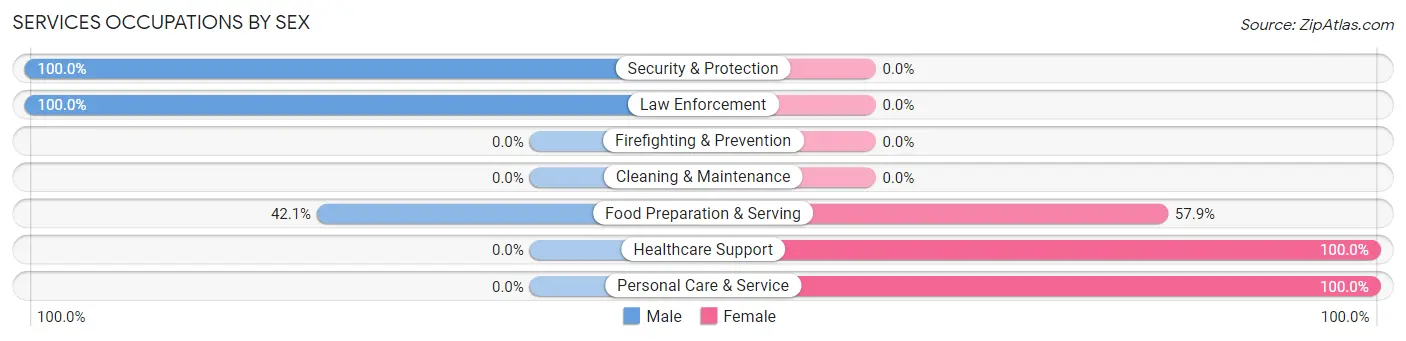
Services Occupations by Sex
Within the Services occupations in Columbine Valley, the most male-oriented occupations are Security & Protection (100.0%), Law Enforcement (100.0%), and Food Preparation & Serving (42.1%), while the most female-oriented occupations are Healthcare Support (100.0%), Personal Care & Service (100.0%), and Food Preparation & Serving (57.9%).
| Occupation | Male | Female |
| Healthcare Support | 0 (0.0%) | 4 (100.0%) |
| Security & Protection | 4 (100.0%) | 0 (0.0%) |
| Firefighting & Prevention | 0 (0.0%) | 0 (0.0%) |
| Law Enforcement | 4 (100.0%) | 0 (0.0%) |
| Food Preparation & Serving | 16 (42.1%) | 22 (57.9%) |
| Cleaning & Maintenance | 0 (0.0%) | 0 (0.0%) |
| Personal Care & Service | 0 (0.0%) | 4 (100.0%) |
| Total (Category) | 20 (40.0%) | 30 (60.0%) |
| Total (Overall) | 528 (65.0%) | 284 (35.0%) |
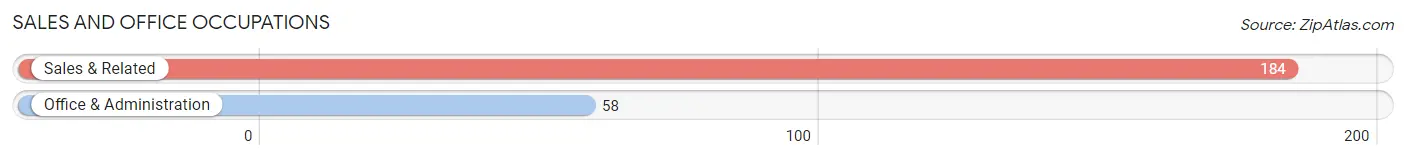
Sales and Office Occupations
The most common Sales and Office occupations in Columbine Valley are Sales & Related (184 | 22.7%), and Office & Administration (58 | 7.1%).
Sales and Office Occupations by Sex
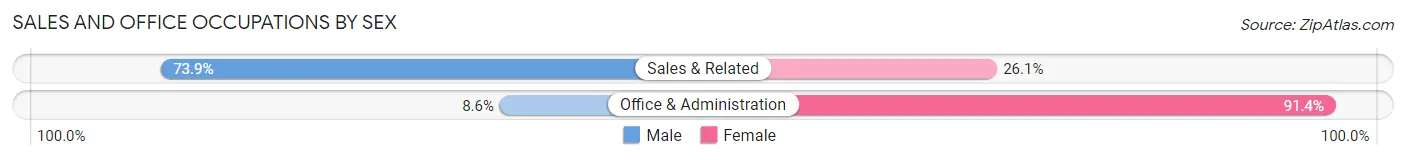
| Occupation | Male | Female |
| Sales & Related | 136 (73.9%) | 48 (26.1%) |
| Office & Administration | 5 (8.6%) | 53 (91.4%) |
| Total (Category) | 141 (58.3%) | 101 (41.7%) |
| Total (Overall) | 528 (65.0%) | 284 (35.0%) |
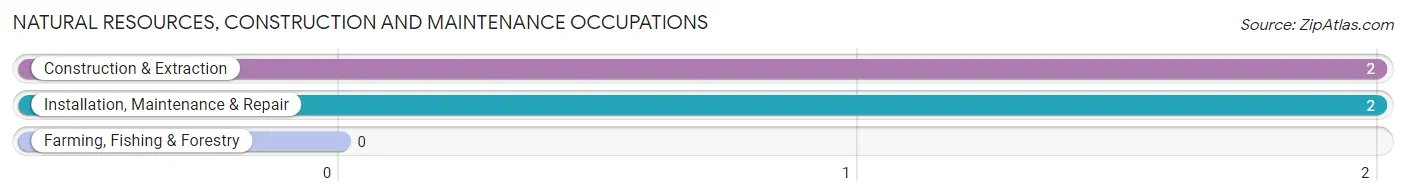
Natural Resources, Construction and Maintenance Occupations
The most common Natural Resources, Construction and Maintenance occupations in Columbine Valley are Construction & Extraction (2 | 0.3%), and Installation, Maintenance & Repair (2 | 0.3%).
Natural Resources, Construction and Maintenance Occupations by Sex
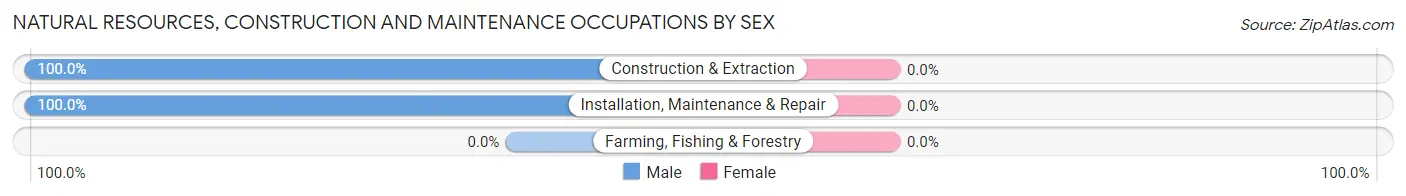
| Occupation | Male | Female |
| Farming, Fishing & Forestry | 0 (0.0%) | 0 (0.0%) |
| Construction & Extraction | 2 (100.0%) | 0 (0.0%) |
| Installation, Maintenance & Repair | 2 (100.0%) | 0 (0.0%) |
| Total (Category) | 4 (100.0%) | 0 (0.0%) |
| Total (Overall) | 528 (65.0%) | 284 (35.0%) |
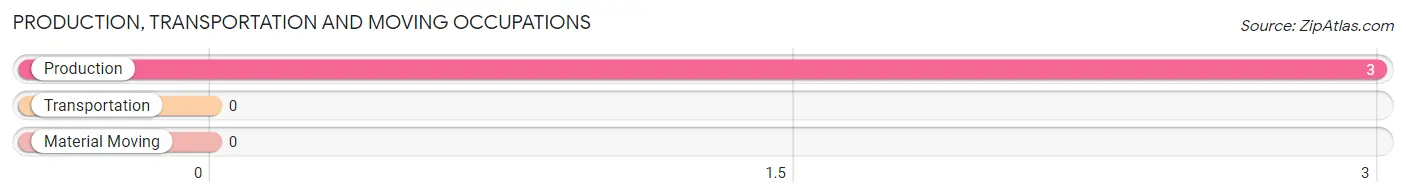
Production, Transportation and Moving Occupations
The most common Production, Transportation and Moving occupations in Columbine Valley are , and Production (3 | 0.4%).
Production, Transportation and Moving Occupations by Sex
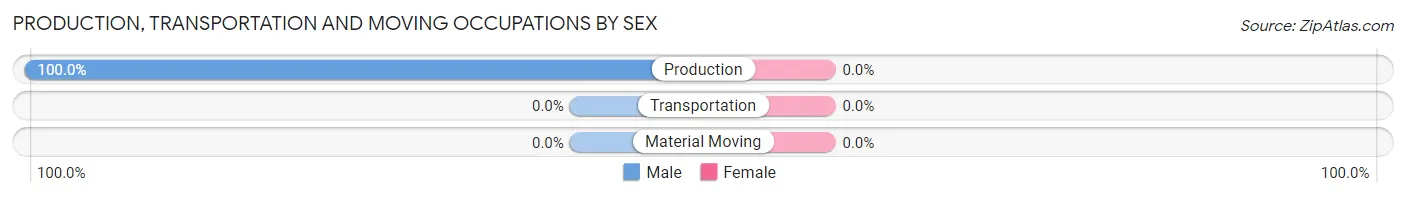
| Occupation | Male | Female |
| Production | 3 (100.0%) | 0 (0.0%) |
| Transportation | 0 (0.0%) | 0 (0.0%) |
| Material Moving | 0 (0.0%) | 0 (0.0%) |
| Total (Category) | 3 (100.0%) | 0 (0.0%) |
| Total (Overall) | 528 (65.0%) | 284 (35.0%) |
Employment Industries by Sex in Columbine Valley
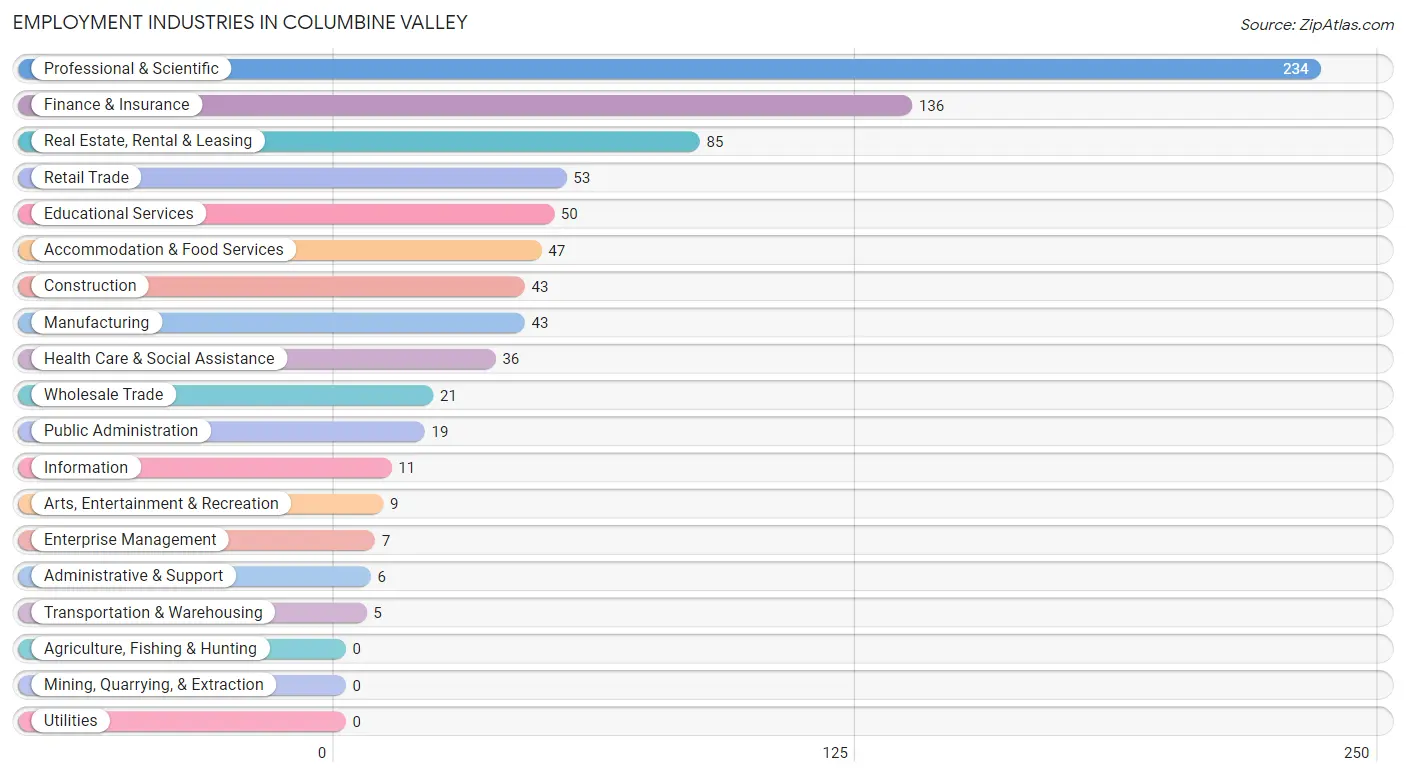
Employment Industries in Columbine Valley
The major employment industries in Columbine Valley include Professional & Scientific (234 | 28.8%), Finance & Insurance (136 | 16.8%), Real Estate, Rental & Leasing (85 | 10.5%), Retail Trade (53 | 6.5%), and Educational Services (50 | 6.2%).
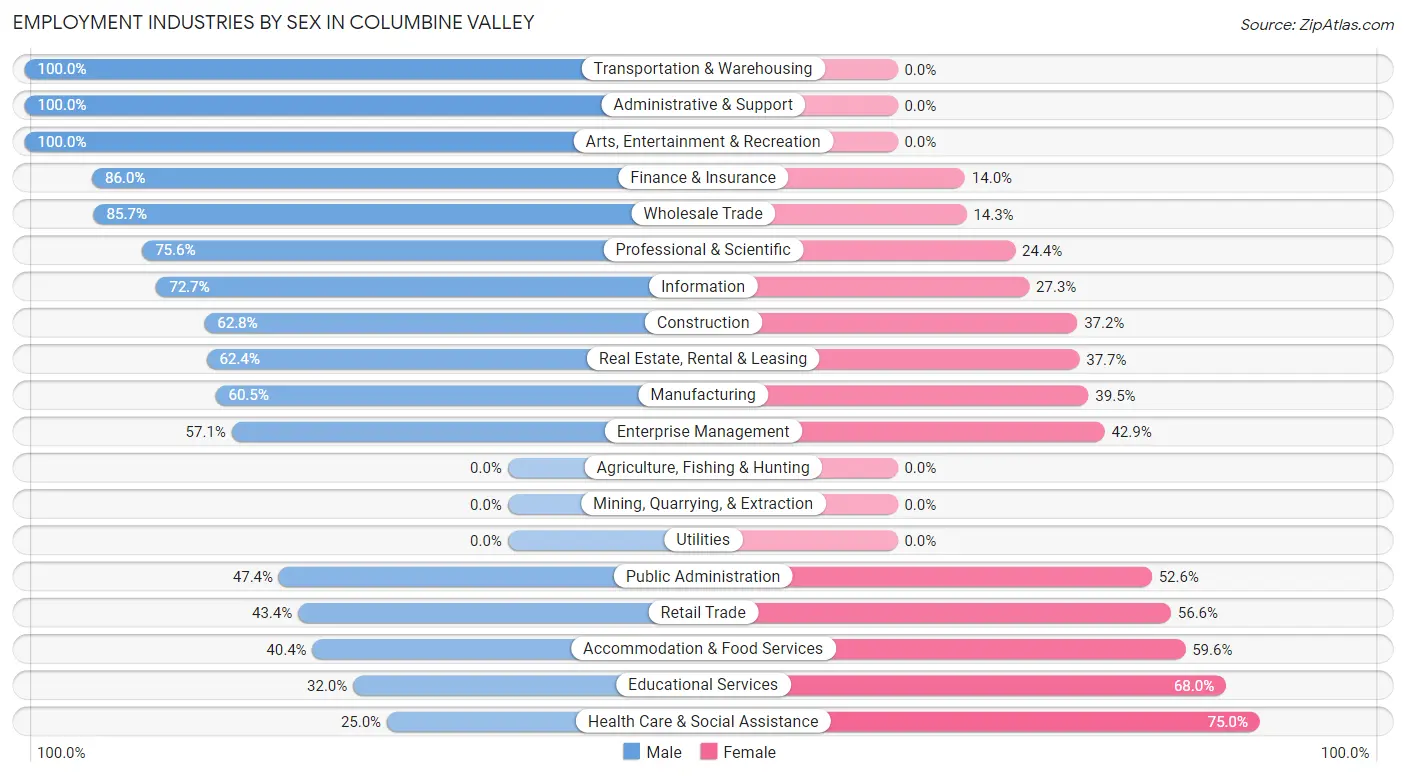
Employment Industries by Sex in Columbine Valley
The Columbine Valley industries that see more men than women are Transportation & Warehousing (100.0%), Administrative & Support (100.0%), and Arts, Entertainment & Recreation (100.0%), whereas the industries that tend to have a higher number of women are Health Care & Social Assistance (75.0%), Educational Services (68.0%), and Accommodation & Food Services (59.6%).
| Industry | Male | Female |
| Agriculture, Fishing & Hunting | 0 (0.0%) | 0 (0.0%) |
| Mining, Quarrying, & Extraction | 0 (0.0%) | 0 (0.0%) |
| Construction | 27 (62.8%) | 16 (37.2%) |
| Manufacturing | 26 (60.5%) | 17 (39.5%) |
| Wholesale Trade | 18 (85.7%) | 3 (14.3%) |
| Retail Trade | 23 (43.4%) | 30 (56.6%) |
| Transportation & Warehousing | 5 (100.0%) | 0 (0.0%) |
| Utilities | 0 (0.0%) | 0 (0.0%) |
| Information | 8 (72.7%) | 3 (27.3%) |
| Finance & Insurance | 117 (86.0%) | 19 (14.0%) |
| Real Estate, Rental & Leasing | 53 (62.4%) | 32 (37.7%) |
| Professional & Scientific | 177 (75.6%) | 57 (24.4%) |
| Enterprise Management | 4 (57.1%) | 3 (42.9%) |
| Administrative & Support | 6 (100.0%) | 0 (0.0%) |
| Educational Services | 16 (32.0%) | 34 (68.0%) |
| Health Care & Social Assistance | 9 (25.0%) | 27 (75.0%) |
| Arts, Entertainment & Recreation | 9 (100.0%) | 0 (0.0%) |
| Accommodation & Food Services | 19 (40.4%) | 28 (59.6%) |
| Public Administration | 9 (47.4%) | 10 (52.6%) |
| Total | 528 (65.0%) | 284 (35.0%) |
Education in Columbine Valley
School Enrollment in Columbine Valley
The most common levels of schooling among the 493 students in Columbine Valley are high school (138 | 28.0%), elementary school (123 | 24.9%), and middle school (117 | 23.7%).
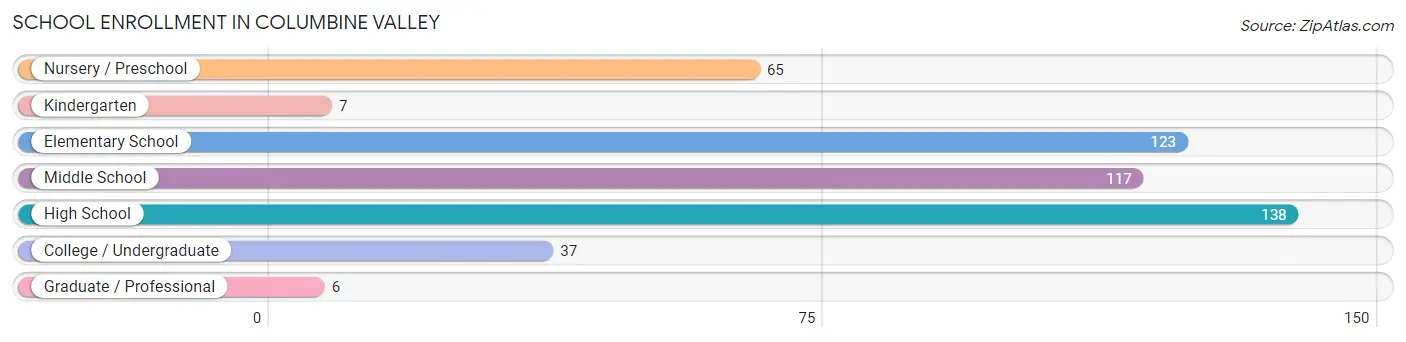
| School Level | # Students | % Students |
| Nursery / Preschool | 65 | 13.2% |
| Kindergarten | 7 | 1.4% |
| Elementary School | 123 | 24.9% |
| Middle School | 117 | 23.7% |
| High School | 138 | 28.0% |
| College / Undergraduate | 37 | 7.5% |
| Graduate / Professional | 6 | 1.2% |
| Total | 493 | 100.0% |
School Enrollment by Age by Funding Source in Columbine Valley
Out of a total of 493 students who are enrolled in schools in Columbine Valley, 121 (24.5%) attend a private institution, while the remaining 372 (75.5%) are enrolled in public schools. The age group of 35 years and over has the highest likelihood of being enrolled in private schools, with 4 (100.0% in the age bracket) enrolled. Conversely, the age group of 18 to 19 year olds has the lowest likelihood of being enrolled in a private school, with 63 (88.7% in the age bracket) attending a public institution.
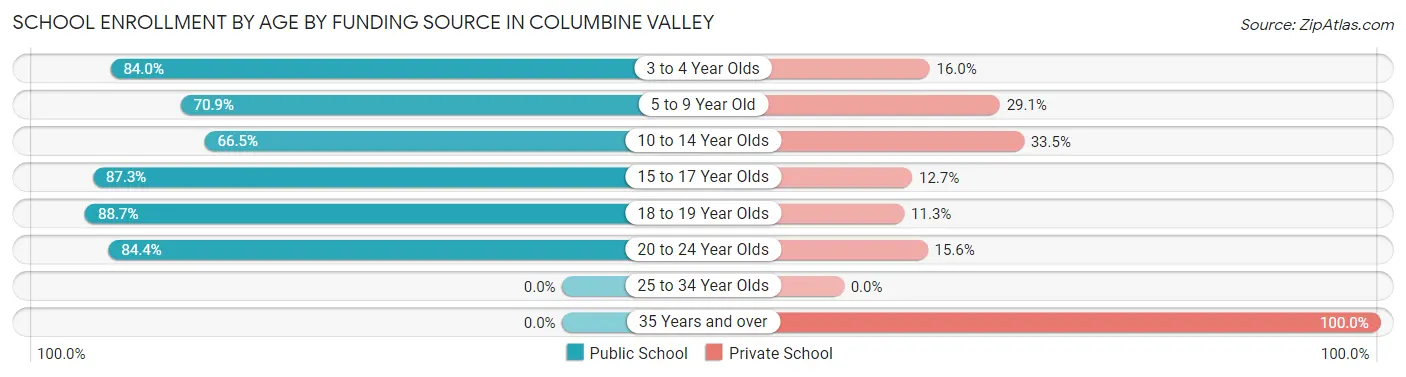
| Age Bracket | Public School | Private School |
| 3 to 4 Year Olds | 42 (84.0%) | 8 (16.0%) |
| 5 to 9 Year Old | 83 (70.9%) | 34 (29.1%) |
| 10 to 14 Year Olds | 109 (66.5%) | 55 (33.5%) |
| 15 to 17 Year Olds | 48 (87.3%) | 7 (12.7%) |
| 18 to 19 Year Olds | 63 (88.7%) | 8 (11.3%) |
| 20 to 24 Year Olds | 27 (84.4%) | 5 (15.6%) |
| 25 to 34 Year Olds | 0 (0.0%) | 0 (0.0%) |
| 35 Years and over | 0 (0.0%) | 4 (100.0%) |
| Total | 372 (75.5%) | 121 (24.5%) |
Educational Attainment by Field of Study in Columbine Valley
Business (330 | 27.5%), engineering (159 | 13.2%), education (148 | 12.3%), social sciences (119 | 9.9%), and arts & humanities (75 | 6.2%) are the most common fields of study among 1,201 individuals in Columbine Valley who have obtained a bachelor's degree or higher.
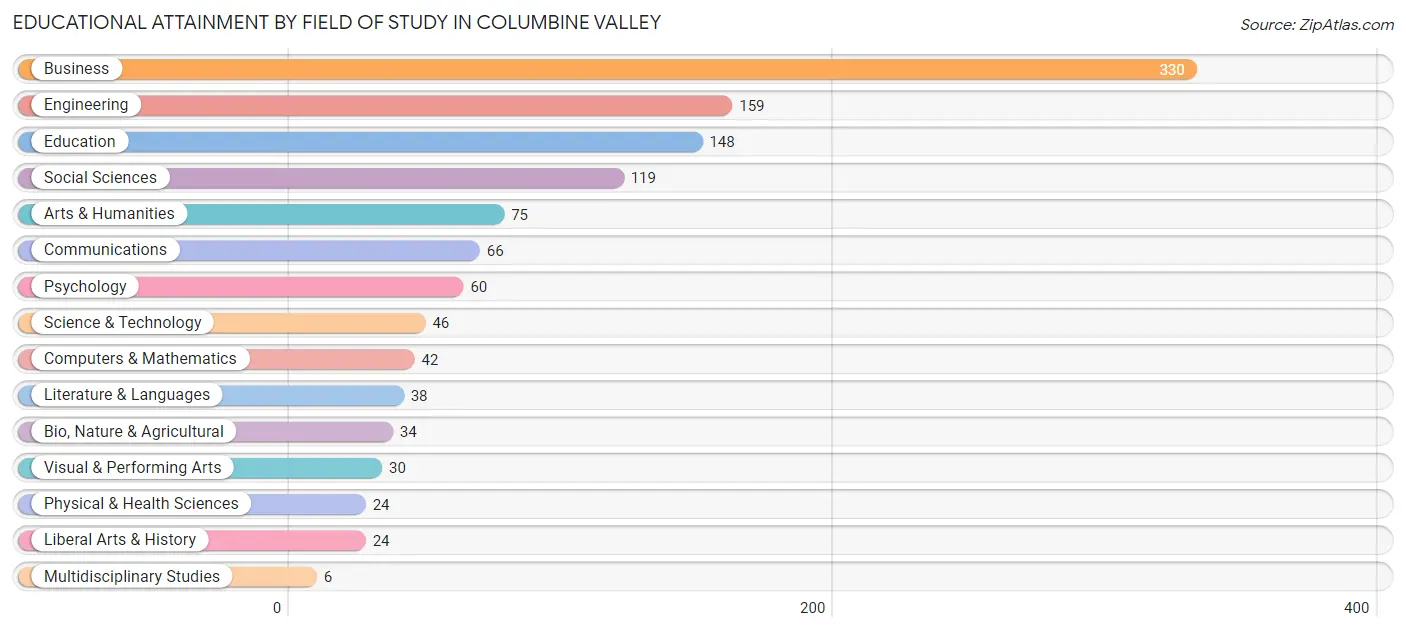
| Field of Study | # Graduates | % Graduates |
| Computers & Mathematics | 42 | 3.5% |
| Bio, Nature & Agricultural | 34 | 2.8% |
| Physical & Health Sciences | 24 | 2.0% |
| Psychology | 60 | 5.0% |
| Social Sciences | 119 | 9.9% |
| Engineering | 159 | 13.2% |
| Multidisciplinary Studies | 6 | 0.5% |
| Science & Technology | 46 | 3.8% |
| Business | 330 | 27.5% |
| Education | 148 | 12.3% |
| Literature & Languages | 38 | 3.2% |
| Liberal Arts & History | 24 | 2.0% |
| Visual & Performing Arts | 30 | 2.5% |
| Communications | 66 | 5.5% |
| Arts & Humanities | 75 | 6.2% |
| Total | 1,201 | 100.0% |
Transportation & Commute in Columbine Valley
Vehicle Availability by Sex in Columbine Valley
The most prevalent vehicle ownership categories in Columbine Valley are males with 2 vehicles (342, accounting for 66.3%) and females with 2 vehicles (129, making up 120.4%).
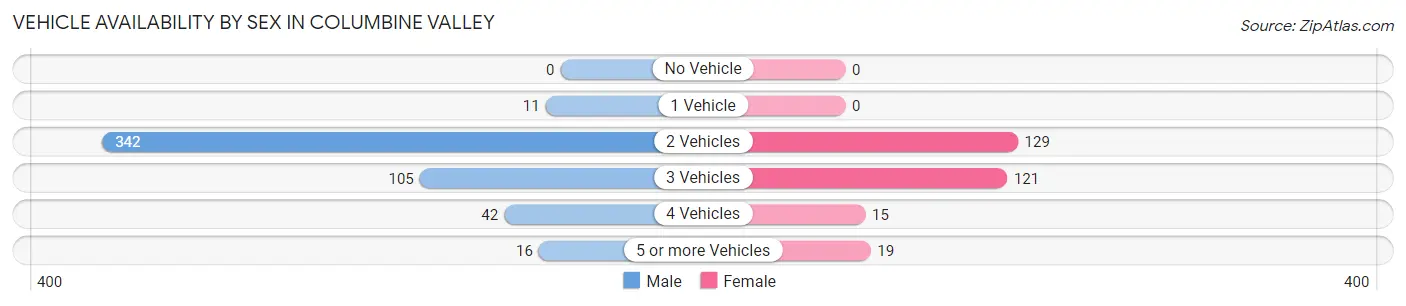
| Vehicles Available | Male | Female |
| No Vehicle | 0 (0.0%) | 0 (0.0%) |
| 1 Vehicle | 11 (2.1%) | 0 (0.0%) |
| 2 Vehicles | 342 (66.3%) | 129 (45.4%) |
| 3 Vehicles | 105 (20.3%) | 121 (42.6%) |
| 4 Vehicles | 42 (8.1%) | 15 (5.3%) |
| 5 or more Vehicles | 16 (3.1%) | 19 (6.7%) |
| Total | 516 (100.0%) | 284 (100.0%) |
Commute Time in Columbine Valley
The most frequently occuring commute durations in Columbine Valley are 20 to 24 minutes (86 commuters, 17.6%), 15 to 19 minutes (81 commuters, 16.6%), and 25 to 29 minutes (63 commuters, 12.9%).
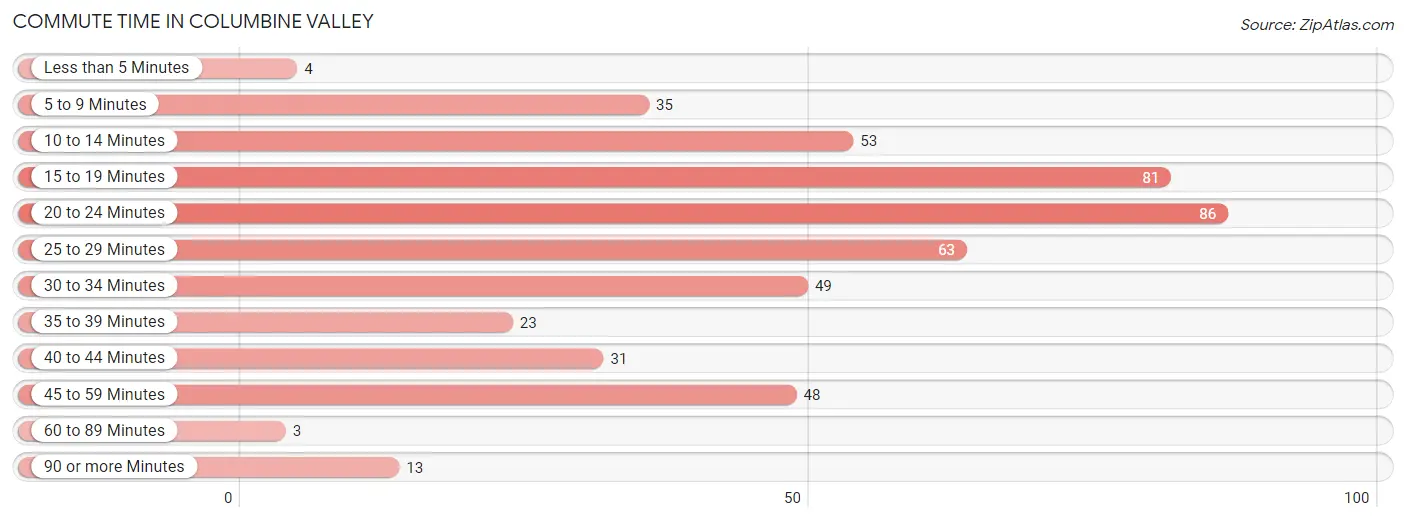
| Commute Time | # Commuters | % Commuters |
| Less than 5 Minutes | 4 | 0.8% |
| 5 to 9 Minutes | 35 | 7.2% |
| 10 to 14 Minutes | 53 | 10.8% |
| 15 to 19 Minutes | 81 | 16.6% |
| 20 to 24 Minutes | 86 | 17.6% |
| 25 to 29 Minutes | 63 | 12.9% |
| 30 to 34 Minutes | 49 | 10.0% |
| 35 to 39 Minutes | 23 | 4.7% |
| 40 to 44 Minutes | 31 | 6.3% |
| 45 to 59 Minutes | 48 | 9.8% |
| 60 to 89 Minutes | 3 | 0.6% |
| 90 or more Minutes | 13 | 2.7% |
Commute Time by Sex in Columbine Valley
The most common commute times in Columbine Valley are 20 to 24 minutes (56 commuters, 19.1%) for males and 25 to 29 minutes (35 commuters, 17.9%) for females.
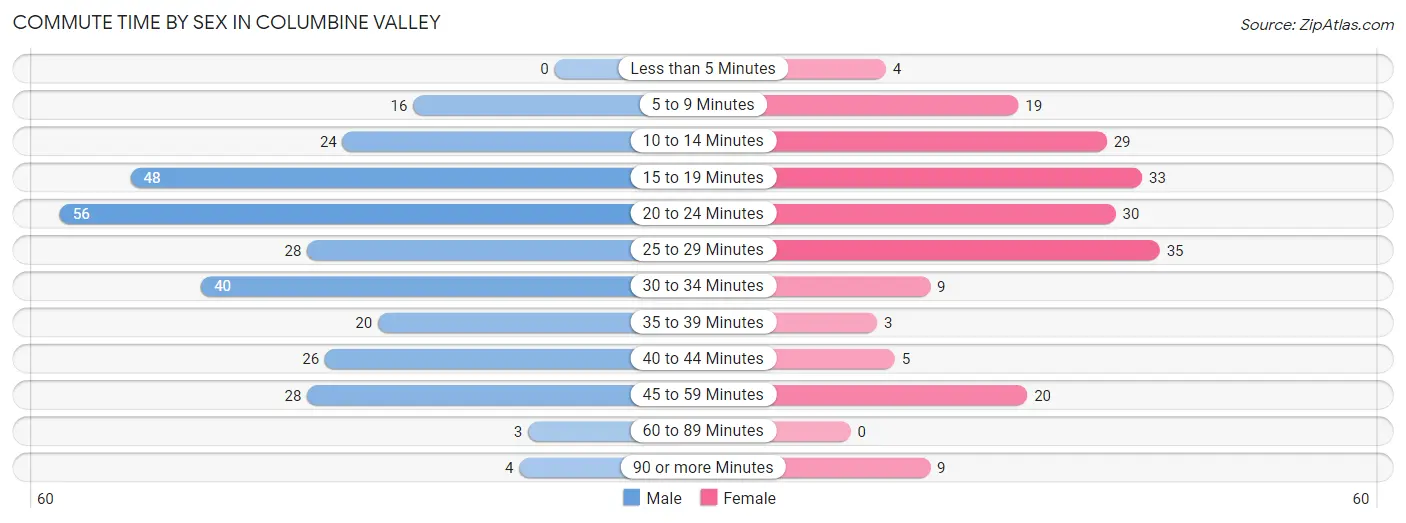
| Commute Time | Male | Female |
| Less than 5 Minutes | 0 (0.0%) | 4 (2.0%) |
| 5 to 9 Minutes | 16 (5.5%) | 19 (9.7%) |
| 10 to 14 Minutes | 24 (8.2%) | 29 (14.8%) |
| 15 to 19 Minutes | 48 (16.4%) | 33 (16.8%) |
| 20 to 24 Minutes | 56 (19.1%) | 30 (15.3%) |
| 25 to 29 Minutes | 28 (9.6%) | 35 (17.9%) |
| 30 to 34 Minutes | 40 (13.7%) | 9 (4.6%) |
| 35 to 39 Minutes | 20 (6.8%) | 3 (1.5%) |
| 40 to 44 Minutes | 26 (8.9%) | 5 (2.5%) |
| 45 to 59 Minutes | 28 (9.6%) | 20 (10.2%) |
| 60 to 89 Minutes | 3 (1.0%) | 0 (0.0%) |
| 90 or more Minutes | 4 (1.4%) | 9 (4.6%) |
Time of Departure to Work by Sex in Columbine Valley
The most frequent times of departure to work in Columbine Valley are 7:30 AM to 7:59 AM (63, 21.5%) for males and 9:00 AM to 9:59 AM (34, 17.3%) for females.
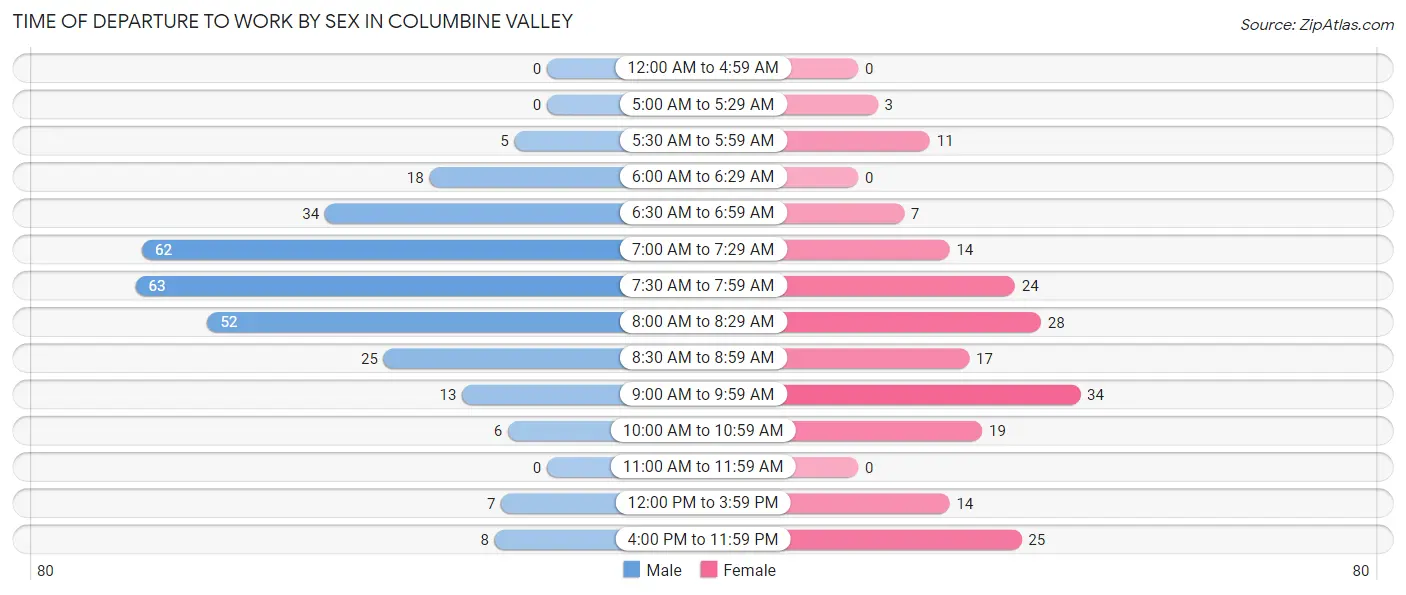
| Time of Departure | Male | Female |
| 12:00 AM to 4:59 AM | 0 (0.0%) | 0 (0.0%) |
| 5:00 AM to 5:29 AM | 0 (0.0%) | 3 (1.5%) |
| 5:30 AM to 5:59 AM | 5 (1.7%) | 11 (5.6%) |
| 6:00 AM to 6:29 AM | 18 (6.1%) | 0 (0.0%) |
| 6:30 AM to 6:59 AM | 34 (11.6%) | 7 (3.6%) |
| 7:00 AM to 7:29 AM | 62 (21.2%) | 14 (7.1%) |
| 7:30 AM to 7:59 AM | 63 (21.5%) | 24 (12.2%) |
| 8:00 AM to 8:29 AM | 52 (17.7%) | 28 (14.3%) |
| 8:30 AM to 8:59 AM | 25 (8.5%) | 17 (8.7%) |
| 9:00 AM to 9:59 AM | 13 (4.4%) | 34 (17.3%) |
| 10:00 AM to 10:59 AM | 6 (2.1%) | 19 (9.7%) |
| 11:00 AM to 11:59 AM | 0 (0.0%) | 0 (0.0%) |
| 12:00 PM to 3:59 PM | 7 (2.4%) | 14 (7.1%) |
| 4:00 PM to 11:59 PM | 8 (2.7%) | 25 (12.8%) |
| Total | 293 (100.0%) | 196 (100.0%) |
Housing Occupancy in Columbine Valley
Occupancy by Ownership in Columbine Valley
Of the total 717 dwellings in Columbine Valley, owner-occupied units account for 714 (99.6%), while renter-occupied units make up 3 (0.4%).
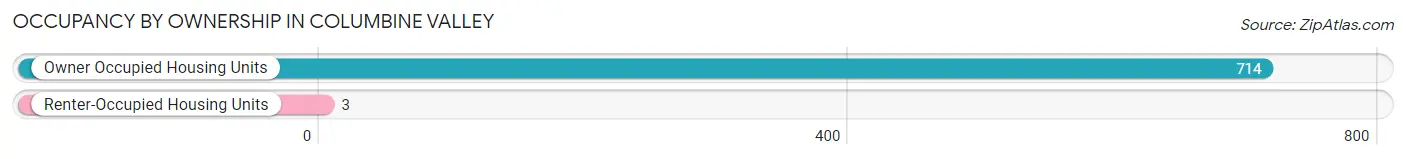
| Occupancy | # Housing Units | % Housing Units |
| Owner Occupied Housing Units | 714 | 99.6% |
| Renter-Occupied Housing Units | 3 | 0.4% |
| Total Occupied Housing Units | 717 | 100.0% |
Occupancy by Household Size in Columbine Valley
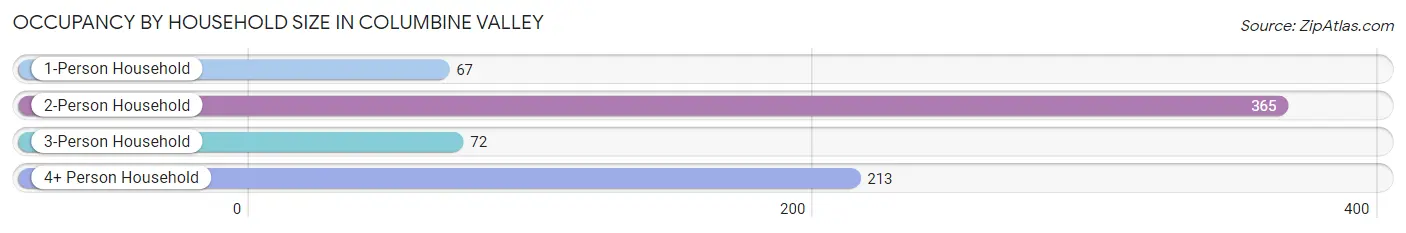
| Household Size | # Housing Units | % Housing Units |
| 1-Person Household | 67 | 9.3% |
| 2-Person Household | 365 | 50.9% |
| 3-Person Household | 72 | 10.0% |
| 4+ Person Household | 213 | 29.7% |
| Total Housing Units | 717 | 100.0% |
Occupancy by Ownership by Household Size in Columbine Valley
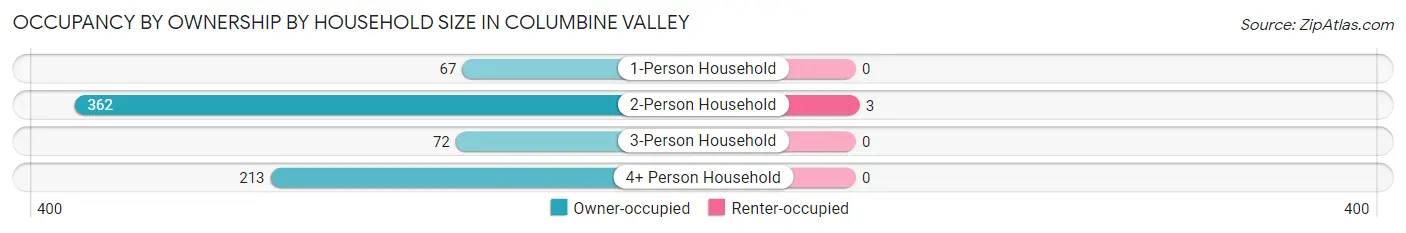
| Household Size | Owner-occupied | Renter-occupied |
| 1-Person Household | 67 (100.0%) | 0 (0.0%) |
| 2-Person Household | 362 (99.2%) | 3 (0.8%) |
| 3-Person Household | 72 (100.0%) | 0 (0.0%) |
| 4+ Person Household | 213 (100.0%) | 0 (0.0%) |
| Total Housing Units | 714 (99.6%) | 3 (0.4%) |
Occupancy by Educational Attainment in Columbine Valley
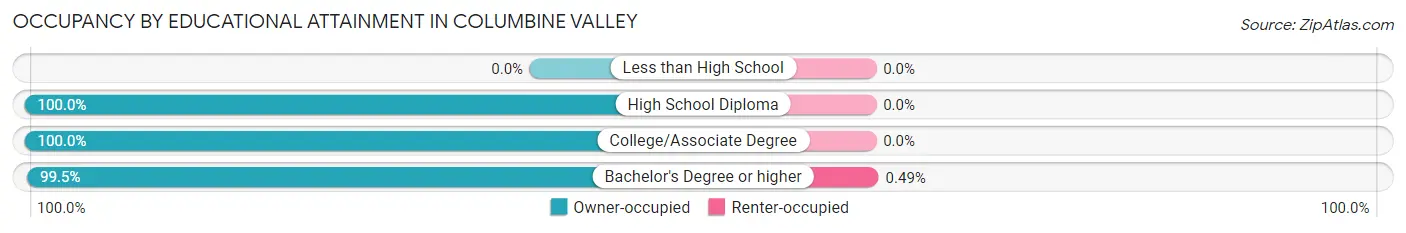
| Household Size | Owner-occupied | Renter-occupied |
| Less than High School | 0 (0.0%) | 0 (0.0%) |
| High School Diploma | 30 (100.0%) | 0 (0.0%) |
| College/Associate Degree | 78 (100.0%) | 0 (0.0%) |
| Bachelor's Degree or higher | 606 (99.5%) | 3 (0.5%) |
Occupancy by Age of Householder in Columbine Valley
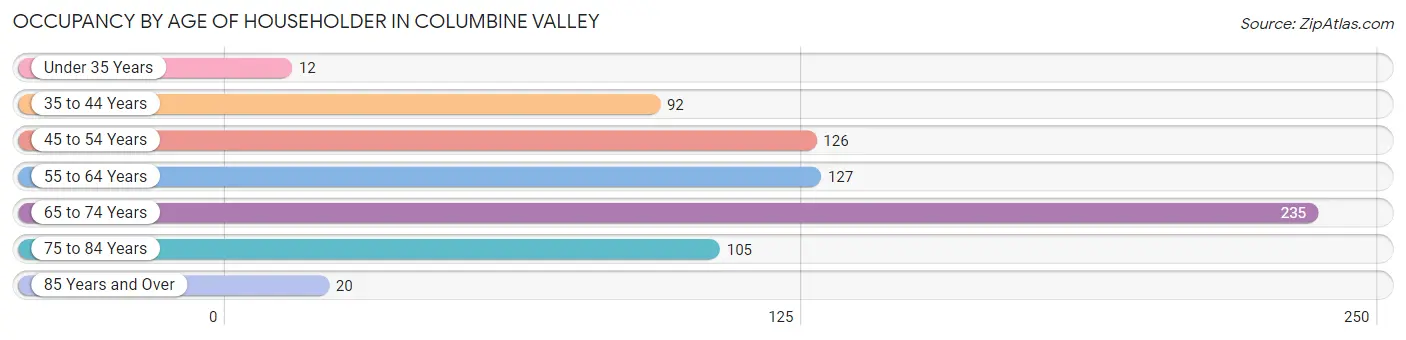
| Age Bracket | # Households | % Households |
| Under 35 Years | 12 | 1.7% |
| 35 to 44 Years | 92 | 12.8% |
| 45 to 54 Years | 126 | 17.6% |
| 55 to 64 Years | 127 | 17.7% |
| 65 to 74 Years | 235 | 32.8% |
| 75 to 84 Years | 105 | 14.6% |
| 85 Years and Over | 20 | 2.8% |
| Total | 717 | 100.0% |
Housing Finances in Columbine Valley
Median Income by Occupancy in Columbine Valley
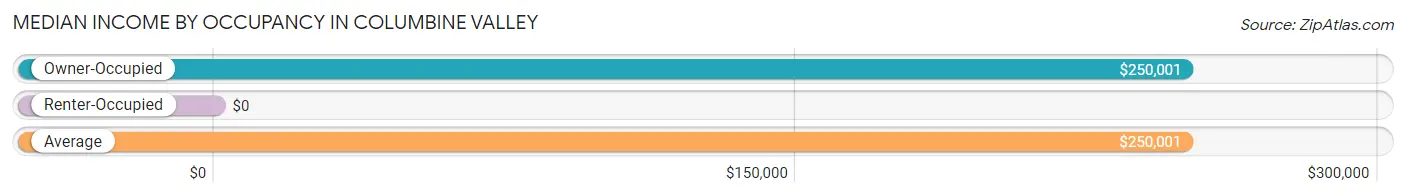
| Occupancy Type | # Households | Median Income |
| Owner-Occupied | 714 (99.6%) | $250,001 |
| Renter-Occupied | 3 (0.4%) | $0 |
| Average | 717 (100.0%) | $250,001 |
Occupancy by Householder Income Bracket in Columbine Valley
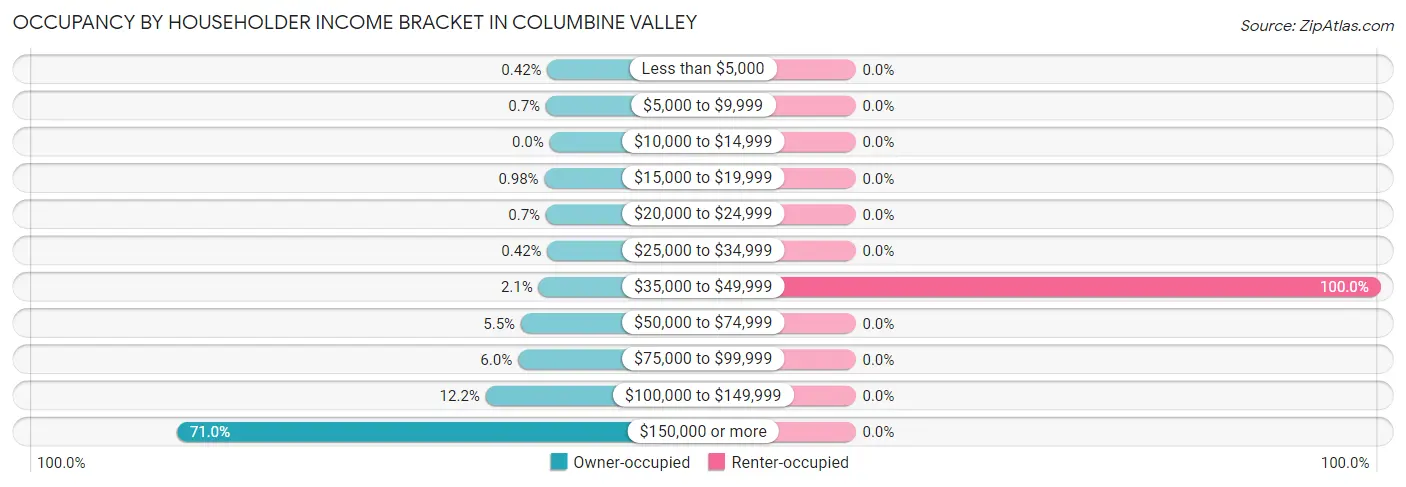
| Income Bracket | Owner-occupied | Renter-occupied |
| Less than $5,000 | 3 (0.4%) | 0 (0.0%) |
| $5,000 to $9,999 | 5 (0.7%) | 0 (0.0%) |
| $10,000 to $14,999 | 0 (0.0%) | 0 (0.0%) |
| $15,000 to $19,999 | 7 (1.0%) | 0 (0.0%) |
| $20,000 to $24,999 | 5 (0.7%) | 0 (0.0%) |
| $25,000 to $34,999 | 3 (0.4%) | 0 (0.0%) |
| $35,000 to $49,999 | 15 (2.1%) | 3 (100.0%) |
| $50,000 to $74,999 | 39 (5.5%) | 0 (0.0%) |
| $75,000 to $99,999 | 43 (6.0%) | 0 (0.0%) |
| $100,000 to $149,999 | 87 (12.2%) | 0 (0.0%) |
| $150,000 or more | 507 (71.0%) | 0 (0.0%) |
| Total | 714 (100.0%) | 3 (100.0%) |
Monthly Housing Cost Tiers in Columbine Valley
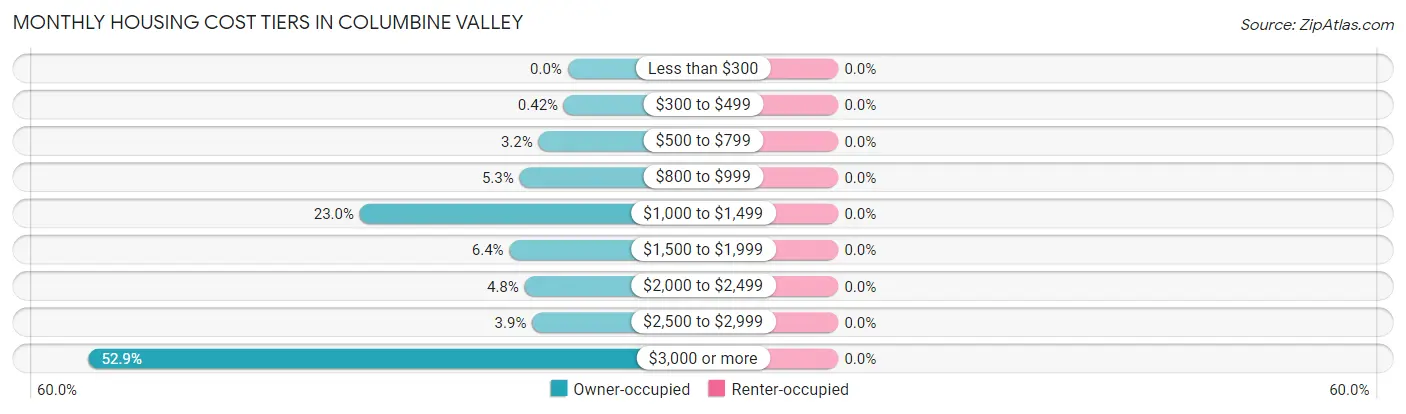
| Monthly Cost | Owner-occupied | Renter-occupied |
| Less than $300 | 0 (0.0%) | 0 (0.0%) |
| $300 to $499 | 3 (0.4%) | 0 (0.0%) |
| $500 to $799 | 23 (3.2%) | 0 (0.0%) |
| $800 to $999 | 38 (5.3%) | 0 (0.0%) |
| $1,000 to $1,499 | 164 (23.0%) | 0 (0.0%) |
| $1,500 to $1,999 | 46 (6.4%) | 0 (0.0%) |
| $2,000 to $2,499 | 34 (4.8%) | 0 (0.0%) |
| $2,500 to $2,999 | 28 (3.9%) | 0 (0.0%) |
| $3,000 or more | 378 (52.9%) | 0 (0.0%) |
| Total | 714 (100.0%) | 3 (100.0%) |
Physical Housing Characteristics in Columbine Valley
Housing Structures in Columbine Valley
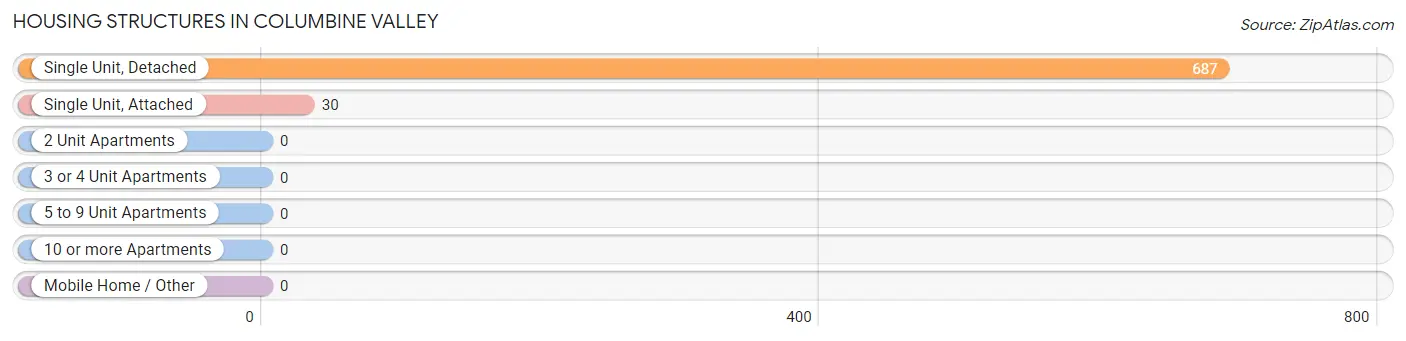
| Structure Type | # Housing Units | % Housing Units |
| Single Unit, Detached | 687 | 95.8% |
| Single Unit, Attached | 30 | 4.2% |
| 2 Unit Apartments | 0 | 0.0% |
| 3 or 4 Unit Apartments | 0 | 0.0% |
| 5 to 9 Unit Apartments | 0 | 0.0% |
| 10 or more Apartments | 0 | 0.0% |
| Mobile Home / Other | 0 | 0.0% |
| Total | 717 | 100.0% |
Housing Structures by Occupancy in Columbine Valley
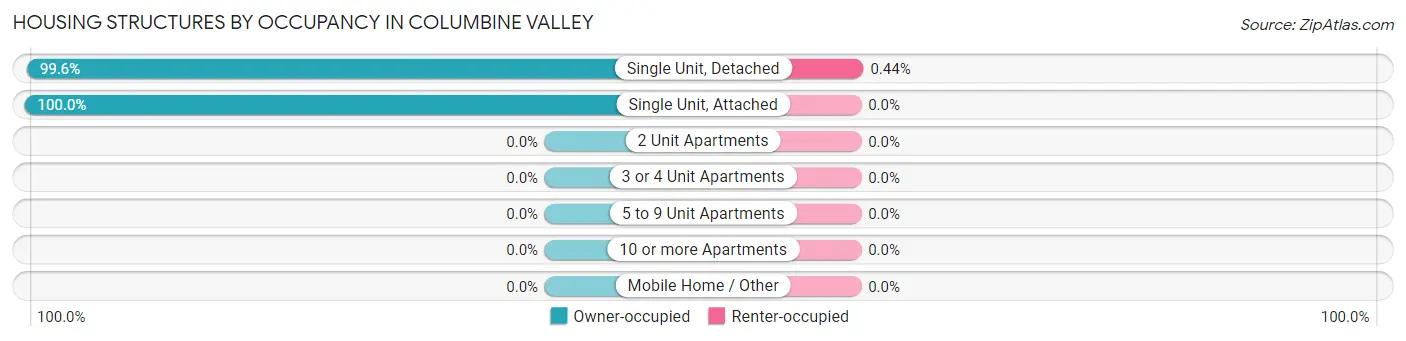
| Structure Type | Owner-occupied | Renter-occupied |
| Single Unit, Detached | 684 (99.6%) | 3 (0.4%) |
| Single Unit, Attached | 30 (100.0%) | 0 (0.0%) |
| 2 Unit Apartments | 0 (0.0%) | 0 (0.0%) |
| 3 or 4 Unit Apartments | 0 (0.0%) | 0 (0.0%) |
| 5 to 9 Unit Apartments | 0 (0.0%) | 0 (0.0%) |
| 10 or more Apartments | 0 (0.0%) | 0 (0.0%) |
| Mobile Home / Other | 0 (0.0%) | 0 (0.0%) |
| Total | 714 (99.6%) | 3 (0.4%) |
Housing Structures by Number of Rooms in Columbine Valley
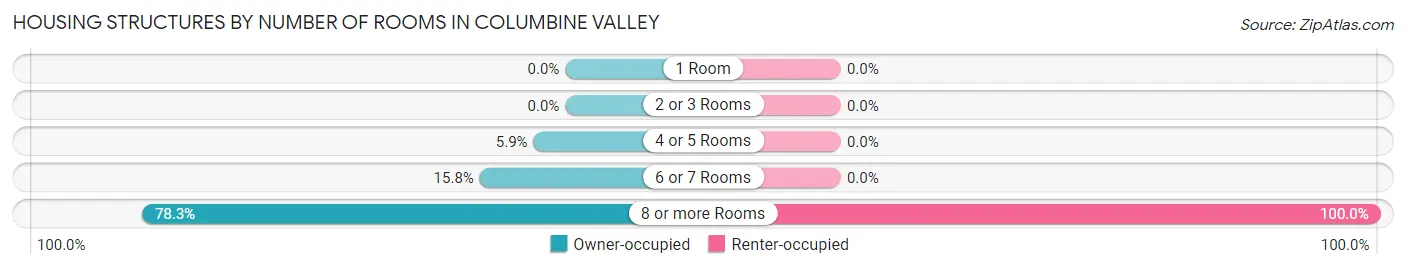
| Number of Rooms | Owner-occupied | Renter-occupied |
| 1 Room | 0 (0.0%) | 0 (0.0%) |
| 2 or 3 Rooms | 0 (0.0%) | 0 (0.0%) |
| 4 or 5 Rooms | 42 (5.9%) | 0 (0.0%) |
| 6 or 7 Rooms | 113 (15.8%) | 0 (0.0%) |
| 8 or more Rooms | 559 (78.3%) | 3 (100.0%) |
| Total | 714 (100.0%) | 3 (100.0%) |
Housing Structure by Heating Type in Columbine Valley
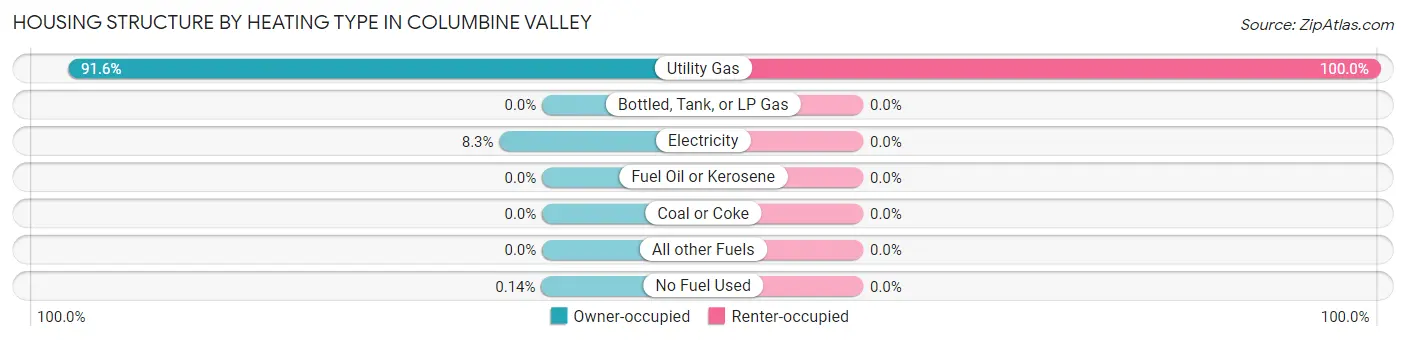
| Heating Type | Owner-occupied | Renter-occupied |
| Utility Gas | 654 (91.6%) | 3 (100.0%) |
| Bottled, Tank, or LP Gas | 0 (0.0%) | 0 (0.0%) |
| Electricity | 59 (8.3%) | 0 (0.0%) |
| Fuel Oil or Kerosene | 0 (0.0%) | 0 (0.0%) |
| Coal or Coke | 0 (0.0%) | 0 (0.0%) |
| All other Fuels | 0 (0.0%) | 0 (0.0%) |
| No Fuel Used | 1 (0.1%) | 0 (0.0%) |
| Total | 714 (100.0%) | 3 (100.0%) |
Household Vehicle Usage in Columbine Valley
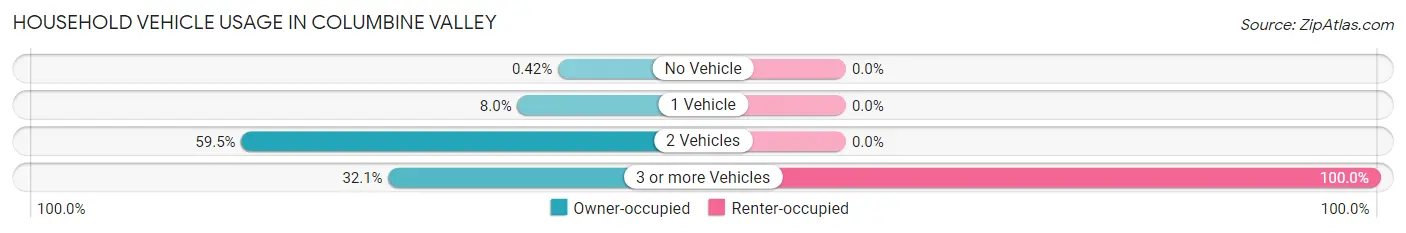
| Vehicles per Household | Owner-occupied | Renter-occupied |
| No Vehicle | 3 (0.4%) | 0 (0.0%) |
| 1 Vehicle | 57 (8.0%) | 0 (0.0%) |
| 2 Vehicles | 425 (59.5%) | 0 (0.0%) |
| 3 or more Vehicles | 229 (32.1%) | 3 (100.0%) |
| Total | 714 (100.0%) | 3 (100.0%) |
Real Estate & Mortgages in Columbine Valley
Real Estate and Mortgage Overview in Columbine Valley
| Characteristic | Without Mortgage | With Mortgage |
| Housing Units | 266 | 448 |
| Median Property Value | $1,205,400 | $1,407,900 |
| Median Household Income | $171,250 | $354 |
| Monthly Housing Costs | $1,196 | $375 |
| Real Estate Taxes | $7,228 | $0 |
Property Value by Mortgage Status in Columbine Valley
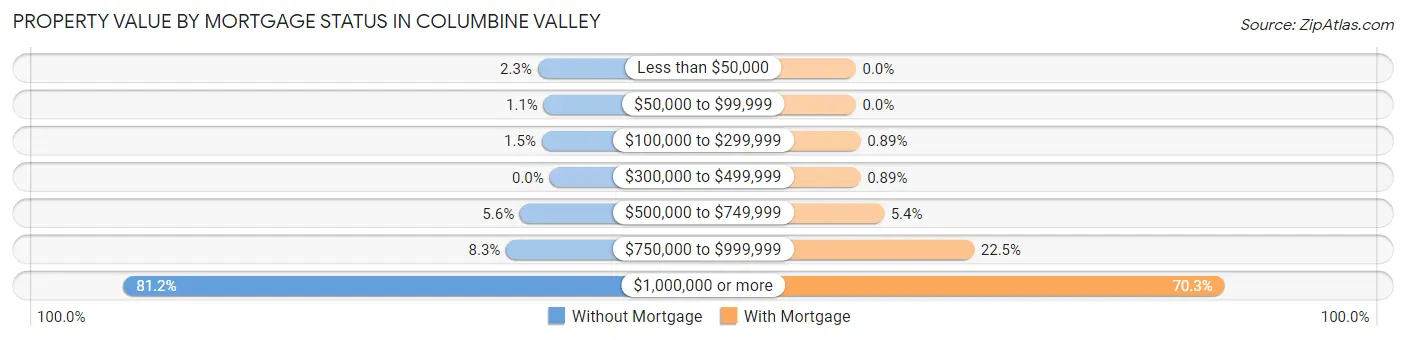
| Property Value | Without Mortgage | With Mortgage |
| Less than $50,000 | 6 (2.3%) | 0 (0.0%) |
| $50,000 to $99,999 | 3 (1.1%) | 0 (0.0%) |
| $100,000 to $299,999 | 4 (1.5%) | 4 (0.9%) |
| $300,000 to $499,999 | 0 (0.0%) | 4 (0.9%) |
| $500,000 to $749,999 | 15 (5.6%) | 24 (5.4%) |
| $750,000 to $999,999 | 22 (8.3%) | 101 (22.5%) |
| $1,000,000 or more | 216 (81.2%) | 315 (70.3%) |
| Total | 266 (100.0%) | 448 (100.0%) |
Household Income by Mortgage Status in Columbine Valley
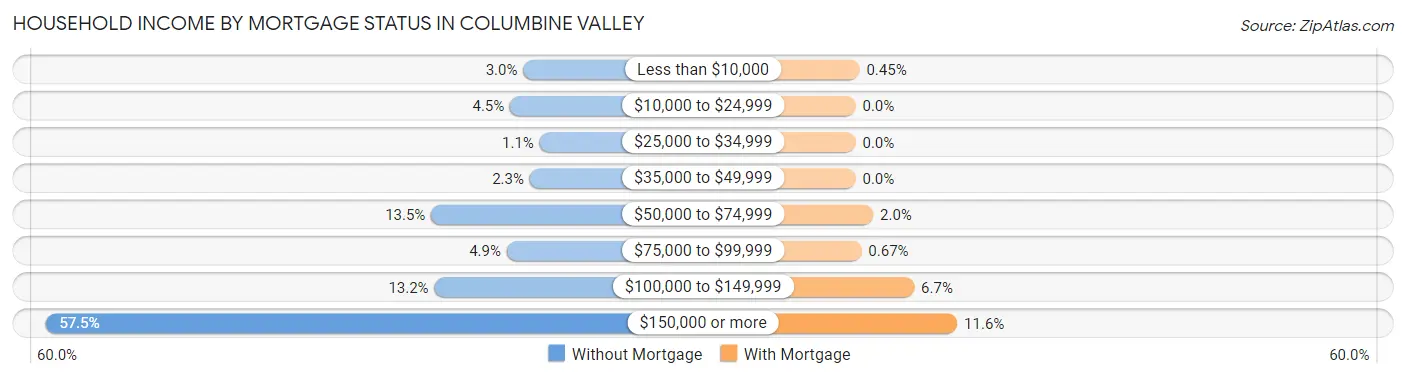
| Household Income | Without Mortgage | With Mortgage |
| Less than $10,000 | 8 (3.0%) | 2 (0.4%) |
| $10,000 to $24,999 | 12 (4.5%) | 0 (0.0%) |
| $25,000 to $34,999 | 3 (1.1%) | 0 (0.0%) |
| $35,000 to $49,999 | 6 (2.3%) | 0 (0.0%) |
| $50,000 to $74,999 | 36 (13.5%) | 9 (2.0%) |
| $75,000 to $99,999 | 13 (4.9%) | 3 (0.7%) |
| $100,000 to $149,999 | 35 (13.2%) | 30 (6.7%) |
| $150,000 or more | 153 (57.5%) | 52 (11.6%) |
| Total | 266 (100.0%) | 448 (100.0%) |
Property Value to Household Income Ratio in Columbine Valley
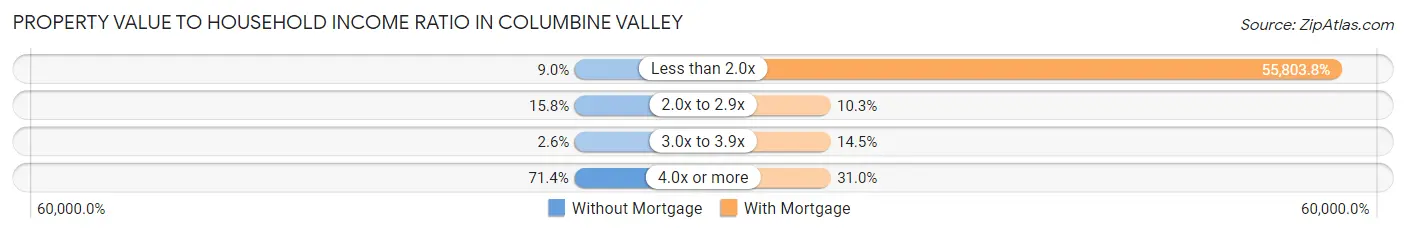
| Value-to-Income Ratio | Without Mortgage | With Mortgage |
| Less than 2.0x | 24 (9.0%) | 250,001 (55,803.8%) |
| 2.0x to 2.9x | 42 (15.8%) | 46 (10.3%) |
| 3.0x to 3.9x | 7 (2.6%) | 65 (14.5%) |
| 4.0x or more | 190 (71.4%) | 139 (31.0%) |
| Total | 266 (100.0%) | 448 (100.0%) |
Real Estate Taxes by Mortgage Status in Columbine Valley
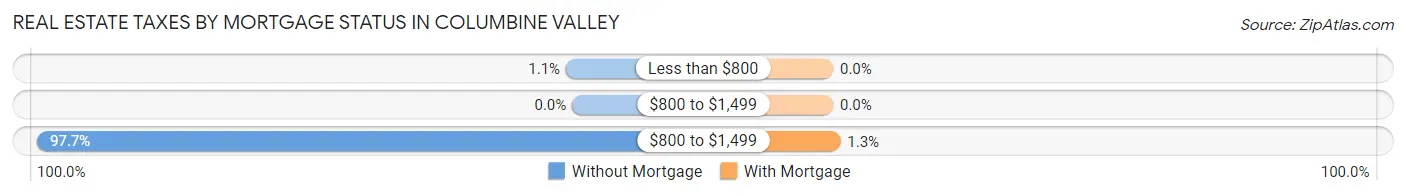
| Property Taxes | Without Mortgage | With Mortgage |
| Less than $800 | 3 (1.1%) | 0 (0.0%) |
| $800 to $1,499 | 0 (0.0%) | 0 (0.0%) |
| $800 to $1,499 | 260 (97.7%) | 6 (1.3%) |
| Total | 266 (100.0%) | 448 (100.0%) |
Health & Disability in Columbine Valley
Health Insurance Coverage by Age in Columbine Valley
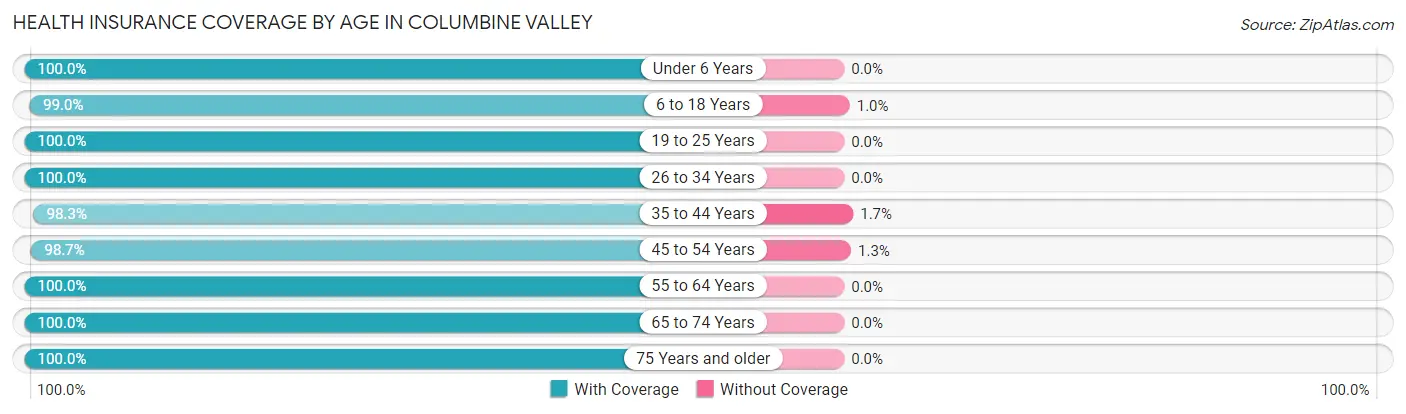
| Age Bracket | With Coverage | Without Coverage |
| Under 6 Years | 91 (100.0%) | 0 (0.0%) |
| 6 to 18 Years | 387 (99.0%) | 4 (1.0%) |
| 19 to 25 Years | 52 (100.0%) | 0 (0.0%) |
| 26 to 34 Years | 22 (100.0%) | 0 (0.0%) |
| 35 to 44 Years | 234 (98.3%) | 4 (1.7%) |
| 45 to 54 Years | 234 (98.7%) | 3 (1.3%) |
| 55 to 64 Years | 294 (100.0%) | 0 (0.0%) |
| 65 to 74 Years | 425 (100.0%) | 0 (0.0%) |
| 75 Years and older | 178 (100.0%) | 0 (0.0%) |
| Total | 1,917 (99.4%) | 11 (0.6%) |
Health Insurance Coverage by Citizenship Status in Columbine Valley
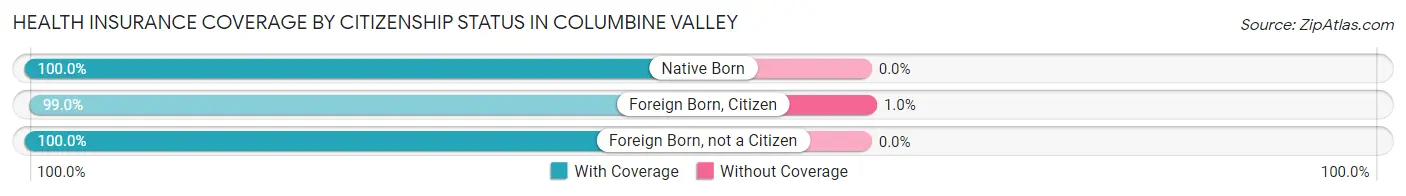
| Citizenship Status | With Coverage | Without Coverage |
| Native Born | 91 (100.0%) | 0 (0.0%) |
| Foreign Born, Citizen | 387 (99.0%) | 4 (1.0%) |
| Foreign Born, not a Citizen | 52 (100.0%) | 0 (0.0%) |
Health Insurance Coverage by Household Income in Columbine Valley
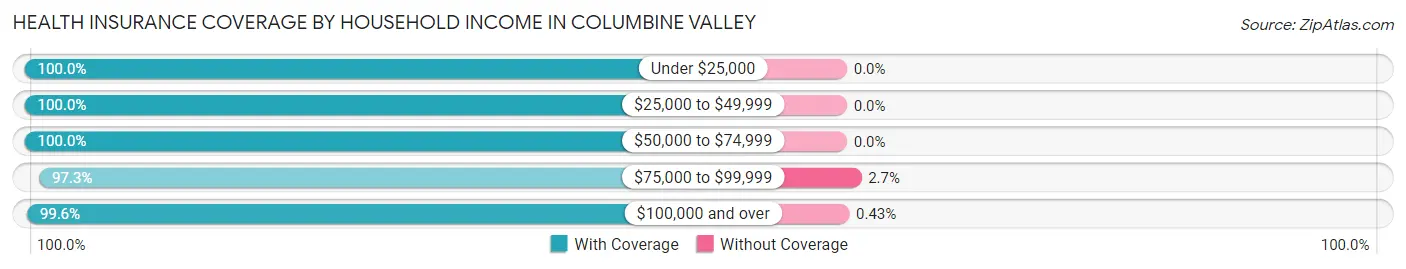
| Household Income | With Coverage | Without Coverage |
| Under $25,000 | 24 (100.0%) | 0 (0.0%) |
| $25,000 to $49,999 | 41 (100.0%) | 0 (0.0%) |
| $50,000 to $74,999 | 73 (100.0%) | 0 (0.0%) |
| $75,000 to $99,999 | 144 (97.3%) | 4 (2.7%) |
| $100,000 and over | 1,635 (99.6%) | 7 (0.4%) |
Public vs Private Health Insurance Coverage by Age in Columbine Valley
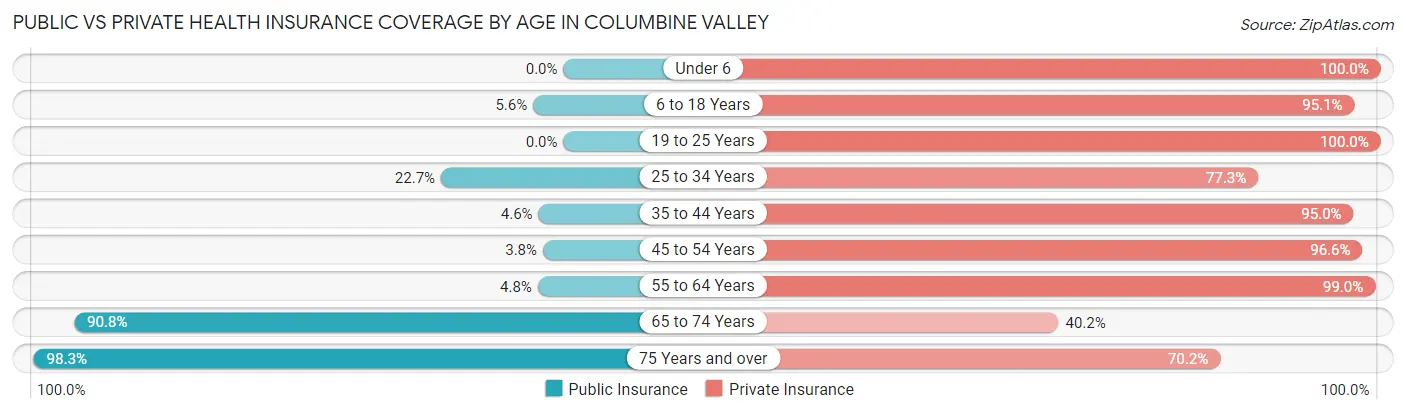
| Age Bracket | Public Insurance | Private Insurance |
| Under 6 | 0 (0.0%) | 91 (100.0%) |
| 6 to 18 Years | 22 (5.6%) | 372 (95.1%) |
| 19 to 25 Years | 0 (0.0%) | 52 (100.0%) |
| 25 to 34 Years | 5 (22.7%) | 17 (77.3%) |
| 35 to 44 Years | 11 (4.6%) | 226 (95.0%) |
| 45 to 54 Years | 9 (3.8%) | 229 (96.6%) |
| 55 to 64 Years | 14 (4.8%) | 291 (99.0%) |
| 65 to 74 Years | 386 (90.8%) | 171 (40.2%) |
| 75 Years and over | 175 (98.3%) | 125 (70.2%) |
| Total | 622 (32.3%) | 1,574 (81.6%) |
Disability Status by Sex by Age in Columbine Valley
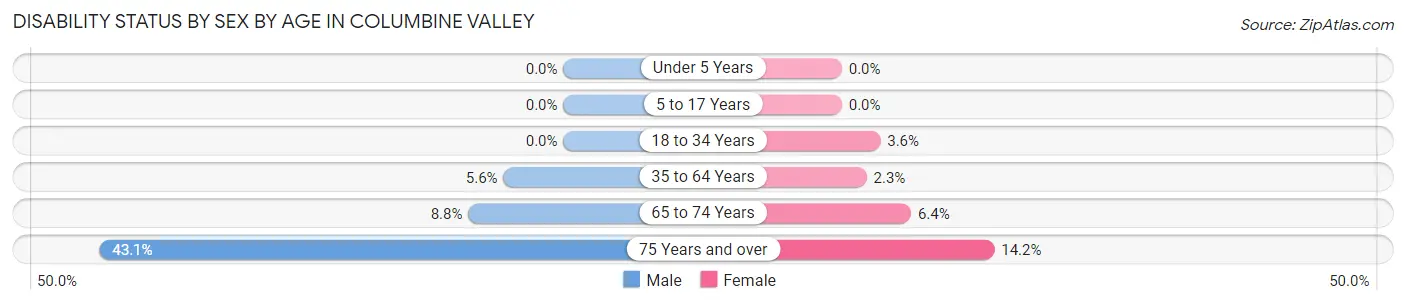
| Age Bracket | Male | Female |
| Under 5 Years | 0 (0.0%) | 0 (0.0%) |
| 5 to 17 Years | 0 (0.0%) | 0 (0.0%) |
| 18 to 34 Years | 0 (0.0%) | 3 (3.6%) |
| 35 to 64 Years | 21 (5.6%) | 9 (2.3%) |
| 65 to 74 Years | 21 (8.8%) | 12 (6.4%) |
| 75 Years and over | 31 (43.1%) | 15 (14.1%) |
Disability Class by Sex by Age in Columbine Valley
Disability Class: Hearing Difficulty
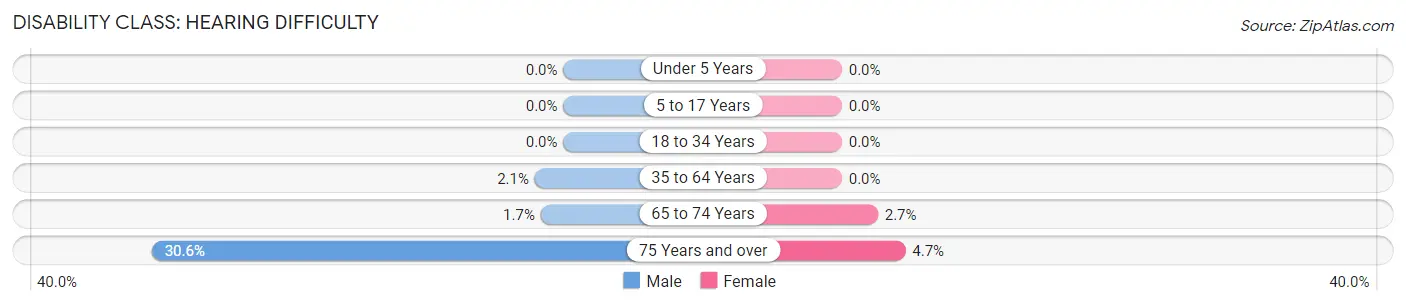
| Age Bracket | Male | Female |
| Under 5 Years | 0 (0.0%) | 0 (0.0%) |
| 5 to 17 Years | 0 (0.0%) | 0 (0.0%) |
| 18 to 34 Years | 0 (0.0%) | 0 (0.0%) |
| 35 to 64 Years | 8 (2.1%) | 0 (0.0%) |
| 65 to 74 Years | 4 (1.7%) | 5 (2.7%) |
| 75 Years and over | 22 (30.6%) | 5 (4.7%) |
Disability Class: Vision Difficulty
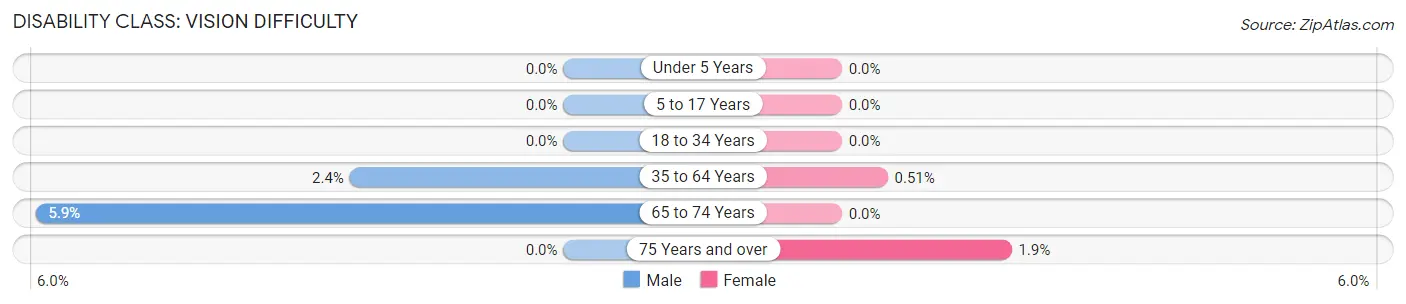
| Age Bracket | Male | Female |
| Under 5 Years | 0 (0.0%) | 0 (0.0%) |
| 5 to 17 Years | 0 (0.0%) | 0 (0.0%) |
| 18 to 34 Years | 0 (0.0%) | 0 (0.0%) |
| 35 to 64 Years | 9 (2.4%) | 2 (0.5%) |
| 65 to 74 Years | 14 (5.9%) | 0 (0.0%) |
| 75 Years and over | 0 (0.0%) | 2 (1.9%) |
Disability Class: Cognitive Difficulty
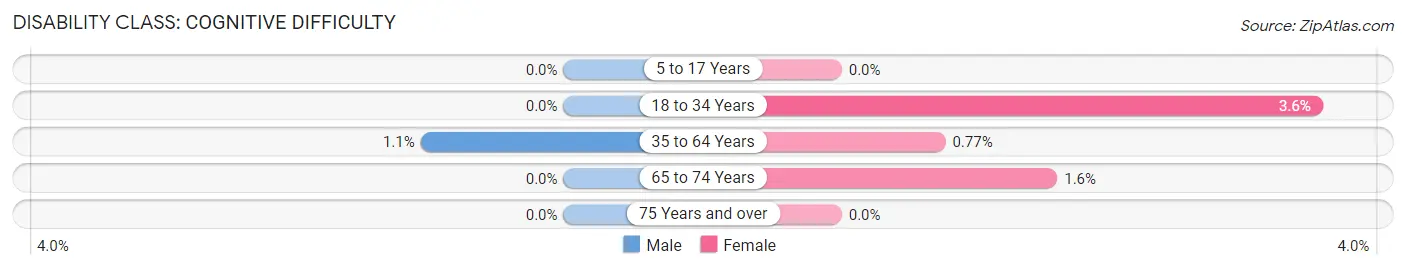
| Age Bracket | Male | Female |
| 5 to 17 Years | 0 (0.0%) | 0 (0.0%) |
| 18 to 34 Years | 0 (0.0%) | 3 (3.6%) |
| 35 to 64 Years | 4 (1.1%) | 3 (0.8%) |
| 65 to 74 Years | 0 (0.0%) | 3 (1.6%) |
| 75 Years and over | 0 (0.0%) | 0 (0.0%) |
Disability Class: Ambulatory Difficulty
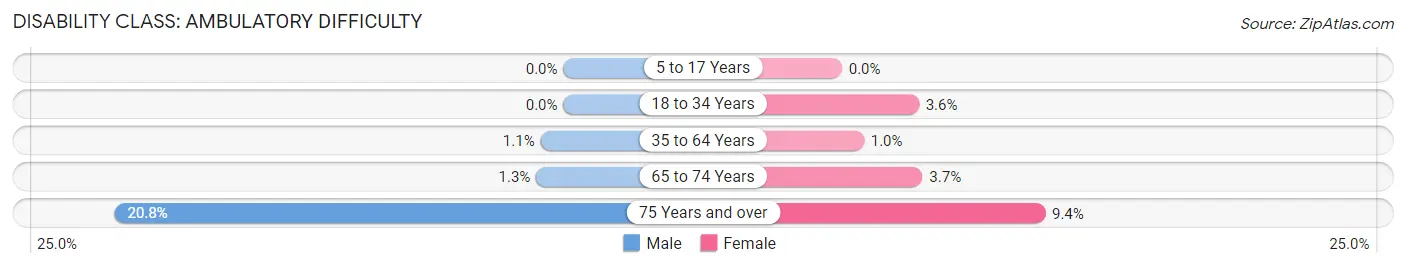
| Age Bracket | Male | Female |
| 5 to 17 Years | 0 (0.0%) | 0 (0.0%) |
| 18 to 34 Years | 0 (0.0%) | 3 (3.6%) |
| 35 to 64 Years | 4 (1.1%) | 4 (1.0%) |
| 65 to 74 Years | 3 (1.3%) | 7 (3.7%) |
| 75 Years and over | 15 (20.8%) | 10 (9.4%) |
Disability Class: Self-Care Difficulty
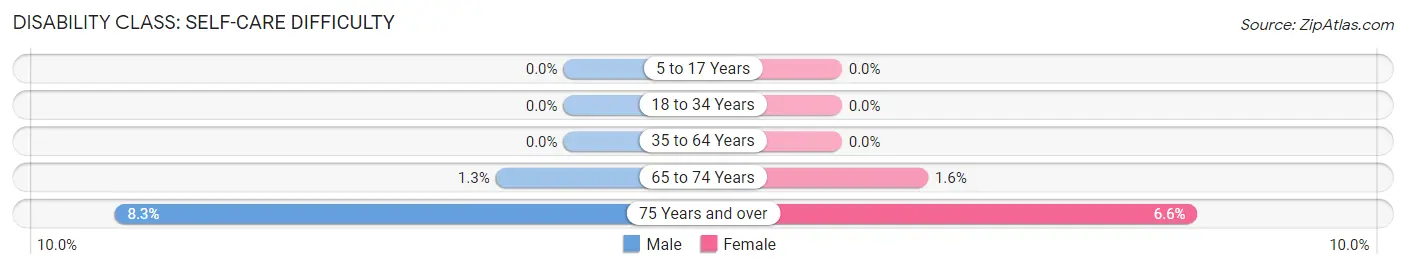
| Age Bracket | Male | Female |
| 5 to 17 Years | 0 (0.0%) | 0 (0.0%) |
| 18 to 34 Years | 0 (0.0%) | 0 (0.0%) |
| 35 to 64 Years | 0 (0.0%) | 0 (0.0%) |
| 65 to 74 Years | 3 (1.3%) | 3 (1.6%) |
| 75 Years and over | 6 (8.3%) | 7 (6.6%) |
Technology Access in Columbine Valley
Computing Device Access in Columbine Valley
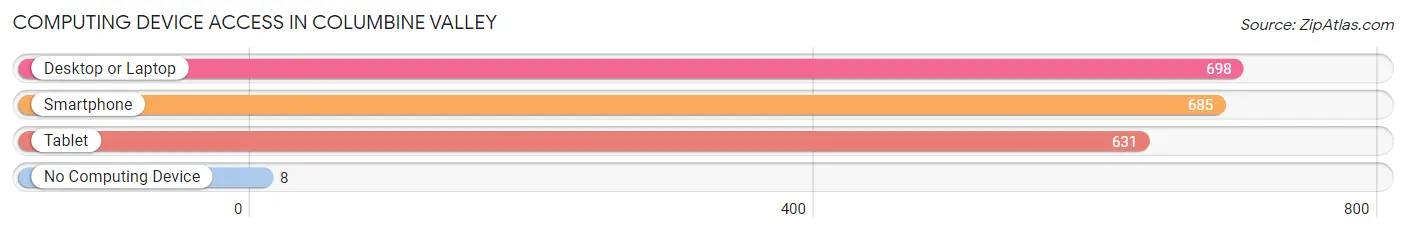
| Device Type | # Households | % Households |
| Desktop or Laptop | 698 | 97.4% |
| Smartphone | 685 | 95.5% |
| Tablet | 631 | 88.0% |
| No Computing Device | 8 | 1.1% |
| Total | 717 | 100.0% |
Internet Access in Columbine Valley
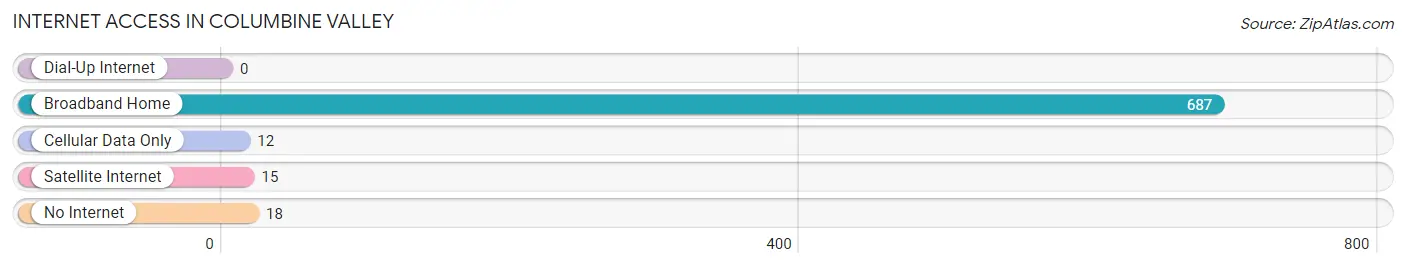
| Internet Type | # Households | % Households |
| Dial-Up Internet | 0 | 0.0% |
| Broadband Home | 687 | 95.8% |
| Cellular Data Only | 12 | 1.7% |
| Satellite Internet | 15 | 2.1% |
| No Internet | 18 | 2.5% |
| Total | 717 | 100.0% |
Columbine Valley Summary
History
The area now known as Columbine Valley, Colorado was first settled by Native Americans, including the Ute and Arapaho tribes. The first Europeans to settle in the area were miners and ranchers in the late 1800s. The area was officially incorporated as a town in 1951, and was named after the state flower, the columbine.
Geography
Columbine Valley is located in the foothills of the Rocky Mountains in Jefferson County, Colorado. It is situated at an elevation of 5,890 feet above sea level. The town is bordered by the cities of Littleton and Englewood to the north, and the towns of Bow Mar and Columbine to the south. The town covers an area of 1.2 square miles, and is home to approximately 1,400 people.
The town is located in a valley, surrounded by hills and mountains. The area is known for its scenic beauty, with views of the Rocky Mountains and the nearby foothills. The town is also home to several parks and trails, including the Columbine Valley Trail, which runs through the town and connects to nearby trails.
Economy
The economy of Columbine Valley is largely based on the service industry. The town is home to several restaurants, retail stores, and other businesses. The town is also home to several small businesses, including a local brewery, a winery, and a distillery.
The town is also home to several technology companies, including a software development company and a web design firm. The town is also home to several medical offices, including a family practice and a dental office.
Demographics
As of the 2010 census, the population of Columbine Valley was 1,400. The racial makeup of the town was 94.3% White, 1.3% African American, 0.7% Native American, 0.7% Asian, 0.3% Pacific Islander, and 2.0% from other races. Hispanic or Latino of any race were 4.3% of the population.
The median household income in Columbine Valley was $90,000, and the median family income was $97,000. The per capita income for the town was $37,000. About 4.3% of families and 5.3% of the population were below the poverty line, including 6.3% of those under age 18 and 4.3% of those age 65 or over.
The town is served by the Jefferson County School District, which includes two elementary schools, one middle school, and one high school. The town is also home to several private schools, including a Catholic school and a Montessori school.
Common Questions
What is Per Capita Income in Columbine Valley?
Per Capita income in Columbine Valley is $143,372.
What is the Median Family Income in Columbine Valley?
Median Family Income in Columbine Valley is $250,001.
What is the Median Household income in Columbine Valley?
Median Household Income in Columbine Valley is $250,001.
What is Income or Wage Gap in Columbine Valley?
Income or Wage Gap in Columbine Valley is 75.6%.
Women in Columbine Valley earn 24.4 cents for every dollar earned by a man.
What is Inequality or Gini Index in Columbine Valley?
Inequality or Gini Index in Columbine Valley is 0.45.
What is the Total Population of Columbine Valley?
Total Population of Columbine Valley is 1,928.
What is the Total Male Population of Columbine Valley?
Total Male Population of Columbine Valley is 961.
What is the Total Female Population of Columbine Valley?
Total Female Population of Columbine Valley is 967.
What is the Ratio of Males per 100 Females in Columbine Valley?
There are 99.38 Males per 100 Females in Columbine Valley.
What is the Ratio of Females per 100 Males in Columbine Valley?
There are 100.62 Females per 100 Males in Columbine Valley.
What is the Median Population Age in Columbine Valley?
Median Population Age in Columbine Valley is 51.7 Years.
What is the Average Family Size in Columbine Valley
Average Family Size in Columbine Valley is 2.9 People.
What is the Average Household Size in Columbine Valley
Average Household Size in Columbine Valley is 2.7 People.
How Large is the Labor Force in Columbine Valley?
There are 816 People in the Labor Forcein in Columbine Valley.
What is the Percentage of People in the Labor Force in Columbine Valley?
52.6% of People are in the Labor Force in Columbine Valley.
What is the Unemployment Rate in Columbine Valley?
Unemployment Rate in Columbine Valley is 0.5%.