Blende, CO Map & Demographics
Blende Map
Blende Overview
$32,256
PER CAPITA INCOME
$59,145
AVG FAMILY INCOME
$58,750
AVG HOUSEHOLD INCOME
22.8%
WAGE / INCOME GAP [ % ]
77.2¢/ $1
WAGE / INCOME GAP [ $ ]
0.37
INEQUALITY / GINI INDEX
663
TOTAL POPULATION
353
MALE POPULATION
310
FEMALE POPULATION
113.87
MALES / 100 FEMALES
87.82
FEMALES / 100 MALES
50.5
MEDIAN AGE
2.9
AVG FAMILY SIZE
2.3
AVG HOUSEHOLD SIZE
339
LABOR FORCE [ PEOPLE ]
58.8%
PERCENT IN LABOR FORCE
7.4%
UNEMPLOYMENT RATE
Income in Blende
Income Overview in Blende
Per Capita Income in Blende is $32,256, while median incomes of families and households are $59,145 and $58,750 respectively.
| Characteristic | Number | Measure |
| Per Capita Income | 663 | $32,256 |
| Median Family Income | 172 | $59,145 |
| Mean Family Income | 172 | $85,976 |
| Median Household Income | 290 | $58,750 |
| Mean Household Income | 290 | $70,211 |
| Income Deficit | 172 | $0 |
| Wage / Income Gap (%) | 663 | 22.75% |
| Wage / Income Gap ($) | 663 | 77.25¢ per $1 |
| Gini / Inequality Index | 663 | 0.37 |
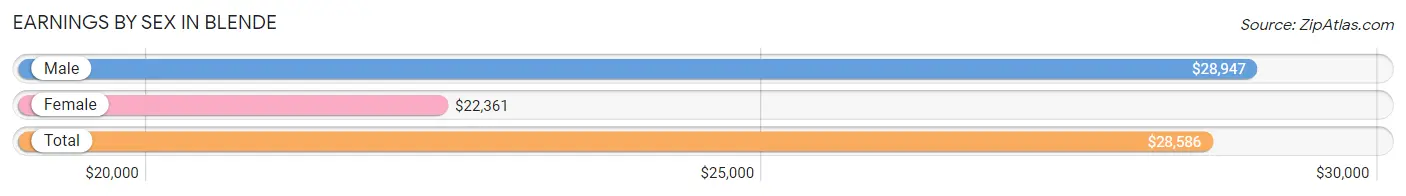
Earnings by Sex in Blende
Average Earnings in Blende are $28,586, $28,947 for men and $22,361 for women, a difference of 22.8%.
| Sex | Number | Average Earnings |
| Male | 226 (65.1%) | $28,947 |
| Female | 121 (34.9%) | $22,361 |
| Total | 347 (100.0%) | $28,586 |
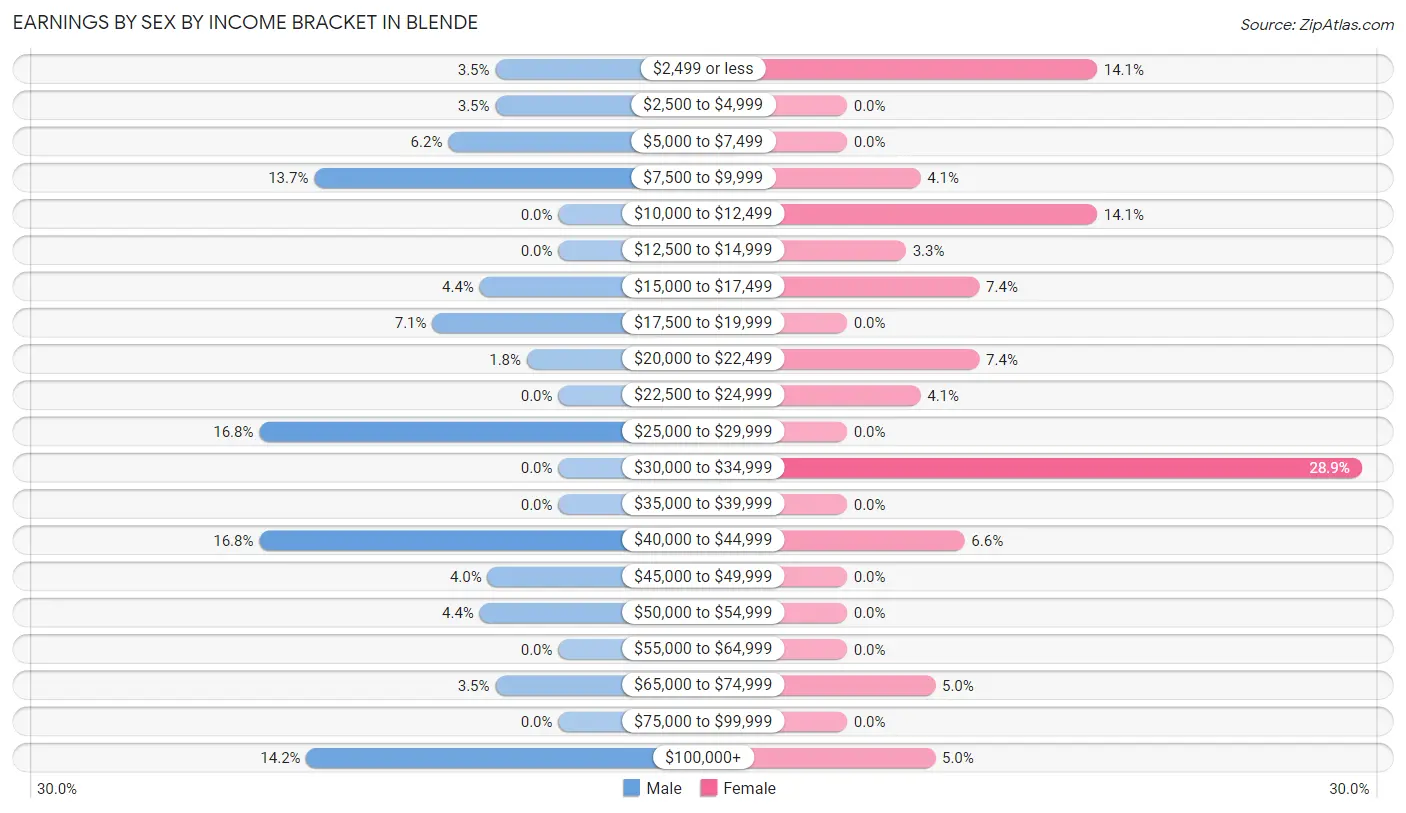
Earnings by Sex by Income Bracket in Blende
The most common earnings brackets in Blende are $25,000 to $29,999 for men (38 | 16.8%) and $30,000 to $34,999 for women (35 | 28.9%).
| Income | Male | Female |
| $2,499 or less | 8 (3.5%) | 17 (14.1%) |
| $2,500 to $4,999 | 8 (3.5%) | 0 (0.0%) |
| $5,000 to $7,499 | 14 (6.2%) | 0 (0.0%) |
| $7,500 to $9,999 | 31 (13.7%) | 5 (4.1%) |
| $10,000 to $12,499 | 0 (0.0%) | 17 (14.1%) |
| $12,500 to $14,999 | 0 (0.0%) | 4 (3.3%) |
| $15,000 to $17,499 | 10 (4.4%) | 9 (7.4%) |
| $17,500 to $19,999 | 16 (7.1%) | 0 (0.0%) |
| $20,000 to $22,499 | 4 (1.8%) | 9 (7.4%) |
| $22,500 to $24,999 | 0 (0.0%) | 5 (4.1%) |
| $25,000 to $29,999 | 38 (16.8%) | 0 (0.0%) |
| $30,000 to $34,999 | 0 (0.0%) | 35 (28.9%) |
| $35,000 to $39,999 | 0 (0.0%) | 0 (0.0%) |
| $40,000 to $44,999 | 38 (16.8%) | 8 (6.6%) |
| $45,000 to $49,999 | 9 (4.0%) | 0 (0.0%) |
| $50,000 to $54,999 | 10 (4.4%) | 0 (0.0%) |
| $55,000 to $64,999 | 0 (0.0%) | 0 (0.0%) |
| $65,000 to $74,999 | 8 (3.5%) | 6 (5.0%) |
| $75,000 to $99,999 | 0 (0.0%) | 0 (0.0%) |
| $100,000+ | 32 (14.2%) | 6 (5.0%) |
| Total | 226 (100.0%) | 121 (100.0%) |
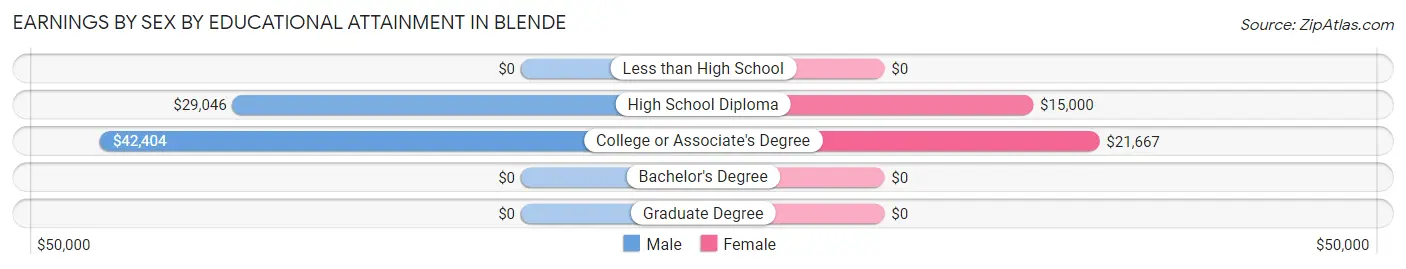
Earnings by Sex by Educational Attainment in Blende
Average earnings in Blende are $35,000 for men and $15,000 for women, a difference of 57.1%. Men with an educational attainment of college or associate's degree enjoy the highest average annual earnings of $42,404, while those with high school diploma education earn the least with $29,046. Women with an educational attainment of college or associate's degree earn the most with the average annual earnings of $21,667, while those with high school diploma education have the smallest earnings of $15,000.
| Educational Attainment | Male Income | Female Income |
| Less than High School | - | - |
| High School Diploma | $29,046 | $15,000 |
| College or Associate's Degree | $42,404 | $21,667 |
| Bachelor's Degree | - | - |
| Graduate Degree | - | - |
| Total | $35,000 | $15,000 |
Family Income in Blende
Family Income Brackets in Blende
According to the Blende family income data, there are 81 families falling into the $50,000 to $74,999 income range, which is the most common income bracket and makes up 47.1% of all families.
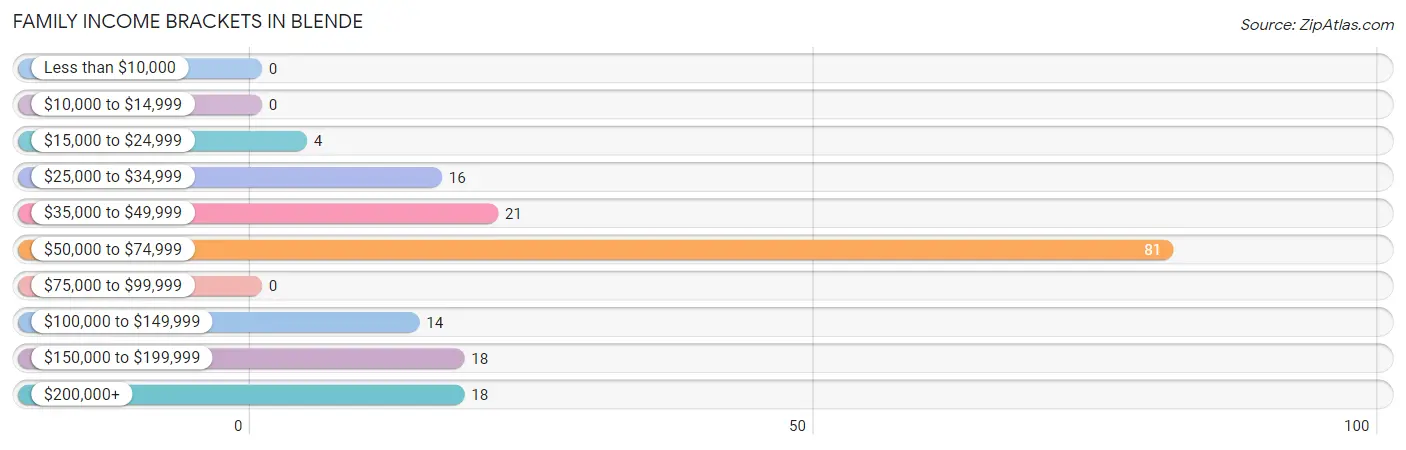
| Income Bracket | # Families | % Families |
| Less than $10,000 | 0 | 0.0% |
| $10,000 to $14,999 | 0 | 0.0% |
| $15,000 to $24,999 | 4 | 2.3% |
| $25,000 to $34,999 | 16 | 9.3% |
| $35,000 to $49,999 | 21 | 12.2% |
| $50,000 to $74,999 | 81 | 47.1% |
| $75,000 to $99,999 | 0 | 0.0% |
| $100,000 to $149,999 | 14 | 8.1% |
| $150,000 to $199,999 | 18 | 10.5% |
| $200,000+ | 18 | 10.5% |
Family Income by Famaliy Size in Blende
2-person families (90 | 52.3%) account for the highest median family income in Blende with $59,671 per family, while 2-person families (90 | 52.3%) have the highest median income of $29,836 per family member.
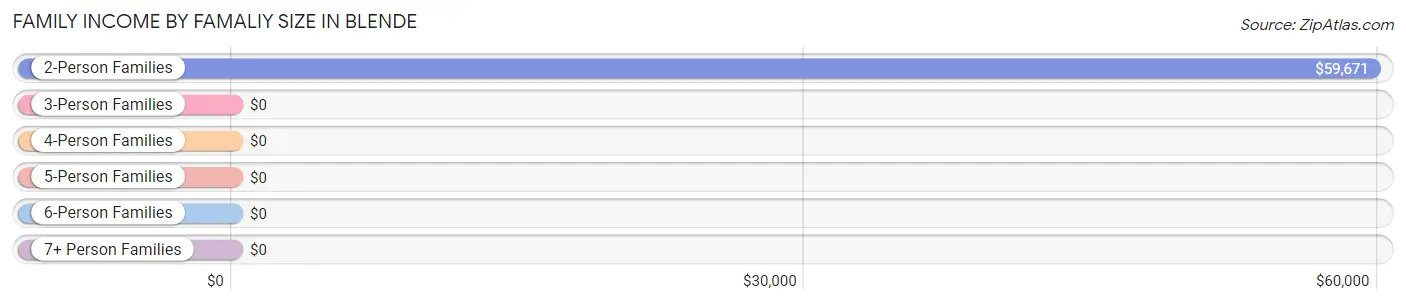
| Income Bracket | # Families | Median Income |
| 2-Person Families | 90 (52.3%) | $59,671 |
| 3-Person Families | 59 (34.3%) | $0 |
| 4-Person Families | 13 (7.6%) | $0 |
| 5-Person Families | 6 (3.5%) | $0 |
| 6-Person Families | 4 (2.3%) | $0 |
| 7+ Person Families | 0 (0.0%) | $0 |
| Total | 172 (100.0%) | $59,145 |
Family Income by Number of Earners in Blende
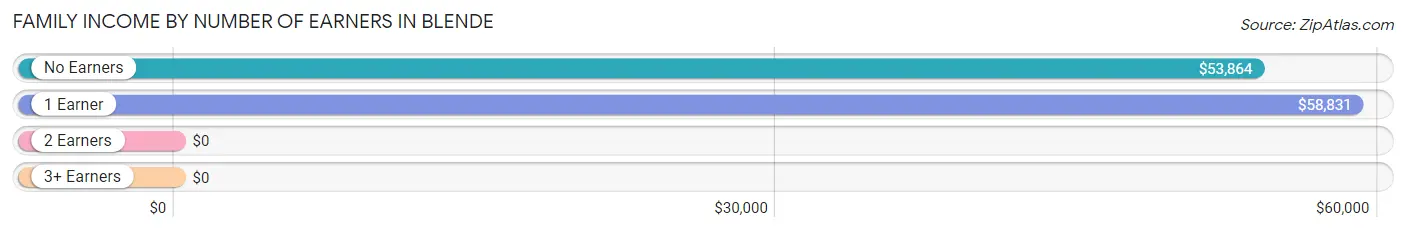
| Number of Earners | # Families | Median Income |
| No Earners | 36 (20.9%) | $53,864 |
| 1 Earner | 73 (42.4%) | $58,831 |
| 2 Earners | 36 (20.9%) | $0 |
| 3+ Earners | 27 (15.7%) | $0 |
| Total | 172 (100.0%) | $59,145 |
Household Income in Blende
Household Income Brackets in Blende
With 116 households falling in the category, the $50,000 to $74,999 income range is the most frequent in Blende, accounting for 40.0% of all households.
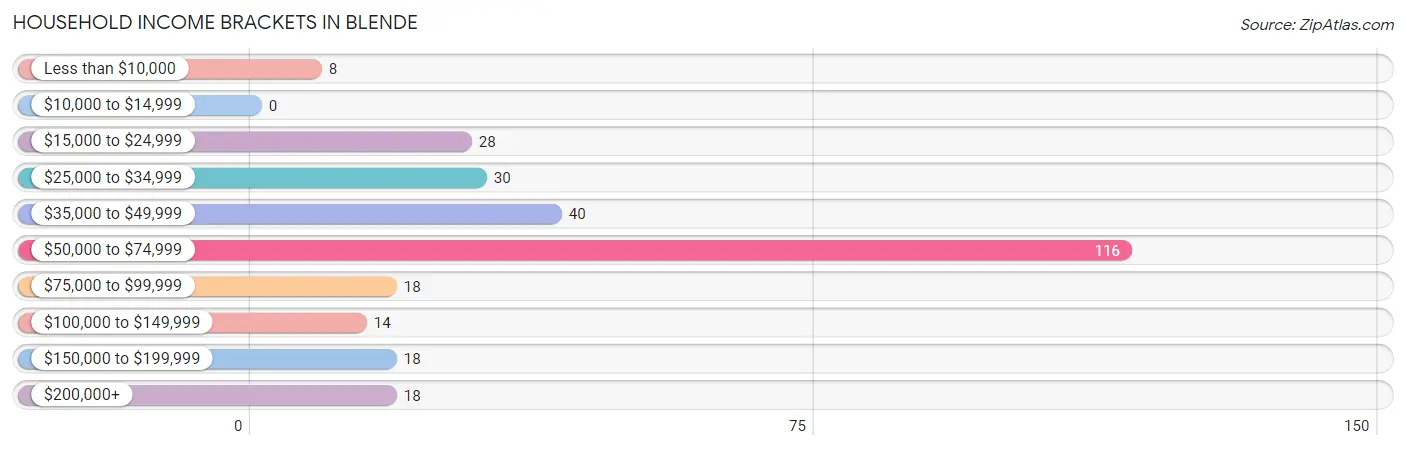
| Income Bracket | # Households | % Households |
| Less than $10,000 | 8 | 2.8% |
| $10,000 to $14,999 | 0 | 0.0% |
| $15,000 to $24,999 | 28 | 9.7% |
| $25,000 to $34,999 | 30 | 10.3% |
| $35,000 to $49,999 | 40 | 13.8% |
| $50,000 to $74,999 | 116 | 40.0% |
| $75,000 to $99,999 | 18 | 6.2% |
| $100,000 to $149,999 | 14 | 4.8% |
| $150,000 to $199,999 | 18 | 6.2% |
| $200,000+ | 18 | 6.2% |
Household Income by Householder Age in Blende
The median household income in Blende is $58,750, with the highest median household income of $53,636 found in the 65+ years age bracket for the primary householder. A total of 154 households (53.1%) fall into this category. Meanwhile, the 15 to 24 years age bracket for the primary householder has the lowest median household income of $0, with 35 households (12.1%) in this group.
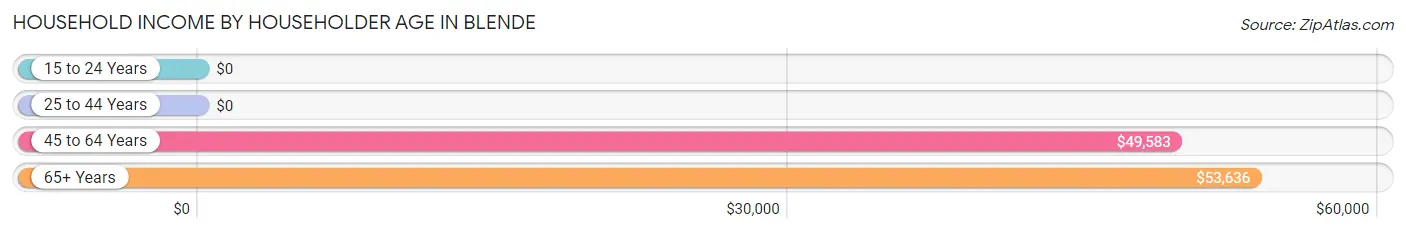
| Income Bracket | # Households | Median Income |
| 15 to 24 Years | 35 (12.1%) | $0 |
| 25 to 44 Years | 36 (12.4%) | $0 |
| 45 to 64 Years | 65 (22.4%) | $49,583 |
| 65+ Years | 154 (53.1%) | $53,636 |
| Total | 290 (100.0%) | $58,750 |
Poverty in Blende
Income Below Poverty by Sex and Age in Blende
With 10.5% poverty level for males and 7.1% for females among the residents of Blende, 12 to 14 year old males and 6 to 11 year old females are the most vulnerable to poverty, with 12 males (60.0%) and 5 females (35.7%) in their respective age groups living below the poverty level.
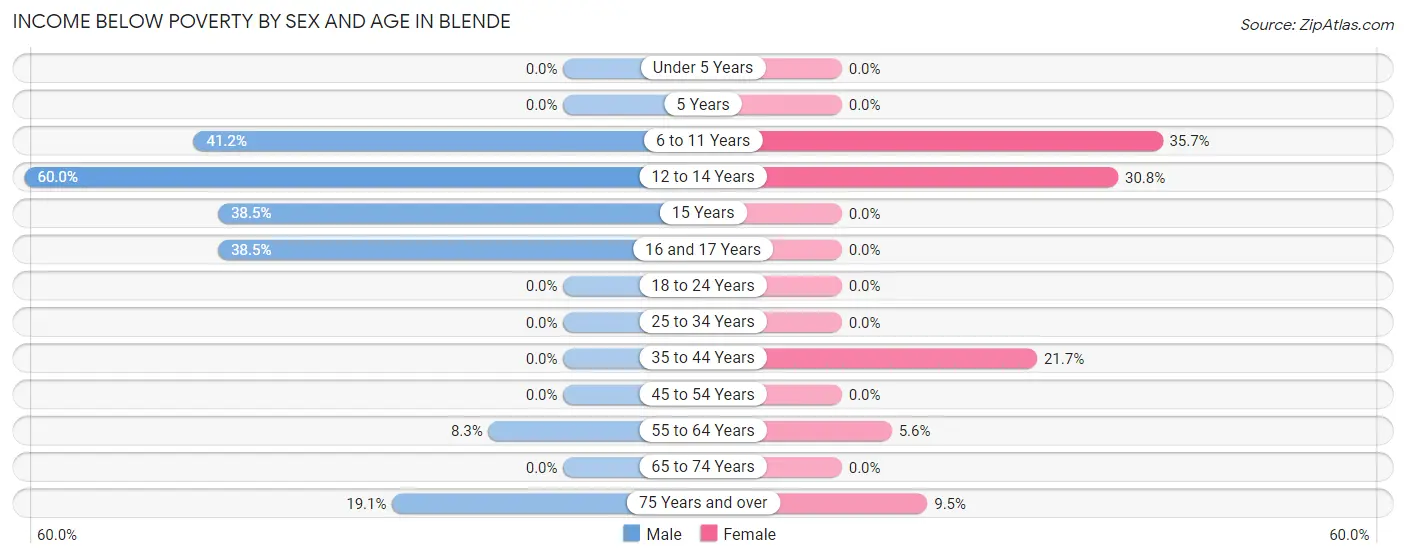
| Age Bracket | Male | Female |
| Under 5 Years | 0 (0.0%) | 0 (0.0%) |
| 5 Years | 0 (0.0%) | 0 (0.0%) |
| 6 to 11 Years | 7 (41.2%) | 5 (35.7%) |
| 12 to 14 Years | 12 (60.0%) | 4 (30.8%) |
| 15 Years | 5 (38.5%) | 0 (0.0%) |
| 16 and 17 Years | 5 (38.5%) | 0 (0.0%) |
| 18 to 24 Years | 0 (0.0%) | 0 (0.0%) |
| 25 to 34 Years | 0 (0.0%) | 0 (0.0%) |
| 35 to 44 Years | 0 (0.0%) | 5 (21.7%) |
| 45 to 54 Years | 0 (0.0%) | 0 (0.0%) |
| 55 to 64 Years | 4 (8.3%) | 4 (5.6%) |
| 65 to 74 Years | 0 (0.0%) | 0 (0.0%) |
| 75 Years and over | 4 (19.1%) | 4 (9.5%) |
| Total | 37 (10.5%) | 22 (7.1%) |
Income Above Poverty by Sex and Age in Blende
According to the poverty statistics in Blende, males aged 18 to 24 years and females aged 5 years are the age groups that are most secure financially, with 100.0% of males and 100.0% of females in these age groups living above the poverty line.
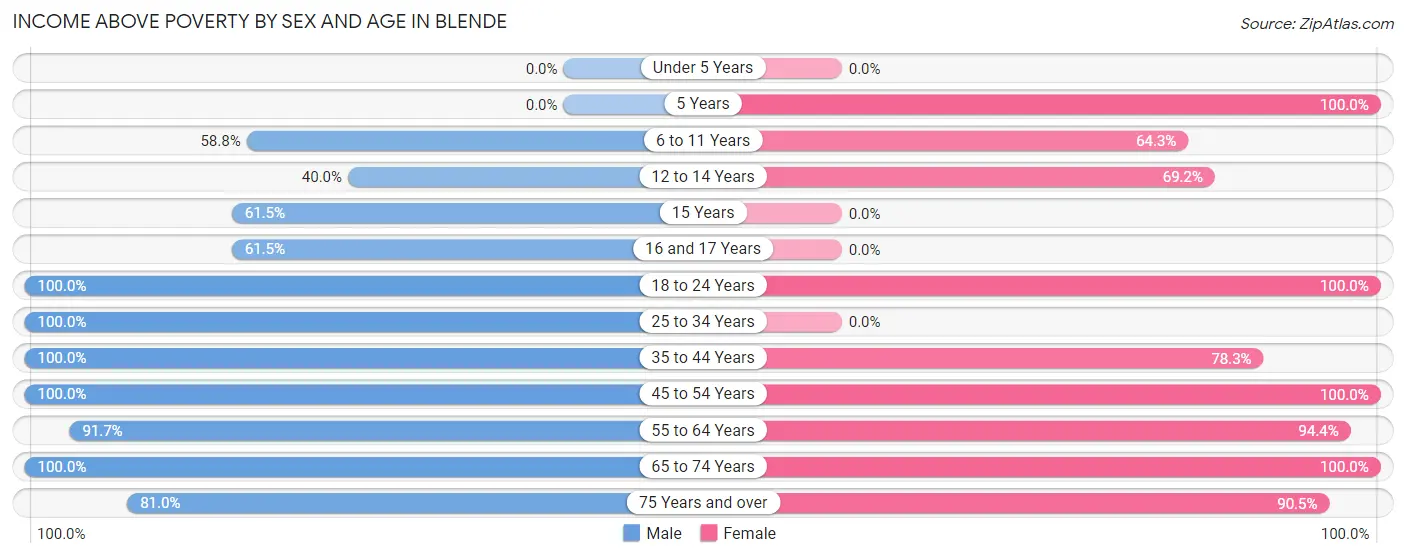
| Age Bracket | Male | Female |
| Under 5 Years | 0 (0.0%) | 0 (0.0%) |
| 5 Years | 0 (0.0%) | 9 (100.0%) |
| 6 to 11 Years | 10 (58.8%) | 9 (64.3%) |
| 12 to 14 Years | 8 (40.0%) | 9 (69.2%) |
| 15 Years | 8 (61.5%) | 0 (0.0%) |
| 16 and 17 Years | 8 (61.5%) | 0 (0.0%) |
| 18 to 24 Years | 24 (100.0%) | 35 (100.0%) |
| 25 to 34 Years | 73 (100.0%) | 0 (0.0%) |
| 35 to 44 Years | 37 (100.0%) | 18 (78.3%) |
| 45 to 54 Years | 19 (100.0%) | 46 (100.0%) |
| 55 to 64 Years | 44 (91.7%) | 68 (94.4%) |
| 65 to 74 Years | 68 (100.0%) | 56 (100.0%) |
| 75 Years and over | 17 (80.9%) | 38 (90.5%) |
| Total | 316 (89.5%) | 288 (92.9%) |
Income Below Poverty Among Married-Couple Families in Blende
The poverty statistics for married-couple families in Blende show that 3.5% or 4 of the total 114 families live below the poverty line. Families with 1 or 2 children have the highest poverty rate of 30.8%, comprising of 4 families. On the other hand, families with no children have the lowest poverty rate of 0.0%, which includes 0 families.
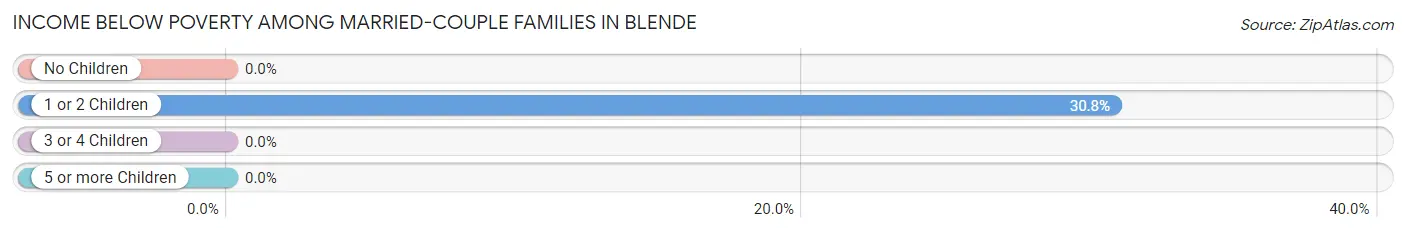
| Children | Above Poverty | Below Poverty |
| No Children | 101 (100.0%) | 0 (0.0%) |
| 1 or 2 Children | 9 (69.2%) | 4 (30.8%) |
| 3 or 4 Children | 0 (0.0%) | 0 (0.0%) |
| 5 or more Children | 0 (0.0%) | 0 (0.0%) |
| Total | 110 (96.5%) | 4 (3.5%) |
Income Below Poverty Among Single-Parent Households in Blende
| Children | Single Father | Single Mother |
| No Children | 0 (0.0%) | 0 (0.0%) |
| 1 or 2 Children | 0 (0.0%) | 0 (0.0%) |
| 3 or 4 Children | 0 (0.0%) | 0 (0.0%) |
| 5 or more Children | 0 (0.0%) | 4 (100.0%) |
| Total | 0 (0.0%) | 4 (6.9%) |
Income Below Poverty Among Married-Couple vs Single-Parent Households in Blende
The poverty data for Blende shows that 4 of the married-couple family households (3.5%) and 4 of the single-parent households (6.9%) are living below the poverty level. Within the married-couple family households, those with 1 or 2 children have the highest poverty rate, with 4 households (30.8%) falling below the poverty line. Among the single-parent households, those with 5 or more children have the highest poverty rate, with 4 household (100.0%) living below poverty.
| Children | Married-Couple Families | Single-Parent Households |
| No Children | 0 (0.0%) | 0 (0.0%) |
| 1 or 2 Children | 4 (30.8%) | 0 (0.0%) |
| 3 or 4 Children | 0 (0.0%) | 0 (0.0%) |
| 5 or more Children | 0 (0.0%) | 4 (100.0%) |
| Total | 4 (3.5%) | 4 (6.9%) |
Race in Blende
The most populous races in Blende are White / Caucasian (521 | 78.6%), Hispanic or Latino (402 | 60.6%), and Native / Alaskan (73 | 11.0%).
| Race | # Population | % Population |
| Asian | 0 | 0.0% |
| Black / African American | 18 | 2.7% |
| Hawaiian / Pacific | 0 | 0.0% |
| Hispanic or Latino | 402 | 60.6% |
| Native / Alaskan | 73 | 11.0% |
| White / Caucasian | 521 | 78.6% |
| Two or more Races | 7 | 1.1% |
| Some other Race | 44 | 6.6% |
| Total | 663 | 100.0% |
Ancestry in Blende
The most populous ancestries reported in Blende are Mexican (282 | 42.5%), Spaniard (68 | 10.3%), German (47 | 7.1%), American (37 | 5.6%), and Italian (36 | 5.4%), together accounting for 70.9% of all Blende residents.
| Ancestry | # Population | % Population |
| African | 14 | 2.1% |
| American | 37 | 5.6% |
| Canadian | 6 | 0.9% |
| English | 24 | 3.6% |
| European | 26 | 3.9% |
| French | 6 | 0.9% |
| German | 47 | 7.1% |
| Greek | 14 | 2.1% |
| Irish | 21 | 3.2% |
| Italian | 36 | 5.4% |
| Mexican | 282 | 42.5% |
| Northern European | 4 | 0.6% |
| Norwegian | 28 | 4.2% |
| Polish | 5 | 0.7% |
| Slovene | 14 | 2.1% |
| Spaniard | 68 | 10.3% |
| Subsaharan African | 14 | 2.1% |
| Welsh | 5 | 0.7% |
| Yugoslavian | 2 | 0.3% | View All 19 Rows |
Immigrants in Blende

| Immigration Origin | # Population | % Population | View All 0 Rows |
Sex and Age in Blende
Sex and Age in Blende
The most populous age groups in Blende are 25 to 29 Years (73 | 20.7%) for men and 60 to 64 Years (54 | 17.4%) for women.
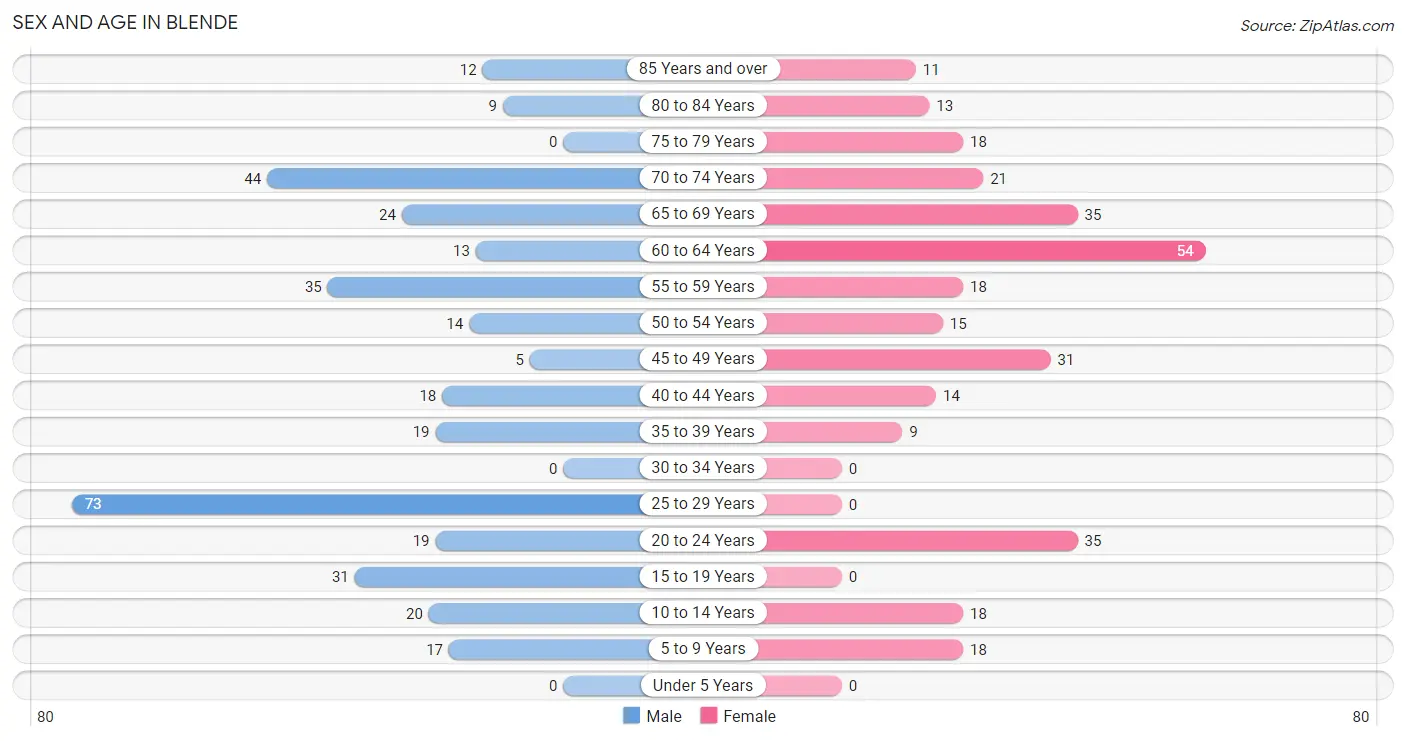
| Age Bracket | Male | Female |
| Under 5 Years | 0 (0.0%) | 0 (0.0%) |
| 5 to 9 Years | 17 (4.8%) | 18 (5.8%) |
| 10 to 14 Years | 20 (5.7%) | 18 (5.8%) |
| 15 to 19 Years | 31 (8.8%) | 0 (0.0%) |
| 20 to 24 Years | 19 (5.4%) | 35 (11.3%) |
| 25 to 29 Years | 73 (20.7%) | 0 (0.0%) |
| 30 to 34 Years | 0 (0.0%) | 0 (0.0%) |
| 35 to 39 Years | 19 (5.4%) | 9 (2.9%) |
| 40 to 44 Years | 18 (5.1%) | 14 (4.5%) |
| 45 to 49 Years | 5 (1.4%) | 31 (10.0%) |
| 50 to 54 Years | 14 (4.0%) | 15 (4.8%) |
| 55 to 59 Years | 35 (9.9%) | 18 (5.8%) |
| 60 to 64 Years | 13 (3.7%) | 54 (17.4%) |
| 65 to 69 Years | 24 (6.8%) | 35 (11.3%) |
| 70 to 74 Years | 44 (12.5%) | 21 (6.8%) |
| 75 to 79 Years | 0 (0.0%) | 18 (5.8%) |
| 80 to 84 Years | 9 (2.5%) | 13 (4.2%) |
| 85 Years and over | 12 (3.4%) | 11 (3.5%) |
| Total | 353 (100.0%) | 310 (100.0%) |
Families and Households in Blende
Median Family Size in Blende
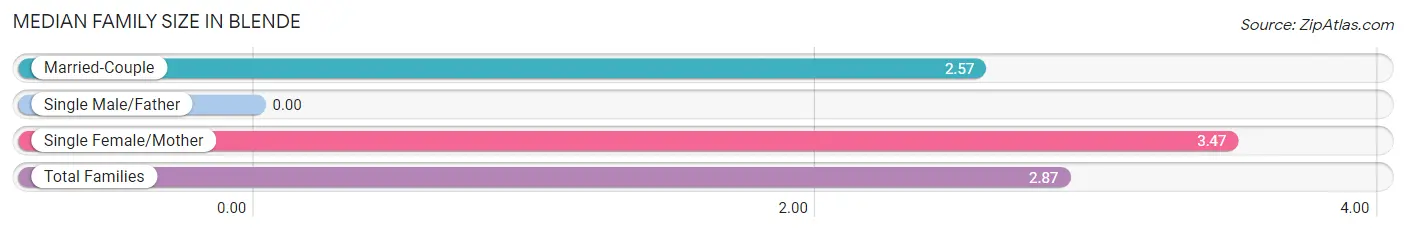
| Family Type | # Families | Family Size |
| Married-Couple | 114 (66.3%) | 2.57 |
| Single Male/Father | 0 (0.0%) | - |
| Single Female/Mother | 58 (33.7%) | 3.47 |
| Total Families | 172 (100.0%) | 2.87 |
Median Household Size in Blende
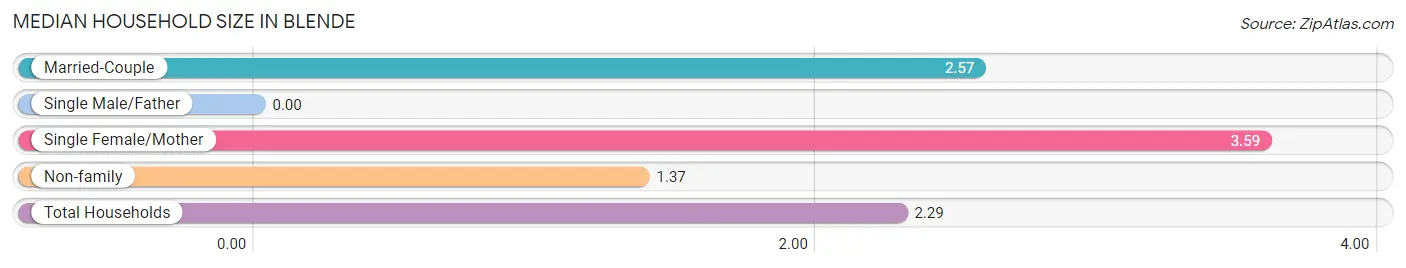
| Household Type | # Households | Household Size |
| Married-Couple | 114 (39.3%) | 2.57 |
| Single Male/Father | 0 (0.0%) | - |
| Single Female/Mother | 58 (20.0%) | 3.59 |
| Non-family | 118 (40.7%) | 1.37 |
| Total Households | 290 (100.0%) | 2.29 |
Household Size by Marriage Status in Blende
Out of a total of 290 households in Blende, 172 (59.3%) are family households, while 118 (40.7%) are nonfamily households. The most numerous type of family households are 2-person households, comprising 90, and the most common type of nonfamily households are 1-person households, comprising 77.
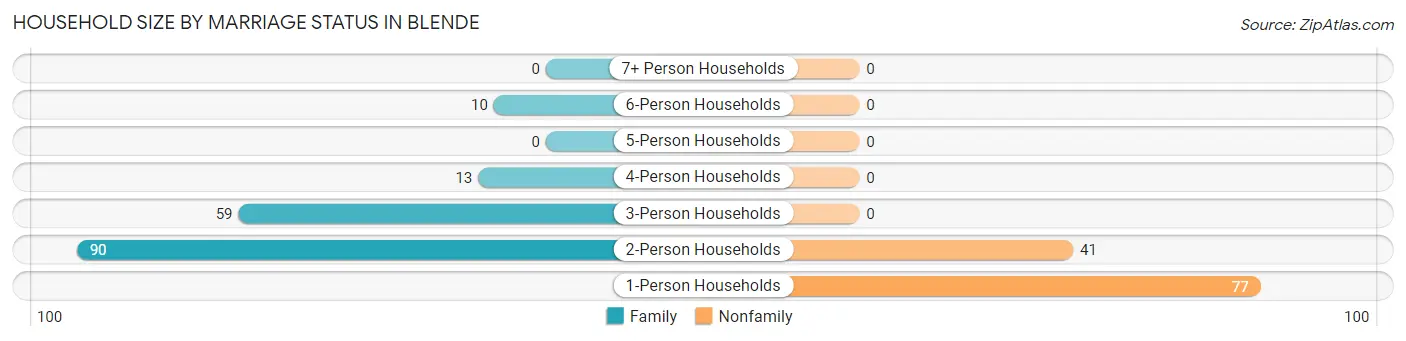
| Household Size | Family Households | Nonfamily Households |
| 1-Person Households | - | 77 (26.6%) |
| 2-Person Households | 90 (31.0%) | 41 (14.1%) |
| 3-Person Households | 59 (20.3%) | 0 (0.0%) |
| 4-Person Households | 13 (4.5%) | 0 (0.0%) |
| 5-Person Households | 0 (0.0%) | 0 (0.0%) |
| 6-Person Households | 10 (3.5%) | 0 (0.0%) |
| 7+ Person Households | 0 (0.0%) | 0 (0.0%) |
| Total | 172 (59.3%) | 118 (40.7%) |
Female Fertility in Blende
Fertility by Age in Blende
| Age Bracket | Women with Births | Births / 1,000 Women |
| 15 to 19 years | 0 (0.0%) | 0.0 |
| 20 to 34 years | 0 (0.0%) | 0.0 |
| 35 to 50 years | 0 (0.0%) | 0.0 |
| Total | 0 (0.0%) | 0.0 |
Fertility by Age by Marriage Status in Blende
| Age Bracket | Married | Unmarried |
| 15 to 19 years | 0 (0.0%) | 0 (0.0%) |
| 20 to 34 years | 0 (0.0%) | 0 (0.0%) |
| 35 to 50 years | 0 (0.0%) | 0 (0.0%) |
| Total | 0 (0.0%) | 0 (0.0%) |
Fertility by Education in Blende
| Educational Attainment | Women with Births | Births / 1,000 Women |
| Less than High School | 0 (0.0%) | 0.0 |
| High School Diploma | 0 (0.0%) | 0.0 |
| College or Associate's Degree | 0 (0.0%) | 0.0 |
| Bachelor's Degree | 0 (0.0%) | 0.0 |
| Graduate Degree | 0 (0.0%) | 0.0 |
| Total | 0 (0.0%) | 0.0 |
Fertility by Education by Marriage Status in Blende
| Educational Attainment | Married | Unmarried |
| Less than High School | 0 (0.0%) | 0 (0.0%) |
| High School Diploma | 0 (0.0%) | 0 (0.0%) |
| College or Associate's Degree | 0 (0.0%) | 0 (0.0%) |
| Bachelor's Degree | 0 (0.0%) | 0 (0.0%) |
| Graduate Degree | 0 (0.0%) | 0 (0.0%) |
| Total | 0 (0.0%) | 0 (0.0%) |
Employment Characteristics in Blende
Employment by Class of Employer in Blende
Among the 305 employed individuals in Blende, private company employees (262 | 85.9%), state government employees (20 | 6.6%), and local government employees (9 | 2.9%) make up the most common classes of employment.
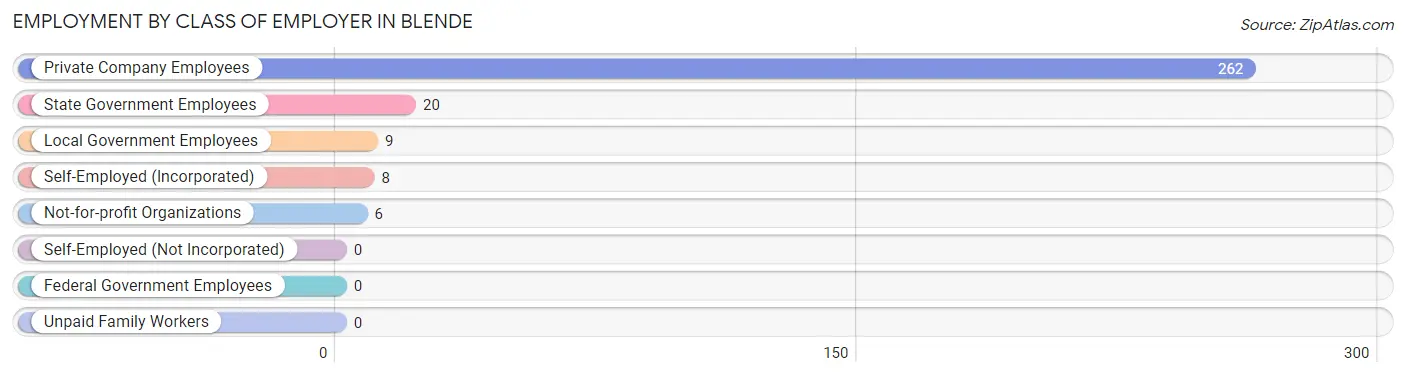
| Employer Class | # Employees | % Employees |
| Private Company Employees | 262 | 85.9% |
| Self-Employed (Incorporated) | 8 | 2.6% |
| Self-Employed (Not Incorporated) | 0 | 0.0% |
| Not-for-profit Organizations | 6 | 2.0% |
| Local Government Employees | 9 | 2.9% |
| State Government Employees | 20 | 6.6% |
| Federal Government Employees | 0 | 0.0% |
| Unpaid Family Workers | 0 | 0.0% |
| Total | 305 | 100.0% |
Employment Status by Age in Blende
According to the labor force statistics for Blende, out of the total population over 16 years of age (577), 58.8% or 339 individuals are in the labor force, with 7.4% or 25 of them unemployed. The age group with the highest labor force participation rate is 20 to 24 years, with 100.0% or 54 individuals in the labor force. Within the labor force, the 55 to 59 years age range has the highest percentage of unemployed individuals, with 22.0% or 9 of them being unemployed.
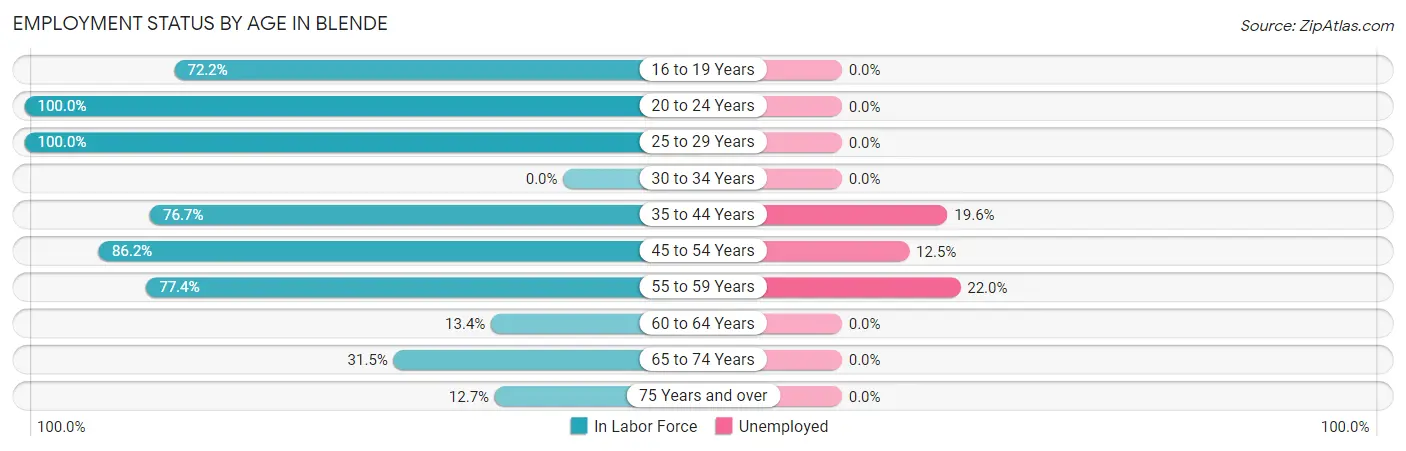
| Age Bracket | In Labor Force | Unemployed |
| 16 to 19 Years | 13 (72.2%) | 0 (0.0%) |
| 20 to 24 Years | 54 (100.0%) | 0 (0.0%) |
| 25 to 29 Years | 73 (100.0%) | 0 (0.0%) |
| 30 to 34 Years | 0 (0.0%) | 0 (0.0%) |
| 35 to 44 Years | 46 (76.7%) | 9 (19.6%) |
| 45 to 54 Years | 56 (86.2%) | 7 (12.5%) |
| 55 to 59 Years | 41 (77.4%) | 9 (22.0%) |
| 60 to 64 Years | 9 (13.4%) | 0 (0.0%) |
| 65 to 74 Years | 39 (31.5%) | 0 (0.0%) |
| 75 Years and over | 8 (12.7%) | 0 (0.0%) |
| Total | 339 (58.8%) | 25 (7.4%) |
Employment Status by Educational Attainment in Blende
According to labor force statistics for Blende, 70.8% of individuals (225) out of the total population between 25 and 64 years of age (318) are in the labor force, with 11.1% or 25 of them being unemployed. The group with the highest labor force participation rate are those with the educational attainment of high school diploma, with 94.3% or 83 individuals in the labor force. Within the labor force, individuals with bachelor's degree or higher education have the highest percentage of unemployment, with 32.1% or 9 of them being unemployed.
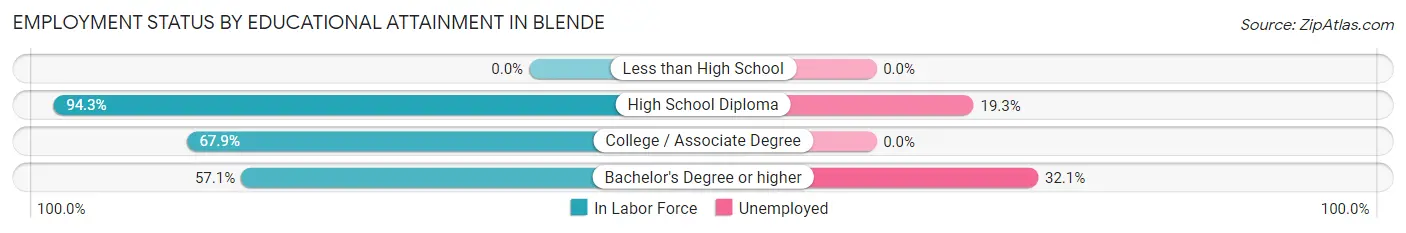
| Educational Attainment | In Labor Force | Unemployed |
| Less than High School | 0 (0.0%) | 0 (0.0%) |
| High School Diploma | 83 (94.3%) | 17 (19.3%) |
| College / Associate Degree | 114 (67.9%) | 0 (0.0%) |
| Bachelor's Degree or higher | 28 (57.1%) | 16 (32.1%) |
| Total | 225 (70.8%) | 35 (11.1%) |
Employment Occupations by Sex in Blende
Management, Business, Science and Arts Occupations
The most common Management, Business, Science and Arts occupations in Blende are Health Diagnosing & Treating (40 | 12.7%), Health Technologists (40 | 12.7%), Computers, Engineering & Science (14 | 4.5%), and Architecture & Engineering (14 | 4.5%).
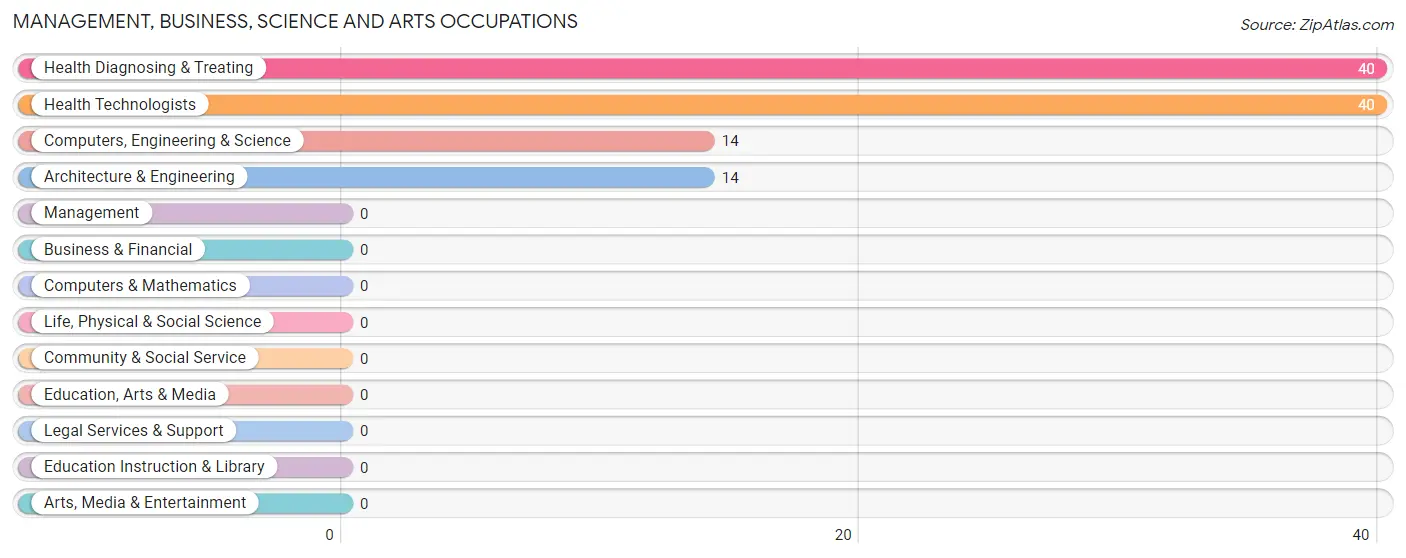
Management, Business, Science and Arts Occupations by Sex
Within the Management, Business, Science and Arts occupations in Blende, the most male-oriented occupations are Computers, Engineering & Science (100.0%), Architecture & Engineering (100.0%), and Health Diagnosing & Treating (65.0%), while the most female-oriented occupations are Health Diagnosing & Treating (35.0%), and Health Technologists (35.0%).
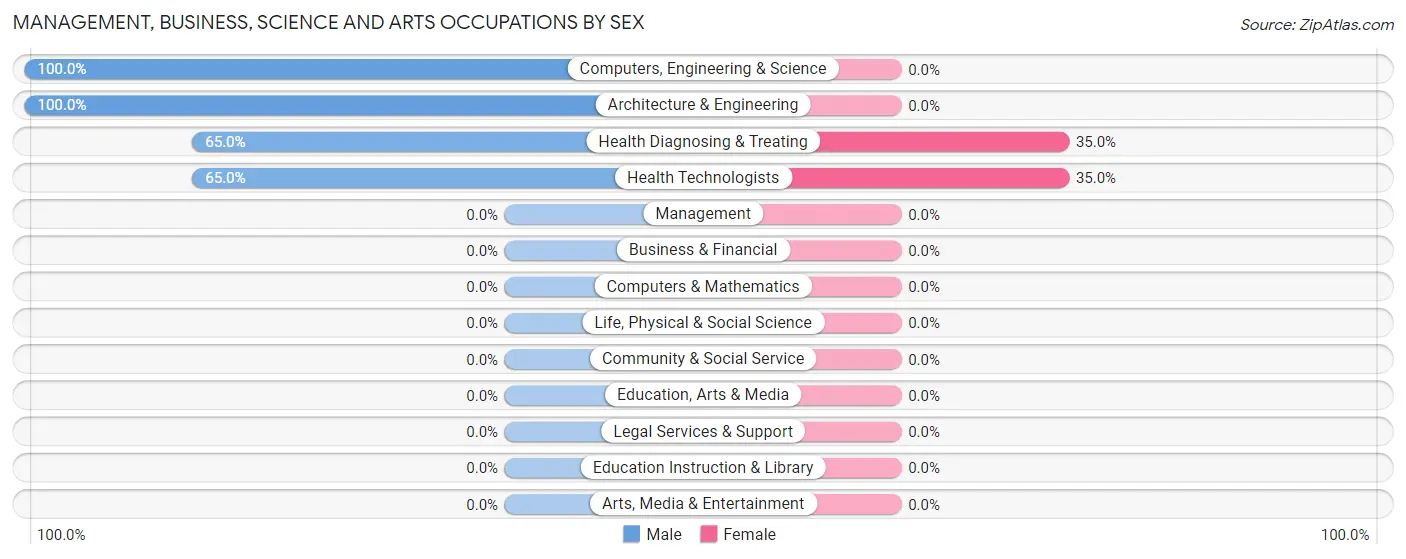
| Occupation | Male | Female |
| Management | 0 (0.0%) | 0 (0.0%) |
| Business & Financial | 0 (0.0%) | 0 (0.0%) |
| Computers, Engineering & Science | 14 (100.0%) | 0 (0.0%) |
| Computers & Mathematics | 0 (0.0%) | 0 (0.0%) |
| Architecture & Engineering | 14 (100.0%) | 0 (0.0%) |
| Life, Physical & Social Science | 0 (0.0%) | 0 (0.0%) |
| Community & Social Service | 0 (0.0%) | 0 (0.0%) |
| Education, Arts & Media | 0 (0.0%) | 0 (0.0%) |
| Legal Services & Support | 0 (0.0%) | 0 (0.0%) |
| Education Instruction & Library | 0 (0.0%) | 0 (0.0%) |
| Arts, Media & Entertainment | 0 (0.0%) | 0 (0.0%) |
| Health Diagnosing & Treating | 26 (65.0%) | 14 (35.0%) |
| Health Technologists | 26 (65.0%) | 14 (35.0%) |
| Total (Category) | 40 (74.1%) | 14 (25.9%) |
| Total (Overall) | 210 (66.9%) | 104 (33.1%) |
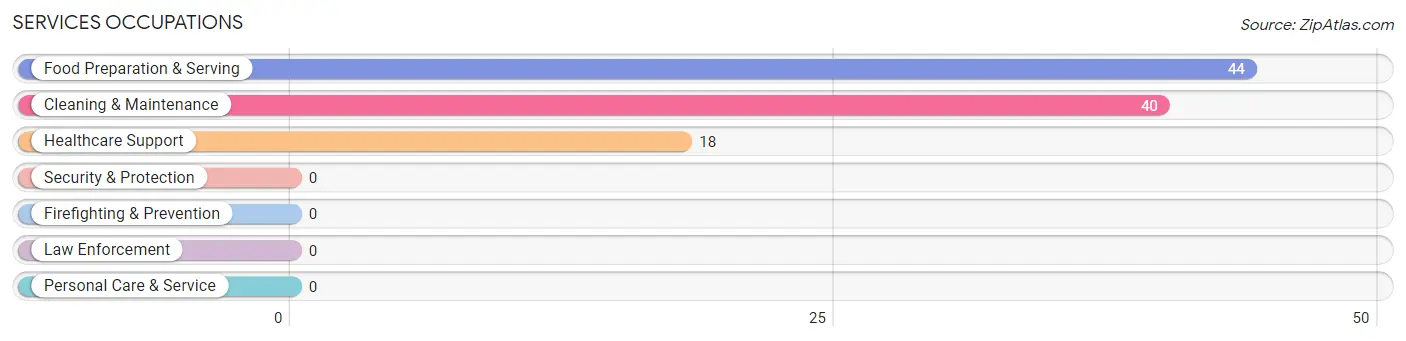
Services Occupations
The most common Services occupations in Blende are Food Preparation & Serving (44 | 14.0%), Cleaning & Maintenance (40 | 12.7%), and Healthcare Support (18 | 5.7%).
Services Occupations by Sex
Within the Services occupations in Blende, the most male-oriented occupations are Cleaning & Maintenance (100.0%), Food Preparation & Serving (52.3%), and Healthcare Support (44.4%), while the most female-oriented occupations are Healthcare Support (55.6%), and Food Preparation & Serving (47.7%).
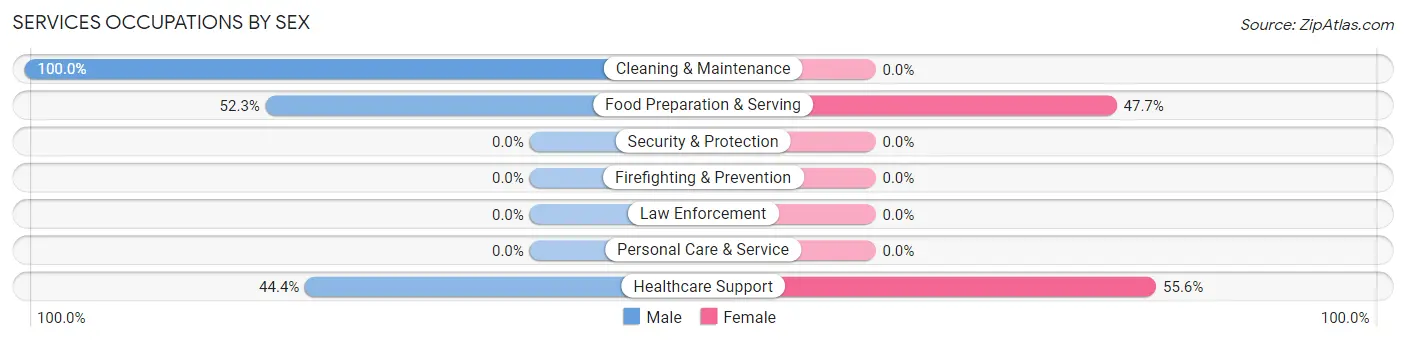
| Occupation | Male | Female |
| Healthcare Support | 8 (44.4%) | 10 (55.6%) |
| Security & Protection | 0 (0.0%) | 0 (0.0%) |
| Firefighting & Prevention | 0 (0.0%) | 0 (0.0%) |
| Law Enforcement | 0 (0.0%) | 0 (0.0%) |
| Food Preparation & Serving | 23 (52.3%) | 21 (47.7%) |
| Cleaning & Maintenance | 40 (100.0%) | 0 (0.0%) |
| Personal Care & Service | 0 (0.0%) | 0 (0.0%) |
| Total (Category) | 71 (69.6%) | 31 (30.4%) |
| Total (Overall) | 210 (66.9%) | 104 (33.1%) |
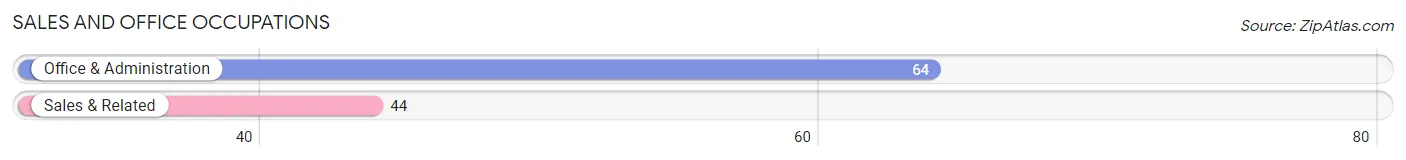
Sales and Office Occupations
The most common Sales and Office occupations in Blende are Office & Administration (64 | 20.4%), and Sales & Related (44 | 14.0%).
Sales and Office Occupations by Sex
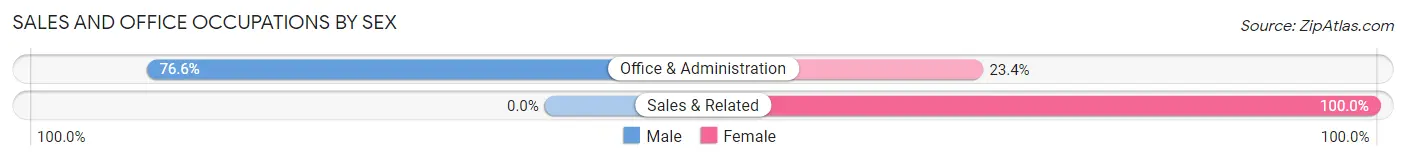
| Occupation | Male | Female |
| Sales & Related | 0 (0.0%) | 44 (100.0%) |
| Office & Administration | 49 (76.6%) | 15 (23.4%) |
| Total (Category) | 49 (45.4%) | 59 (54.6%) |
| Total (Overall) | 210 (66.9%) | 104 (33.1%) |
Natural Resources, Construction and Maintenance Occupations
The most common Natural Resources, Construction and Maintenance occupations in Blende are , and Installation, Maintenance & Repair (18 | 5.7%).
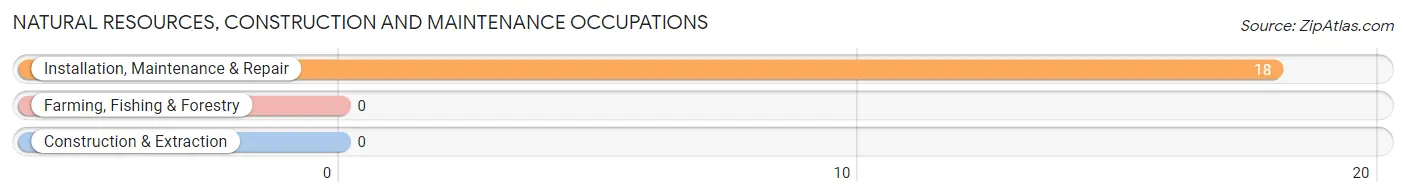
Natural Resources, Construction and Maintenance Occupations by Sex
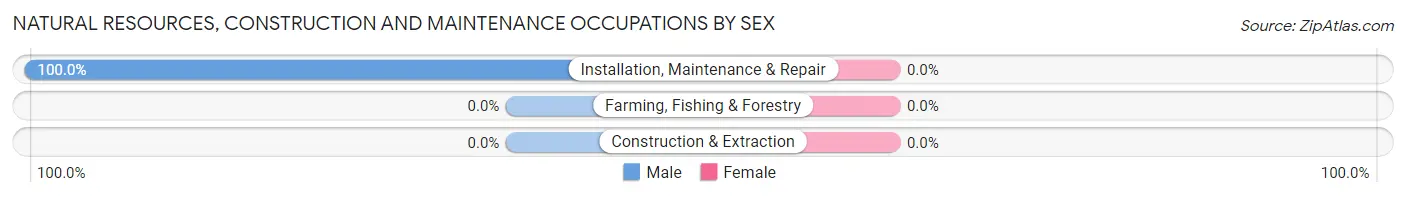
| Occupation | Male | Female |
| Farming, Fishing & Forestry | 0 (0.0%) | 0 (0.0%) |
| Construction & Extraction | 0 (0.0%) | 0 (0.0%) |
| Installation, Maintenance & Repair | 18 (100.0%) | 0 (0.0%) |
| Total (Category) | 18 (100.0%) | 0 (0.0%) |
| Total (Overall) | 210 (66.9%) | 104 (33.1%) |
Production, Transportation and Moving Occupations
The most common Production, Transportation and Moving occupations in Blende are Production (13 | 4.1%), Transportation (10 | 3.2%), and Material Moving (9 | 2.9%).
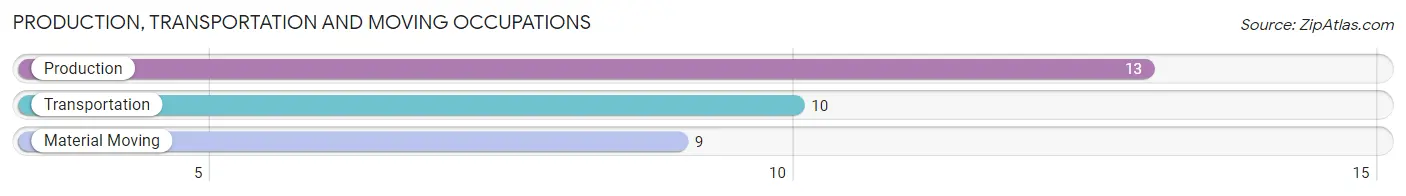
Production, Transportation and Moving Occupations by Sex
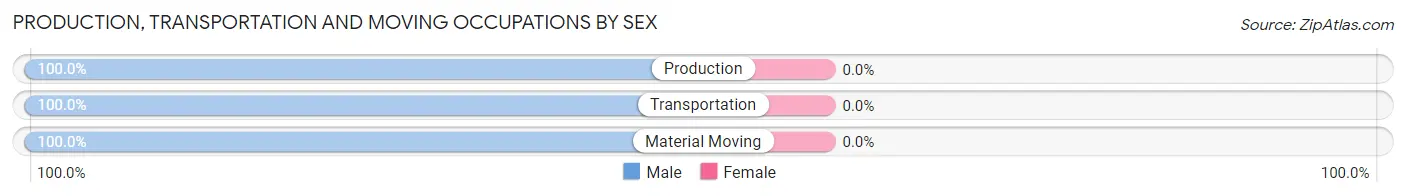
| Occupation | Male | Female |
| Production | 13 (100.0%) | 0 (0.0%) |
| Transportation | 10 (100.0%) | 0 (0.0%) |
| Material Moving | 9 (100.0%) | 0 (0.0%) |
| Total (Category) | 32 (100.0%) | 0 (0.0%) |
| Total (Overall) | 210 (66.9%) | 104 (33.1%) |
Employment Industries by Sex in Blende
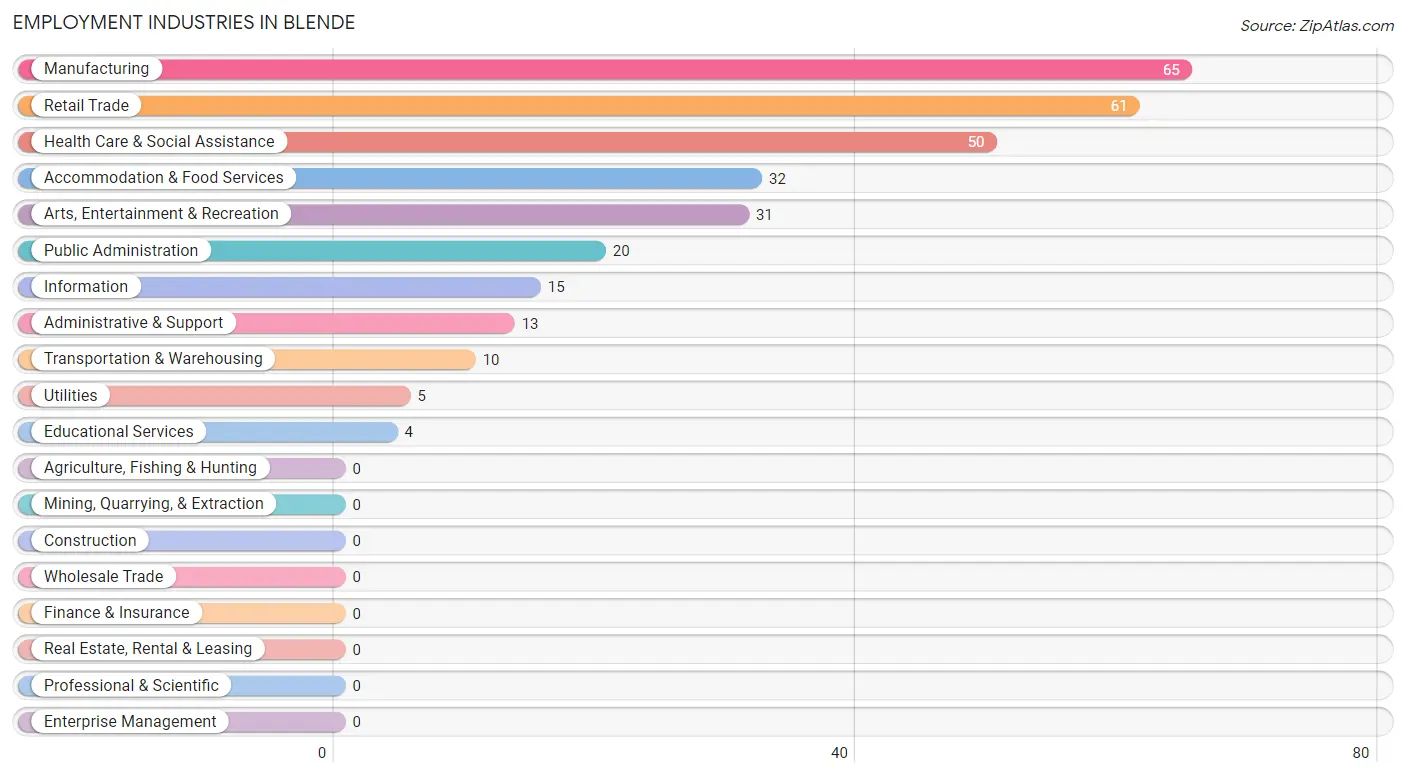
Employment Industries in Blende
The major employment industries in Blende include Manufacturing (65 | 20.7%), Retail Trade (61 | 19.4%), Health Care & Social Assistance (50 | 15.9%), Accommodation & Food Services (32 | 10.2%), and Arts, Entertainment & Recreation (31 | 9.9%).
Employment Industries by Sex in Blende
The Blende industries that see more men than women are Manufacturing (100.0%), Transportation & Warehousing (100.0%), and Utilities (100.0%), whereas the industries that tend to have a higher number of women are Educational Services (100.0%), Retail Trade (86.9%), and Accommodation & Food Services (53.1%).
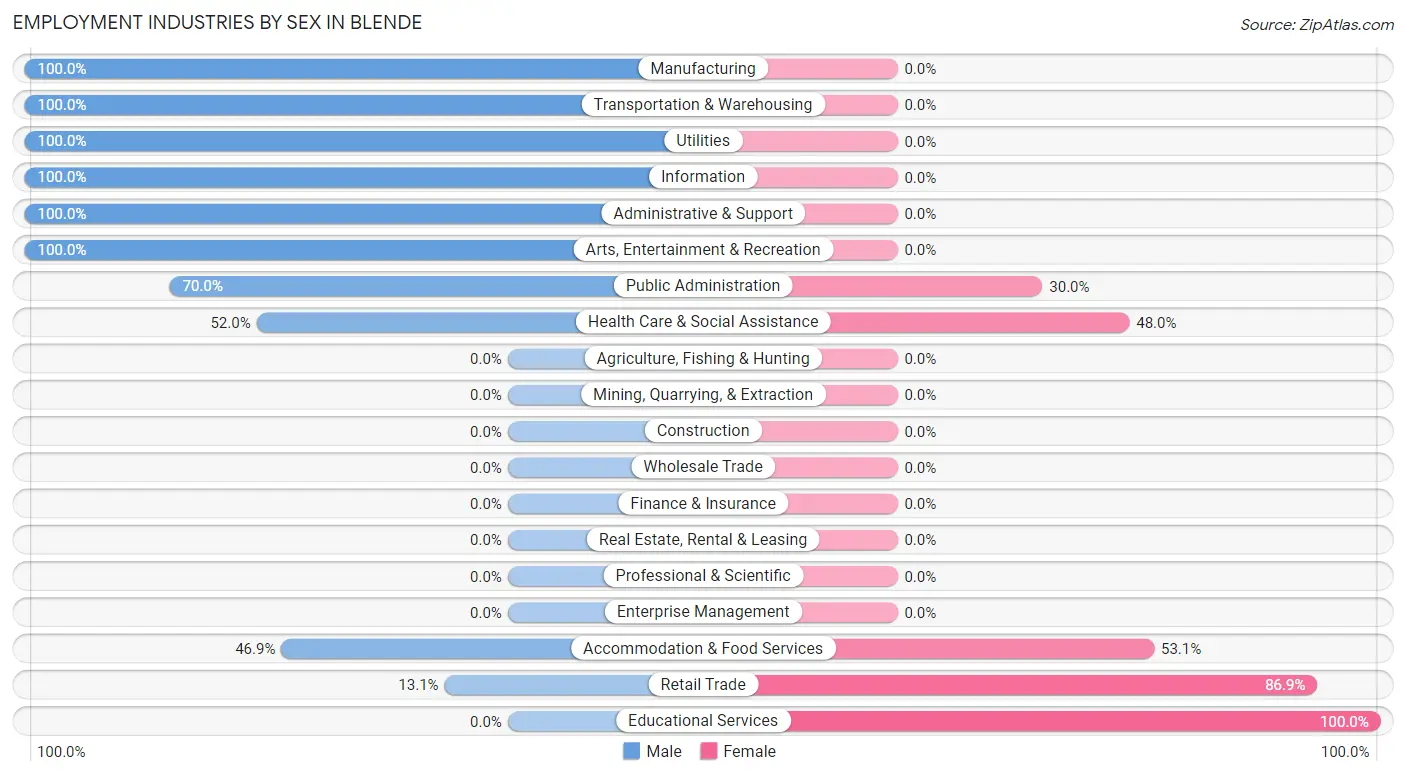
| Industry | Male | Female |
| Agriculture, Fishing & Hunting | 0 (0.0%) | 0 (0.0%) |
| Mining, Quarrying, & Extraction | 0 (0.0%) | 0 (0.0%) |
| Construction | 0 (0.0%) | 0 (0.0%) |
| Manufacturing | 65 (100.0%) | 0 (0.0%) |
| Wholesale Trade | 0 (0.0%) | 0 (0.0%) |
| Retail Trade | 8 (13.1%) | 53 (86.9%) |
| Transportation & Warehousing | 10 (100.0%) | 0 (0.0%) |
| Utilities | 5 (100.0%) | 0 (0.0%) |
| Information | 15 (100.0%) | 0 (0.0%) |
| Finance & Insurance | 0 (0.0%) | 0 (0.0%) |
| Real Estate, Rental & Leasing | 0 (0.0%) | 0 (0.0%) |
| Professional & Scientific | 0 (0.0%) | 0 (0.0%) |
| Enterprise Management | 0 (0.0%) | 0 (0.0%) |
| Administrative & Support | 13 (100.0%) | 0 (0.0%) |
| Educational Services | 0 (0.0%) | 4 (100.0%) |
| Health Care & Social Assistance | 26 (52.0%) | 24 (48.0%) |
| Arts, Entertainment & Recreation | 31 (100.0%) | 0 (0.0%) |
| Accommodation & Food Services | 15 (46.9%) | 17 (53.1%) |
| Public Administration | 14 (70.0%) | 6 (30.0%) |
| Total | 210 (66.9%) | 104 (33.1%) |
Education in Blende
School Enrollment in Blende
The most common levels of schooling among the 145 students in Blende are middle school (38 | 26.2%), college / undergraduate (32 | 22.1%), and high school (31 | 21.4%).
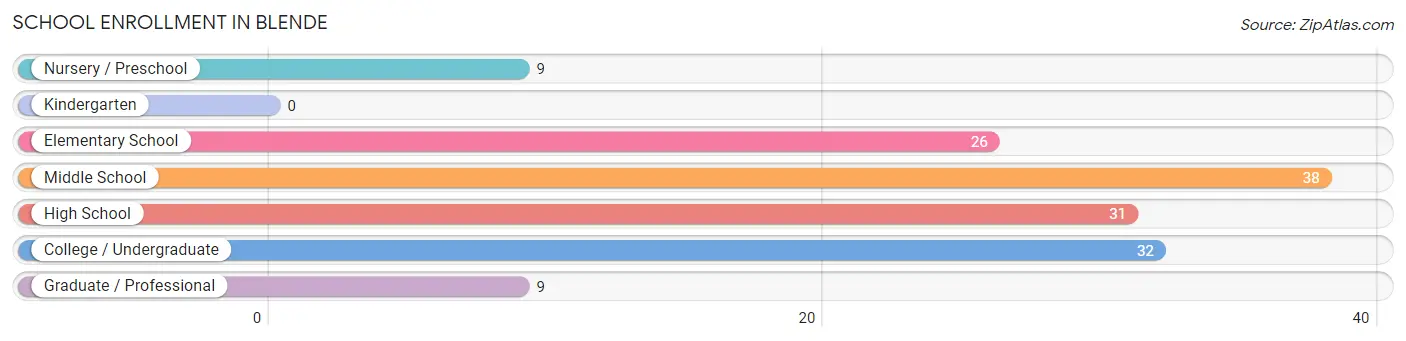
| School Level | # Students | % Students |
| Nursery / Preschool | 9 | 6.2% |
| Kindergarten | 0 | 0.0% |
| Elementary School | 26 | 17.9% |
| Middle School | 38 | 26.2% |
| High School | 31 | 21.4% |
| College / Undergraduate | 32 | 22.1% |
| Graduate / Professional | 9 | 6.2% |
| Total | 145 | 100.0% |
School Enrollment by Age by Funding Source in Blende
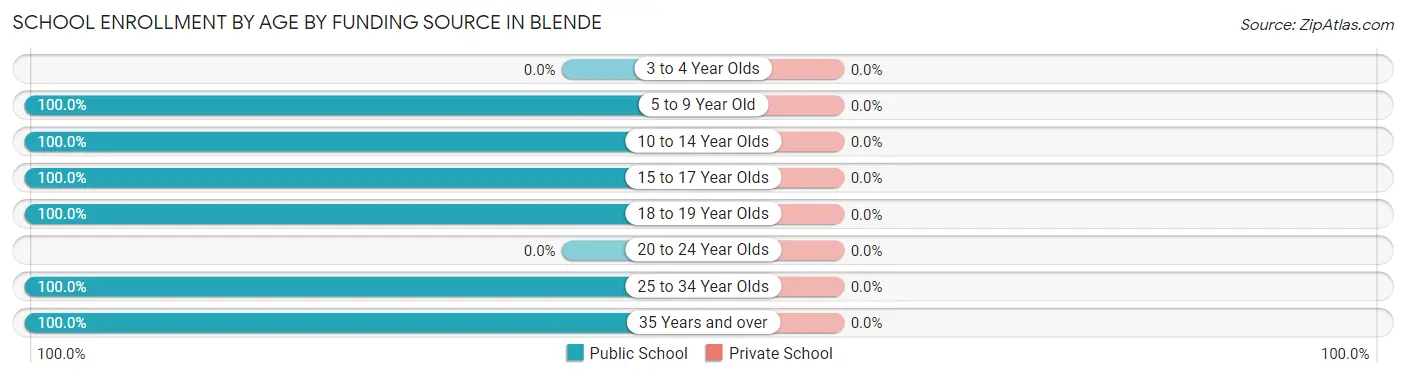
| Age Bracket | Public School | Private School |
| 3 to 4 Year Olds | 0 (0.0%) | 0 (0.0%) |
| 5 to 9 Year Old | 35 (100.0%) | 0 (0.0%) |
| 10 to 14 Year Olds | 38 (100.0%) | 0 (0.0%) |
| 15 to 17 Year Olds | 26 (100.0%) | 0 (0.0%) |
| 18 to 19 Year Olds | 5 (100.0%) | 0 (0.0%) |
| 20 to 24 Year Olds | 0 (0.0%) | 0 (0.0%) |
| 25 to 34 Year Olds | 26 (100.0%) | 0 (0.0%) |
| 35 Years and over | 15 (100.0%) | 0 (0.0%) |
| Total | 145 (100.0%) | 0 (0.0%) |
Educational Attainment by Field of Study in Blende
Education (37 | 33.6%), science & technology (20 | 18.2%), communications (12 | 10.9%), social sciences (9 | 8.2%), and multidisciplinary studies (9 | 8.2%) are the most common fields of study among 110 individuals in Blende who have obtained a bachelor's degree or higher.
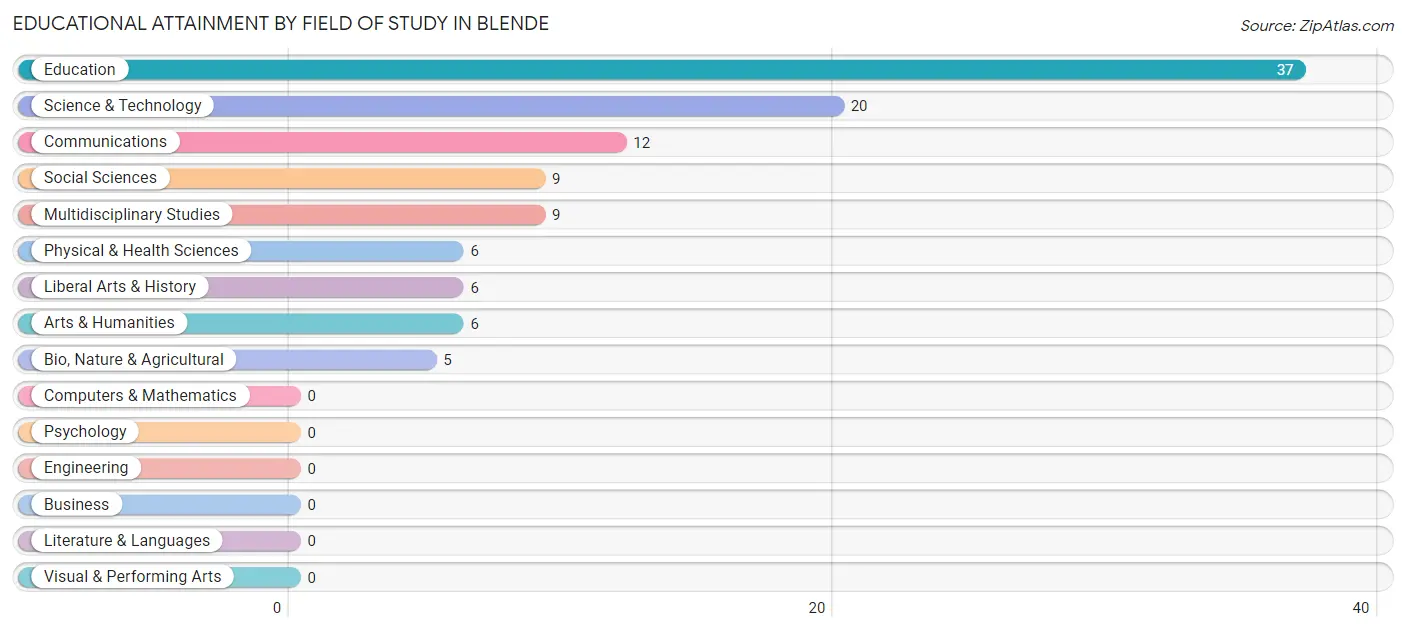
| Field of Study | # Graduates | % Graduates |
| Computers & Mathematics | 0 | 0.0% |
| Bio, Nature & Agricultural | 5 | 4.5% |
| Physical & Health Sciences | 6 | 5.4% |
| Psychology | 0 | 0.0% |
| Social Sciences | 9 | 8.2% |
| Engineering | 0 | 0.0% |
| Multidisciplinary Studies | 9 | 8.2% |
| Science & Technology | 20 | 18.2% |
| Business | 0 | 0.0% |
| Education | 37 | 33.6% |
| Literature & Languages | 0 | 0.0% |
| Liberal Arts & History | 6 | 5.4% |
| Visual & Performing Arts | 0 | 0.0% |
| Communications | 12 | 10.9% |
| Arts & Humanities | 6 | 5.4% |
| Total | 110 | 100.0% |
Transportation & Commute in Blende
Vehicle Availability by Sex in Blende
The most prevalent vehicle ownership categories in Blende are males with 3 vehicles (164, accounting for 81.6%) and females with 3 vehicles (66, making up 157.7%).
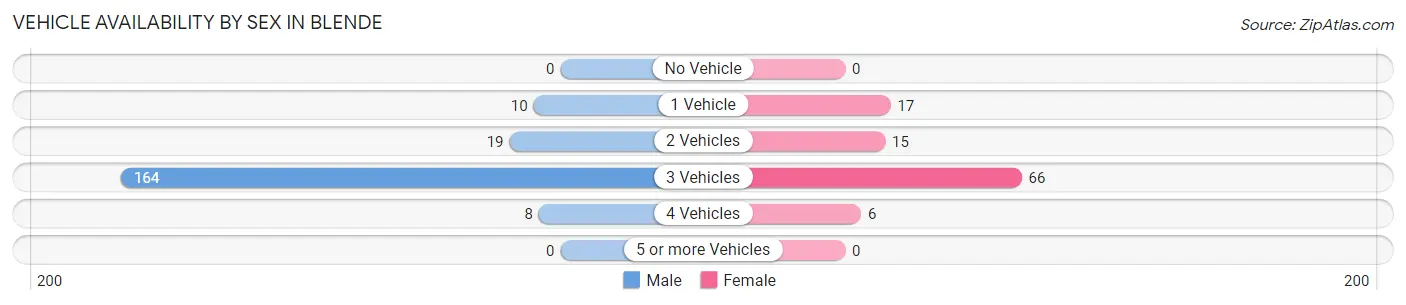
| Vehicles Available | Male | Female |
| No Vehicle | 0 (0.0%) | 0 (0.0%) |
| 1 Vehicle | 10 (5.0%) | 17 (16.4%) |
| 2 Vehicles | 19 (9.5%) | 15 (14.4%) |
| 3 Vehicles | 164 (81.6%) | 66 (63.5%) |
| 4 Vehicles | 8 (4.0%) | 6 (5.8%) |
| 5 or more Vehicles | 0 (0.0%) | 0 (0.0%) |
| Total | 201 (100.0%) | 104 (100.0%) |
Commute Time in Blende
The most frequently occuring commute durations in Blende are 15 to 19 minutes (102 commuters, 34.5%), 10 to 14 minutes (92 commuters, 31.1%), and 20 to 24 minutes (43 commuters, 14.5%).
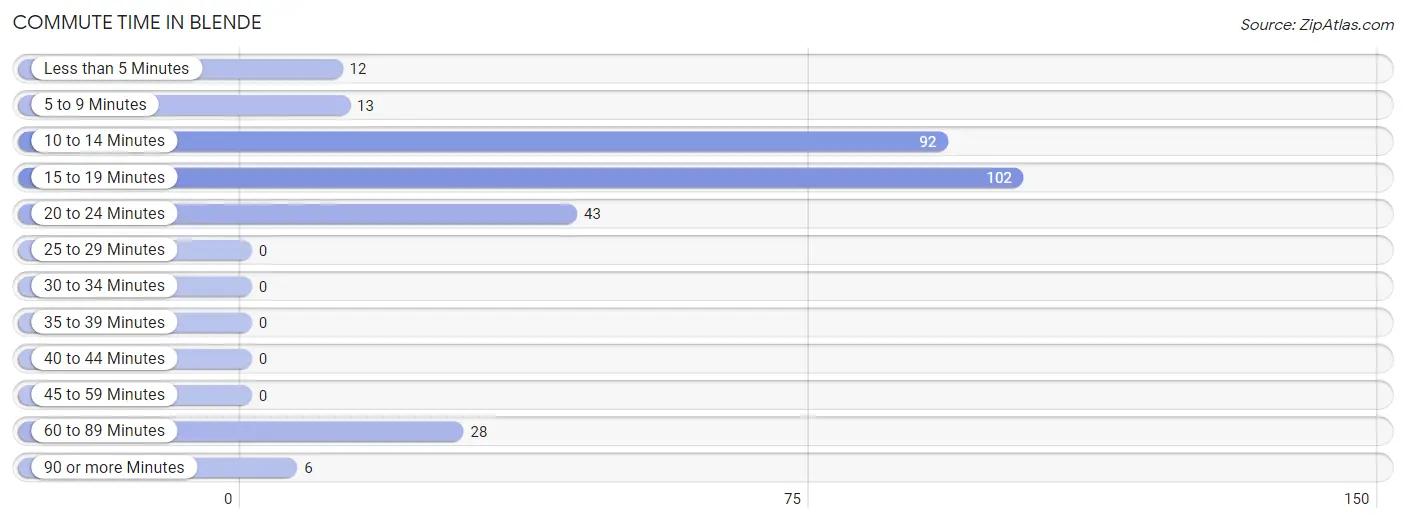
| Commute Time | # Commuters | % Commuters |
| Less than 5 Minutes | 12 | 4.1% |
| 5 to 9 Minutes | 13 | 4.4% |
| 10 to 14 Minutes | 92 | 31.1% |
| 15 to 19 Minutes | 102 | 34.5% |
| 20 to 24 Minutes | 43 | 14.5% |
| 25 to 29 Minutes | 0 | 0.0% |
| 30 to 34 Minutes | 0 | 0.0% |
| 35 to 39 Minutes | 0 | 0.0% |
| 40 to 44 Minutes | 0 | 0.0% |
| 45 to 59 Minutes | 0 | 0.0% |
| 60 to 89 Minutes | 28 | 9.5% |
| 90 or more Minutes | 6 | 2.0% |
Commute Time by Sex in Blende
The most common commute times in Blende are 15 to 19 minutes (83 commuters, 41.3%) for males and 10 to 14 minutes (70 commuters, 73.7%) for females.
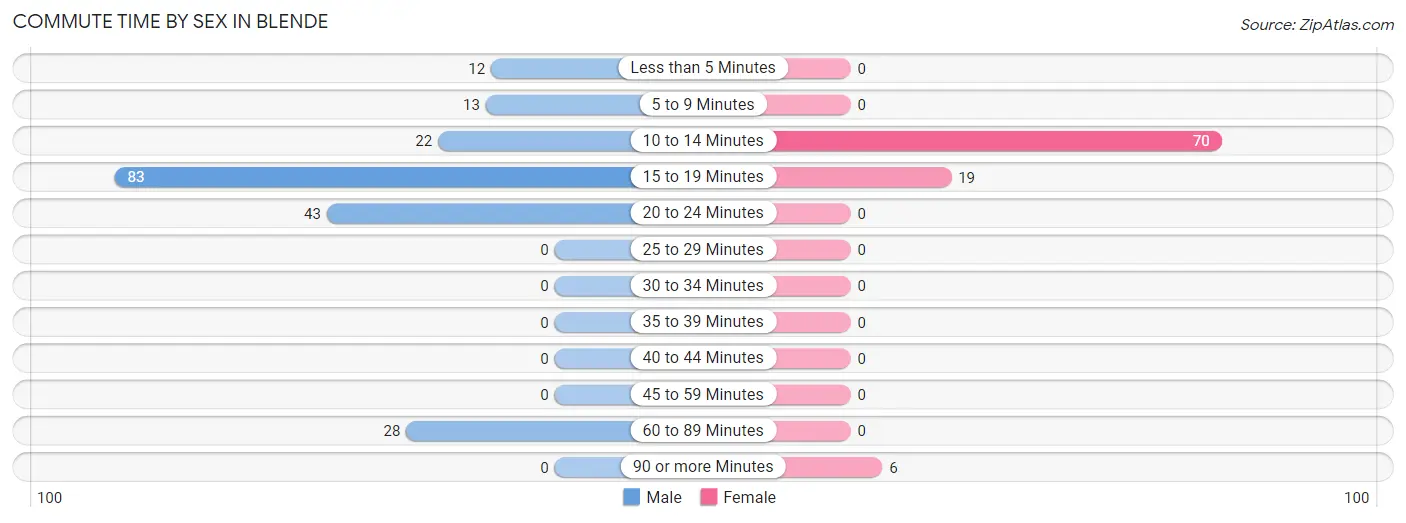
| Commute Time | Male | Female |
| Less than 5 Minutes | 12 (6.0%) | 0 (0.0%) |
| 5 to 9 Minutes | 13 (6.5%) | 0 (0.0%) |
| 10 to 14 Minutes | 22 (11.0%) | 70 (73.7%) |
| 15 to 19 Minutes | 83 (41.3%) | 19 (20.0%) |
| 20 to 24 Minutes | 43 (21.4%) | 0 (0.0%) |
| 25 to 29 Minutes | 0 (0.0%) | 0 (0.0%) |
| 30 to 34 Minutes | 0 (0.0%) | 0 (0.0%) |
| 35 to 39 Minutes | 0 (0.0%) | 0 (0.0%) |
| 40 to 44 Minutes | 0 (0.0%) | 0 (0.0%) |
| 45 to 59 Minutes | 0 (0.0%) | 0 (0.0%) |
| 60 to 89 Minutes | 28 (13.9%) | 0 (0.0%) |
| 90 or more Minutes | 0 (0.0%) | 6 (6.3%) |
Time of Departure to Work by Sex in Blende
The most frequent times of departure to work in Blende are 6:00 AM to 6:29 AM (45, 22.4%) for males and 12:00 PM to 3:59 PM (40, 42.1%) for females.
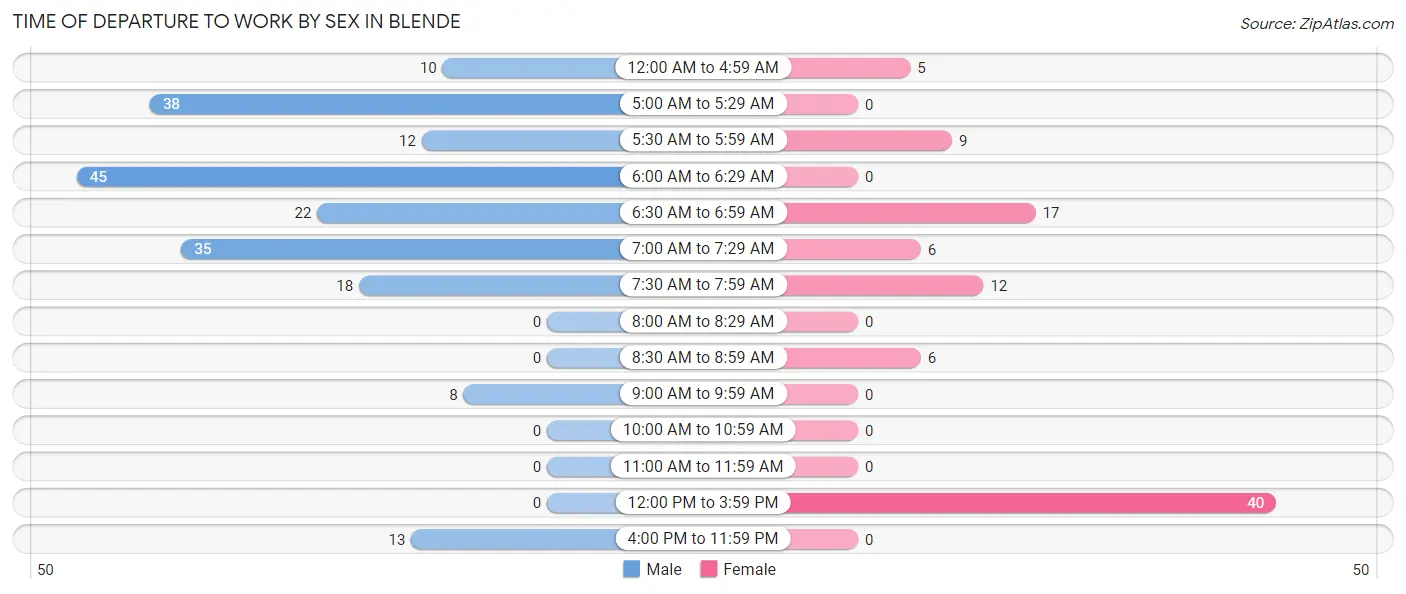
| Time of Departure | Male | Female |
| 12:00 AM to 4:59 AM | 10 (5.0%) | 5 (5.3%) |
| 5:00 AM to 5:29 AM | 38 (18.9%) | 0 (0.0%) |
| 5:30 AM to 5:59 AM | 12 (6.0%) | 9 (9.5%) |
| 6:00 AM to 6:29 AM | 45 (22.4%) | 0 (0.0%) |
| 6:30 AM to 6:59 AM | 22 (11.0%) | 17 (17.9%) |
| 7:00 AM to 7:29 AM | 35 (17.4%) | 6 (6.3%) |
| 7:30 AM to 7:59 AM | 18 (9.0%) | 12 (12.6%) |
| 8:00 AM to 8:29 AM | 0 (0.0%) | 0 (0.0%) |
| 8:30 AM to 8:59 AM | 0 (0.0%) | 6 (6.3%) |
| 9:00 AM to 9:59 AM | 8 (4.0%) | 0 (0.0%) |
| 10:00 AM to 10:59 AM | 0 (0.0%) | 0 (0.0%) |
| 11:00 AM to 11:59 AM | 0 (0.0%) | 0 (0.0%) |
| 12:00 PM to 3:59 PM | 0 (0.0%) | 40 (42.1%) |
| 4:00 PM to 11:59 PM | 13 (6.5%) | 0 (0.0%) |
| Total | 201 (100.0%) | 95 (100.0%) |
Housing Occupancy in Blende
Occupancy by Ownership in Blende
Of the total 290 dwellings in Blende, owner-occupied units account for 211 (72.8%), while renter-occupied units make up 79 (27.2%).
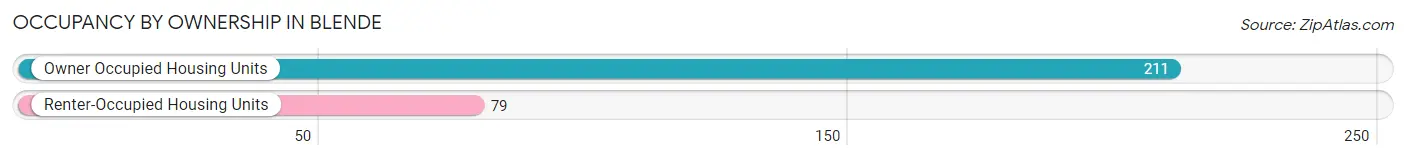
| Occupancy | # Housing Units | % Housing Units |
| Owner Occupied Housing Units | 211 | 72.8% |
| Renter-Occupied Housing Units | 79 | 27.2% |
| Total Occupied Housing Units | 290 | 100.0% |
Occupancy by Household Size in Blende
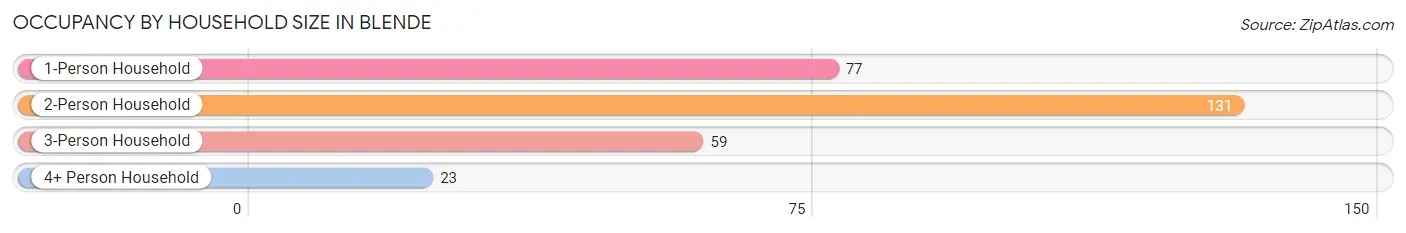
| Household Size | # Housing Units | % Housing Units |
| 1-Person Household | 77 | 26.6% |
| 2-Person Household | 131 | 45.2% |
| 3-Person Household | 59 | 20.3% |
| 4+ Person Household | 23 | 7.9% |
| Total Housing Units | 290 | 100.0% |
Occupancy by Ownership by Household Size in Blende
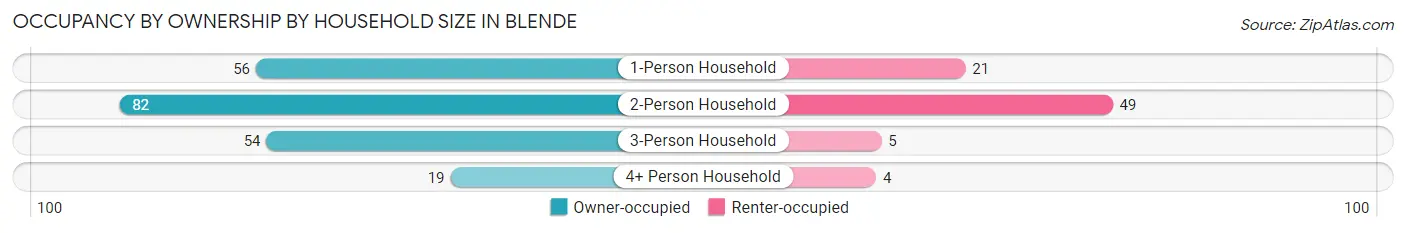
| Household Size | Owner-occupied | Renter-occupied |
| 1-Person Household | 56 (72.7%) | 21 (27.3%) |
| 2-Person Household | 82 (62.6%) | 49 (37.4%) |
| 3-Person Household | 54 (91.5%) | 5 (8.5%) |
| 4+ Person Household | 19 (82.6%) | 4 (17.4%) |
| Total Housing Units | 211 (72.8%) | 79 (27.2%) |
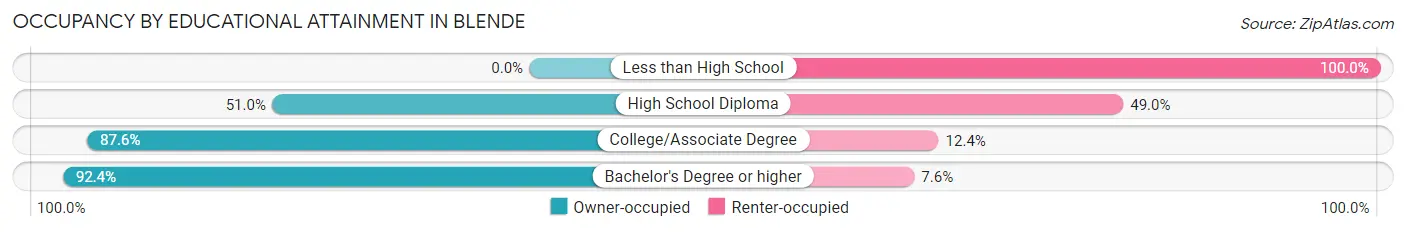
Occupancy by Educational Attainment in Blende
| Household Size | Owner-occupied | Renter-occupied |
| Less than High School | 0 (0.0%) | 11 (100.0%) |
| High School Diploma | 51 (51.0%) | 49 (49.0%) |
| College/Associate Degree | 99 (87.6%) | 14 (12.4%) |
| Bachelor's Degree or higher | 61 (92.4%) | 5 (7.6%) |
Occupancy by Age of Householder in Blende
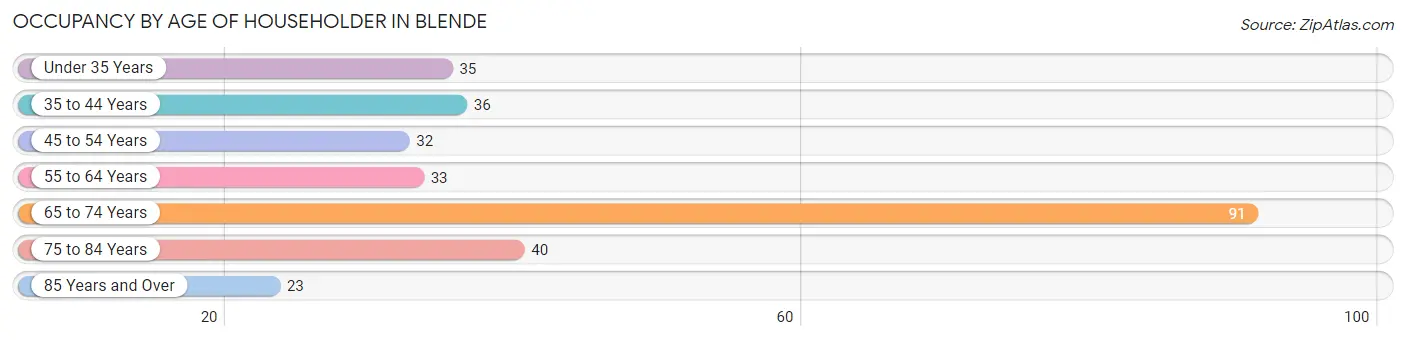
| Age Bracket | # Households | % Households |
| Under 35 Years | 35 | 12.1% |
| 35 to 44 Years | 36 | 12.4% |
| 45 to 54 Years | 32 | 11.0% |
| 55 to 64 Years | 33 | 11.4% |
| 65 to 74 Years | 91 | 31.4% |
| 75 to 84 Years | 40 | 13.8% |
| 85 Years and Over | 23 | 7.9% |
| Total | 290 | 100.0% |
Housing Finances in Blende
Median Income by Occupancy in Blende
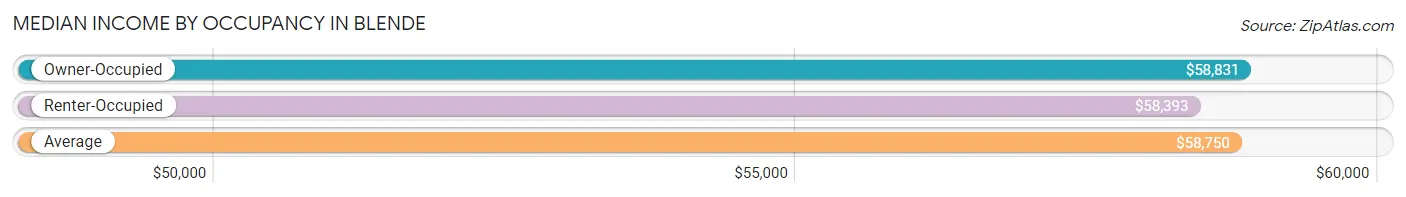
| Occupancy Type | # Households | Median Income |
| Owner-Occupied | 211 (72.8%) | $58,831 |
| Renter-Occupied | 79 (27.2%) | $58,393 |
| Average | 290 (100.0%) | $58,750 |
Occupancy by Householder Income Bracket in Blende
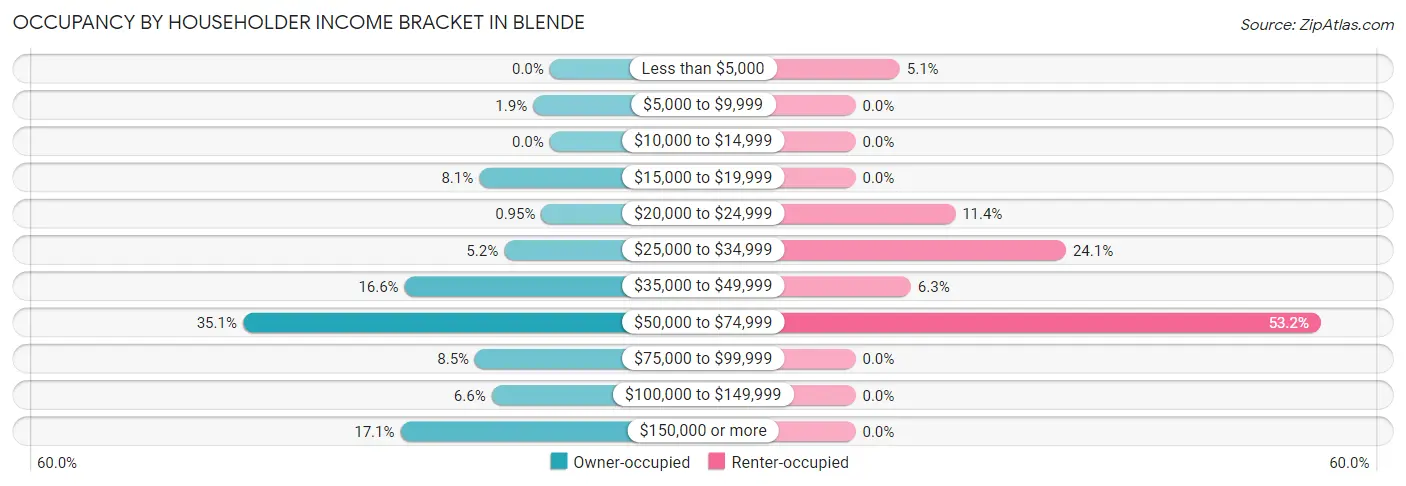
| Income Bracket | Owner-occupied | Renter-occupied |
| Less than $5,000 | 0 (0.0%) | 4 (5.1%) |
| $5,000 to $9,999 | 4 (1.9%) | 0 (0.0%) |
| $10,000 to $14,999 | 0 (0.0%) | 0 (0.0%) |
| $15,000 to $19,999 | 17 (8.1%) | 0 (0.0%) |
| $20,000 to $24,999 | 2 (0.9%) | 9 (11.4%) |
| $25,000 to $34,999 | 11 (5.2%) | 19 (24.0%) |
| $35,000 to $49,999 | 35 (16.6%) | 5 (6.3%) |
| $50,000 to $74,999 | 74 (35.1%) | 42 (53.2%) |
| $75,000 to $99,999 | 18 (8.5%) | 0 (0.0%) |
| $100,000 to $149,999 | 14 (6.6%) | 0 (0.0%) |
| $150,000 or more | 36 (17.1%) | 0 (0.0%) |
| Total | 211 (100.0%) | 79 (100.0%) |
Monthly Housing Cost Tiers in Blende
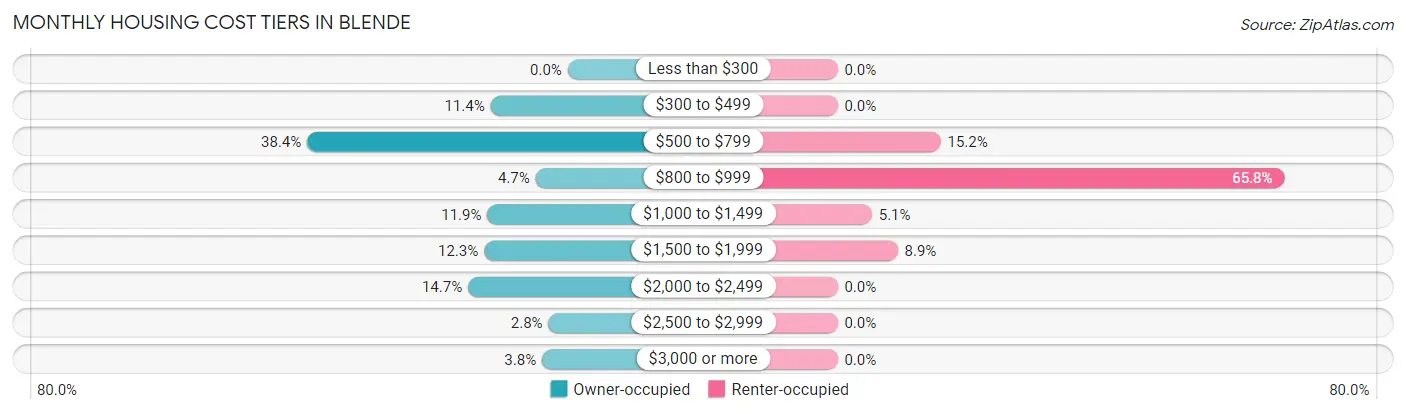
| Monthly Cost | Owner-occupied | Renter-occupied |
| Less than $300 | 0 (0.0%) | 0 (0.0%) |
| $300 to $499 | 24 (11.4%) | 0 (0.0%) |
| $500 to $799 | 81 (38.4%) | 12 (15.2%) |
| $800 to $999 | 10 (4.7%) | 52 (65.8%) |
| $1,000 to $1,499 | 25 (11.8%) | 4 (5.1%) |
| $1,500 to $1,999 | 26 (12.3%) | 7 (8.9%) |
| $2,000 to $2,499 | 31 (14.7%) | 0 (0.0%) |
| $2,500 to $2,999 | 6 (2.8%) | 0 (0.0%) |
| $3,000 or more | 8 (3.8%) | 0 (0.0%) |
| Total | 211 (100.0%) | 79 (100.0%) |
Physical Housing Characteristics in Blende
Housing Structures in Blende
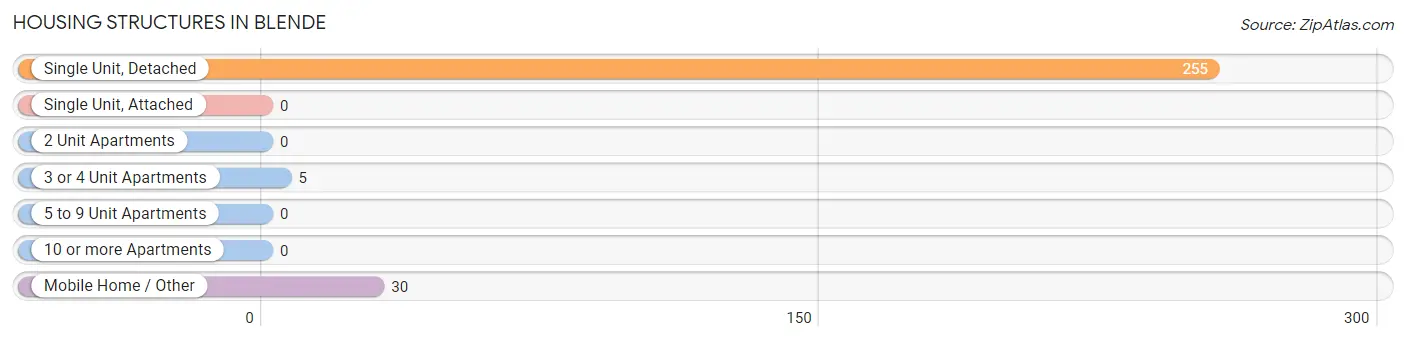
| Structure Type | # Housing Units | % Housing Units |
| Single Unit, Detached | 255 | 87.9% |
| Single Unit, Attached | 0 | 0.0% |
| 2 Unit Apartments | 0 | 0.0% |
| 3 or 4 Unit Apartments | 5 | 1.7% |
| 5 to 9 Unit Apartments | 0 | 0.0% |
| 10 or more Apartments | 0 | 0.0% |
| Mobile Home / Other | 30 | 10.3% |
| Total | 290 | 100.0% |
Housing Structures by Occupancy in Blende
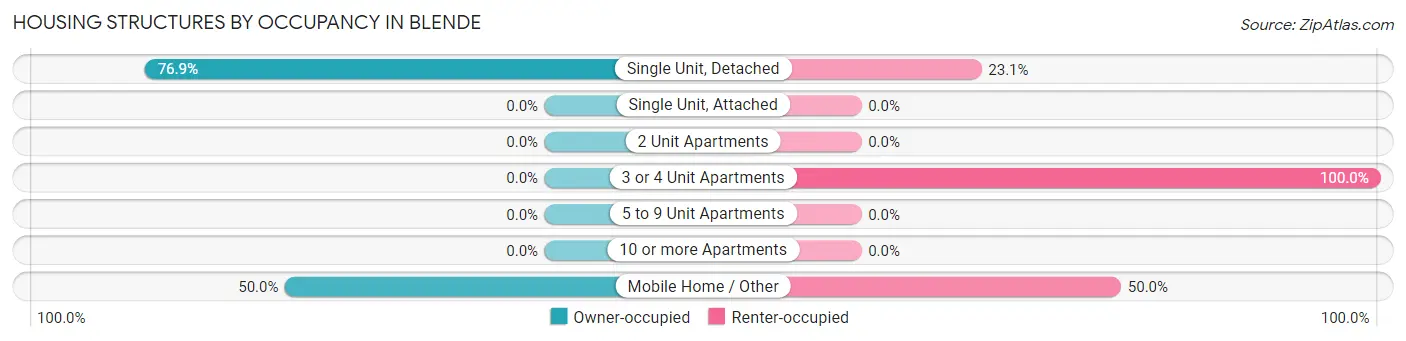
| Structure Type | Owner-occupied | Renter-occupied |
| Single Unit, Detached | 196 (76.9%) | 59 (23.1%) |
| Single Unit, Attached | 0 (0.0%) | 0 (0.0%) |
| 2 Unit Apartments | 0 (0.0%) | 0 (0.0%) |
| 3 or 4 Unit Apartments | 0 (0.0%) | 5 (100.0%) |
| 5 to 9 Unit Apartments | 0 (0.0%) | 0 (0.0%) |
| 10 or more Apartments | 0 (0.0%) | 0 (0.0%) |
| Mobile Home / Other | 15 (50.0%) | 15 (50.0%) |
| Total | 211 (72.8%) | 79 (27.2%) |
Housing Structures by Number of Rooms in Blende
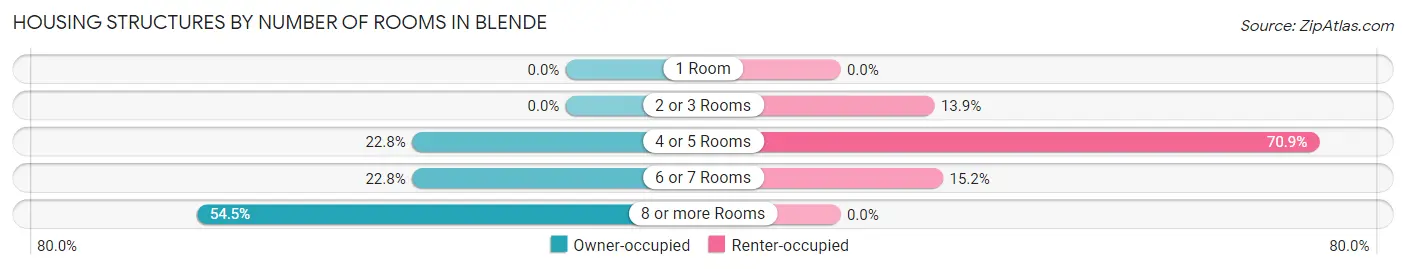
| Number of Rooms | Owner-occupied | Renter-occupied |
| 1 Room | 0 (0.0%) | 0 (0.0%) |
| 2 or 3 Rooms | 0 (0.0%) | 11 (13.9%) |
| 4 or 5 Rooms | 48 (22.8%) | 56 (70.9%) |
| 6 or 7 Rooms | 48 (22.8%) | 12 (15.2%) |
| 8 or more Rooms | 115 (54.5%) | 0 (0.0%) |
| Total | 211 (100.0%) | 79 (100.0%) |
Housing Structure by Heating Type in Blende
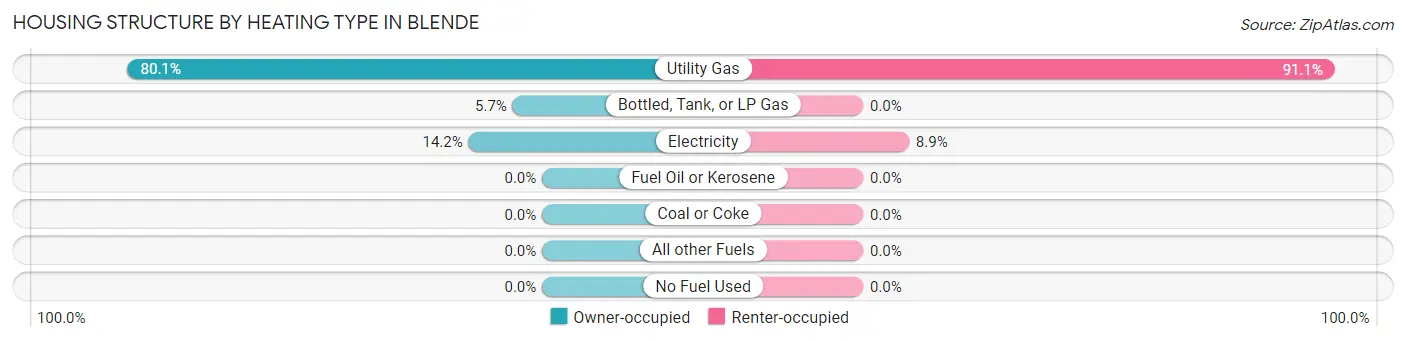
| Heating Type | Owner-occupied | Renter-occupied |
| Utility Gas | 169 (80.1%) | 72 (91.1%) |
| Bottled, Tank, or LP Gas | 12 (5.7%) | 0 (0.0%) |
| Electricity | 30 (14.2%) | 7 (8.9%) |
| Fuel Oil or Kerosene | 0 (0.0%) | 0 (0.0%) |
| Coal or Coke | 0 (0.0%) | 0 (0.0%) |
| All other Fuels | 0 (0.0%) | 0 (0.0%) |
| No Fuel Used | 0 (0.0%) | 0 (0.0%) |
| Total | 211 (100.0%) | 79 (100.0%) |
Household Vehicle Usage in Blende
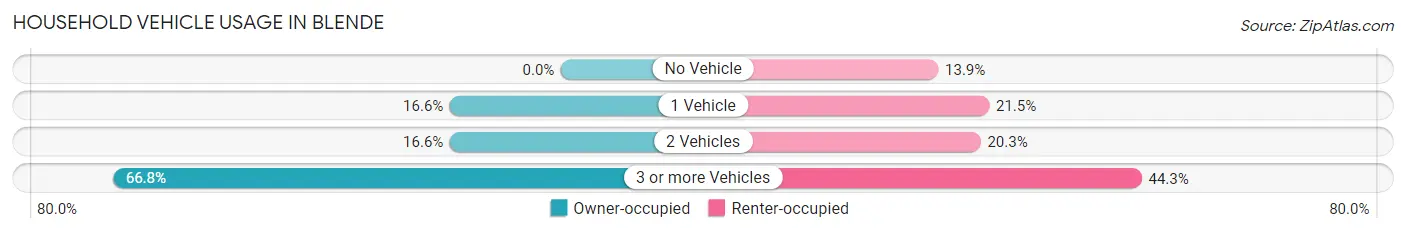
| Vehicles per Household | Owner-occupied | Renter-occupied |
| No Vehicle | 0 (0.0%) | 11 (13.9%) |
| 1 Vehicle | 35 (16.6%) | 17 (21.5%) |
| 2 Vehicles | 35 (16.6%) | 16 (20.3%) |
| 3 or more Vehicles | 141 (66.8%) | 35 (44.3%) |
| Total | 211 (100.0%) | 79 (100.0%) |
Real Estate & Mortgages in Blende
Real Estate and Mortgage Overview in Blende
| Characteristic | Without Mortgage | With Mortgage |
| Housing Units | 114 | 97 |
| Median Property Value | $250,000 | $229,200 |
| Median Household Income | $50,556 | $24 |
| Monthly Housing Costs | $583 | $0 |
| Real Estate Taxes | $1,266 | $0 |
Property Value by Mortgage Status in Blende
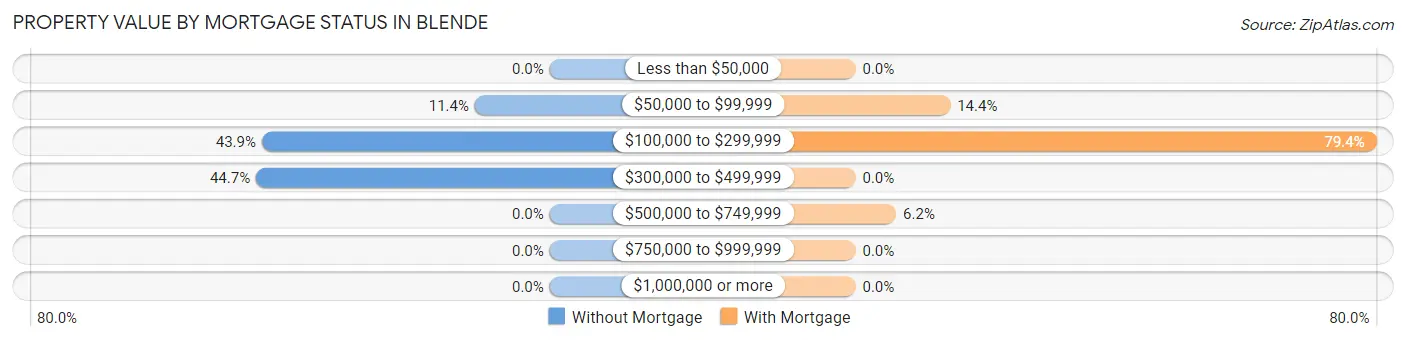
| Property Value | Without Mortgage | With Mortgage |
| Less than $50,000 | 0 (0.0%) | 0 (0.0%) |
| $50,000 to $99,999 | 13 (11.4%) | 14 (14.4%) |
| $100,000 to $299,999 | 50 (43.9%) | 77 (79.4%) |
| $300,000 to $499,999 | 51 (44.7%) | 0 (0.0%) |
| $500,000 to $749,999 | 0 (0.0%) | 6 (6.2%) |
| $750,000 to $999,999 | 0 (0.0%) | 0 (0.0%) |
| $1,000,000 or more | 0 (0.0%) | 0 (0.0%) |
| Total | 114 (100.0%) | 97 (100.0%) |
Household Income by Mortgage Status in Blende
| Household Income | Without Mortgage | With Mortgage |
| Less than $10,000 | 4 (3.5%) | 0 (0.0%) |
| $10,000 to $24,999 | 9 (7.9%) | 0 (0.0%) |
| $25,000 to $34,999 | 7 (6.1%) | 10 (10.3%) |
| $35,000 to $49,999 | 35 (30.7%) | 4 (4.1%) |
| $50,000 to $74,999 | 34 (29.8%) | 0 (0.0%) |
| $75,000 to $99,999 | 13 (11.4%) | 40 (41.2%) |
| $100,000 to $149,999 | 0 (0.0%) | 5 (5.1%) |
| $150,000 or more | 12 (10.5%) | 14 (14.4%) |
| Total | 114 (100.0%) | 97 (100.0%) |
Property Value to Household Income Ratio in Blende
| Value-to-Income Ratio | Without Mortgage | With Mortgage |
| Less than 2.0x | 26 (22.8%) | 0 (0.0%) |
| 2.0x to 2.9x | 23 (20.2%) | 32 (33.0%) |
| 3.0x to 3.9x | 0 (0.0%) | 9 (9.3%) |
| 4.0x or more | 65 (57.0%) | 50 (51.5%) |
| Total | 114 (100.0%) | 97 (100.0%) |
Real Estate Taxes by Mortgage Status in Blende
| Property Taxes | Without Mortgage | With Mortgage |
| Less than $800 | 12 (10.5%) | 0 (0.0%) |
| $800 to $1,499 | 75 (65.8%) | 14 (14.4%) |
| $800 to $1,499 | 27 (23.7%) | 13 (13.4%) |
| Total | 114 (100.0%) | 97 (100.0%) |
Health & Disability in Blende
Health Insurance Coverage by Age in Blende
| Age Bracket | With Coverage | Without Coverage |
| Under 6 Years | 9 (100.0%) | 0 (0.0%) |
| 6 to 18 Years | 95 (100.0%) | 0 (0.0%) |
| 19 to 25 Years | 54 (100.0%) | 0 (0.0%) |
| 26 to 34 Years | 73 (100.0%) | 0 (0.0%) |
| 35 to 44 Years | 60 (100.0%) | 0 (0.0%) |
| 45 to 54 Years | 65 (100.0%) | 0 (0.0%) |
| 55 to 64 Years | 111 (92.5%) | 9 (7.5%) |
| 65 to 74 Years | 124 (100.0%) | 0 (0.0%) |
| 75 Years and older | 63 (100.0%) | 0 (0.0%) |
| Total | 654 (98.6%) | 9 (1.4%) |
Health Insurance Coverage by Citizenship Status in Blende
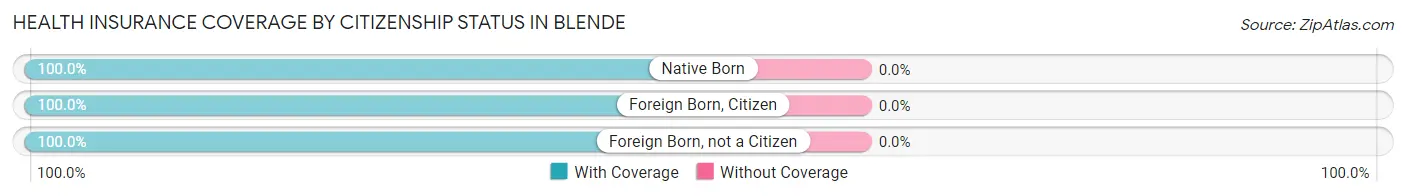
| Citizenship Status | With Coverage | Without Coverage |
| Native Born | 9 (100.0%) | 0 (0.0%) |
| Foreign Born, Citizen | 95 (100.0%) | 0 (0.0%) |
| Foreign Born, not a Citizen | 54 (100.0%) | 0 (0.0%) |
Health Insurance Coverage by Household Income in Blende
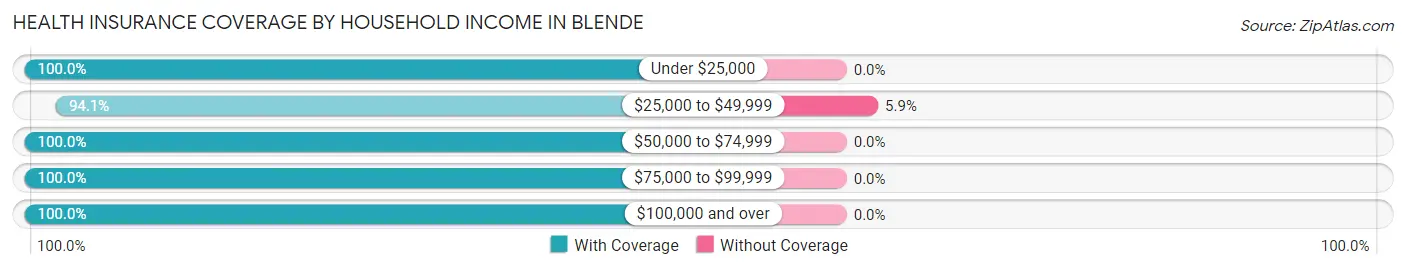
| Household Income | With Coverage | Without Coverage |
| Under $25,000 | 55 (100.0%) | 0 (0.0%) |
| $25,000 to $49,999 | 144 (94.1%) | 9 (5.9%) |
| $50,000 to $74,999 | 280 (100.0%) | 0 (0.0%) |
| $75,000 to $99,999 | 24 (100.0%) | 0 (0.0%) |
| $100,000 and over | 151 (100.0%) | 0 (0.0%) |
Public vs Private Health Insurance Coverage by Age in Blende
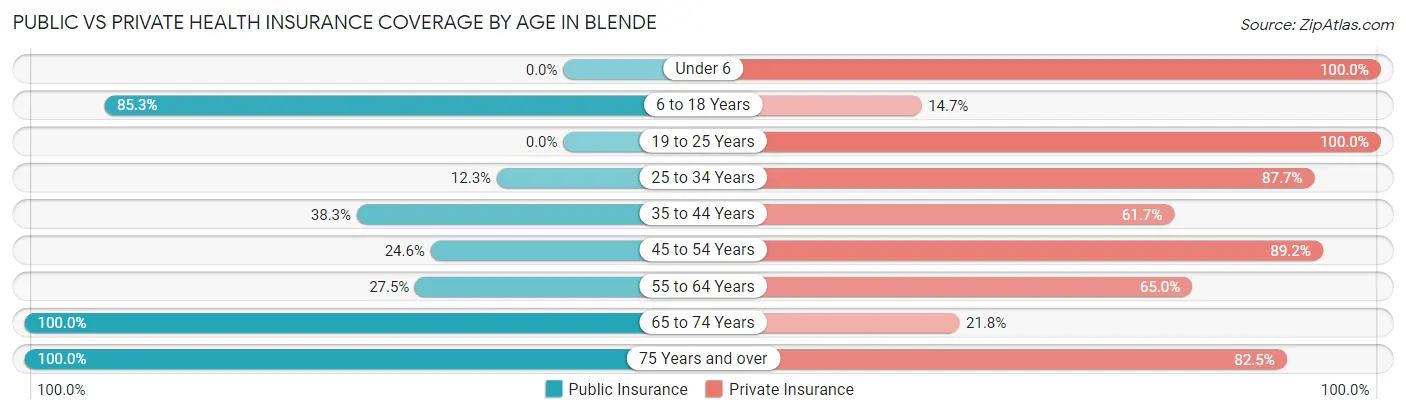
| Age Bracket | Public Insurance | Private Insurance |
| Under 6 | 0 (0.0%) | 9 (100.0%) |
| 6 to 18 Years | 81 (85.3%) | 14 (14.7%) |
| 19 to 25 Years | 0 (0.0%) | 54 (100.0%) |
| 25 to 34 Years | 9 (12.3%) | 64 (87.7%) |
| 35 to 44 Years | 23 (38.3%) | 37 (61.7%) |
| 45 to 54 Years | 16 (24.6%) | 58 (89.2%) |
| 55 to 64 Years | 33 (27.5%) | 78 (65.0%) |
| 65 to 74 Years | 124 (100.0%) | 27 (21.8%) |
| 75 Years and over | 63 (100.0%) | 52 (82.5%) |
| Total | 349 (52.6%) | 393 (59.3%) |
Disability Status by Sex by Age in Blende
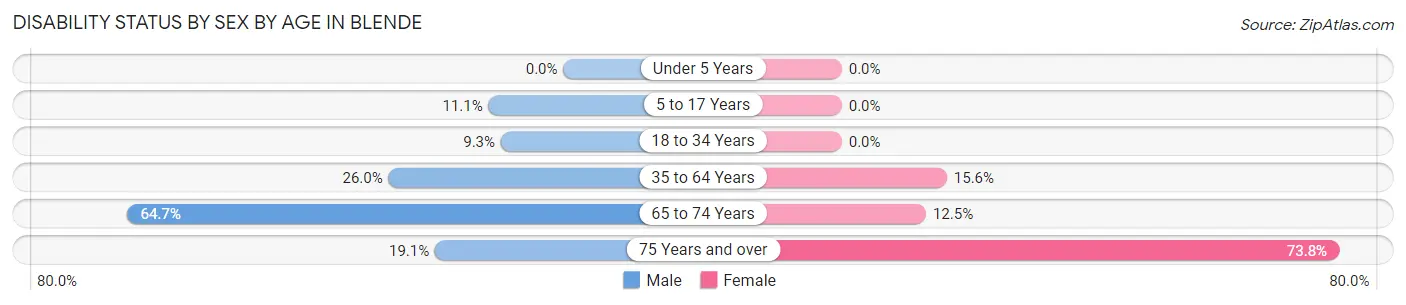
| Age Bracket | Male | Female |
| Under 5 Years | 0 (0.0%) | 0 (0.0%) |
| 5 to 17 Years | 7 (11.1%) | 0 (0.0%) |
| 18 to 34 Years | 9 (9.3%) | 0 (0.0%) |
| 35 to 64 Years | 27 (26.0%) | 22 (15.6%) |
| 65 to 74 Years | 44 (64.7%) | 7 (12.5%) |
| 75 Years and over | 4 (19.1%) | 31 (73.8%) |
Disability Class by Sex by Age in Blende
Disability Class: Hearing Difficulty
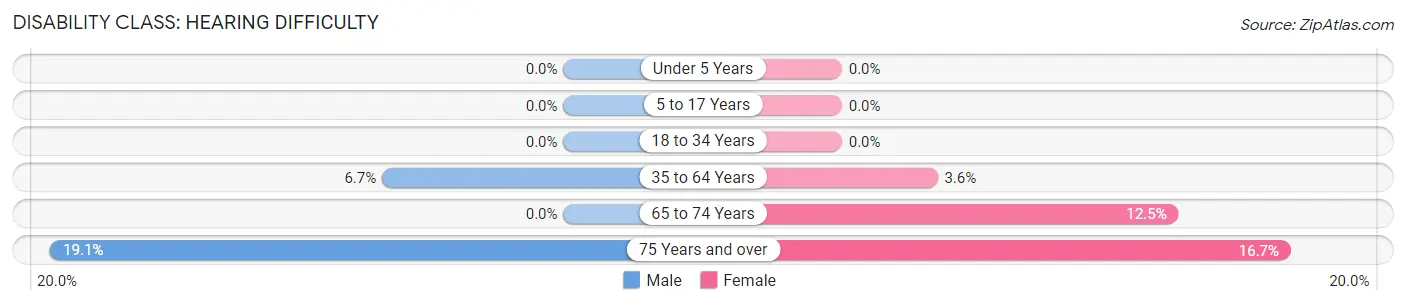
| Age Bracket | Male | Female |
| Under 5 Years | 0 (0.0%) | 0 (0.0%) |
| 5 to 17 Years | 0 (0.0%) | 0 (0.0%) |
| 18 to 34 Years | 0 (0.0%) | 0 (0.0%) |
| 35 to 64 Years | 7 (6.7%) | 5 (3.5%) |
| 65 to 74 Years | 0 (0.0%) | 7 (12.5%) |
| 75 Years and over | 4 (19.1%) | 7 (16.7%) |
Disability Class: Vision Difficulty
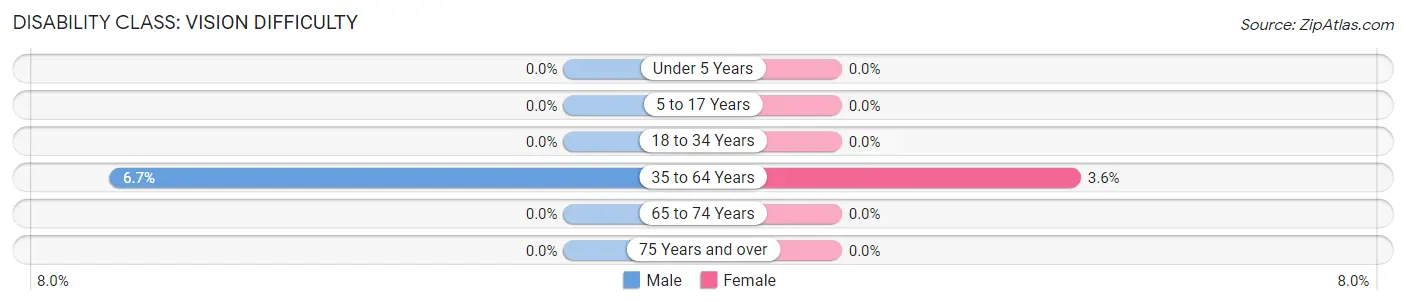
| Age Bracket | Male | Female |
| Under 5 Years | 0 (0.0%) | 0 (0.0%) |
| 5 to 17 Years | 0 (0.0%) | 0 (0.0%) |
| 18 to 34 Years | 0 (0.0%) | 0 (0.0%) |
| 35 to 64 Years | 7 (6.7%) | 5 (3.5%) |
| 65 to 74 Years | 0 (0.0%) | 0 (0.0%) |
| 75 Years and over | 0 (0.0%) | 0 (0.0%) |
Disability Class: Cognitive Difficulty
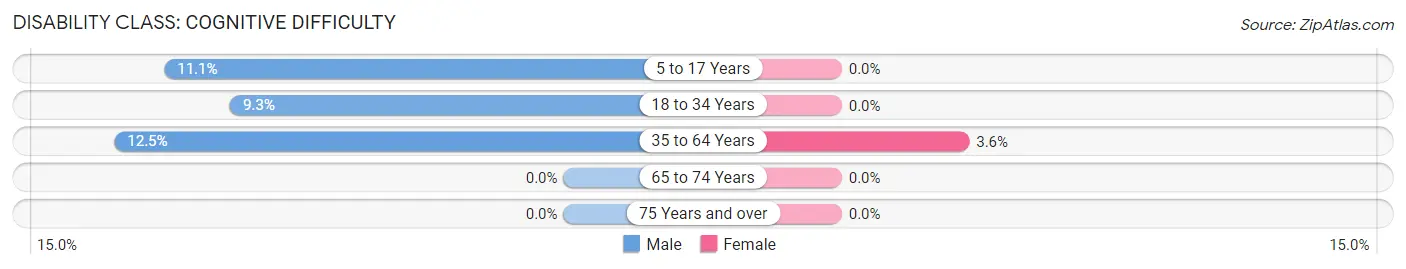
| Age Bracket | Male | Female |
| 5 to 17 Years | 7 (11.1%) | 0 (0.0%) |
| 18 to 34 Years | 9 (9.3%) | 0 (0.0%) |
| 35 to 64 Years | 13 (12.5%) | 5 (3.5%) |
| 65 to 74 Years | 0 (0.0%) | 0 (0.0%) |
| 75 Years and over | 0 (0.0%) | 0 (0.0%) |
Disability Class: Ambulatory Difficulty
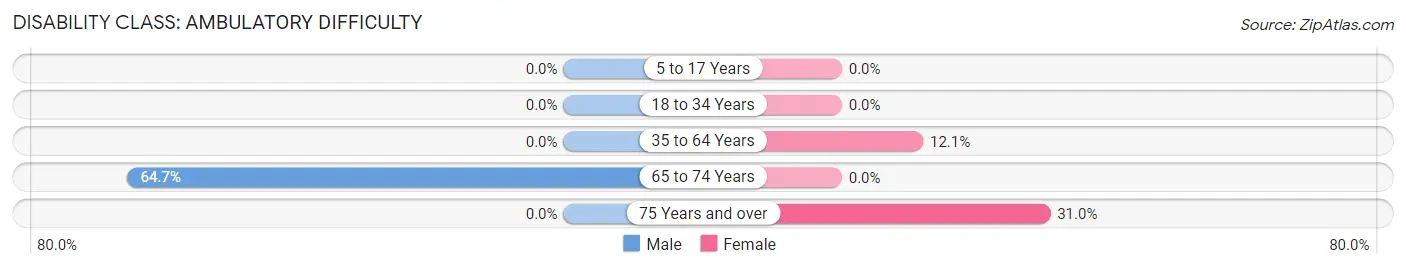
| Age Bracket | Male | Female |
| 5 to 17 Years | 0 (0.0%) | 0 (0.0%) |
| 18 to 34 Years | 0 (0.0%) | 0 (0.0%) |
| 35 to 64 Years | 0 (0.0%) | 17 (12.1%) |
| 65 to 74 Years | 44 (64.7%) | 0 (0.0%) |
| 75 Years and over | 0 (0.0%) | 13 (30.9%) |
Disability Class: Self-Care Difficulty
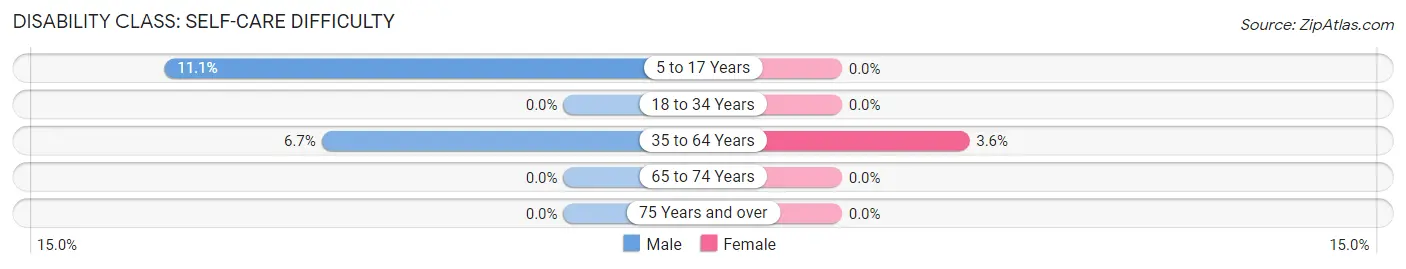
| Age Bracket | Male | Female |
| 5 to 17 Years | 7 (11.1%) | 0 (0.0%) |
| 18 to 34 Years | 0 (0.0%) | 0 (0.0%) |
| 35 to 64 Years | 7 (6.7%) | 5 (3.5%) |
| 65 to 74 Years | 0 (0.0%) | 0 (0.0%) |
| 75 Years and over | 0 (0.0%) | 0 (0.0%) |
Technology Access in Blende
Computing Device Access in Blende
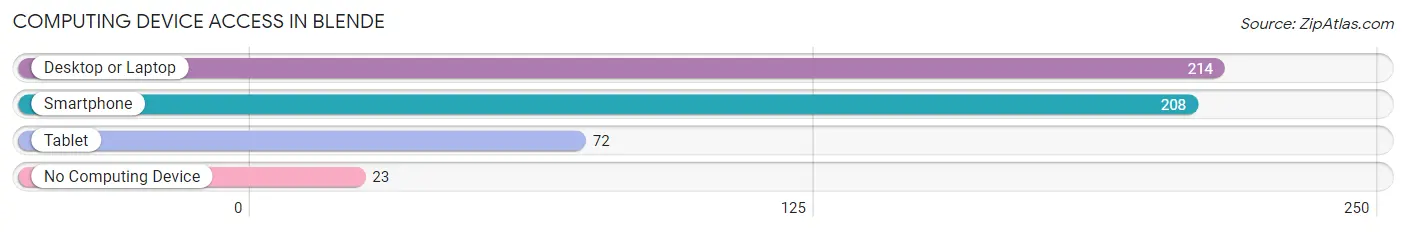
| Device Type | # Households | % Households |
| Desktop or Laptop | 214 | 73.8% |
| Smartphone | 208 | 71.7% |
| Tablet | 72 | 24.8% |
| No Computing Device | 23 | 7.9% |
| Total | 290 | 100.0% |
Internet Access in Blende
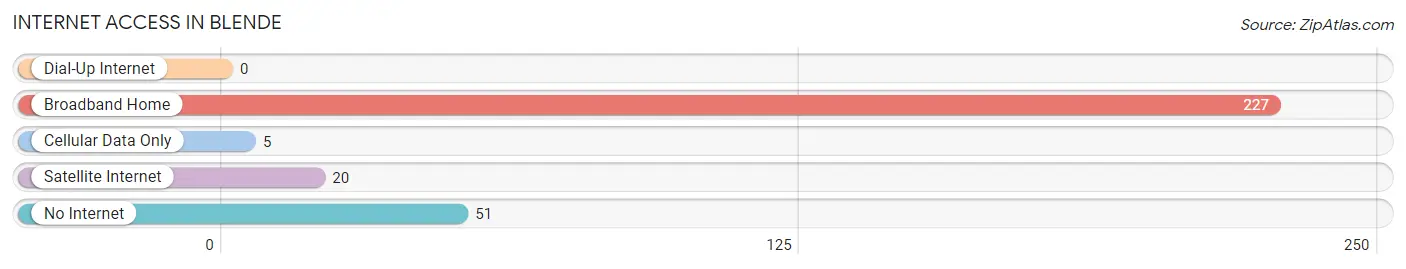
| Internet Type | # Households | % Households |
| Dial-Up Internet | 0 | 0.0% |
| Broadband Home | 227 | 78.3% |
| Cellular Data Only | 5 | 1.7% |
| Satellite Internet | 20 | 6.9% |
| No Internet | 51 | 17.6% |
| Total | 290 | 100.0% |
Blende Summary
Blende is a small unincorporated community located in Fremont County, Colorado. It is situated in the Wet Mountain Valley, approximately 8 miles south of the town of Westcliffe. The area is known for its stunning views of the Sangre de Cristo Mountains and the Wet Mountain Range.
History
The area that is now Blende was first settled in the late 1800s by ranchers and miners. The town was originally known as “Cottonwood”, but was later renamed “Blende” after the nearby Blende Mine. The mine was discovered in 1891 and was one of the most productive mines in the area. The town of Blende was officially established in 1895.
The town grew quickly and soon had a post office, a school, a general store, and several other businesses. The town was also home to a number of saloons and gambling halls. The town’s population peaked in the early 1900s, but began to decline after the mine closed in the 1920s.
Geography
Blende is located in the Wet Mountain Valley, approximately 8 miles south of the town of Westcliffe. The area is known for its stunning views of the Sangre de Cristo Mountains and the Wet Mountain Range. The town is situated at an elevation of 8,000 feet and is surrounded by rolling hills and grasslands.
The climate in Blende is semi-arid, with hot summers and cold winters. The average annual temperature is around 50 degrees Fahrenheit. The area receives an average of 16 inches of precipitation per year, with most of it falling in the form of snow.
Economy
The economy of Blende is largely based on agriculture and tourism. The area is home to several small farms and ranches, which produce hay, alfalfa, and other crops. The town is also a popular destination for tourists, who come to enjoy the stunning views of the mountains and the nearby lakes and streams.
In addition to agriculture and tourism, Blende is home to a number of small businesses, including a general store, a gas station, and a few restaurants. The town also has a post office and a small library.
Demographics
As of the 2010 census, the population of Blende was 545. The racial makeup of the town was 97.3% White, 0.2% African American, 0.4% Native American, 0.2% Asian, 0.2% from other races, and 1.7% from two or more races. Hispanic or Latino of any race were 1.3% of the population.
The median household income in Blende was $37,500, and the median family income was $41,250. The per capita income for the town was $17,857. About 11.3% of families and 14.2% of the population were below the poverty line, including 18.2% of those under age 18 and none of those age 65 or over.
Common Questions
What is Per Capita Income in Blende?
Per Capita income in Blende is $32,256.
What is the Median Family Income in Blende?
Median Family Income in Blende is $59,145.
What is the Median Household income in Blende?
Median Household Income in Blende is $58,750.
What is Income or Wage Gap in Blende?
Income or Wage Gap in Blende is 22.8%.
Women in Blende earn 77.2 cents for every dollar earned by a man.
What is Inequality or Gini Index in Blende?
Inequality or Gini Index in Blende is 0.37.
What is the Total Population of Blende?
Total Population of Blende is 663.
What is the Total Male Population of Blende?
Total Male Population of Blende is 353.
What is the Total Female Population of Blende?
Total Female Population of Blende is 310.
What is the Ratio of Males per 100 Females in Blende?
There are 113.87 Males per 100 Females in Blende.
What is the Ratio of Females per 100 Males in Blende?
There are 87.82 Females per 100 Males in Blende.
What is the Median Population Age in Blende?
Median Population Age in Blende is 50.5 Years.
What is the Average Family Size in Blende
Average Family Size in Blende is 2.9 People.
What is the Average Household Size in Blende
Average Household Size in Blende is 2.3 People.
How Large is the Labor Force in Blende?
There are 339 People in the Labor Forcein in Blende.
What is the Percentage of People in the Labor Force in Blende?
58.8% of People are in the Labor Force in Blende.
What is the Unemployment Rate in Blende?
Unemployment Rate in Blende is 7.4%.