Zip Codes with the Highest Percentage of Population Employed in Architecture & Engineering in Colorado
RELATED REPORTS & OPTIONS
Architecture & Engineering
Colorado
Compare Zip Codes
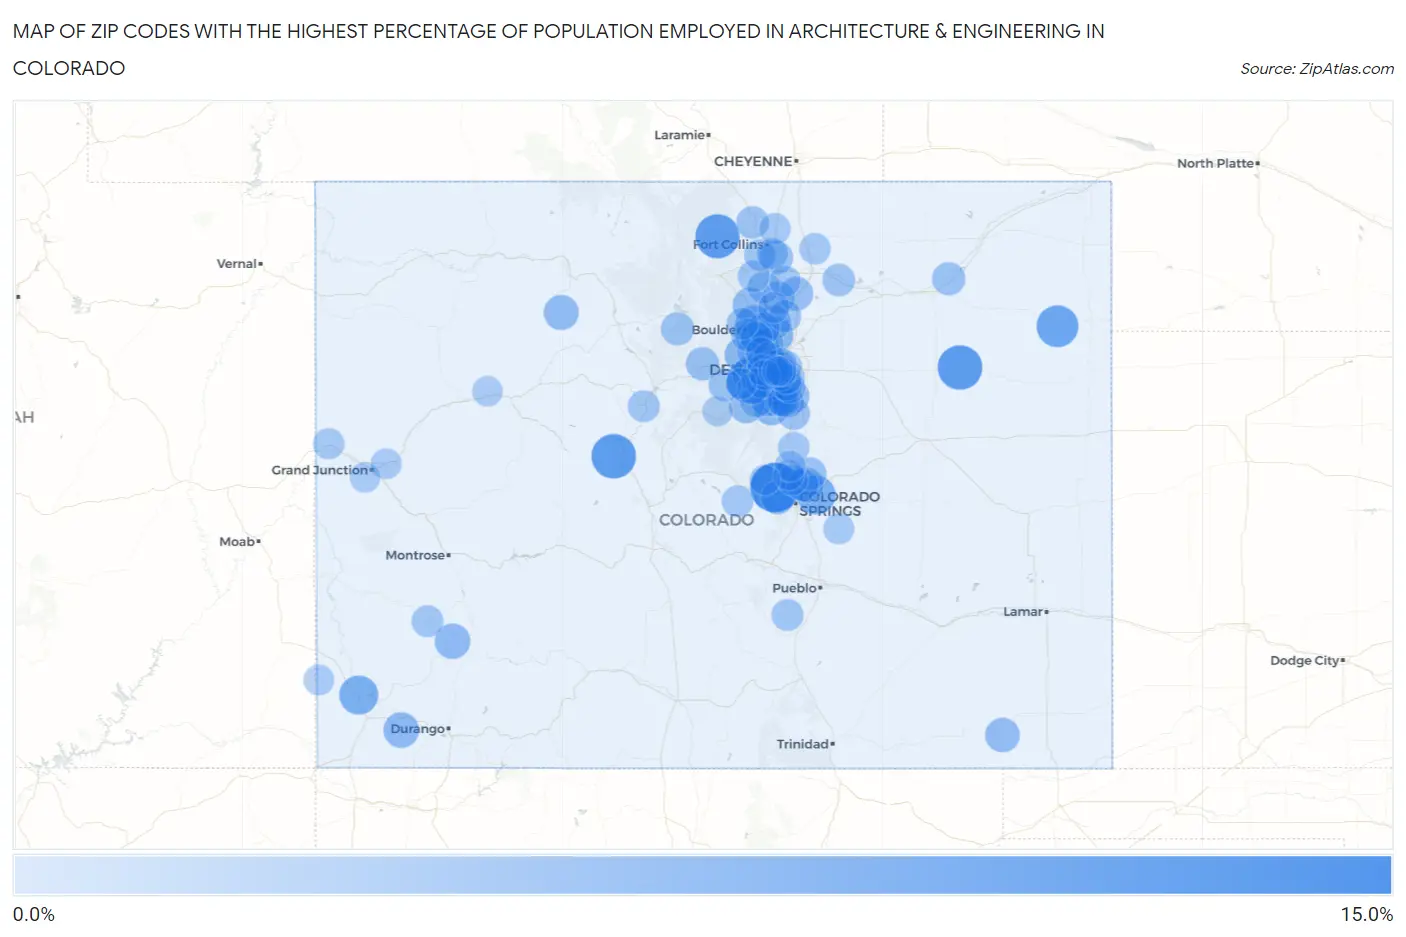
Map of Zip Codes with the Highest Percentage of Population Employed in Architecture & Engineering in Colorado
0.0%
15.0%
Zip Codes with the Highest Percentage of Population Employed in Architecture & Engineering in Colorado
| Zip Code | % Employed | vs State | vs National | |
| 1. | 80819 | 14.4% | 2.9%(+11.5)#1 | 2.1%(+12.3)#159 |
| 2. | 81251 | 11.5% | 2.9%(+8.62)#2 | 2.1%(+9.39)#261 |
| 3. | 80740 | 11.5% | 2.9%(+8.62)#3 | 2.1%(+9.39)#262 |
| 4. | 80512 | 11.3% | 2.9%(+8.33)#4 | 2.1%(+9.11)#274 |
| 5. | 80453 | 11.2% | 2.9%(+8.28)#5 | 2.1%(+9.05)#278 |
| 6. | 80727 | 9.9% | 2.9%(+7.00)#6 | 2.1%(+7.77)#347 |
| 7. | 81327 | 8.3% | 2.9%(+5.41)#7 | 2.1%(+6.18)#513 |
| 8. | 80951 | 8.2% | 2.9%(+5.27)#8 | 2.1%(+6.04)#539 |
| 9. | 80290 | 8.0% | 2.9%(+5.07)#9 | 2.1%(+5.84)#576 |
| 10. | 80023 | 7.0% | 2.9%(+4.04)#10 | 2.1%(+4.81)#758 |
| 11. | 80301 | 6.9% | 2.9%(+3.94)#11 | 2.1%(+4.72)#784 |
| 12. | 80403 | 6.5% | 2.9%(+3.59)#12 | 2.1%(+4.36)#884 |
| 13. | 81328 | 6.4% | 2.9%(+3.51)#13 | 2.1%(+4.28)#914 |
| 14. | 81426 | 6.3% | 2.9%(+3.43)#14 | 2.1%(+4.20)#943 |
| 15. | 80125 | 6.3% | 2.9%(+3.39)#15 | 2.1%(+4.16)#953 |
| 16. | 80401 | 6.1% | 2.9%(+3.19)#16 | 2.1%(+3.96)#1,034 |
| 17. | 80483 | 6.1% | 2.9%(+3.16)#17 | 2.1%(+3.93)#1,046 |
| 18. | 80924 | 6.0% | 2.9%(+3.07)#18 | 2.1%(+3.84)#1,084 |
| 19. | 80503 | 5.9% | 2.9%(+3.01)#19 | 2.1%(+3.79)#1,110 |
| 20. | 80129 | 5.8% | 2.9%(+2.88)#20 | 2.1%(+3.65)#1,175 |
| 21. | 81064 | 5.8% | 2.9%(+2.88)#21 | 2.1%(+3.65)#1,178 |
| 22. | 80021 | 5.7% | 2.9%(+2.81)#22 | 2.1%(+3.58)#1,203 |
| 23. | 80202 | 5.6% | 2.9%(+2.72)#23 | 2.1%(+3.49)#1,254 |
| 24. | 80228 | 5.6% | 2.9%(+2.71)#24 | 2.1%(+3.48)#1,263 |
| 25. | 80212 | 5.6% | 2.9%(+2.70)#25 | 2.1%(+3.47)#1,270 |
| 26. | 80433 | 5.6% | 2.9%(+2.64)#26 | 2.1%(+3.41)#1,301 |
| 27. | 80516 | 5.5% | 2.9%(+2.59)#27 | 2.1%(+3.36)#1,323 |
| 28. | 80112 | 5.4% | 2.9%(+2.52)#28 | 2.1%(+3.29)#1,367 |
| 29. | 80651 | 5.4% | 2.9%(+2.51)#29 | 2.1%(+3.28)#1,370 |
| 30. | 80809 | 5.3% | 2.9%(+2.38)#30 | 2.1%(+3.16)#1,448 |
| 31. | 80123 | 5.3% | 2.9%(+2.38)#31 | 2.1%(+3.15)#1,454 |
| 32. | 80528 | 5.2% | 2.9%(+2.33)#32 | 2.1%(+3.10)#1,488 |
| 33. | 80303 | 5.1% | 2.9%(+2.22)#33 | 2.1%(+2.99)#1,569 |
| 34. | 80436 | 5.1% | 2.9%(+2.19)#34 | 2.1%(+2.97)#1,586 |
| 35. | 80733 | 5.1% | 2.9%(+2.14)#35 | 2.1%(+2.91)#1,624 |
| 36. | 80007 | 5.0% | 2.9%(+2.12)#36 | 2.1%(+2.89)#1,635 |
| 37. | 80478 | 5.0% | 2.9%(+2.12)#37 | 2.1%(+2.89)#1,639 |
| 38. | 80002 | 4.9% | 2.9%(+1.96)#38 | 2.1%(+2.73)#1,760 |
| 39. | 80908 | 4.8% | 2.9%(+1.93)#39 | 2.1%(+2.70)#1,788 |
| 40. | 80122 | 4.8% | 2.9%(+1.92)#40 | 2.1%(+2.69)#1,795 |
| 41. | 80128 | 4.8% | 2.9%(+1.87)#41 | 2.1%(+2.64)#1,846 |
| 42. | 80305 | 4.8% | 2.9%(+1.85)#42 | 2.1%(+2.62)#1,857 |
| 43. | 80644 | 4.8% | 2.9%(+1.83)#43 | 2.1%(+2.61)#1,874 |
| 44. | 80542 | 4.7% | 2.9%(+1.79)#44 | 2.1%(+2.57)#1,914 |
| 45. | 80535 | 4.7% | 2.9%(+1.78)#45 | 2.1%(+2.55)#1,935 |
| 46. | 80124 | 4.7% | 2.9%(+1.77)#46 | 2.1%(+2.55)#1,945 |
| 47. | 80439 | 4.7% | 2.9%(+1.77)#47 | 2.1%(+2.54)#1,950 |
| 48. | 80108 | 4.6% | 2.9%(+1.71)#48 | 2.1%(+2.48)#1,999 |
| 49. | 80236 | 4.6% | 2.9%(+1.69)#49 | 2.1%(+2.47)#2,004 |
| 50. | 80530 | 4.6% | 2.9%(+1.66)#50 | 2.1%(+2.43)#2,036 |
| 51. | 80127 | 4.5% | 2.9%(+1.61)#51 | 2.1%(+2.39)#2,085 |
| 52. | 80920 | 4.5% | 2.9%(+1.60)#52 | 2.1%(+2.37)#2,095 |
| 53. | 80247 | 4.5% | 2.9%(+1.57)#53 | 2.1%(+2.35)#2,127 |
| 54. | 80020 | 4.5% | 2.9%(+1.57)#54 | 2.1%(+2.34)#2,134 |
| 55. | 80513 | 4.5% | 2.9%(+1.55)#55 | 2.1%(+2.32)#2,168 |
| 56. | 80026 | 4.4% | 2.9%(+1.51)#56 | 2.1%(+2.29)#2,214 |
| 57. | 81023 | 4.4% | 2.9%(+1.45)#57 | 2.1%(+2.22)#2,292 |
| 58. | 80537 | 4.3% | 2.9%(+1.43)#58 | 2.1%(+2.20)#2,318 |
| 59. | 80126 | 4.3% | 2.9%(+1.40)#59 | 2.1%(+2.17)#2,352 |
| 60. | 80443 | 4.3% | 2.9%(+1.40)#60 | 2.1%(+2.17)#2,353 |
| 61. | 80526 | 4.3% | 2.9%(+1.39)#61 | 2.1%(+2.16)#2,358 |
| 62. | 80227 | 4.3% | 2.9%(+1.35)#62 | 2.1%(+2.12)#2,403 |
| 63. | 80027 | 4.3% | 2.9%(+1.35)#63 | 2.1%(+2.12)#2,408 |
| 64. | 81430 | 4.2% | 2.9%(+1.32)#64 | 2.1%(+2.09)#2,442 |
| 65. | 80304 | 4.2% | 2.9%(+1.29)#65 | 2.1%(+2.06)#2,480 |
| 66. | 80816 | 4.2% | 2.9%(+1.24)#66 | 2.1%(+2.01)#2,537 |
| 67. | 80130 | 4.1% | 2.9%(+1.23)#67 | 2.1%(+2.00)#2,560 |
| 68. | 80615 | 4.0% | 2.9%(+1.13)#68 | 2.1%(+1.90)#2,706 |
| 69. | 80211 | 4.0% | 2.9%(+1.11)#69 | 2.1%(+1.88)#2,725 |
| 70. | 80237 | 4.0% | 2.9%(+1.06)#70 | 2.1%(+1.83)#2,796 |
| 71. | 80118 | 4.0% | 2.9%(+1.06)#71 | 2.1%(+1.83)#2,802 |
| 72. | 80525 | 4.0% | 2.9%(+1.06)#72 | 2.1%(+1.83)#2,806 |
| 73. | 80534 | 4.0% | 2.9%(+1.05)#73 | 2.1%(+1.83)#2,808 |
| 74. | 80111 | 4.0% | 2.9%(+1.03)#74 | 2.1%(+1.80)#2,842 |
| 75. | 81525 | 3.9% | 2.9%(+1.02)#75 | 2.1%(+1.79)#2,864 |
| 76. | 80003 | 3.9% | 2.9%(+1.02)#76 | 2.1%(+1.79)#2,870 |
| 77. | 80524 | 3.9% | 2.9%(+1.01)#77 | 2.1%(+1.78)#2,882 |
| 78. | 80207 | 3.9% | 2.9%(+0.978)#78 | 2.1%(+1.75)#2,937 |
| 79. | 80216 | 3.9% | 2.9%(+0.961)#79 | 2.1%(+1.73)#2,963 |
| 80. | 80465 | 3.9% | 2.9%(+0.940)#80 | 2.1%(+1.71)#2,991 |
| 81. | 80504 | 3.9% | 2.9%(+0.939)#81 | 2.1%(+1.71)#2,993 |
| 82. | 80209 | 3.9% | 2.9%(+0.938)#82 | 2.1%(+1.71)#2,996 |
| 83. | 80215 | 3.8% | 2.9%(+0.888)#83 | 2.1%(+1.66)#3,072 |
| 84. | 80457 | 3.8% | 2.9%(+0.880)#84 | 2.1%(+1.65)#3,093 |
| 85. | 80928 | 3.8% | 2.9%(+0.846)#85 | 2.1%(+1.62)#3,162 |
| 86. | 80840 | 3.7% | 2.9%(+0.767)#86 | 2.1%(+1.54)#3,321 |
| 87. | 80921 | 3.7% | 2.9%(+0.765)#87 | 2.1%(+1.54)#3,325 |
| 88. | 80132 | 3.7% | 2.9%(+0.763)#88 | 2.1%(+1.54)#3,329 |
| 89. | 80224 | 3.7% | 2.9%(+0.761)#89 | 2.1%(+1.53)#3,337 |
| 90. | 80204 | 3.6% | 2.9%(+0.672)#90 | 2.1%(+1.44)#3,529 |
| 91. | 81324 | 3.6% | 2.9%(+0.661)#91 | 2.1%(+1.43)#3,543 |
| 92. | 80863 | 3.6% | 2.9%(+0.661)#92 | 2.1%(+1.43)#3,544 |
| 93. | 80005 | 3.6% | 2.9%(+0.658)#93 | 2.1%(+1.43)#3,547 |
| 94. | 81520 | 3.6% | 2.9%(+0.656)#94 | 2.1%(+1.43)#3,554 |
| 95. | 80226 | 3.5% | 2.9%(+0.610)#95 | 2.1%(+1.38)#3,658 |
| 96. | 81647 | 3.5% | 2.9%(+0.577)#96 | 2.1%(+1.35)#3,743 |
| 97. | 80206 | 3.5% | 2.9%(+0.554)#97 | 2.1%(+1.33)#3,801 |
| 98. | 81507 | 3.5% | 2.9%(+0.553)#98 | 2.1%(+1.33)#3,804 |
| 99. | 80421 | 3.4% | 2.9%(+0.528)#99 | 2.1%(+1.30)#3,853 |
| 100. | 80203 | 3.4% | 2.9%(+0.487)#100 | 2.1%(+1.26)#3,948 |
Common Questions
What are the Top 10 Zip Codes with the Highest Percentage of Population Employed in Architecture & Engineering in Colorado?
Top 10 Zip Codes with the Highest Percentage of Population Employed in Architecture & Engineering in Colorado are:
What zip code has the Highest Percentage of Population Employed in Architecture & Engineering in Colorado?
80819 has the Highest Percentage of Population Employed in Architecture & Engineering in Colorado with 14.4%.
What is the Percentage of Population Employed in Architecture & Engineering in the State of Colorado?
Percentage of Population Employed in Architecture & Engineering in Colorado is 2.9%.
What is the Percentage of Population Employed in Architecture & Engineering in the United States?
Percentage of Population Employed in Architecture & Engineering in the United States is 2.1%.