Zip Codes with the Highest Percentage of Population Employed in Architecture & Engineering in Crested Butte, CO
RELATED REPORTS & OPTIONS
Architecture & Engineering
Crested Butte
Compare Zip Codes
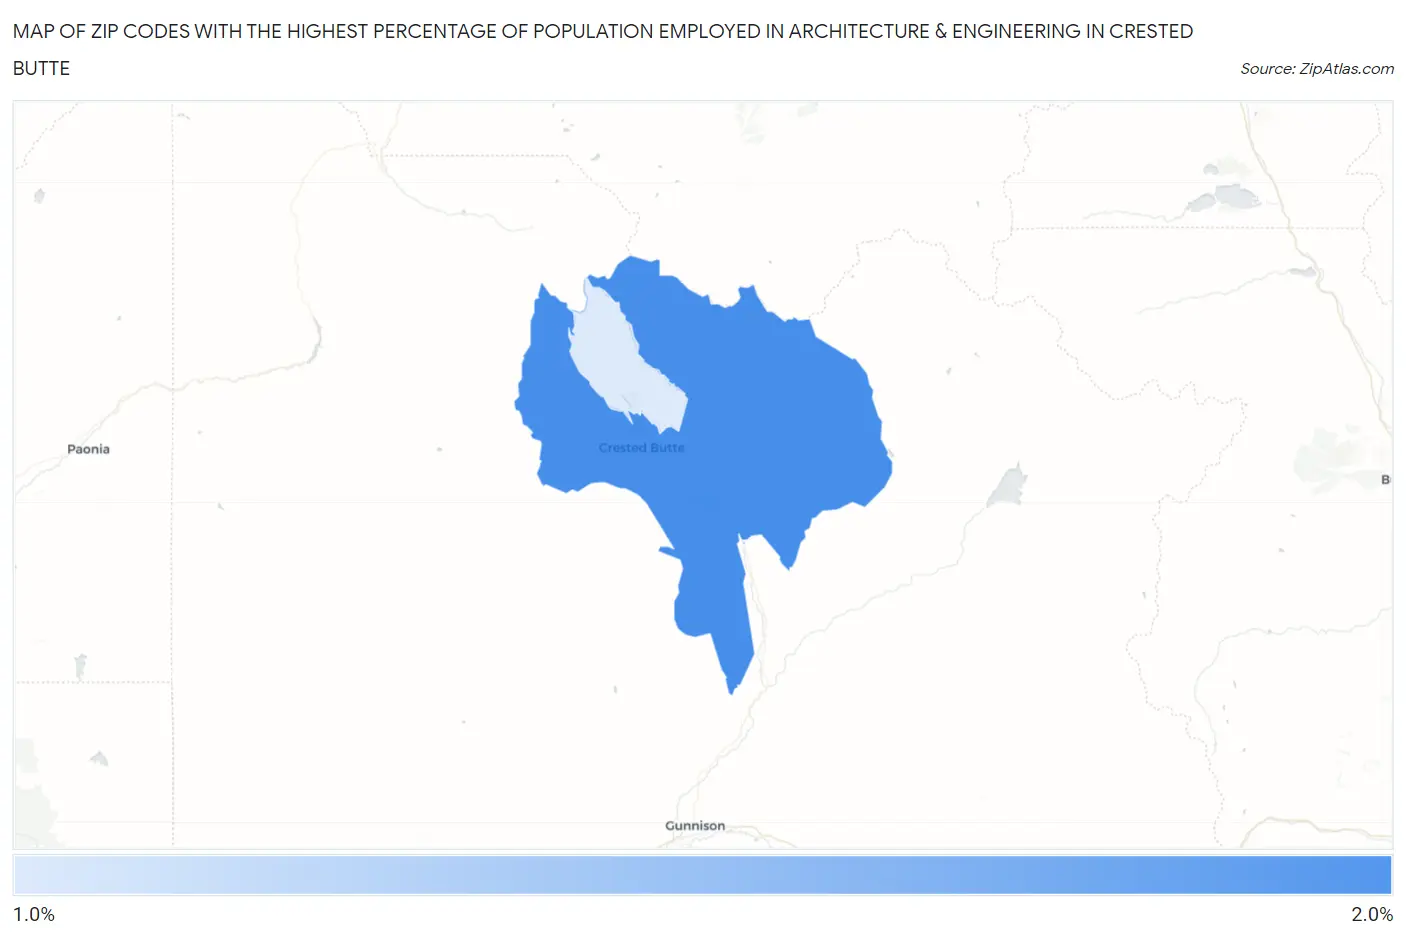
Map of Zip Codes with the Highest Percentage of Population Employed in Architecture & Engineering in Crested Butte
1.2%
1.6%
Zip Codes with the Highest Percentage of Population Employed in Architecture & Engineering in Crested Butte, CO
| Zip Code | % Employed | vs State | vs National | |
| 1. | 81224 | 1.6% | 2.9%(-1.35)#225 | 2.1%(-0.575)#12,348 |
| 2. | 81225 | 1.2% | 2.9%(-1.70)#263 | 2.1%(-0.926)#14,899 |
1
Common Questions
What are the Top Zip Codes with the Highest Percentage of Population Employed in Architecture & Engineering in Crested Butte, CO?
Top Zip Codes with the Highest Percentage of Population Employed in Architecture & Engineering in Crested Butte, CO are:
What zip code has the Highest Percentage of Population Employed in Architecture & Engineering in Crested Butte, CO?
81224 has the Highest Percentage of Population Employed in Architecture & Engineering in Crested Butte, CO with 1.6%.
What is the Percentage of Population Employed in Architecture & Engineering in Crested Butte, CO?
Percentage of Population Employed in Architecture & Engineering in Crested Butte is 0.90%.
What is the Percentage of Population Employed in Architecture & Engineering in Colorado?
Percentage of Population Employed in Architecture & Engineering in Colorado is 2.9%.
What is the Percentage of Population Employed in Architecture & Engineering in the United States?
Percentage of Population Employed in Architecture & Engineering in the United States is 2.1%.