Fountain, CO Map & Demographics
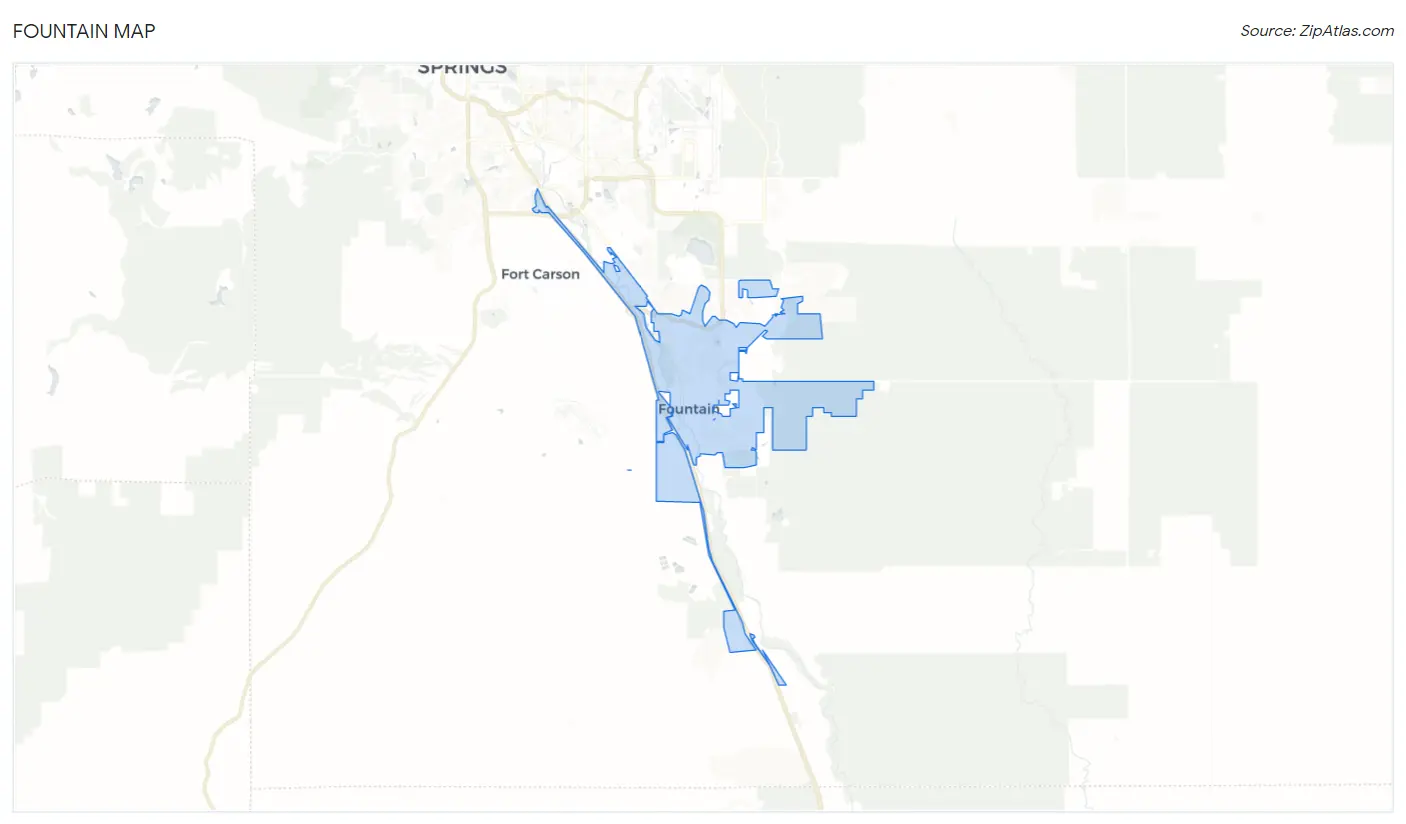
Fountain Map
Fountain Overview
$32,600
PER CAPITA INCOME
$87,782
AVG FAMILY INCOME
$80,311
AVG HOUSEHOLD INCOME
36.8%
WAGE / INCOME GAP [ % ]
63.2¢/ $1
WAGE / INCOME GAP [ $ ]
$13,568
FAMILY INCOME DEFICIT
0.38
INEQUALITY / GINI INDEX
29,498
TOTAL POPULATION
14,814
MALE POPULATION
14,684
FEMALE POPULATION
100.89
MALES / 100 FEMALES
99.12
FEMALES / 100 MALES
30.4
MEDIAN AGE
3.3
AVG FAMILY SIZE
2.9
AVG HOUSEHOLD SIZE
15,099
LABOR FORCE [ PEOPLE ]
68.9%
PERCENT IN LABOR FORCE
7.0%
UNEMPLOYMENT RATE
Fountain Zip Codes
Fountain Area Codes
Income in Fountain
Income Overview in Fountain
Per Capita Income in Fountain is $32,600, while median incomes of families and households are $87,782 and $80,311 respectively.
| Characteristic | Number | Measure |
| Per Capita Income | 29,498 | $32,600 |
| Median Family Income | 7,394 | $87,782 |
| Mean Family Income | 7,394 | $99,939 |
| Median Household Income | 10,203 | $80,311 |
| Mean Household Income | 10,203 | $92,527 |
| Income Deficit | 7,394 | $13,568 |
| Wage / Income Gap (%) | 29,498 | 36.85% |
| Wage / Income Gap ($) | 29,498 | 63.15¢ per $1 |
| Gini / Inequality Index | 29,498 | 0.38 |
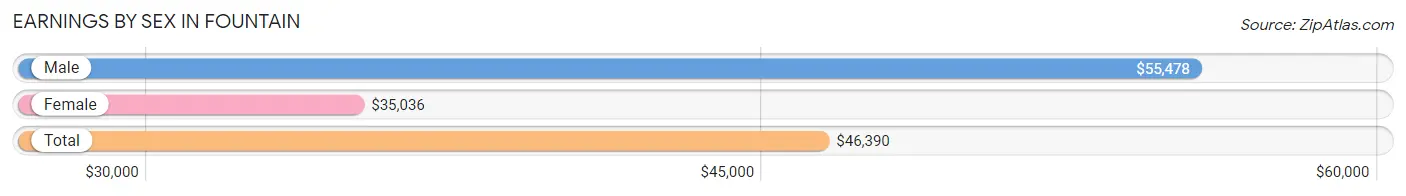
Earnings by Sex in Fountain
Average Earnings in Fountain are $46,390, $55,478 for men and $35,036 for women, a difference of 36.8%.
| Sex | Number | Average Earnings |
| Male | 8,475 (55.2%) | $55,478 |
| Female | 6,890 (44.8%) | $35,036 |
| Total | 15,365 (100.0%) | $46,390 |
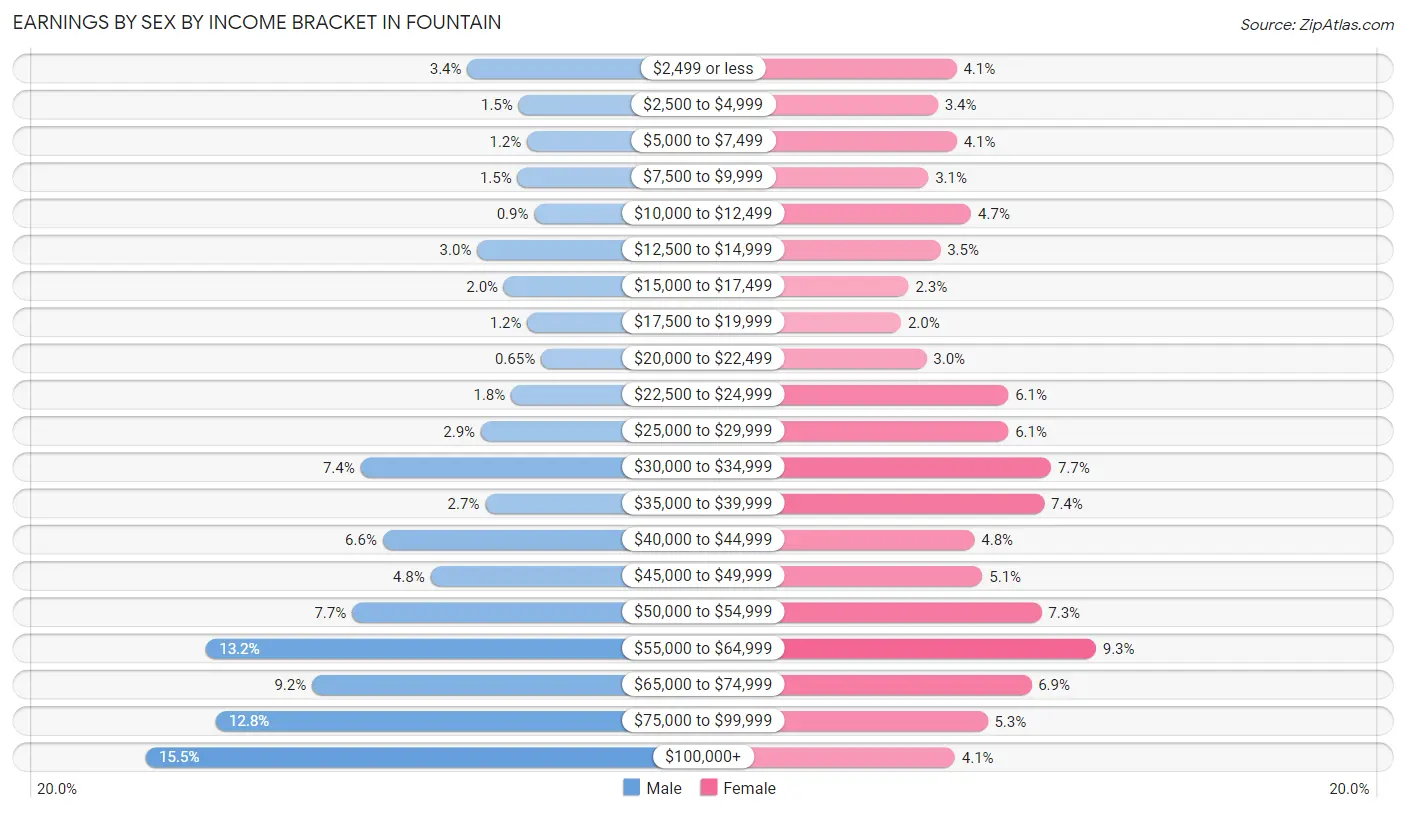
Earnings by Sex by Income Bracket in Fountain
The most common earnings brackets in Fountain are $100,000+ for men (1,309 | 15.4%) and $55,000 to $64,999 for women (643 | 9.3%).
| Income | Male | Female |
| $2,499 or less | 289 (3.4%) | 283 (4.1%) |
| $2,500 to $4,999 | 126 (1.5%) | 235 (3.4%) |
| $5,000 to $7,499 | 99 (1.2%) | 284 (4.1%) |
| $7,500 to $9,999 | 130 (1.5%) | 210 (3.0%) |
| $10,000 to $12,499 | 76 (0.9%) | 321 (4.7%) |
| $12,500 to $14,999 | 258 (3.0%) | 241 (3.5%) |
| $15,000 to $17,499 | 173 (2.0%) | 159 (2.3%) |
| $17,500 to $19,999 | 98 (1.2%) | 140 (2.0%) |
| $20,000 to $22,499 | 55 (0.6%) | 205 (3.0%) |
| $22,500 to $24,999 | 150 (1.8%) | 417 (6.0%) |
| $25,000 to $29,999 | 246 (2.9%) | 417 (6.0%) |
| $30,000 to $34,999 | 628 (7.4%) | 527 (7.6%) |
| $35,000 to $39,999 | 232 (2.7%) | 509 (7.4%) |
| $40,000 to $44,999 | 558 (6.6%) | 329 (4.8%) |
| $45,000 to $49,999 | 406 (4.8%) | 350 (5.1%) |
| $50,000 to $54,999 | 655 (7.7%) | 502 (7.3%) |
| $55,000 to $64,999 | 1,118 (13.2%) | 643 (9.3%) |
| $65,000 to $74,999 | 782 (9.2%) | 476 (6.9%) |
| $75,000 to $99,999 | 1,087 (12.8%) | 363 (5.3%) |
| $100,000+ | 1,309 (15.4%) | 279 (4.1%) |
| Total | 8,475 (100.0%) | 6,890 (100.0%) |
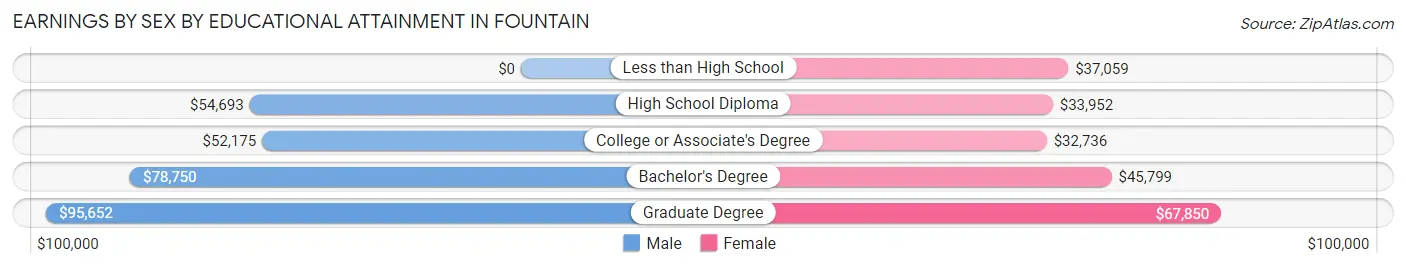
Earnings by Sex by Educational Attainment in Fountain
Average earnings in Fountain are $58,946 for men and $39,881 for women, a difference of 32.3%. Men with an educational attainment of graduate degree enjoy the highest average annual earnings of $95,652, while those with college or associate's degree education earn the least with $52,175. Women with an educational attainment of graduate degree earn the most with the average annual earnings of $67,850, while those with college or associate's degree education have the smallest earnings of $32,736.
| Educational Attainment | Male Income | Female Income |
| Less than High School | - | - |
| High School Diploma | $54,693 | $33,952 |
| College or Associate's Degree | $52,175 | $32,736 |
| Bachelor's Degree | $78,750 | $45,799 |
| Graduate Degree | $95,652 | $67,850 |
| Total | $58,946 | $39,881 |
Family Income in Fountain
Family Income Brackets in Fountain
According to the Fountain family income data, there are 1,486 families falling into the $75,000 to $99,999 income range, which is the most common income bracket and makes up 20.1% of all families. Conversely, the $10,000 to $14,999 income bracket is the least frequent group with only 30 families (0.4%) belonging to this category.
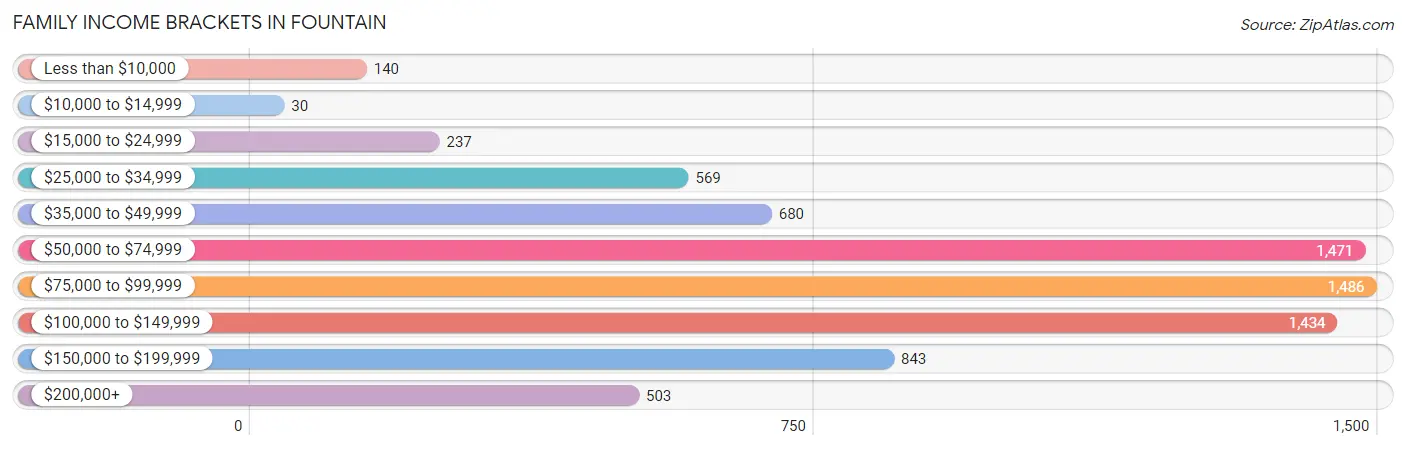
| Income Bracket | # Families | % Families |
| Less than $10,000 | 140 | 1.9% |
| $10,000 to $14,999 | 30 | 0.4% |
| $15,000 to $24,999 | 237 | 3.2% |
| $25,000 to $34,999 | 569 | 7.7% |
| $35,000 to $49,999 | 680 | 9.2% |
| $50,000 to $74,999 | 1,471 | 19.9% |
| $75,000 to $99,999 | 1,486 | 20.1% |
| $100,000 to $149,999 | 1,434 | 19.4% |
| $150,000 to $199,999 | 843 | 11.4% |
| $200,000+ | 503 | 6.8% |
Family Income by Famaliy Size in Fountain
5-person families (973 | 13.2%) account for the highest median family income in Fountain with $122,405 per family, while 2-person families (2,852 | 38.6%) have the highest median income of $38,026 per family member.
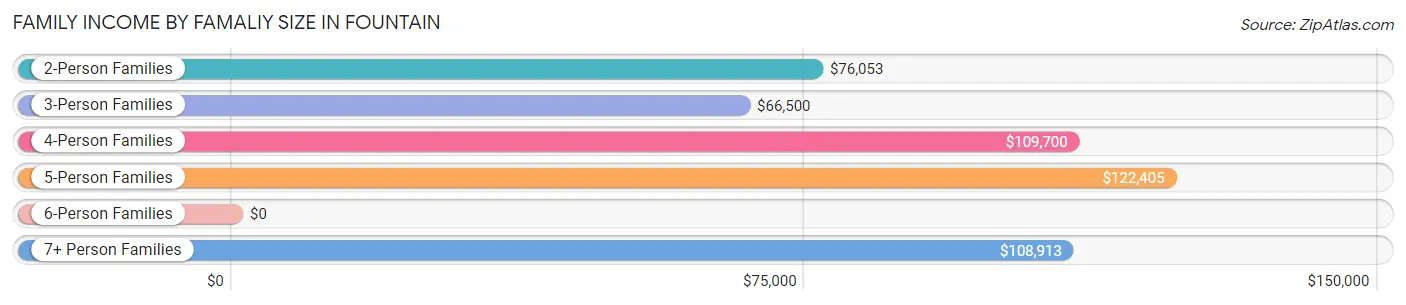
| Income Bracket | # Families | Median Income |
| 2-Person Families | 2,852 (38.6%) | $76,053 |
| 3-Person Families | 1,462 (19.8%) | $66,500 |
| 4-Person Families | 1,676 (22.7%) | $109,700 |
| 5-Person Families | 973 (13.2%) | $122,405 |
| 6-Person Families | 273 (3.7%) | $0 |
| 7+ Person Families | 158 (2.1%) | $108,913 |
| Total | 7,394 (100.0%) | $87,782 |
Family Income by Number of Earners in Fountain
The median family income in Fountain is $87,782, with families comprising 3+ earners (693) having the highest median family income of $133,125, while families with no earners (719) have the lowest median family income of $27,316, accounting for 9.4% and 9.7% of families, respectively.
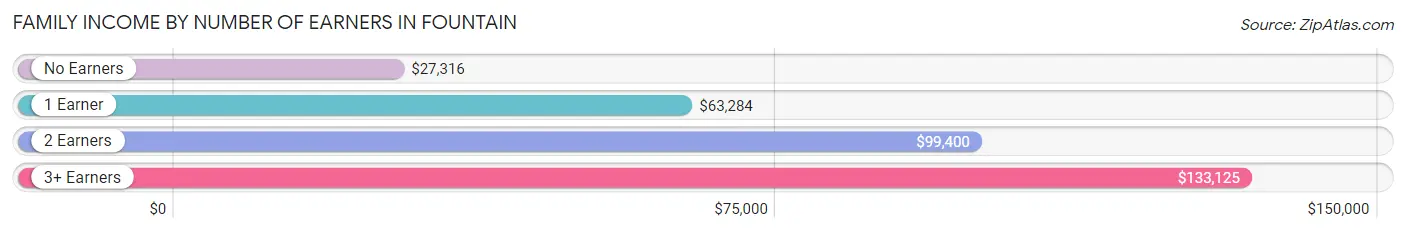
| Number of Earners | # Families | Median Income |
| No Earners | 719 (9.7%) | $27,316 |
| 1 Earner | 2,497 (33.8%) | $63,284 |
| 2 Earners | 3,485 (47.1%) | $99,400 |
| 3+ Earners | 693 (9.4%) | $133,125 |
| Total | 7,394 (100.0%) | $87,782 |
Household Income in Fountain
Household Income Brackets in Fountain
With 2,051 households falling in the category, the $75,000 to $99,999 income range is the most frequent in Fountain, accounting for 20.1% of all households. In contrast, only 204 households (2.0%) fall into the less than $10,000 income bracket, making it the least populous group.
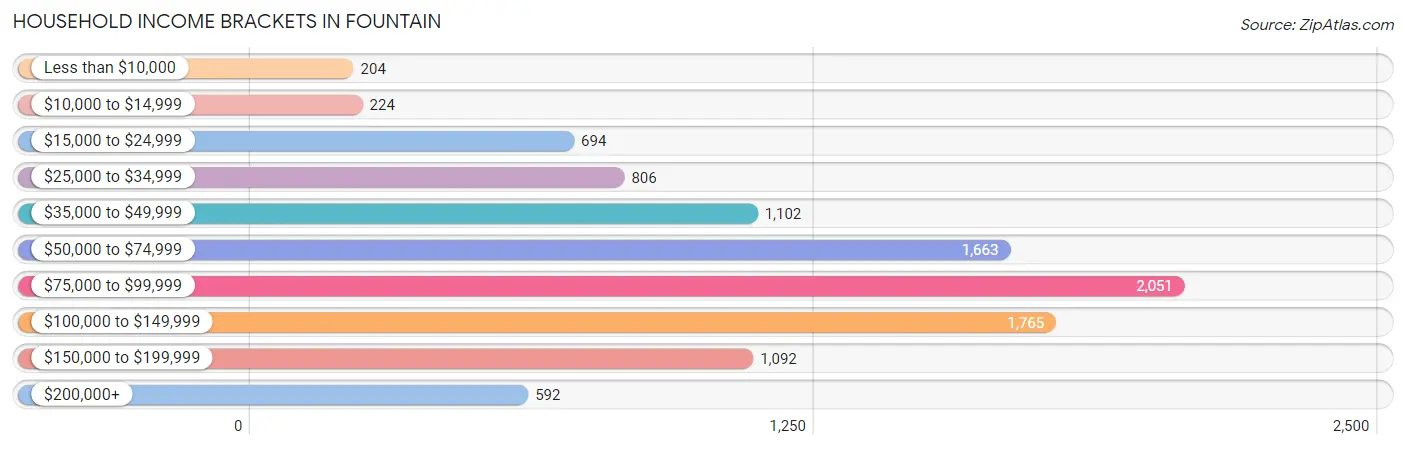
| Income Bracket | # Households | % Households |
| Less than $10,000 | 204 | 2.0% |
| $10,000 to $14,999 | 224 | 2.2% |
| $15,000 to $24,999 | 694 | 6.8% |
| $25,000 to $34,999 | 806 | 7.9% |
| $35,000 to $49,999 | 1,102 | 10.8% |
| $50,000 to $74,999 | 1,663 | 16.3% |
| $75,000 to $99,999 | 2,051 | 20.1% |
| $100,000 to $149,999 | 1,765 | 17.3% |
| $150,000 to $199,999 | 1,092 | 10.7% |
| $200,000+ | 592 | 5.8% |
Household Income by Householder Age in Fountain
The median household income in Fountain is $80,311, with the highest median household income of $88,229 found in the 45 to 64 years age bracket for the primary householder. A total of 3,115 households (30.5%) fall into this category. Meanwhile, the 65+ years age bracket for the primary householder has the lowest median household income of $48,586, with 1,183 households (11.6%) in this group.
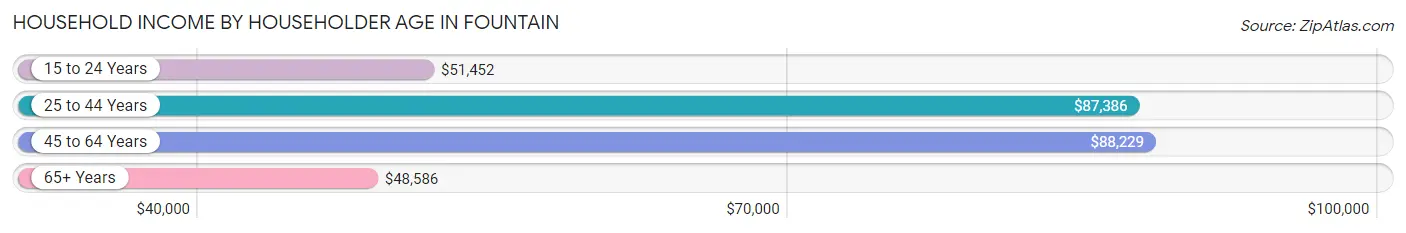
| Income Bracket | # Households | Median Income |
| 15 to 24 Years | 1,041 (10.2%) | $51,452 |
| 25 to 44 Years | 4,864 (47.7%) | $87,386 |
| 45 to 64 Years | 3,115 (30.5%) | $88,229 |
| 65+ Years | 1,183 (11.6%) | $48,586 |
| Total | 10,203 (100.0%) | $80,311 |
Poverty in Fountain
Income Below Poverty by Sex and Age in Fountain
With 7.6% poverty level for males and 9.4% for females among the residents of Fountain, under 5 year old males and 5 year old females are the most vulnerable to poverty, with 186 males (19.4%) and 72 females (28.7%) in their respective age groups living below the poverty level.
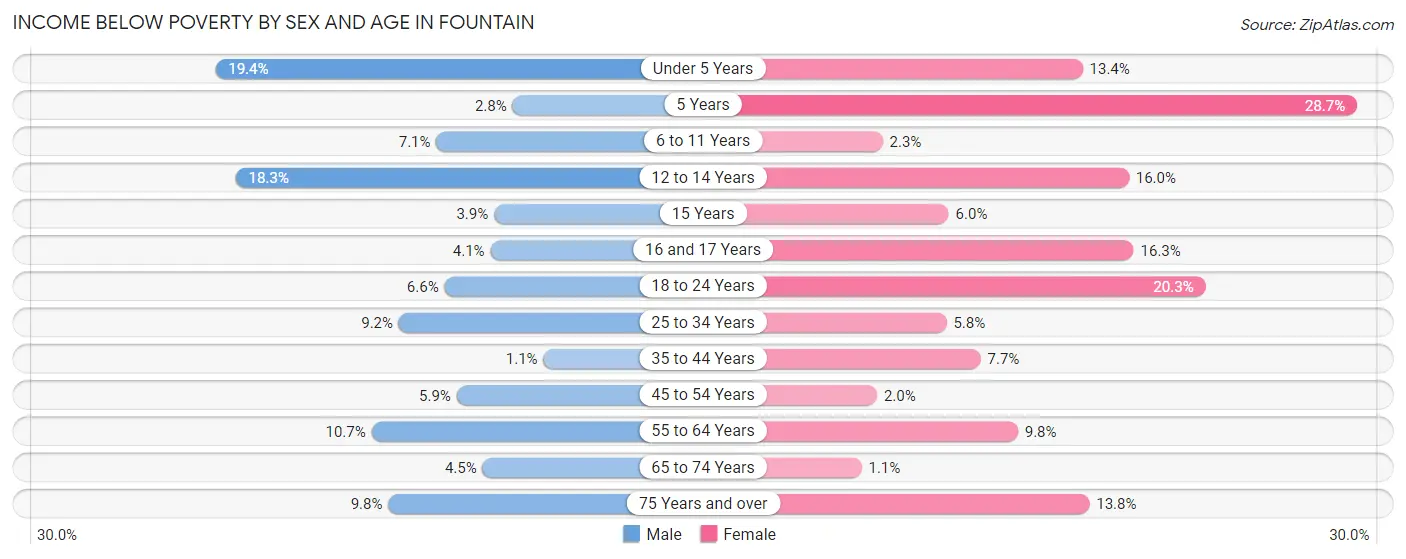
| Age Bracket | Male | Female |
| Under 5 Years | 186 (19.4%) | 153 (13.4%) |
| 5 Years | 6 (2.8%) | 72 (28.7%) |
| 6 to 11 Years | 101 (7.1%) | 26 (2.3%) |
| 12 to 14 Years | 159 (18.2%) | 144 (16.0%) |
| 15 Years | 12 (3.9%) | 16 (5.9%) |
| 16 and 17 Years | 18 (4.1%) | 78 (16.3%) |
| 18 to 24 Years | 100 (6.6%) | 328 (20.3%) |
| 25 to 34 Years | 224 (9.2%) | 163 (5.8%) |
| 35 to 44 Years | 30 (1.1%) | 163 (7.7%) |
| 45 to 54 Years | 103 (5.9%) | 28 (2.0%) |
| 55 to 64 Years | 118 (10.7%) | 147 (9.8%) |
| 65 to 74 Years | 33 (4.5%) | 7 (1.1%) |
| 75 Years and over | 27 (9.8%) | 54 (13.8%) |
| Total | 1,117 (7.6%) | 1,379 (9.4%) |
Income Above Poverty by Sex and Age in Fountain
According to the poverty statistics in Fountain, males aged 35 to 44 years and females aged 65 to 74 years are the age groups that are most secure financially, with 98.9% of males and 98.9% of females in these age groups living above the poverty line.
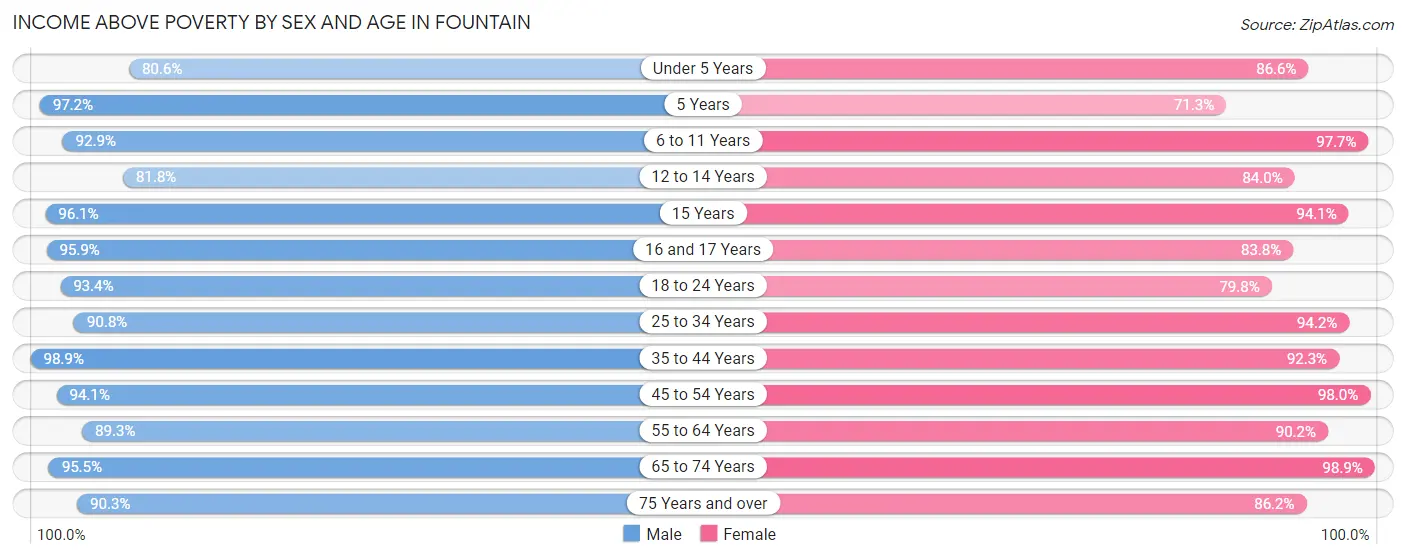
| Age Bracket | Male | Female |
| Under 5 Years | 774 (80.6%) | 988 (86.6%) |
| 5 Years | 206 (97.2%) | 179 (71.3%) |
| 6 to 11 Years | 1,327 (92.9%) | 1,121 (97.7%) |
| 12 to 14 Years | 712 (81.8%) | 757 (84.0%) |
| 15 Years | 299 (96.1%) | 253 (94.1%) |
| 16 and 17 Years | 425 (95.9%) | 402 (83.8%) |
| 18 to 24 Years | 1,410 (93.4%) | 1,292 (79.7%) |
| 25 to 34 Years | 2,221 (90.8%) | 2,632 (94.2%) |
| 35 to 44 Years | 2,674 (98.9%) | 1,947 (92.3%) |
| 45 to 54 Years | 1,630 (94.1%) | 1,404 (98.0%) |
| 55 to 64 Years | 987 (89.3%) | 1,353 (90.2%) |
| 65 to 74 Years | 701 (95.5%) | 628 (98.9%) |
| 75 Years and over | 250 (90.2%) | 338 (86.2%) |
| Total | 13,616 (92.4%) | 13,294 (90.6%) |
Income Below Poverty Among Married-Couple Families in Fountain
The poverty statistics for married-couple families in Fountain show that 2.1% or 127 of the total 5,900 families live below the poverty line. Families with 1 or 2 children have the highest poverty rate of 3.9%, comprising of 101 families. On the other hand, families with 3 or 4 children have the lowest poverty rate of 0.0%, which includes 0 families.
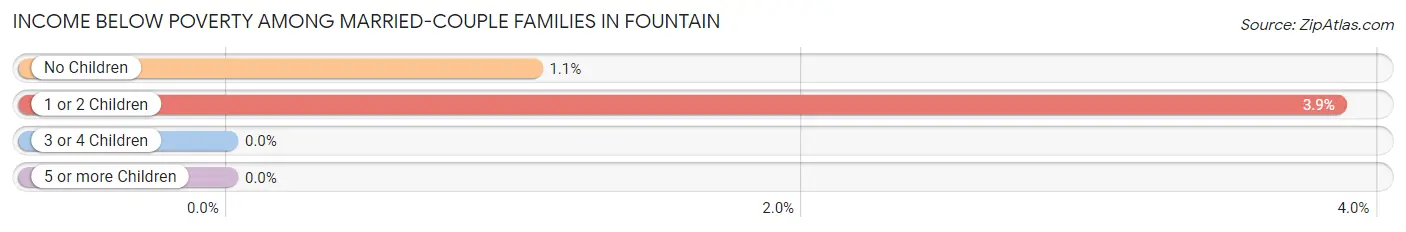
| Children | Above Poverty | Below Poverty |
| No Children | 2,429 (98.9%) | 26 (1.1%) |
| 1 or 2 Children | 2,516 (96.1%) | 101 (3.9%) |
| 3 or 4 Children | 750 (100.0%) | 0 (0.0%) |
| 5 or more Children | 78 (100.0%) | 0 (0.0%) |
| Total | 5,773 (97.9%) | 127 (2.1%) |
Income Below Poverty Among Single-Parent Households in Fountain
According to the poverty data in Fountain, 9.9% or 47 single-father households and 20.1% or 205 single-mother households are living below the poverty line. Among single-father households, those with 1 or 2 children have the highest poverty rate, with 47 households (22.4%) experiencing poverty. Likewise, among single-mother households, those with 5 or more children have the highest poverty rate, with 99 households (100.0%) falling below the poverty line.
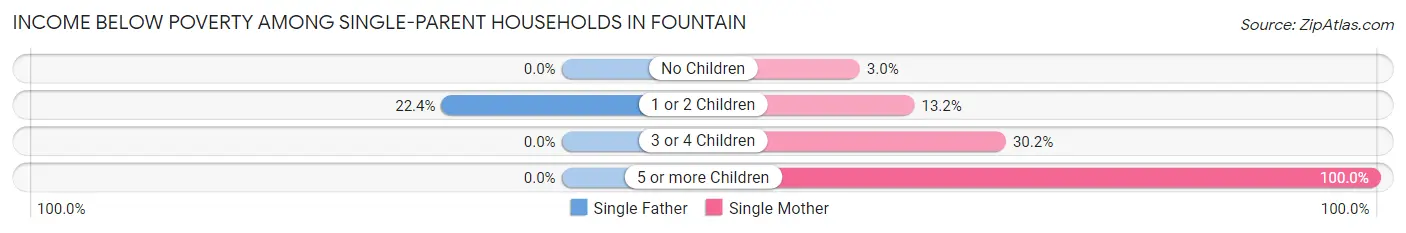
| Children | Single Father | Single Mother |
| No Children | 0 (0.0%) | 9 (3.0%) |
| 1 or 2 Children | 47 (22.4%) | 71 (13.2%) |
| 3 or 4 Children | 0 (0.0%) | 26 (30.2%) |
| 5 or more Children | 0 (0.0%) | 99 (100.0%) |
| Total | 47 (9.9%) | 205 (20.1%) |
Income Below Poverty Among Married-Couple vs Single-Parent Households in Fountain
The poverty data for Fountain shows that 127 of the married-couple family households (2.1%) and 252 of the single-parent households (16.9%) are living below the poverty level. Within the married-couple family households, those with 1 or 2 children have the highest poverty rate, with 101 households (3.9%) falling below the poverty line. Among the single-parent households, those with 5 or more children have the highest poverty rate, with 99 household (100.0%) living below poverty.
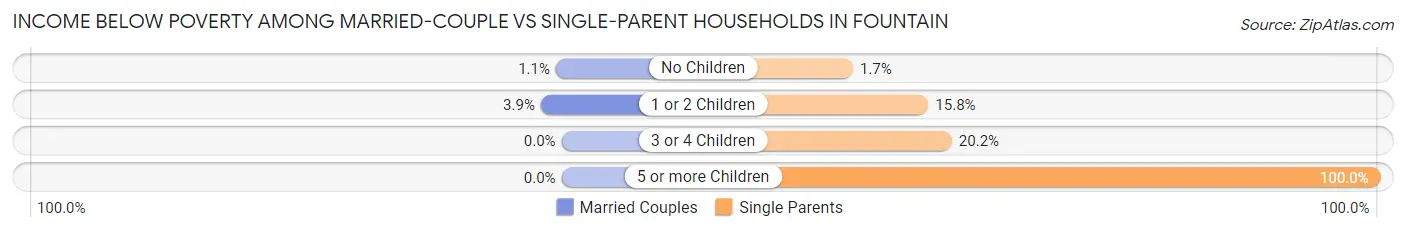
| Children | Married-Couple Families | Single-Parent Households |
| No Children | 26 (1.1%) | 9 (1.7%) |
| 1 or 2 Children | 101 (3.9%) | 118 (15.8%) |
| 3 or 4 Children | 0 (0.0%) | 26 (20.2%) |
| 5 or more Children | 0 (0.0%) | 99 (100.0%) |
| Total | 127 (2.1%) | 252 (16.9%) |
Race in Fountain
The most populous races in Fountain are White / Caucasian (20,599 | 69.8%), Hispanic or Latino (8,091 | 27.4%), and Two or more Races (3,744 | 12.7%).
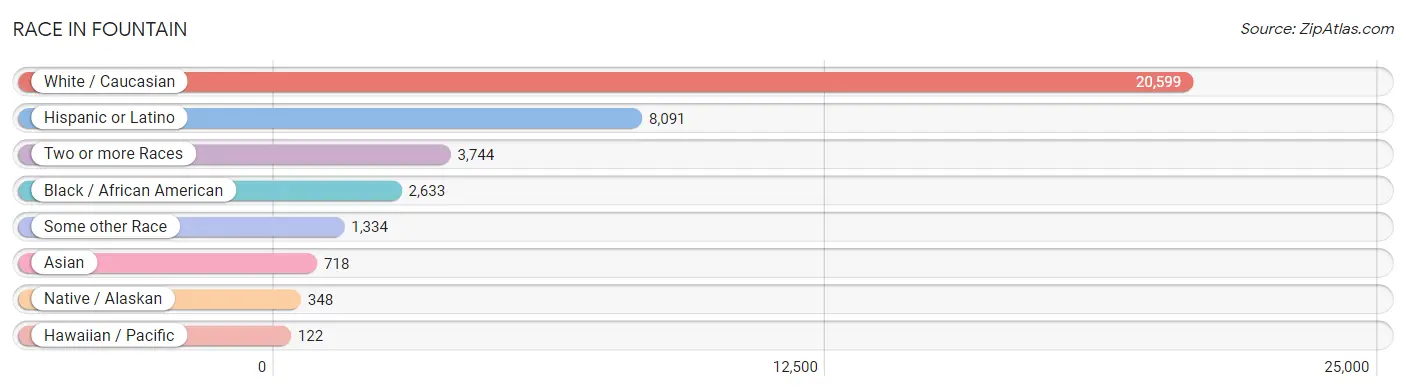
| Race | # Population | % Population |
| Asian | 718 | 2.4% |
| Black / African American | 2,633 | 8.9% |
| Hawaiian / Pacific | 122 | 0.4% |
| Hispanic or Latino | 8,091 | 27.4% |
| Native / Alaskan | 348 | 1.2% |
| White / Caucasian | 20,599 | 69.8% |
| Two or more Races | 3,744 | 12.7% |
| Some other Race | 1,334 | 4.5% |
| Total | 29,498 | 100.0% |
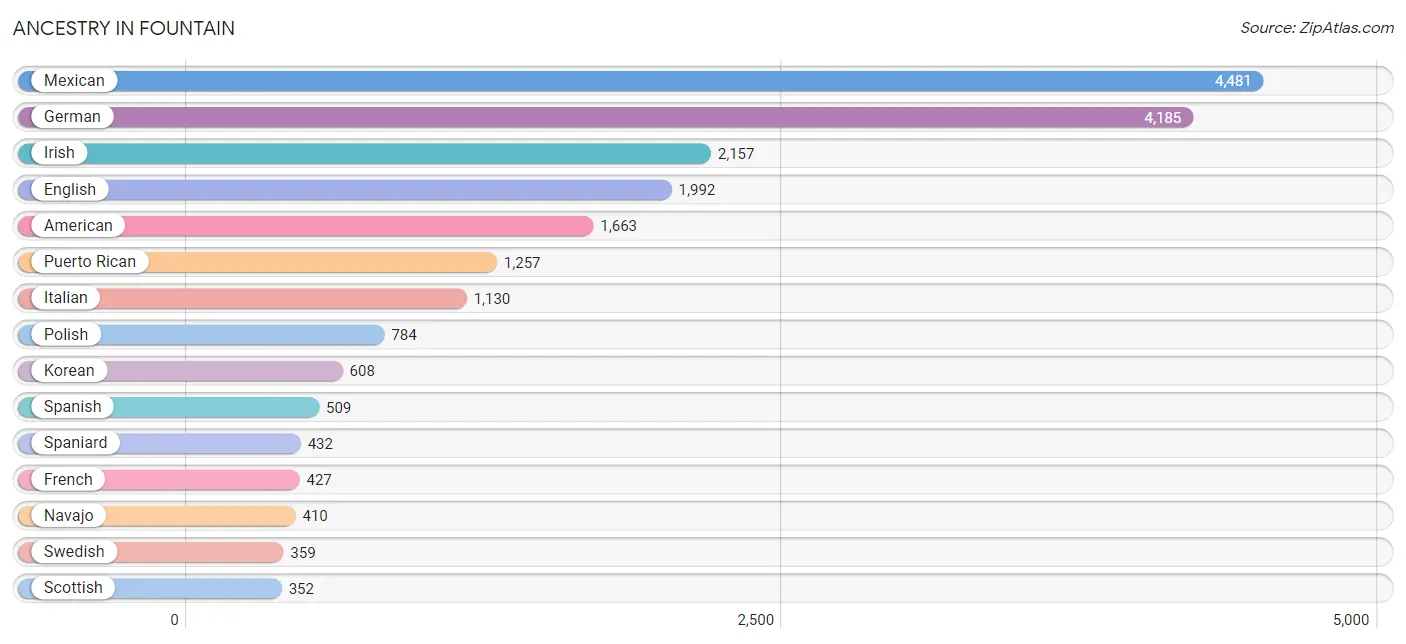
Ancestry in Fountain
The most populous ancestries reported in Fountain are Mexican (4,481 | 15.2%), German (4,185 | 14.2%), Irish (2,157 | 7.3%), English (1,992 | 6.8%), and American (1,663 | 5.6%), together accounting for 49.1% of all Fountain residents.
| Ancestry | # Population | % Population |
| African | 76 | 0.3% |
| Alaskan Athabascan | 7 | 0.0% |
| American | 1,663 | 5.6% |
| Apache | 124 | 0.4% |
| Arab | 9 | 0.0% |
| Argentinean | 42 | 0.1% |
| Armenian | 27 | 0.1% |
| Australian | 10 | 0.0% |
| Austrian | 59 | 0.2% |
| Belgian | 17 | 0.1% |
| Bhutanese | 11 | 0.0% |
| Blackfeet | 41 | 0.1% |
| Brazilian | 14 | 0.1% |
| British | 209 | 0.7% |
| Bulgarian | 8 | 0.0% |
| Burmese | 258 | 0.9% |
| Canadian | 17 | 0.1% |
| Central American | 165 | 0.6% |
| Central American Indian | 280 | 0.9% |
| Cherokee | 125 | 0.4% |
| Cheyenne | 24 | 0.1% |
| Chilean | 40 | 0.1% |
| Cree | 59 | 0.2% |
| Creek | 13 | 0.0% |
| Croatian | 24 | 0.1% |
| Cuban | 205 | 0.7% |
| Czech | 48 | 0.2% |
| Danish | 318 | 1.1% |
| Delaware | 34 | 0.1% |
| Dutch | 258 | 0.9% |
| Eastern European | 14 | 0.1% |
| Egyptian | 9 | 0.0% |
| English | 1,992 | 6.8% |
| European | 261 | 0.9% |
| Finnish | 51 | 0.2% |
| French | 427 | 1.5% |
| French Canadian | 261 | 0.9% |
| German | 4,185 | 14.2% |
| Greek | 21 | 0.1% |
| Guamanian / Chamorro | 141 | 0.5% |
| Guatemalan | 112 | 0.4% |
| Guyanese | 45 | 0.2% |
| Hungarian | 192 | 0.6% |
| Indian (Asian) | 97 | 0.3% |
| Iranian | 31 | 0.1% |
| Irish | 2,157 | 7.3% |
| Italian | 1,130 | 3.8% |
| Jamaican | 112 | 0.4% |
| Korean | 608 | 2.1% |
| Lithuanian | 23 | 0.1% |
| Mexican | 4,481 | 15.2% |
| Mexican American Indian | 255 | 0.9% |
| Native Hawaiian | 10 | 0.0% |
| Navajo | 410 | 1.4% |
| Nigerian | 13 | 0.0% |
| Norwegian | 336 | 1.1% |
| Pakistani | 8 | 0.0% |
| Panamanian | 53 | 0.2% |
| Peruvian | 144 | 0.5% |
| Polish | 784 | 2.7% |
| Portuguese | 84 | 0.3% |
| Pueblo | 3 | 0.0% |
| Puerto Rican | 1,257 | 4.3% |
| Romanian | 71 | 0.2% |
| Russian | 62 | 0.2% |
| Samoan | 145 | 0.5% |
| Scandinavian | 27 | 0.1% |
| Scotch-Irish | 138 | 0.5% |
| Scottish | 352 | 1.2% |
| Seminole | 13 | 0.0% |
| Sioux | 4 | 0.0% |
| South American | 226 | 0.8% |
| Spaniard | 432 | 1.5% |
| Spanish | 509 | 1.7% |
| Subsaharan African | 89 | 0.3% |
| Swedish | 359 | 1.2% |
| Swiss | 17 | 0.1% |
| Trinidadian and Tobagonian | 13 | 0.0% |
| Ukrainian | 9 | 0.0% |
| Welsh | 59 | 0.2% | View All 80 Rows |
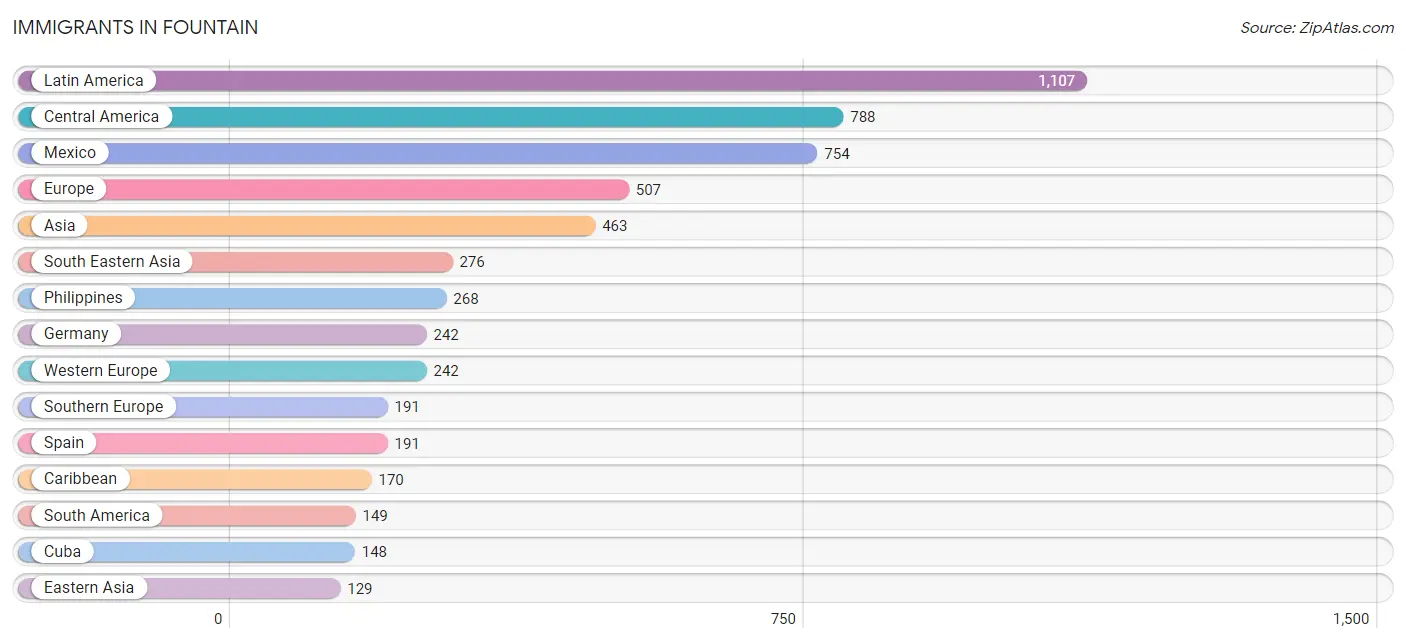
Immigrants in Fountain
The most numerous immigrant groups reported in Fountain came from Latin America (1,107 | 3.7%), Central America (788 | 2.7%), Mexico (754 | 2.6%), Europe (507 | 1.7%), and Asia (463 | 1.6%), together accounting for 12.3% of all Fountain residents.
| Immigration Origin | # Population | % Population |
| Africa | 3 | 0.0% |
| Argentina | 14 | 0.1% |
| Asia | 463 | 1.6% |
| Brazil | 14 | 0.1% |
| Caribbean | 170 | 0.6% |
| Central America | 788 | 2.7% |
| Chile | 17 | 0.1% |
| China | 10 | 0.0% |
| Cuba | 148 | 0.5% |
| Eastern Asia | 129 | 0.4% |
| Eastern Europe | 23 | 0.1% |
| El Salvador | 19 | 0.1% |
| England | 15 | 0.1% |
| Europe | 507 | 1.7% |
| Germany | 242 | 0.8% |
| Guyana | 45 | 0.2% |
| Jamaica | 22 | 0.1% |
| Japan | 10 | 0.0% |
| Korea | 109 | 0.4% |
| Latin America | 1,107 | 3.7% |
| Lithuania | 23 | 0.1% |
| Mexico | 754 | 2.6% |
| Nepal | 58 | 0.2% |
| Northern Europe | 51 | 0.2% |
| Panama | 15 | 0.1% |
| Peru | 59 | 0.2% |
| Philippines | 268 | 0.9% |
| Sierra Leone | 3 | 0.0% |
| South America | 149 | 0.5% |
| South Central Asia | 58 | 0.2% |
| South Eastern Asia | 276 | 0.9% |
| Southern Europe | 191 | 0.6% |
| Spain | 191 | 0.6% |
| Thailand | 8 | 0.0% |
| Western Africa | 3 | 0.0% |
| Western Europe | 242 | 0.8% | View All 36 Rows |
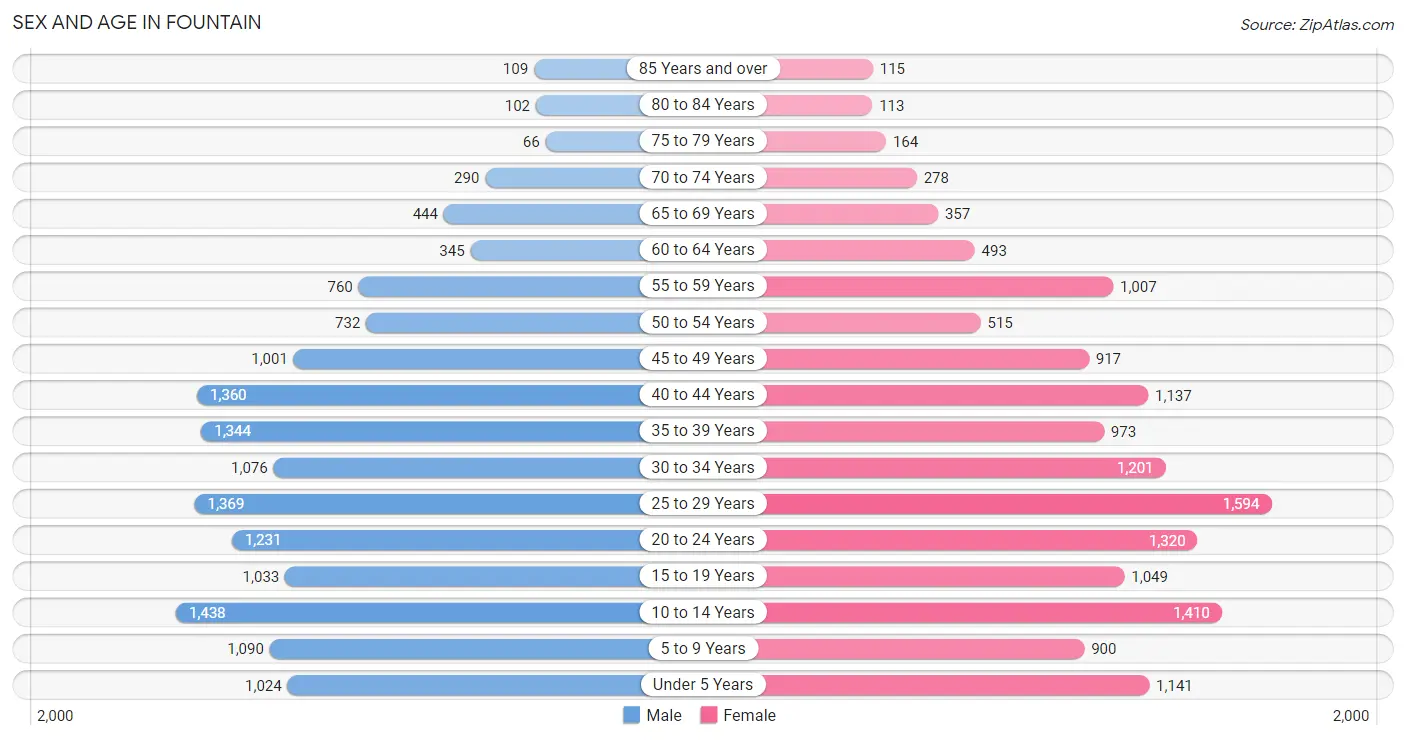
Sex and Age in Fountain
Sex and Age in Fountain
The most populous age groups in Fountain are 10 to 14 Years (1,438 | 9.7%) for men and 25 to 29 Years (1,594 | 10.9%) for women.
| Age Bracket | Male | Female |
| Under 5 Years | 1,024 (6.9%) | 1,141 (7.8%) |
| 5 to 9 Years | 1,090 (7.4%) | 900 (6.1%) |
| 10 to 14 Years | 1,438 (9.7%) | 1,410 (9.6%) |
| 15 to 19 Years | 1,033 (7.0%) | 1,049 (7.1%) |
| 20 to 24 Years | 1,231 (8.3%) | 1,320 (9.0%) |
| 25 to 29 Years | 1,369 (9.2%) | 1,594 (10.9%) |
| 30 to 34 Years | 1,076 (7.3%) | 1,201 (8.2%) |
| 35 to 39 Years | 1,344 (9.1%) | 973 (6.6%) |
| 40 to 44 Years | 1,360 (9.2%) | 1,137 (7.7%) |
| 45 to 49 Years | 1,001 (6.8%) | 917 (6.2%) |
| 50 to 54 Years | 732 (4.9%) | 515 (3.5%) |
| 55 to 59 Years | 760 (5.1%) | 1,007 (6.9%) |
| 60 to 64 Years | 345 (2.3%) | 493 (3.4%) |
| 65 to 69 Years | 444 (3.0%) | 357 (2.4%) |
| 70 to 74 Years | 290 (2.0%) | 278 (1.9%) |
| 75 to 79 Years | 66 (0.4%) | 164 (1.1%) |
| 80 to 84 Years | 102 (0.7%) | 113 (0.8%) |
| 85 Years and over | 109 (0.7%) | 115 (0.8%) |
| Total | 14,814 (100.0%) | 14,684 (100.0%) |
Families and Households in Fountain
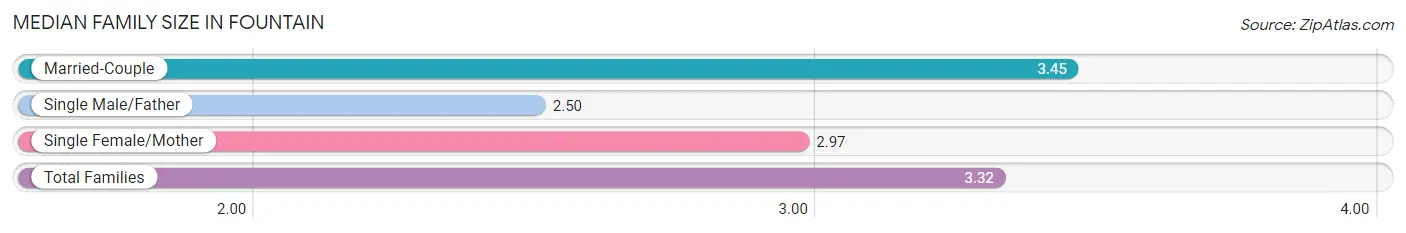
Median Family Size in Fountain
The median family size in Fountain is 3.32 persons per family, with married-couple families (5,900 | 79.8%) accounting for the largest median family size of 3.45 persons per family. On the other hand, single male/father families (473 | 6.4%) represent the smallest median family size with 2.50 persons per family.
| Family Type | # Families | Family Size |
| Married-Couple | 5,900 (79.8%) | 3.45 |
| Single Male/Father | 473 (6.4%) | 2.50 |
| Single Female/Mother | 1,021 (13.8%) | 2.97 |
| Total Families | 7,394 (100.0%) | 3.32 |
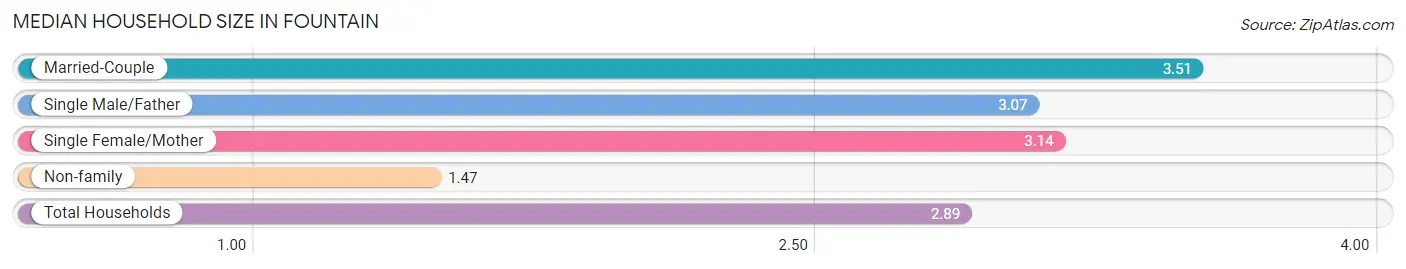
Median Household Size in Fountain
The median household size in Fountain is 2.89 persons per household, with married-couple households (5,900 | 57.8%) accounting for the largest median household size of 3.51 persons per household. non-family households (2,809 | 27.5%) represent the smallest median household size with 1.47 persons per household.
| Household Type | # Households | Household Size |
| Married-Couple | 5,900 (57.8%) | 3.51 |
| Single Male/Father | 473 (4.6%) | 3.07 |
| Single Female/Mother | 1,021 (10.0%) | 3.14 |
| Non-family | 2,809 (27.5%) | 1.47 |
| Total Households | 10,203 (100.0%) | 2.89 |
Household Size by Marriage Status in Fountain
Out of a total of 10,203 households in Fountain, 7,394 (72.5%) are family households, while 2,809 (27.5%) are nonfamily households. The most numerous type of family households are 2-person households, comprising 2,553, and the most common type of nonfamily households are 1-person households, comprising 1,952.
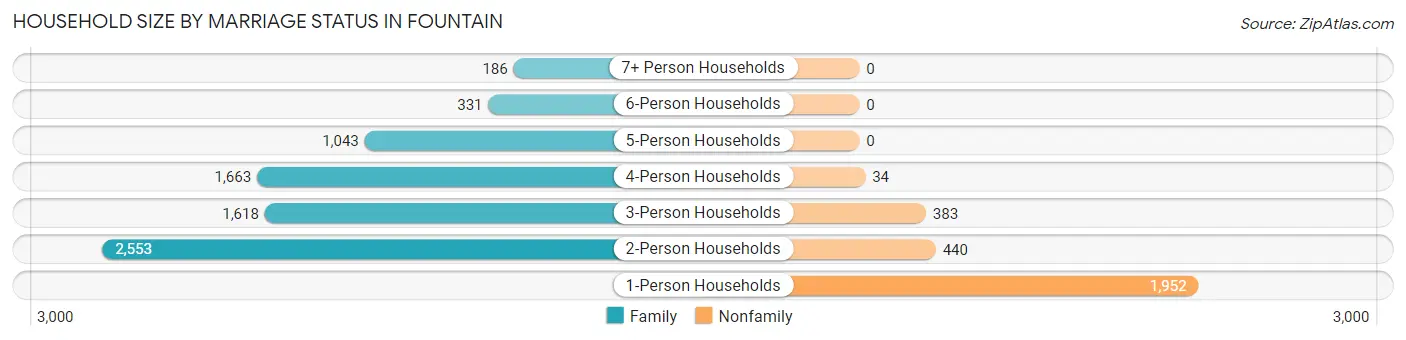
| Household Size | Family Households | Nonfamily Households |
| 1-Person Households | - | 1,952 (19.1%) |
| 2-Person Households | 2,553 (25.0%) | 440 (4.3%) |
| 3-Person Households | 1,618 (15.9%) | 383 (3.7%) |
| 4-Person Households | 1,663 (16.3%) | 34 (0.3%) |
| 5-Person Households | 1,043 (10.2%) | 0 (0.0%) |
| 6-Person Households | 331 (3.2%) | 0 (0.0%) |
| 7+ Person Households | 186 (1.8%) | 0 (0.0%) |
| Total | 7,394 (72.5%) | 2,809 (27.5%) |
Female Fertility in Fountain
Fertility by Age in Fountain
Average fertility rate in Fountain is 51.0 births per 1,000 women. Women in the age bracket of 20 to 34 years have the highest fertility rate with 85.0 births per 1,000 women. Women in the age bracket of 20 to 34 years acount for 83.2% of all women with births.
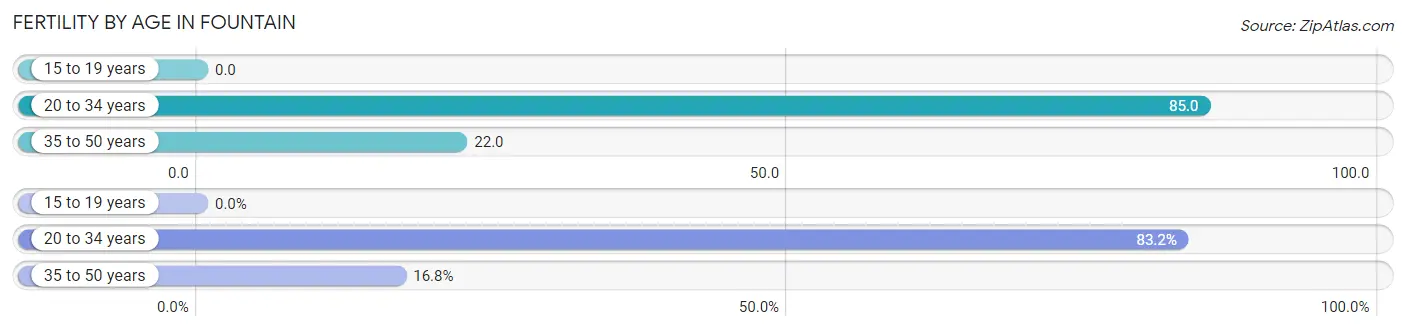
| Age Bracket | Women with Births | Births / 1,000 Women |
| 15 to 19 years | 0 (0.0%) | 0.0 |
| 20 to 34 years | 351 (83.2%) | 85.0 |
| 35 to 50 years | 71 (16.8%) | 22.0 |
| Total | 422 (100.0%) | 51.0 |
Fertility by Age by Marriage Status in Fountain
96.9% of women with births (422) in Fountain are married. The highest percentage of unmarried women with births falls into 20 to 34 years age bracket with 3.7% of them unmarried at the time of birth, while the lowest percentage of unmarried women with births belong to 35 to 50 years age bracket with 0.0% of them unmarried.
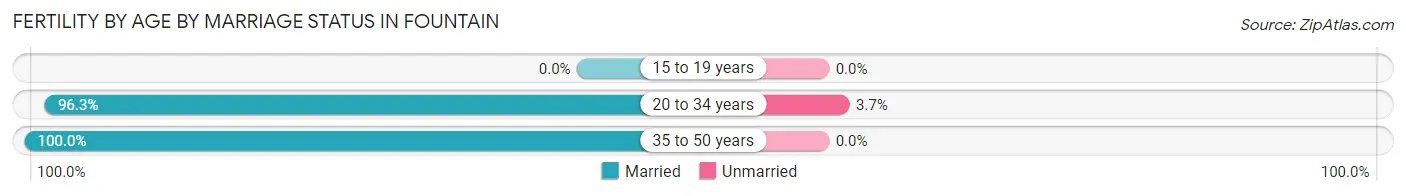
| Age Bracket | Married | Unmarried |
| 15 to 19 years | 0 (0.0%) | 0 (0.0%) |
| 20 to 34 years | 338 (96.3%) | 13 (3.7%) |
| 35 to 50 years | 71 (100.0%) | 0 (0.0%) |
| Total | 409 (96.9%) | 13 (3.1%) |
Fertility by Education in Fountain
Average fertility rate in Fountain is 51.0 births per 1,000 women. Women with the education attainment of college or associate's degree have the highest fertility rate of 55.0 births per 1,000 women, while women with the education attainment of graduate degree have the lowest fertility at 32.0 births per 1,000 women. Women with the education attainment of college or associate's degree represent 40.5% of all women with births.
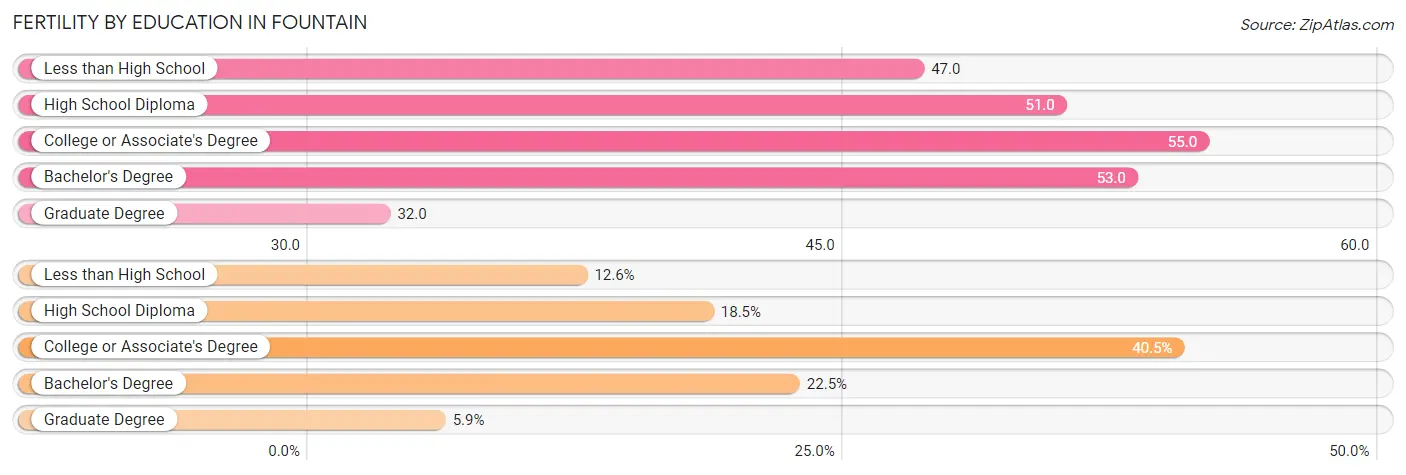
| Educational Attainment | Women with Births | Births / 1,000 Women |
| Less than High School | 53 (12.6%) | 47.0 |
| High School Diploma | 78 (18.5%) | 51.0 |
| College or Associate's Degree | 171 (40.5%) | 55.0 |
| Bachelor's Degree | 95 (22.5%) | 53.0 |
| Graduate Degree | 25 (5.9%) | 32.0 |
| Total | 422 (100.0%) | 51.0 |
Fertility by Education by Marriage Status in Fountain
3.1% of women with births in Fountain are unmarried. Women with the educational attainment of less than high school are most likely to be married with 100.0% of them married at childbirth, while women with the educational attainment of bachelor's degree are least likely to be married with 13.7% of them unmarried at childbirth.
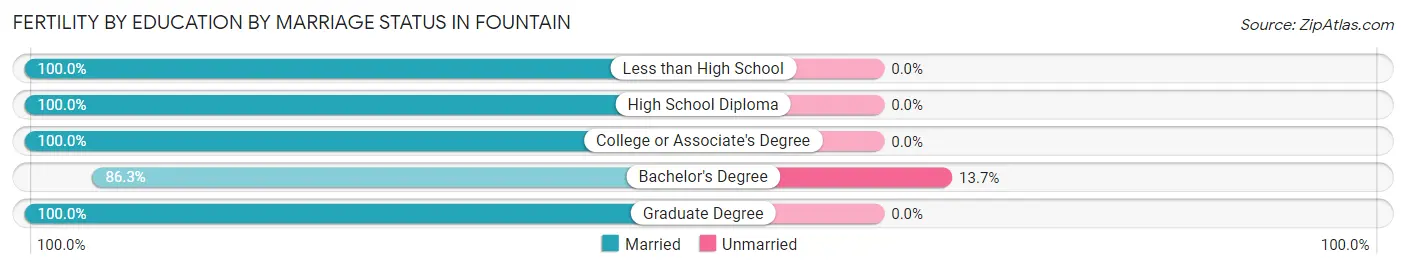
| Educational Attainment | Married | Unmarried |
| Less than High School | 53 (100.0%) | 0 (0.0%) |
| High School Diploma | 78 (100.0%) | 0 (0.0%) |
| College or Associate's Degree | 171 (100.0%) | 0 (0.0%) |
| Bachelor's Degree | 82 (86.3%) | 13 (13.7%) |
| Graduate Degree | 25 (100.0%) | 0 (0.0%) |
| Total | 409 (96.9%) | 13 (3.1%) |
Employment Characteristics in Fountain
Employment by Class of Employer in Fountain
Among the 13,780 employed individuals in Fountain, private company employees (7,714 | 56.0%), federal government employees (2,698 | 19.6%), and local government employees (1,091 | 7.9%) make up the most common classes of employment.
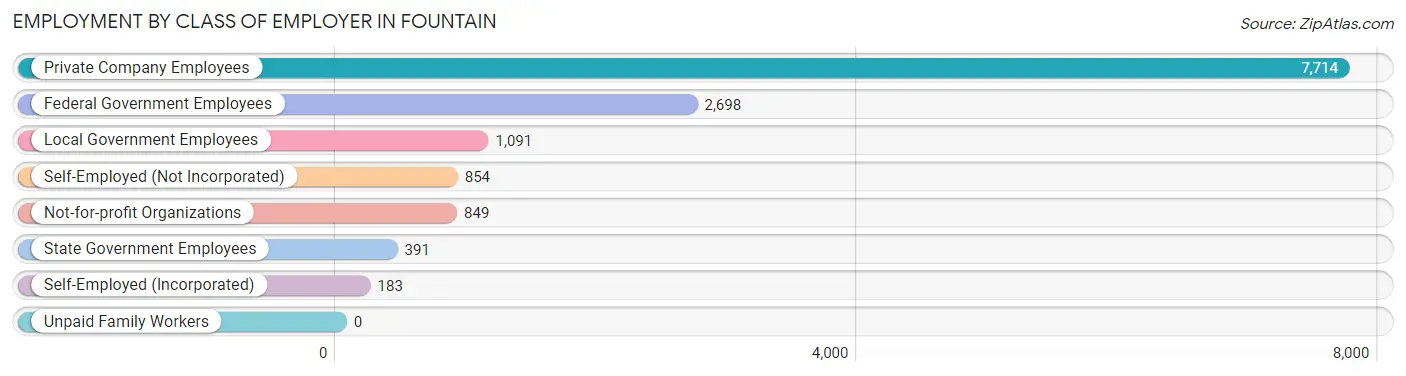
| Employer Class | # Employees | % Employees |
| Private Company Employees | 7,714 | 56.0% |
| Self-Employed (Incorporated) | 183 | 1.3% |
| Self-Employed (Not Incorporated) | 854 | 6.2% |
| Not-for-profit Organizations | 849 | 6.2% |
| Local Government Employees | 1,091 | 7.9% |
| State Government Employees | 391 | 2.8% |
| Federal Government Employees | 2,698 | 19.6% |
| Unpaid Family Workers | 0 | 0.0% |
| Total | 13,780 | 100.0% |
Employment Status by Age in Fountain
According to the labor force statistics for Fountain, out of the total population over 16 years of age (21,915), 68.9% or 15,099 individuals are in the labor force, with 7.0% or 1,057 of them unemployed. The age group with the highest labor force participation rate is 45 to 54 years, with 85.2% or 2,697 individuals in the labor force. Within the labor force, the 16 to 19 years age range has the highest percentage of unemployed individuals, with 35.4% or 183 of them being unemployed.
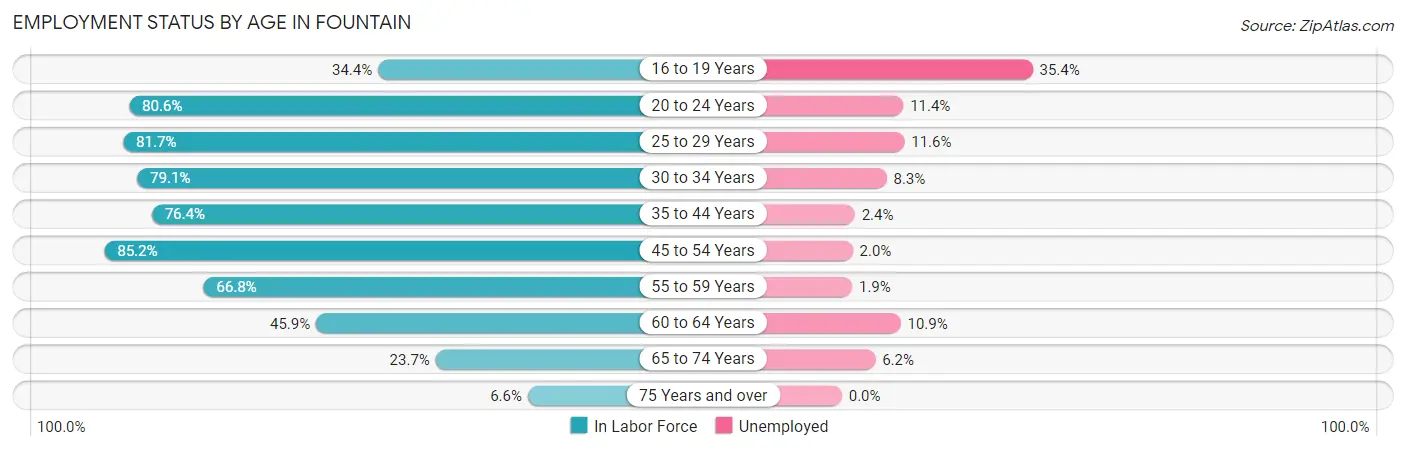
| Age Bracket | In Labor Force | Unemployed |
| 16 to 19 Years | 517 (34.4%) | 183 (35.4%) |
| 20 to 24 Years | 2,056 (80.6%) | 234 (11.4%) |
| 25 to 29 Years | 2,421 (81.7%) | 281 (11.6%) |
| 30 to 34 Years | 1,801 (79.1%) | 149 (8.3%) |
| 35 to 44 Years | 3,678 (76.4%) | 88 (2.4%) |
| 45 to 54 Years | 2,697 (85.2%) | 54 (2.0%) |
| 55 to 59 Years | 1,180 (66.8%) | 22 (1.9%) |
| 60 to 64 Years | 385 (45.9%) | 42 (10.9%) |
| 65 to 74 Years | 324 (23.7%) | 20 (6.2%) |
| 75 Years and over | 44 (6.6%) | 0 (0.0%) |
| Total | 15,099 (68.9%) | 1,057 (7.0%) |
Employment Status by Educational Attainment in Fountain
According to labor force statistics for Fountain, 76.9% of individuals (12,169) out of the total population between 25 and 64 years of age (15,824) are in the labor force, with 5.0% or 608 of them being unemployed. The group with the highest labor force participation rate are those with the educational attainment of college / associate degree, with 79.8% or 5,122 individuals in the labor force. Within the labor force, individuals with less than high school education have the highest percentage of unemployment, with 9.7% or 42 of them being unemployed.
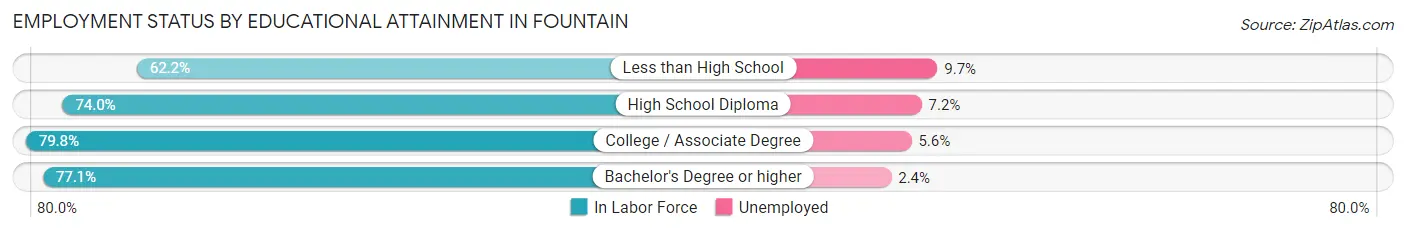
| Educational Attainment | In Labor Force | Unemployed |
| Less than High School | 434 (62.2%) | 68 (9.7%) |
| High School Diploma | 2,552 (74.0%) | 248 (7.2%) |
| College / Associate Degree | 5,122 (79.8%) | 359 (5.6%) |
| Bachelor's Degree or higher | 4,054 (77.1%) | 126 (2.4%) |
| Total | 12,169 (76.9%) | 791 (5.0%) |
Employment Occupations by Sex in Fountain
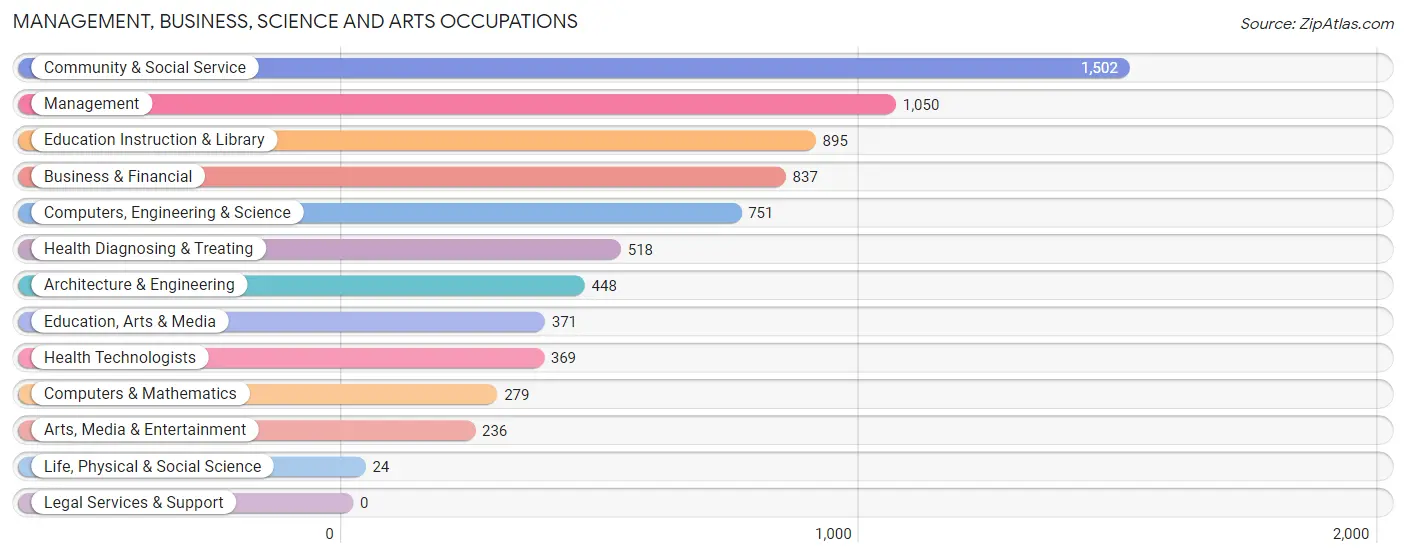
Management, Business, Science and Arts Occupations
The most common Management, Business, Science and Arts occupations in Fountain are Community & Social Service (1,502 | 11.8%), Management (1,050 | 8.2%), Education Instruction & Library (895 | 7.0%), Business & Financial (837 | 6.6%), and Computers, Engineering & Science (751 | 5.9%).
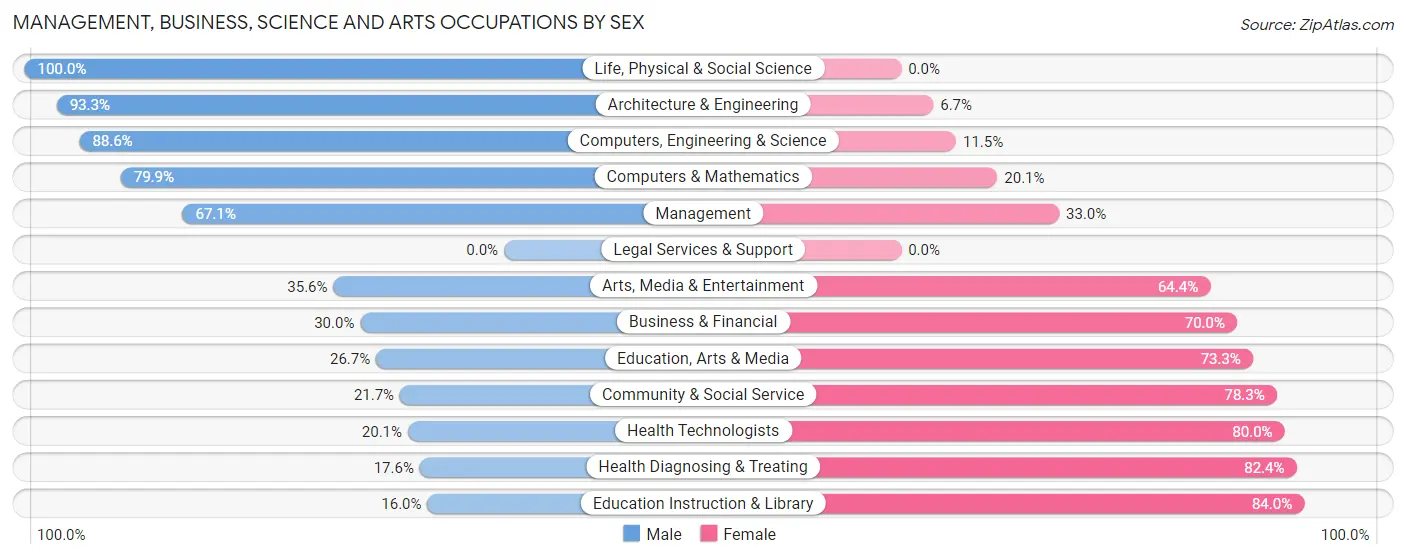
Management, Business, Science and Arts Occupations by Sex
Within the Management, Business, Science and Arts occupations in Fountain, the most male-oriented occupations are Life, Physical & Social Science (100.0%), Architecture & Engineering (93.3%), and Computers, Engineering & Science (88.5%), while the most female-oriented occupations are Education Instruction & Library (84.0%), Health Diagnosing & Treating (82.4%), and Health Technologists (79.9%).
| Occupation | Male | Female |
| Management | 704 (67.0%) | 346 (33.0%) |
| Business & Financial | 251 (30.0%) | 586 (70.0%) |
| Computers, Engineering & Science | 665 (88.5%) | 86 (11.5%) |
| Computers & Mathematics | 223 (79.9%) | 56 (20.1%) |
| Architecture & Engineering | 418 (93.3%) | 30 (6.7%) |
| Life, Physical & Social Science | 24 (100.0%) | 0 (0.0%) |
| Community & Social Service | 326 (21.7%) | 1,176 (78.3%) |
| Education, Arts & Media | 99 (26.7%) | 272 (73.3%) |
| Legal Services & Support | 0 (0.0%) | 0 (0.0%) |
| Education Instruction & Library | 143 (16.0%) | 752 (84.0%) |
| Arts, Media & Entertainment | 84 (35.6%) | 152 (64.4%) |
| Health Diagnosing & Treating | 91 (17.6%) | 427 (82.4%) |
| Health Technologists | 74 (20.1%) | 295 (79.9%) |
| Total (Category) | 2,037 (43.7%) | 2,621 (56.3%) |
| Total (Overall) | 6,714 (52.7%) | 6,029 (47.3%) |
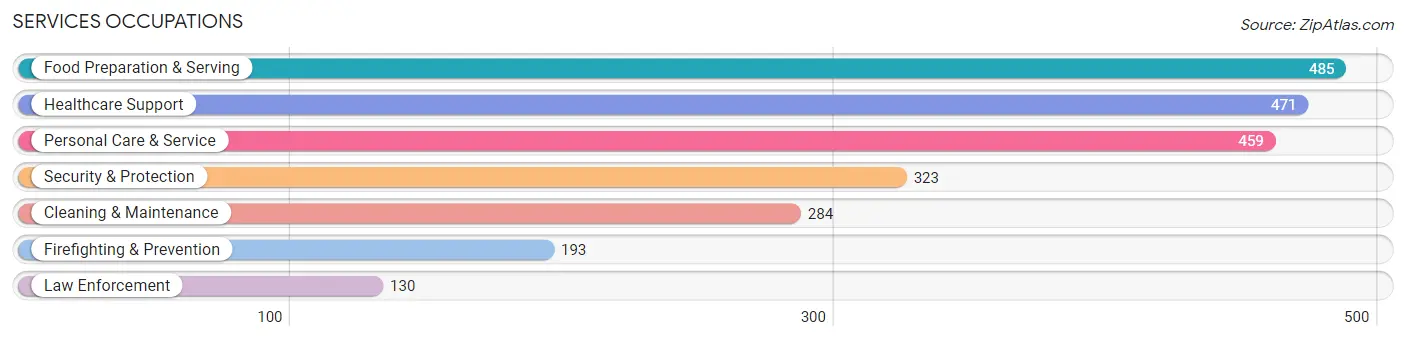
Services Occupations
The most common Services occupations in Fountain are Food Preparation & Serving (485 | 3.8%), Healthcare Support (471 | 3.7%), Personal Care & Service (459 | 3.6%), Security & Protection (323 | 2.5%), and Cleaning & Maintenance (284 | 2.2%).
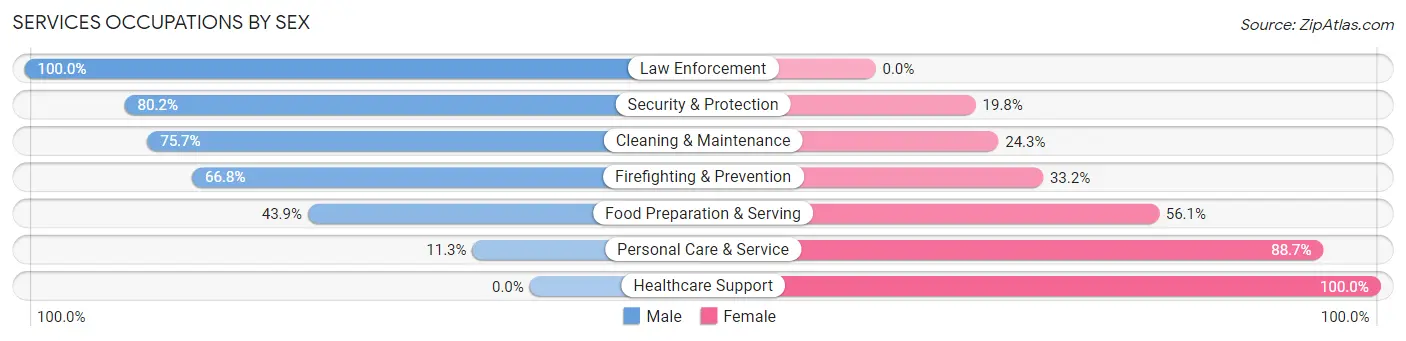
Services Occupations by Sex
Within the Services occupations in Fountain, the most male-oriented occupations are Law Enforcement (100.0%), Security & Protection (80.2%), and Cleaning & Maintenance (75.7%), while the most female-oriented occupations are Healthcare Support (100.0%), Personal Care & Service (88.7%), and Food Preparation & Serving (56.1%).
| Occupation | Male | Female |
| Healthcare Support | 0 (0.0%) | 471 (100.0%) |
| Security & Protection | 259 (80.2%) | 64 (19.8%) |
| Firefighting & Prevention | 129 (66.8%) | 64 (33.2%) |
| Law Enforcement | 130 (100.0%) | 0 (0.0%) |
| Food Preparation & Serving | 213 (43.9%) | 272 (56.1%) |
| Cleaning & Maintenance | 215 (75.7%) | 69 (24.3%) |
| Personal Care & Service | 52 (11.3%) | 407 (88.7%) |
| Total (Category) | 739 (36.5%) | 1,283 (63.4%) |
| Total (Overall) | 6,714 (52.7%) | 6,029 (47.3%) |
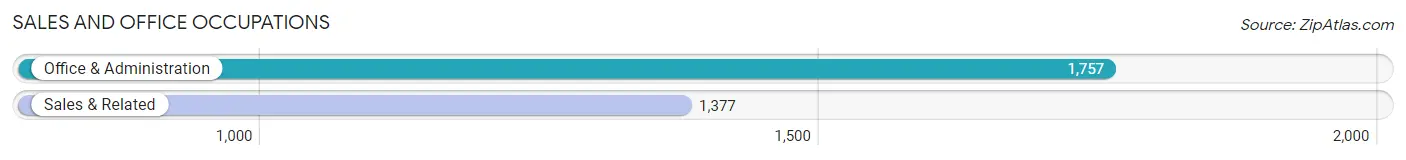
Sales and Office Occupations
The most common Sales and Office occupations in Fountain are Office & Administration (1,757 | 13.8%), and Sales & Related (1,377 | 10.8%).
Sales and Office Occupations by Sex
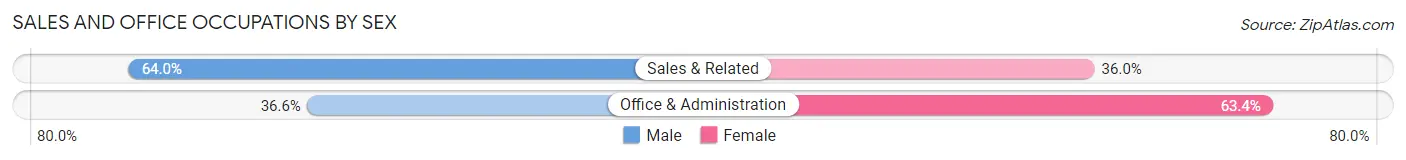
| Occupation | Male | Female |
| Sales & Related | 881 (64.0%) | 496 (36.0%) |
| Office & Administration | 643 (36.6%) | 1,114 (63.4%) |
| Total (Category) | 1,524 (48.6%) | 1,610 (51.4%) |
| Total (Overall) | 6,714 (52.7%) | 6,029 (47.3%) |
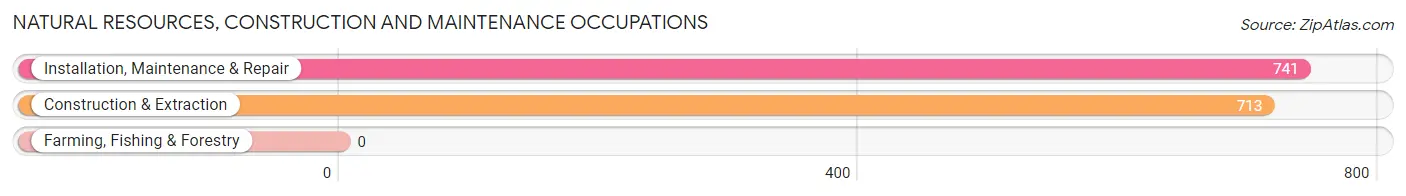
Natural Resources, Construction and Maintenance Occupations
The most common Natural Resources, Construction and Maintenance occupations in Fountain are Installation, Maintenance & Repair (741 | 5.8%), and Construction & Extraction (713 | 5.6%).
Natural Resources, Construction and Maintenance Occupations by Sex
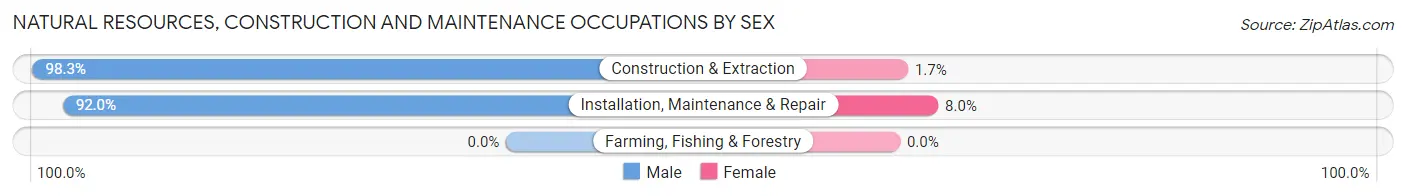
| Occupation | Male | Female |
| Farming, Fishing & Forestry | 0 (0.0%) | 0 (0.0%) |
| Construction & Extraction | 701 (98.3%) | 12 (1.7%) |
| Installation, Maintenance & Repair | 682 (92.0%) | 59 (8.0%) |
| Total (Category) | 1,383 (95.1%) | 71 (4.9%) |
| Total (Overall) | 6,714 (52.7%) | 6,029 (47.3%) |
Production, Transportation and Moving Occupations
The most common Production, Transportation and Moving occupations in Fountain are Transportation (692 | 5.4%), Production (423 | 3.3%), and Material Moving (360 | 2.8%).
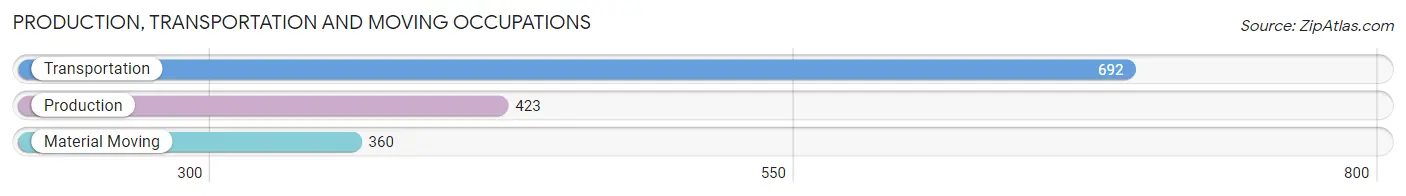
Production, Transportation and Moving Occupations by Sex
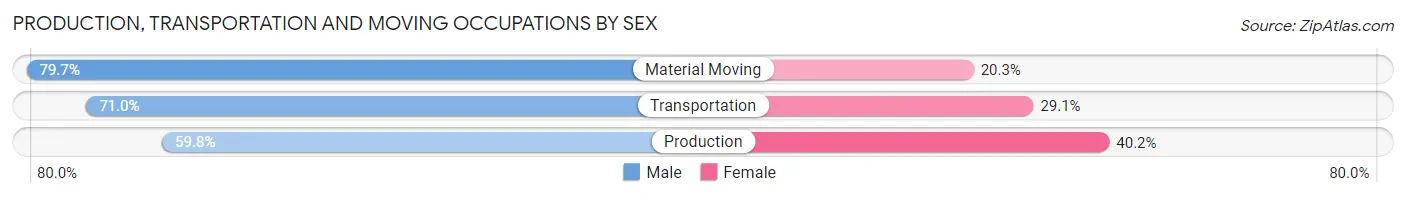
| Occupation | Male | Female |
| Production | 253 (59.8%) | 170 (40.2%) |
| Transportation | 491 (71.0%) | 201 (29.0%) |
| Material Moving | 287 (79.7%) | 73 (20.3%) |
| Total (Category) | 1,031 (69.9%) | 444 (30.1%) |
| Total (Overall) | 6,714 (52.7%) | 6,029 (47.3%) |
Employment Industries by Sex in Fountain
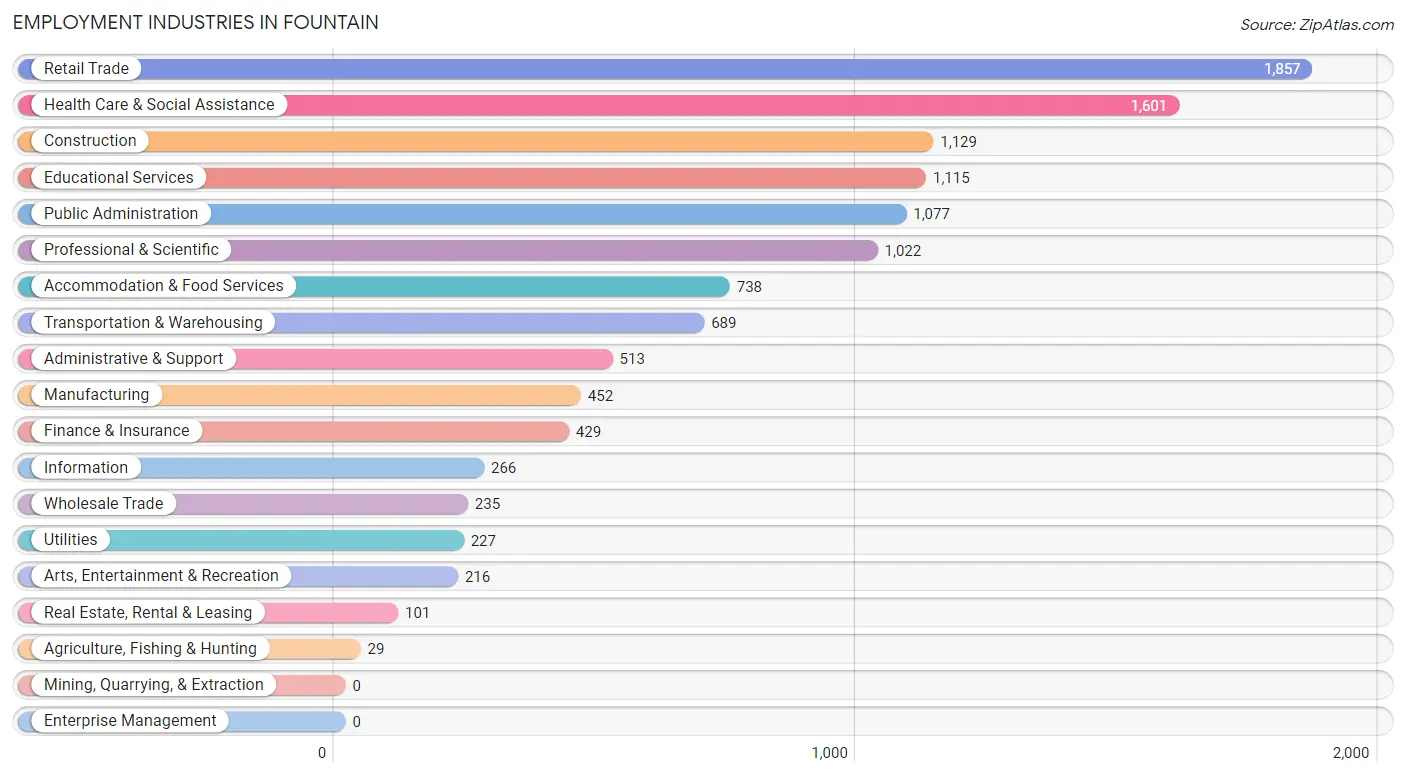
Employment Industries in Fountain
The major employment industries in Fountain include Retail Trade (1,857 | 14.6%), Health Care & Social Assistance (1,601 | 12.6%), Construction (1,129 | 8.9%), Educational Services (1,115 | 8.7%), and Public Administration (1,077 | 8.5%).
Employment Industries by Sex in Fountain
The Fountain industries that see more men than women are Agriculture, Fishing & Hunting (100.0%), Wholesale Trade (100.0%), and Construction (88.2%), whereas the industries that tend to have a higher number of women are Arts, Entertainment & Recreation (90.3%), Health Care & Social Assistance (81.5%), and Educational Services (77.8%).
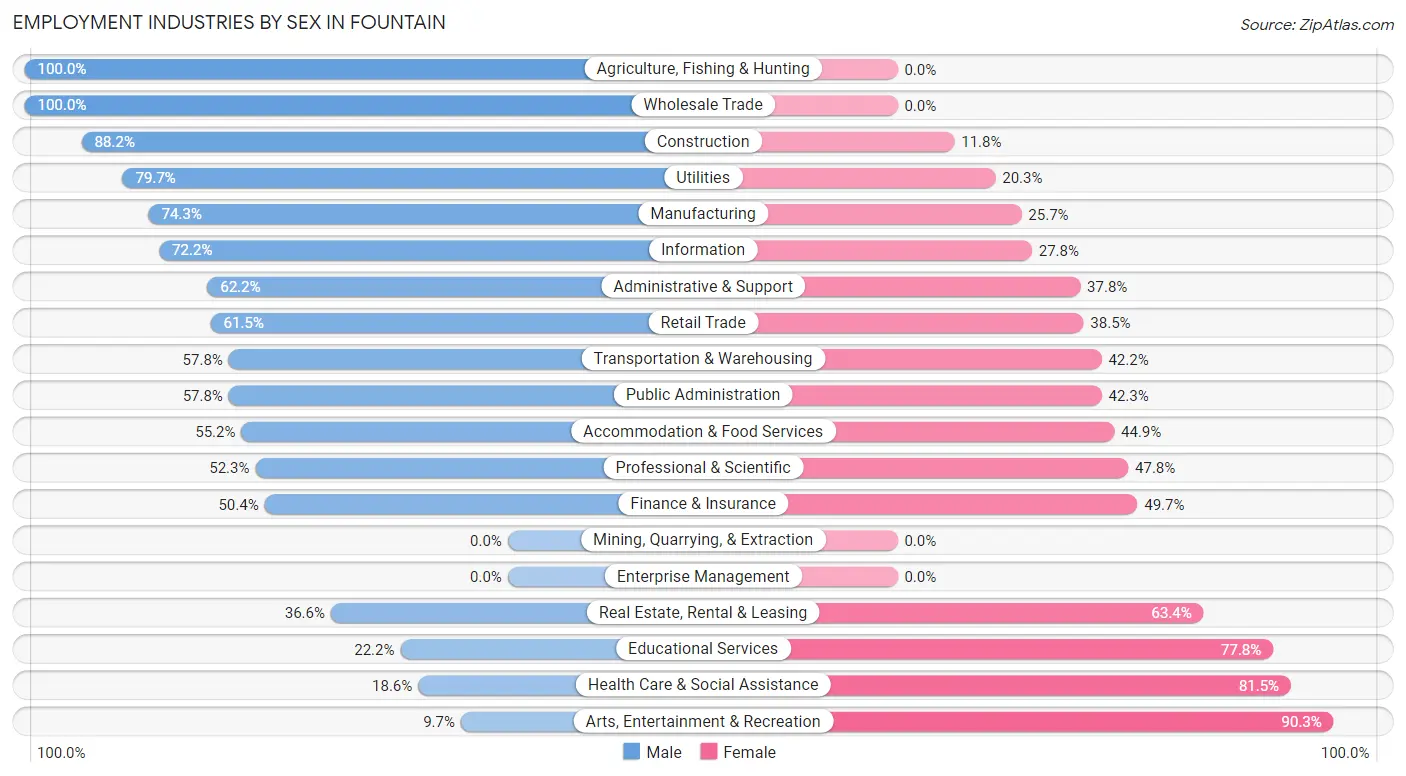
| Industry | Male | Female |
| Agriculture, Fishing & Hunting | 29 (100.0%) | 0 (0.0%) |
| Mining, Quarrying, & Extraction | 0 (0.0%) | 0 (0.0%) |
| Construction | 996 (88.2%) | 133 (11.8%) |
| Manufacturing | 336 (74.3%) | 116 (25.7%) |
| Wholesale Trade | 235 (100.0%) | 0 (0.0%) |
| Retail Trade | 1,142 (61.5%) | 715 (38.5%) |
| Transportation & Warehousing | 398 (57.8%) | 291 (42.2%) |
| Utilities | 181 (79.7%) | 46 (20.3%) |
| Information | 192 (72.2%) | 74 (27.8%) |
| Finance & Insurance | 216 (50.3%) | 213 (49.6%) |
| Real Estate, Rental & Leasing | 37 (36.6%) | 64 (63.4%) |
| Professional & Scientific | 534 (52.2%) | 488 (47.7%) |
| Enterprise Management | 0 (0.0%) | 0 (0.0%) |
| Administrative & Support | 319 (62.2%) | 194 (37.8%) |
| Educational Services | 248 (22.2%) | 867 (77.8%) |
| Health Care & Social Assistance | 297 (18.5%) | 1,304 (81.5%) |
| Arts, Entertainment & Recreation | 21 (9.7%) | 195 (90.3%) |
| Accommodation & Food Services | 407 (55.1%) | 331 (44.9%) |
| Public Administration | 622 (57.8%) | 455 (42.2%) |
| Total | 6,714 (52.7%) | 6,029 (47.3%) |
Education in Fountain
School Enrollment in Fountain
The most common levels of schooling among the 9,258 students in Fountain are middle school (2,404 | 26.0%), high school (1,950 | 21.1%), and college / undergraduate (1,934 | 20.9%).
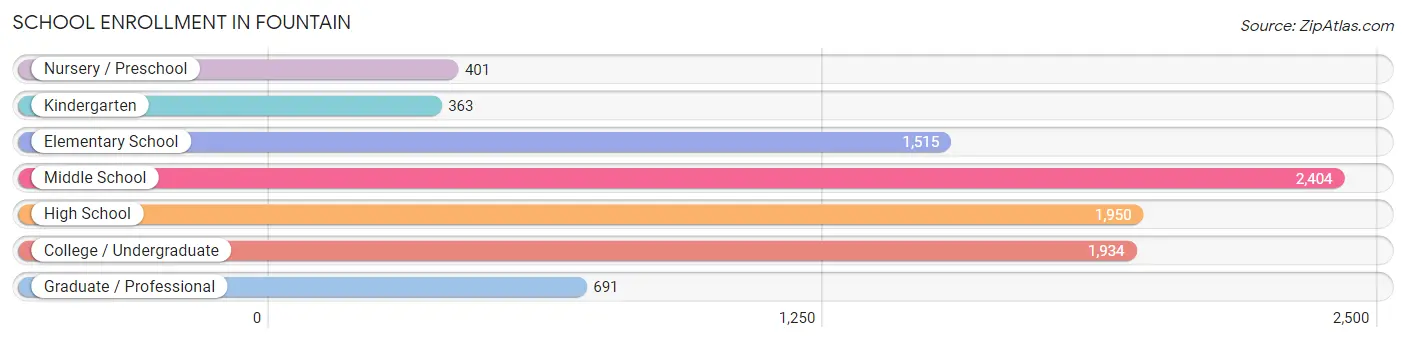
| School Level | # Students | % Students |
| Nursery / Preschool | 401 | 4.3% |
| Kindergarten | 363 | 3.9% |
| Elementary School | 1,515 | 16.4% |
| Middle School | 2,404 | 26.0% |
| High School | 1,950 | 21.1% |
| College / Undergraduate | 1,934 | 20.9% |
| Graduate / Professional | 691 | 7.5% |
| Total | 9,258 | 100.0% |
School Enrollment by Age by Funding Source in Fountain
Out of a total of 9,258 students who are enrolled in schools in Fountain, 1,629 (17.6%) attend a private institution, while the remaining 7,629 (82.4%) are enrolled in public schools. The age group of 35 years and over has the highest likelihood of being enrolled in private schools, with 281 (41.8% in the age bracket) enrolled. Conversely, the age group of 10 to 14 year olds has the lowest likelihood of being enrolled in a private school, with 2,592 (91.0% in the age bracket) attending a public institution.
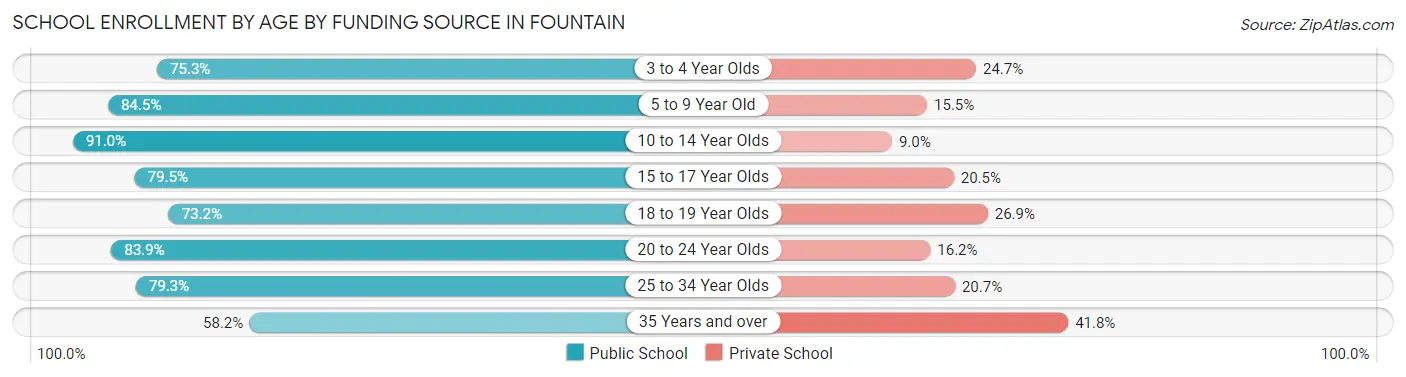
| Age Bracket | Public School | Private School |
| 3 to 4 Year Olds | 220 (75.3%) | 72 (24.7%) |
| 5 to 9 Year Old | 1,462 (84.5%) | 269 (15.5%) |
| 10 to 14 Year Olds | 2,592 (91.0%) | 256 (9.0%) |
| 15 to 17 Year Olds | 1,159 (79.5%) | 299 (20.5%) |
| 18 to 19 Year Olds | 267 (73.2%) | 98 (26.9%) |
| 20 to 24 Year Olds | 628 (83.9%) | 121 (16.2%) |
| 25 to 34 Year Olds | 906 (79.3%) | 237 (20.7%) |
| 35 Years and over | 391 (58.2%) | 281 (41.8%) |
| Total | 7,629 (82.4%) | 1,629 (17.6%) |
Educational Attainment by Field of Study in Fountain
Business (1,111 | 18.7%), education (617 | 10.4%), science & technology (579 | 9.8%), computers & mathematics (545 | 9.2%), and arts & humanities (502 | 8.5%) are the most common fields of study among 5,929 individuals in Fountain who have obtained a bachelor's degree or higher.
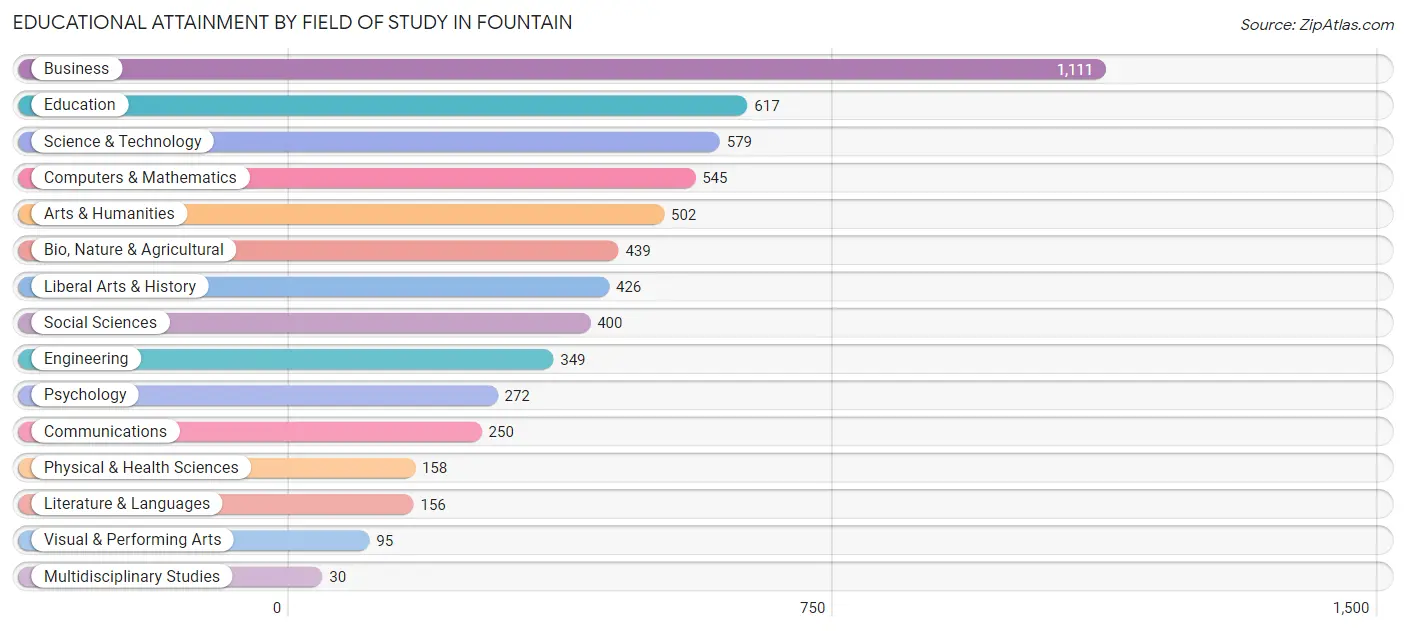
| Field of Study | # Graduates | % Graduates |
| Computers & Mathematics | 545 | 9.2% |
| Bio, Nature & Agricultural | 439 | 7.4% |
| Physical & Health Sciences | 158 | 2.7% |
| Psychology | 272 | 4.6% |
| Social Sciences | 400 | 6.8% |
| Engineering | 349 | 5.9% |
| Multidisciplinary Studies | 30 | 0.5% |
| Science & Technology | 579 | 9.8% |
| Business | 1,111 | 18.7% |
| Education | 617 | 10.4% |
| Literature & Languages | 156 | 2.6% |
| Liberal Arts & History | 426 | 7.2% |
| Visual & Performing Arts | 95 | 1.6% |
| Communications | 250 | 4.2% |
| Arts & Humanities | 502 | 8.5% |
| Total | 5,929 | 100.0% |
Transportation & Commute in Fountain
Vehicle Availability by Sex in Fountain
The most prevalent vehicle ownership categories in Fountain are males with 2 vehicles (3,964, accounting for 51.2%) and females with 2 vehicles (2,774, making up 65.6%).
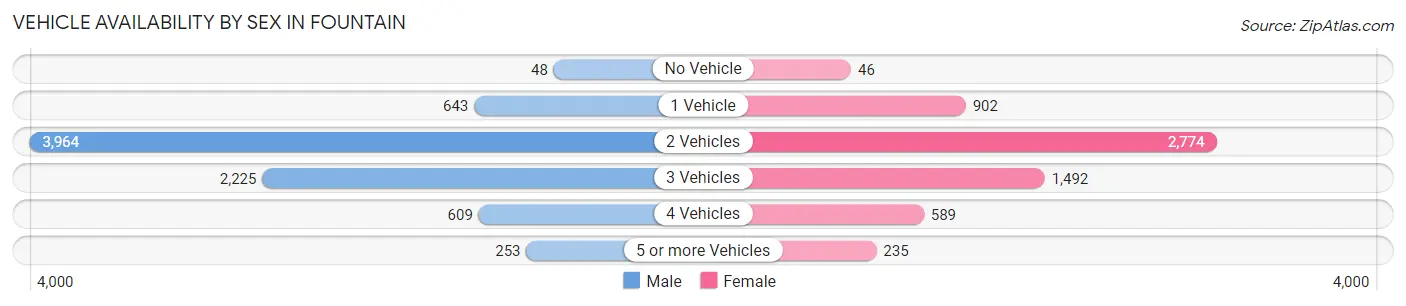
| Vehicles Available | Male | Female |
| No Vehicle | 48 (0.6%) | 46 (0.8%) |
| 1 Vehicle | 643 (8.3%) | 902 (14.9%) |
| 2 Vehicles | 3,964 (51.2%) | 2,774 (45.9%) |
| 3 Vehicles | 2,225 (28.7%) | 1,492 (24.7%) |
| 4 Vehicles | 609 (7.9%) | 589 (9.8%) |
| 5 or more Vehicles | 253 (3.3%) | 235 (3.9%) |
| Total | 7,742 (100.0%) | 6,038 (100.0%) |
Commute Time in Fountain
The most frequently occuring commute durations in Fountain are 20 to 24 minutes (2,837 commuters, 21.8%), 30 to 34 minutes (2,812 commuters, 21.6%), and 15 to 19 minutes (2,575 commuters, 19.8%).
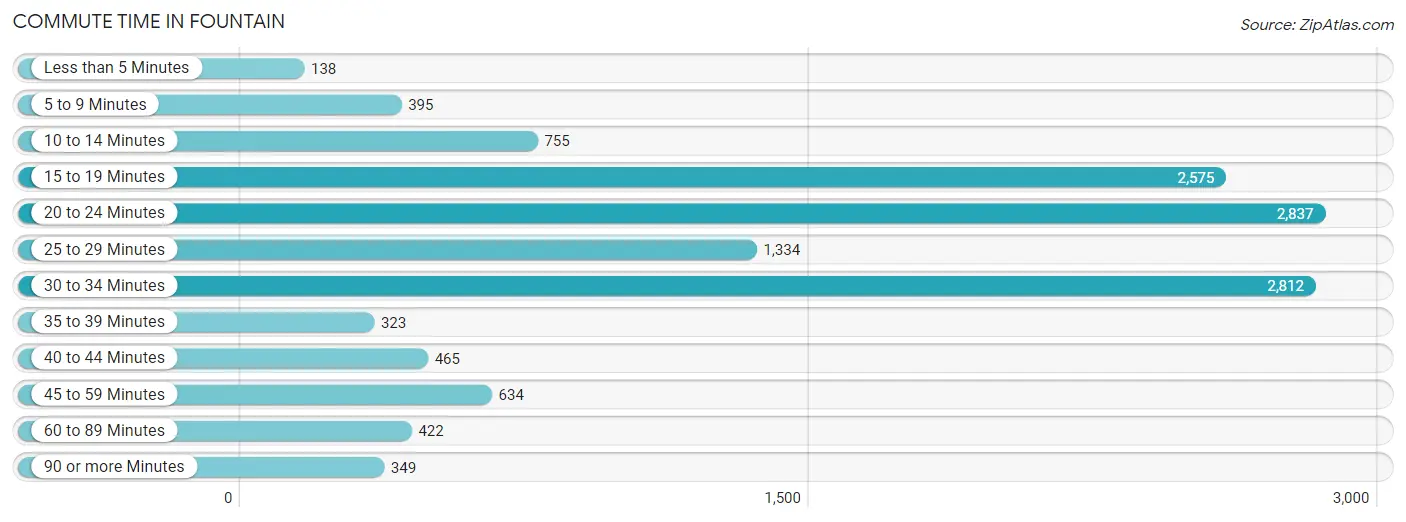
| Commute Time | # Commuters | % Commuters |
| Less than 5 Minutes | 138 | 1.1% |
| 5 to 9 Minutes | 395 | 3.0% |
| 10 to 14 Minutes | 755 | 5.8% |
| 15 to 19 Minutes | 2,575 | 19.8% |
| 20 to 24 Minutes | 2,837 | 21.8% |
| 25 to 29 Minutes | 1,334 | 10.2% |
| 30 to 34 Minutes | 2,812 | 21.6% |
| 35 to 39 Minutes | 323 | 2.5% |
| 40 to 44 Minutes | 465 | 3.6% |
| 45 to 59 Minutes | 634 | 4.9% |
| 60 to 89 Minutes | 422 | 3.2% |
| 90 or more Minutes | 349 | 2.7% |
Commute Time by Sex in Fountain
The most common commute times in Fountain are 20 to 24 minutes (1,580 commuters, 21.2%) for males and 30 to 34 minutes (1,523 commuters, 27.3%) for females.
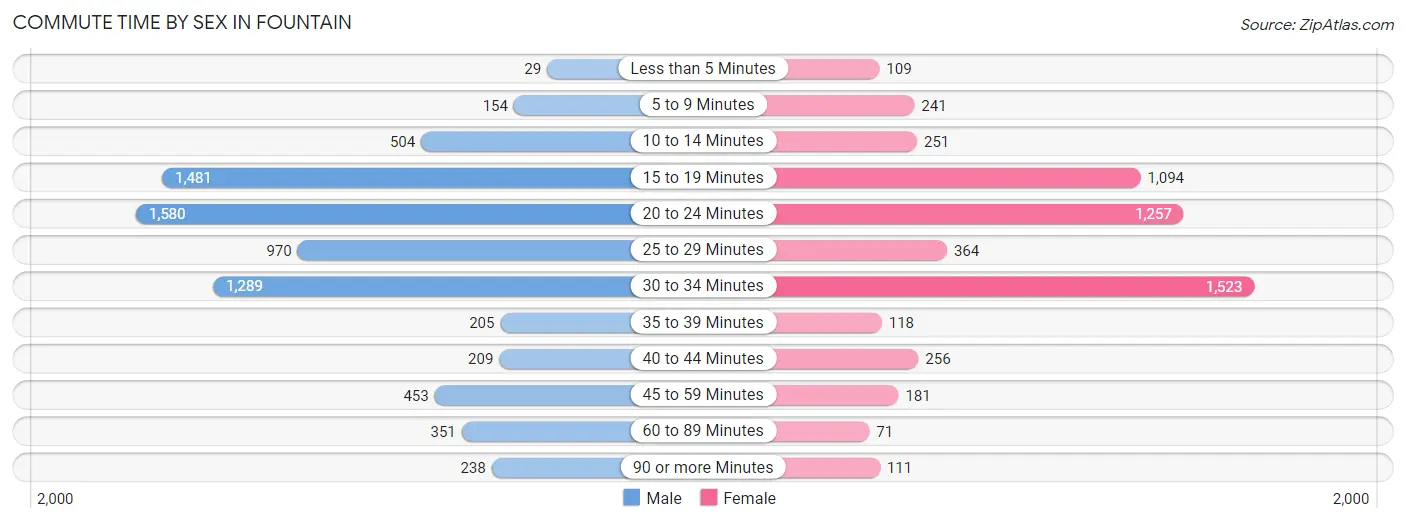
| Commute Time | Male | Female |
| Less than 5 Minutes | 29 (0.4%) | 109 (1.9%) |
| 5 to 9 Minutes | 154 (2.1%) | 241 (4.3%) |
| 10 to 14 Minutes | 504 (6.8%) | 251 (4.5%) |
| 15 to 19 Minutes | 1,481 (19.8%) | 1,094 (19.6%) |
| 20 to 24 Minutes | 1,580 (21.2%) | 1,257 (22.5%) |
| 25 to 29 Minutes | 970 (13.0%) | 364 (6.5%) |
| 30 to 34 Minutes | 1,289 (17.3%) | 1,523 (27.3%) |
| 35 to 39 Minutes | 205 (2.8%) | 118 (2.1%) |
| 40 to 44 Minutes | 209 (2.8%) | 256 (4.6%) |
| 45 to 59 Minutes | 453 (6.1%) | 181 (3.3%) |
| 60 to 89 Minutes | 351 (4.7%) | 71 (1.3%) |
| 90 or more Minutes | 238 (3.2%) | 111 (2.0%) |
Time of Departure to Work by Sex in Fountain
The most frequent times of departure to work in Fountain are 7:00 AM to 7:29 AM (1,055, 14.1%) for males and 7:00 AM to 7:29 AM (1,116, 20.0%) for females.
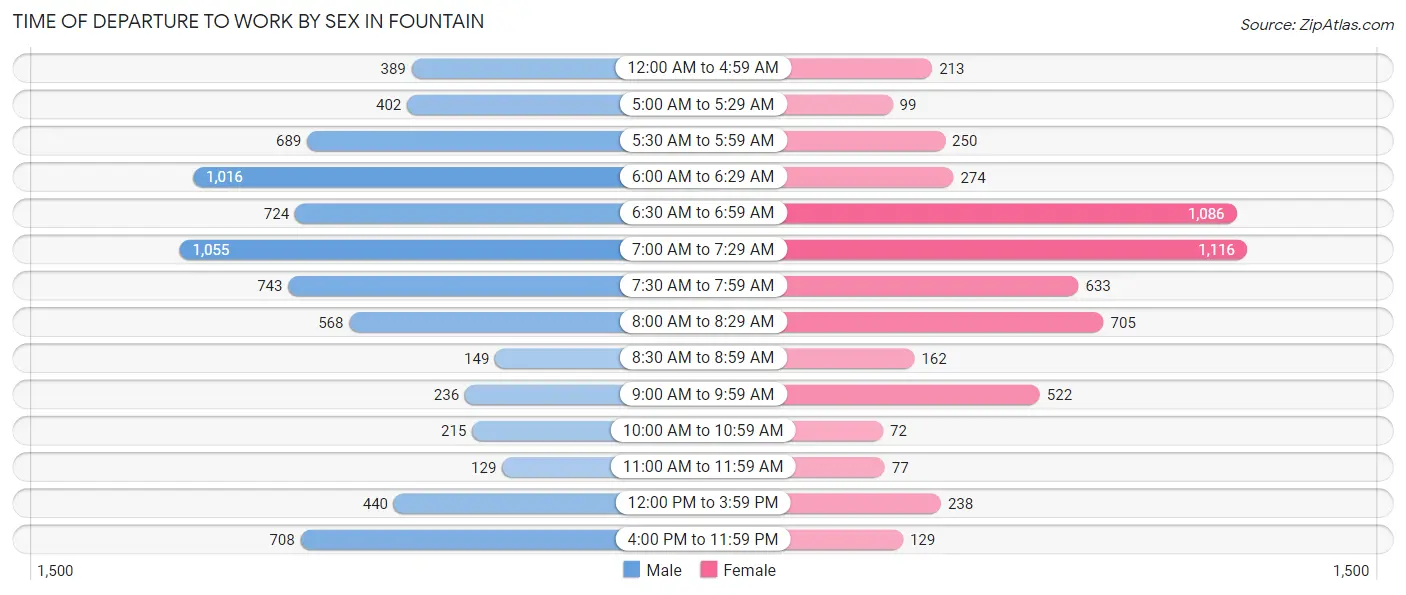
| Time of Departure | Male | Female |
| 12:00 AM to 4:59 AM | 389 (5.2%) | 213 (3.8%) |
| 5:00 AM to 5:29 AM | 402 (5.4%) | 99 (1.8%) |
| 5:30 AM to 5:59 AM | 689 (9.2%) | 250 (4.5%) |
| 6:00 AM to 6:29 AM | 1,016 (13.6%) | 274 (4.9%) |
| 6:30 AM to 6:59 AM | 724 (9.7%) | 1,086 (19.5%) |
| 7:00 AM to 7:29 AM | 1,055 (14.1%) | 1,116 (20.0%) |
| 7:30 AM to 7:59 AM | 743 (10.0%) | 633 (11.4%) |
| 8:00 AM to 8:29 AM | 568 (7.6%) | 705 (12.6%) |
| 8:30 AM to 8:59 AM | 149 (2.0%) | 162 (2.9%) |
| 9:00 AM to 9:59 AM | 236 (3.2%) | 522 (9.4%) |
| 10:00 AM to 10:59 AM | 215 (2.9%) | 72 (1.3%) |
| 11:00 AM to 11:59 AM | 129 (1.7%) | 77 (1.4%) |
| 12:00 PM to 3:59 PM | 440 (5.9%) | 238 (4.3%) |
| 4:00 PM to 11:59 PM | 708 (9.5%) | 129 (2.3%) |
| Total | 7,463 (100.0%) | 5,576 (100.0%) |
Housing Occupancy in Fountain
Occupancy by Ownership in Fountain
Of the total 10,203 dwellings in Fountain, owner-occupied units account for 7,358 (72.1%), while renter-occupied units make up 2,845 (27.9%).
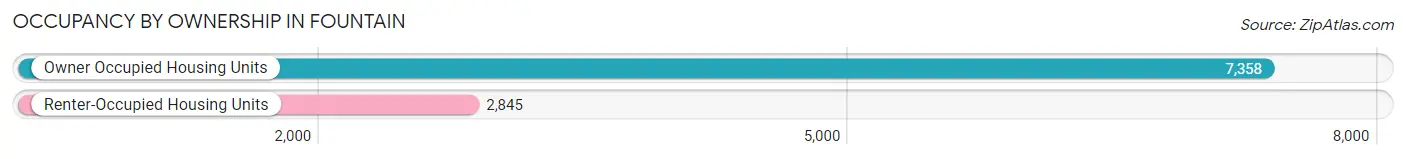
| Occupancy | # Housing Units | % Housing Units |
| Owner Occupied Housing Units | 7,358 | 72.1% |
| Renter-Occupied Housing Units | 2,845 | 27.9% |
| Total Occupied Housing Units | 10,203 | 100.0% |
Occupancy by Household Size in Fountain
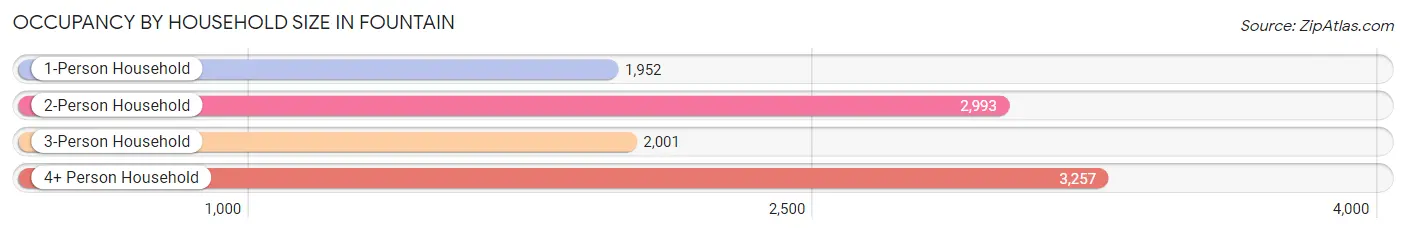
| Household Size | # Housing Units | % Housing Units |
| 1-Person Household | 1,952 | 19.1% |
| 2-Person Household | 2,993 | 29.3% |
| 3-Person Household | 2,001 | 19.6% |
| 4+ Person Household | 3,257 | 31.9% |
| Total Housing Units | 10,203 | 100.0% |
Occupancy by Ownership by Household Size in Fountain
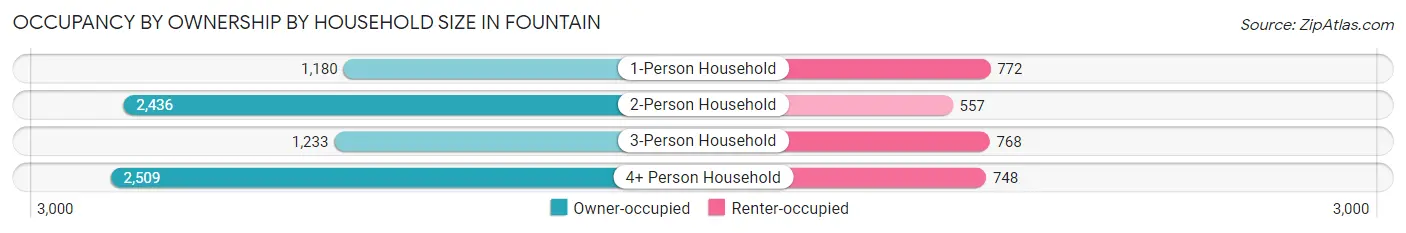
| Household Size | Owner-occupied | Renter-occupied |
| 1-Person Household | 1,180 (60.5%) | 772 (39.6%) |
| 2-Person Household | 2,436 (81.4%) | 557 (18.6%) |
| 3-Person Household | 1,233 (61.6%) | 768 (38.4%) |
| 4+ Person Household | 2,509 (77.0%) | 748 (23.0%) |
| Total Housing Units | 7,358 (72.1%) | 2,845 (27.9%) |
Occupancy by Educational Attainment in Fountain
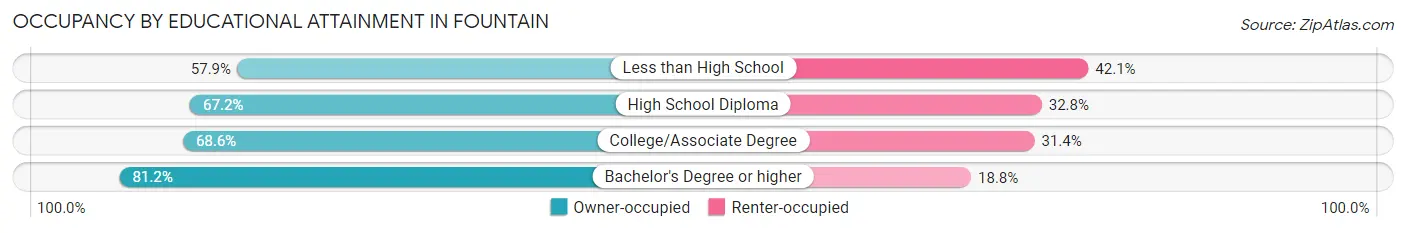
| Household Size | Owner-occupied | Renter-occupied |
| Less than High School | 278 (57.9%) | 202 (42.1%) |
| High School Diploma | 1,522 (67.2%) | 744 (32.8%) |
| College/Associate Degree | 2,703 (68.6%) | 1,237 (31.4%) |
| Bachelor's Degree or higher | 2,855 (81.2%) | 662 (18.8%) |
Occupancy by Age of Householder in Fountain
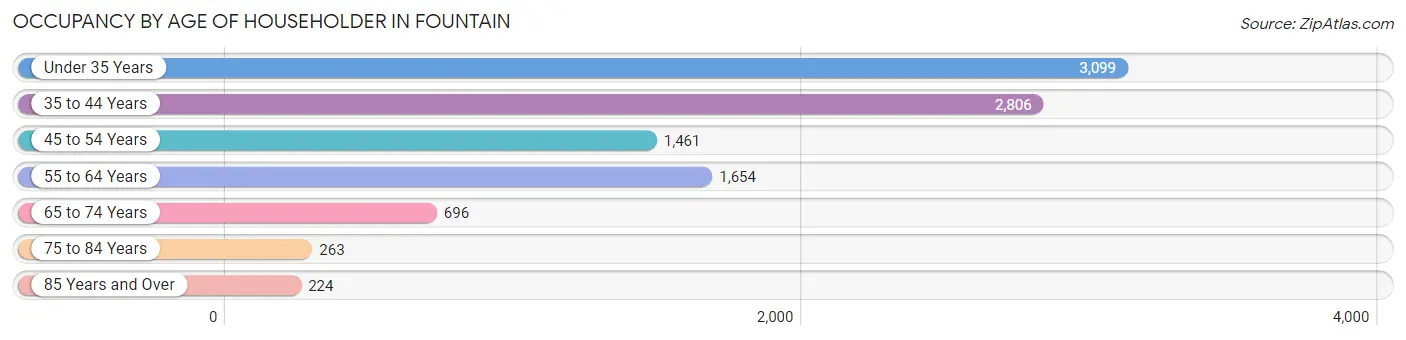
| Age Bracket | # Households | % Households |
| Under 35 Years | 3,099 | 30.4% |
| 35 to 44 Years | 2,806 | 27.5% |
| 45 to 54 Years | 1,461 | 14.3% |
| 55 to 64 Years | 1,654 | 16.2% |
| 65 to 74 Years | 696 | 6.8% |
| 75 to 84 Years | 263 | 2.6% |
| 85 Years and Over | 224 | 2.2% |
| Total | 10,203 | 100.0% |
Housing Finances in Fountain
Median Income by Occupancy in Fountain
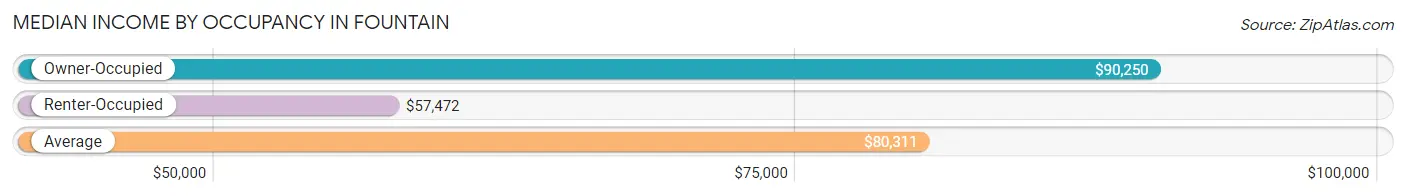
| Occupancy Type | # Households | Median Income |
| Owner-Occupied | 7,358 (72.1%) | $90,250 |
| Renter-Occupied | 2,845 (27.9%) | $57,472 |
| Average | 10,203 (100.0%) | $80,311 |
Occupancy by Householder Income Bracket in Fountain
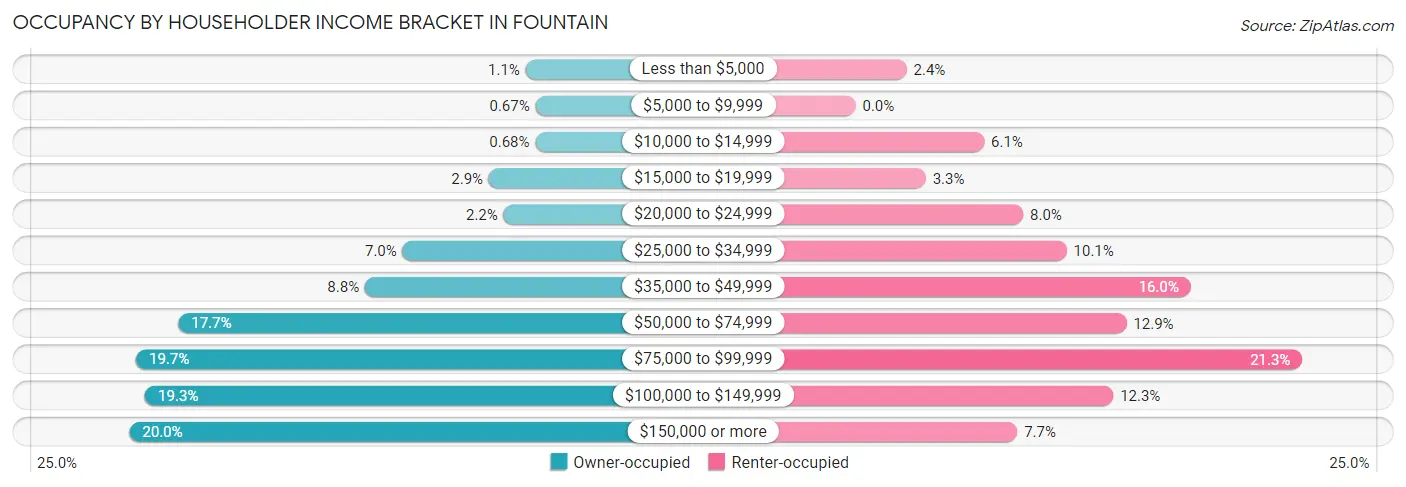
| Income Bracket | Owner-occupied | Renter-occupied |
| Less than $5,000 | 84 (1.1%) | 69 (2.4%) |
| $5,000 to $9,999 | 49 (0.7%) | 0 (0.0%) |
| $10,000 to $14,999 | 50 (0.7%) | 174 (6.1%) |
| $15,000 to $19,999 | 213 (2.9%) | 95 (3.3%) |
| $20,000 to $24,999 | 161 (2.2%) | 227 (8.0%) |
| $25,000 to $34,999 | 515 (7.0%) | 286 (10.1%) |
| $35,000 to $49,999 | 647 (8.8%) | 454 (16.0%) |
| $50,000 to $74,999 | 1,301 (17.7%) | 367 (12.9%) |
| $75,000 to $99,999 | 1,449 (19.7%) | 605 (21.3%) |
| $100,000 to $149,999 | 1,417 (19.3%) | 349 (12.3%) |
| $150,000 or more | 1,472 (20.0%) | 219 (7.7%) |
| Total | 7,358 (100.0%) | 2,845 (100.0%) |
Monthly Housing Cost Tiers in Fountain
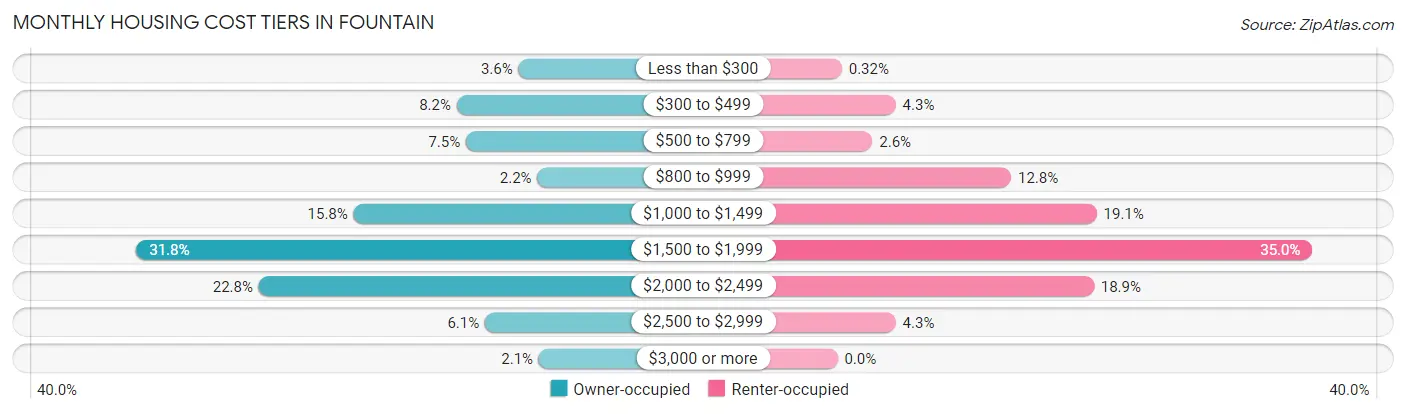
| Monthly Cost | Owner-occupied | Renter-occupied |
| Less than $300 | 266 (3.6%) | 9 (0.3%) |
| $300 to $499 | 601 (8.2%) | 122 (4.3%) |
| $500 to $799 | 551 (7.5%) | 73 (2.6%) |
| $800 to $999 | 164 (2.2%) | 364 (12.8%) |
| $1,000 to $1,499 | 1,160 (15.8%) | 543 (19.1%) |
| $1,500 to $1,999 | 2,338 (31.8%) | 995 (35.0%) |
| $2,000 to $2,499 | 1,674 (22.8%) | 537 (18.9%) |
| $2,500 to $2,999 | 448 (6.1%) | 122 (4.3%) |
| $3,000 or more | 156 (2.1%) | 0 (0.0%) |
| Total | 7,358 (100.0%) | 2,845 (100.0%) |
Physical Housing Characteristics in Fountain
Housing Structures in Fountain
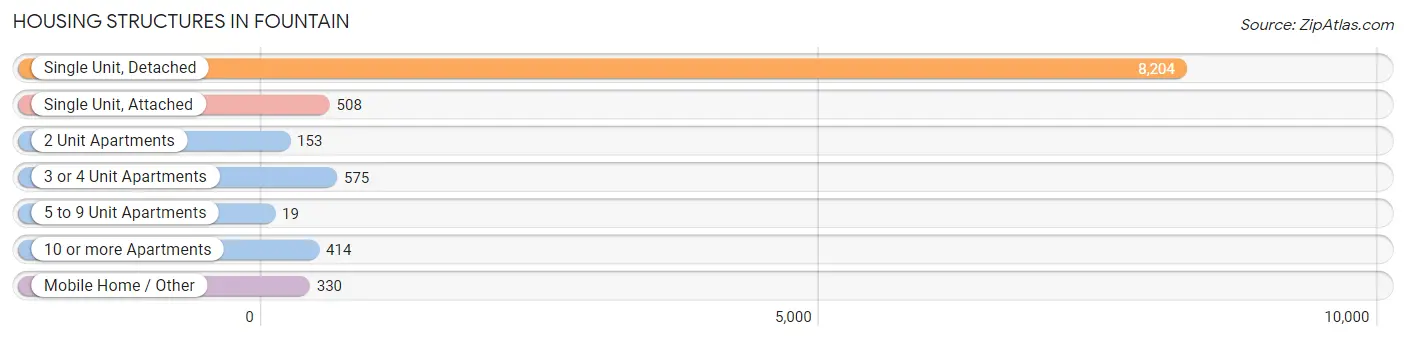
| Structure Type | # Housing Units | % Housing Units |
| Single Unit, Detached | 8,204 | 80.4% |
| Single Unit, Attached | 508 | 5.0% |
| 2 Unit Apartments | 153 | 1.5% |
| 3 or 4 Unit Apartments | 575 | 5.6% |
| 5 to 9 Unit Apartments | 19 | 0.2% |
| 10 or more Apartments | 414 | 4.1% |
| Mobile Home / Other | 330 | 3.2% |
| Total | 10,203 | 100.0% |
Housing Structures by Occupancy in Fountain
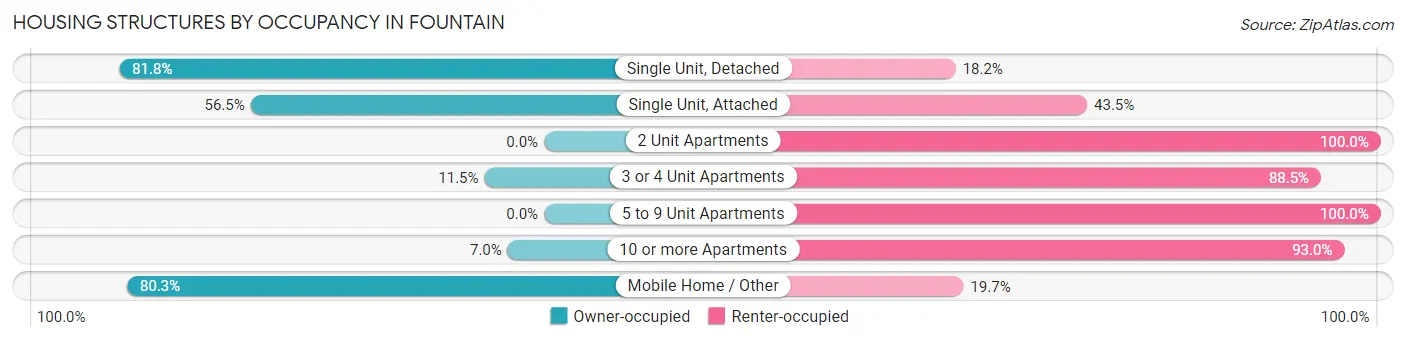
| Structure Type | Owner-occupied | Renter-occupied |
| Single Unit, Detached | 6,711 (81.8%) | 1,493 (18.2%) |
| Single Unit, Attached | 287 (56.5%) | 221 (43.5%) |
| 2 Unit Apartments | 0 (0.0%) | 153 (100.0%) |
| 3 or 4 Unit Apartments | 66 (11.5%) | 509 (88.5%) |
| 5 to 9 Unit Apartments | 0 (0.0%) | 19 (100.0%) |
| 10 or more Apartments | 29 (7.0%) | 385 (93.0%) |
| Mobile Home / Other | 265 (80.3%) | 65 (19.7%) |
| Total | 7,358 (72.1%) | 2,845 (27.9%) |
Housing Structures by Number of Rooms in Fountain
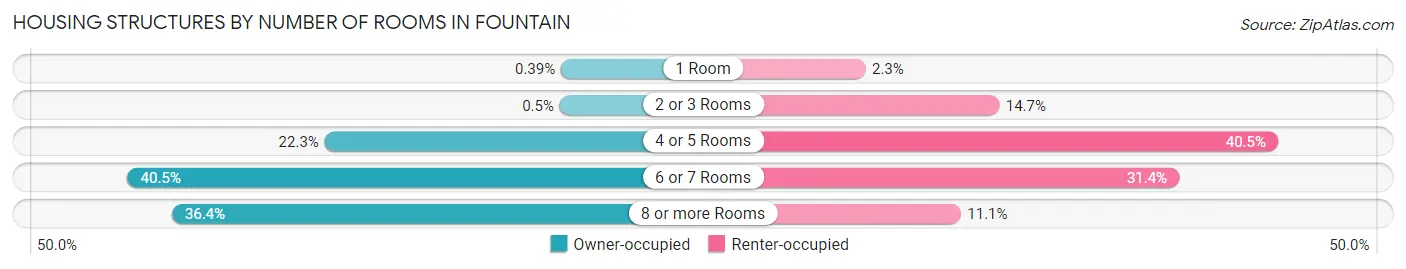
| Number of Rooms | Owner-occupied | Renter-occupied |
| 1 Room | 29 (0.4%) | 66 (2.3%) |
| 2 or 3 Rooms | 37 (0.5%) | 418 (14.7%) |
| 4 or 5 Rooms | 1,637 (22.3%) | 1,152 (40.5%) |
| 6 or 7 Rooms | 2,978 (40.5%) | 892 (31.4%) |
| 8 or more Rooms | 2,677 (36.4%) | 317 (11.1%) |
| Total | 7,358 (100.0%) | 2,845 (100.0%) |
Housing Structure by Heating Type in Fountain
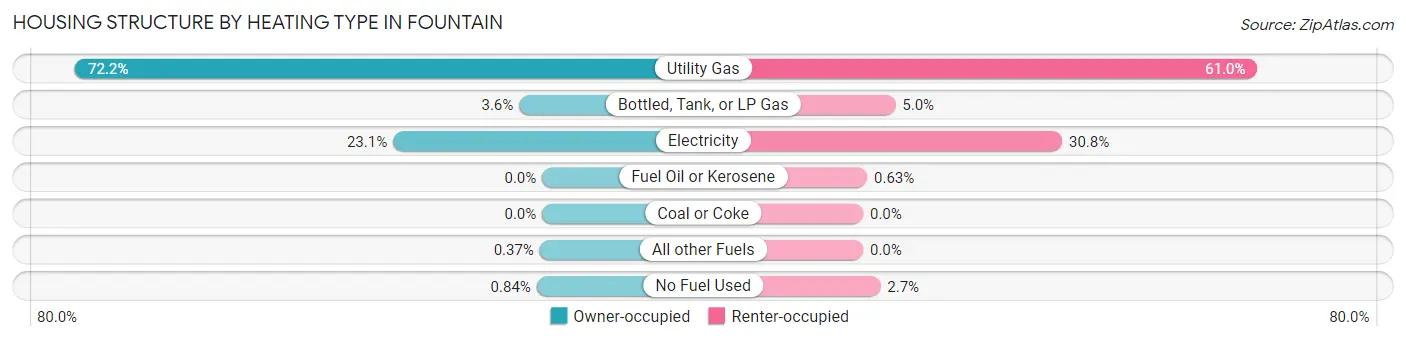
| Heating Type | Owner-occupied | Renter-occupied |
| Utility Gas | 5,312 (72.2%) | 1,734 (61.0%) |
| Bottled, Tank, or LP Gas | 261 (3.5%) | 142 (5.0%) |
| Electricity | 1,696 (23.1%) | 875 (30.8%) |
| Fuel Oil or Kerosene | 0 (0.0%) | 18 (0.6%) |
| Coal or Coke | 0 (0.0%) | 0 (0.0%) |
| All other Fuels | 27 (0.4%) | 0 (0.0%) |
| No Fuel Used | 62 (0.8%) | 76 (2.7%) |
| Total | 7,358 (100.0%) | 2,845 (100.0%) |
Household Vehicle Usage in Fountain
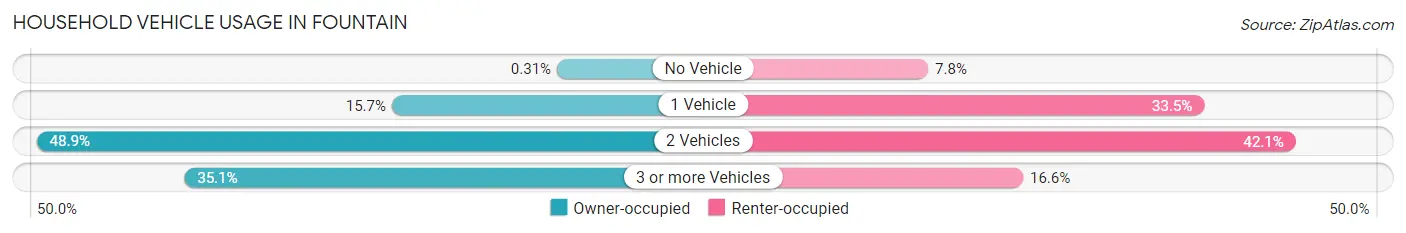
| Vehicles per Household | Owner-occupied | Renter-occupied |
| No Vehicle | 23 (0.3%) | 221 (7.8%) |
| 1 Vehicle | 1,157 (15.7%) | 954 (33.5%) |
| 2 Vehicles | 3,596 (48.9%) | 1,197 (42.1%) |
| 3 or more Vehicles | 2,582 (35.1%) | 473 (16.6%) |
| Total | 7,358 (100.0%) | 2,845 (100.0%) |
Real Estate & Mortgages in Fountain
Real Estate and Mortgage Overview in Fountain
| Characteristic | Without Mortgage | With Mortgage |
| Housing Units | 1,537 | 5,821 |
| Median Property Value | $324,100 | $339,700 |
| Median Household Income | $54,830 | $1,283 |
| Monthly Housing Costs | $480 | $144 |
| Real Estate Taxes | $1,186 | $308 |
Property Value by Mortgage Status in Fountain
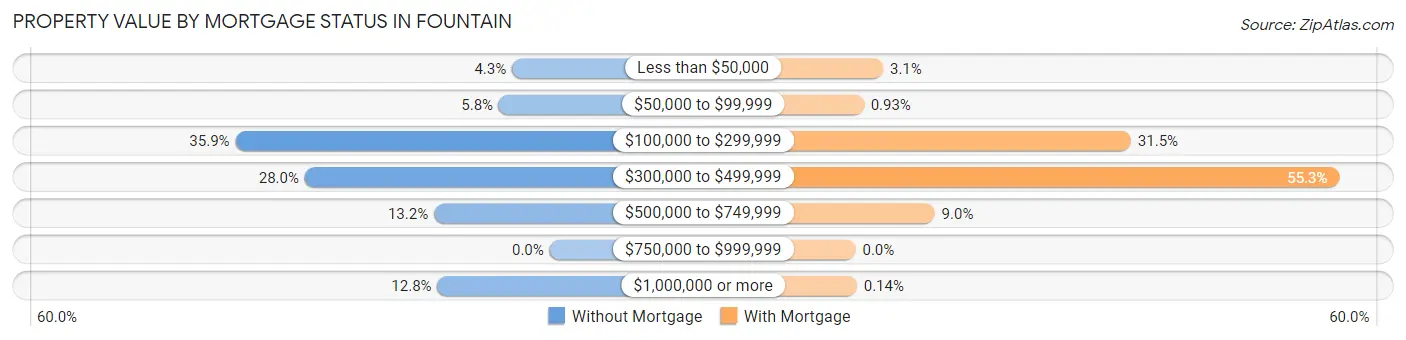
| Property Value | Without Mortgage | With Mortgage |
| Less than $50,000 | 66 (4.3%) | 183 (3.1%) |
| $50,000 to $99,999 | 89 (5.8%) | 54 (0.9%) |
| $100,000 to $299,999 | 552 (35.9%) | 1,832 (31.5%) |
| $300,000 to $499,999 | 430 (28.0%) | 3,218 (55.3%) |
| $500,000 to $749,999 | 203 (13.2%) | 526 (9.0%) |
| $750,000 to $999,999 | 0 (0.0%) | 0 (0.0%) |
| $1,000,000 or more | 197 (12.8%) | 8 (0.1%) |
| Total | 1,537 (100.0%) | 5,821 (100.0%) |
Household Income by Mortgage Status in Fountain
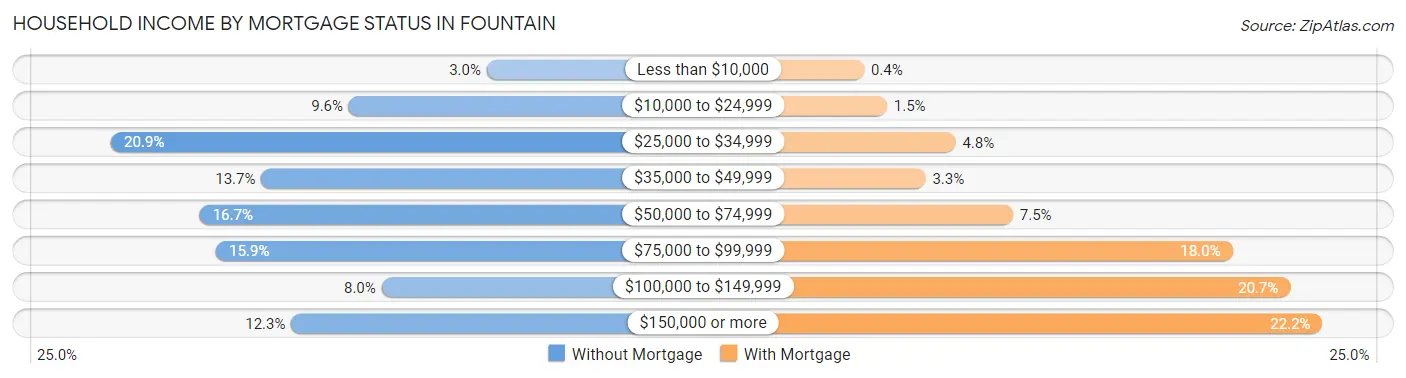
| Household Income | Without Mortgage | With Mortgage |
| Less than $10,000 | 46 (3.0%) | 23 (0.4%) |
| $10,000 to $24,999 | 147 (9.6%) | 87 (1.5%) |
| $25,000 to $34,999 | 321 (20.9%) | 277 (4.8%) |
| $35,000 to $49,999 | 211 (13.7%) | 194 (3.3%) |
| $50,000 to $74,999 | 256 (16.7%) | 436 (7.5%) |
| $75,000 to $99,999 | 244 (15.9%) | 1,045 (17.9%) |
| $100,000 to $149,999 | 123 (8.0%) | 1,205 (20.7%) |
| $150,000 or more | 189 (12.3%) | 1,294 (22.2%) |
| Total | 1,537 (100.0%) | 5,821 (100.0%) |
Property Value to Household Income Ratio in Fountain
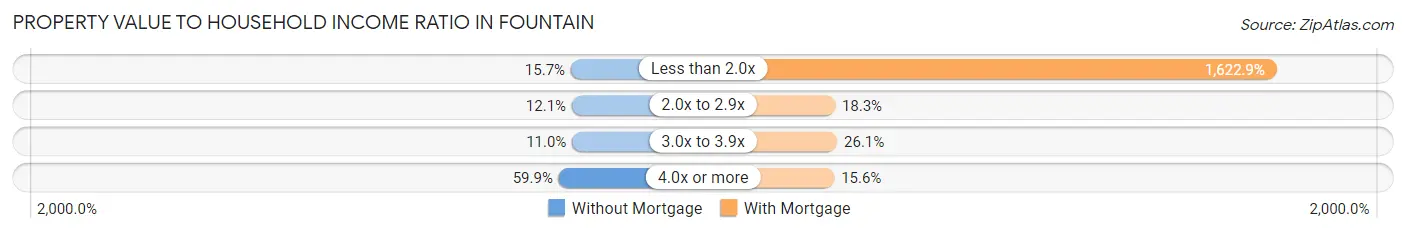
| Value-to-Income Ratio | Without Mortgage | With Mortgage |
| Less than 2.0x | 241 (15.7%) | 94,470 (1,622.9%) |
| 2.0x to 2.9x | 186 (12.1%) | 1,063 (18.3%) |
| 3.0x to 3.9x | 169 (11.0%) | 1,521 (26.1%) |
| 4.0x or more | 920 (59.9%) | 905 (15.5%) |
| Total | 1,537 (100.0%) | 5,821 (100.0%) |
Real Estate Taxes by Mortgage Status in Fountain
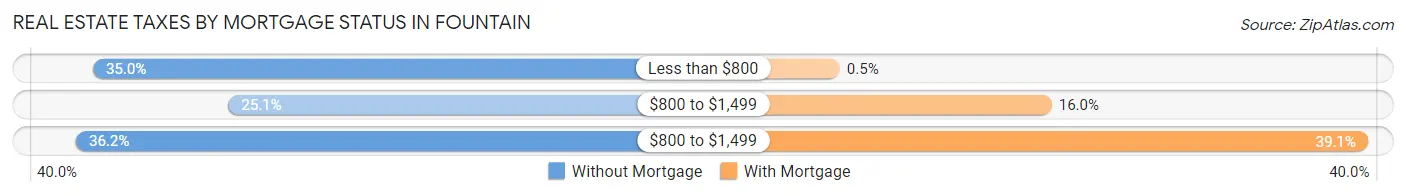
| Property Taxes | Without Mortgage | With Mortgage |
| Less than $800 | 538 (35.0%) | 29 (0.5%) |
| $800 to $1,499 | 386 (25.1%) | 930 (16.0%) |
| $800 to $1,499 | 557 (36.2%) | 2,274 (39.1%) |
| Total | 1,537 (100.0%) | 5,821 (100.0%) |
Health & Disability in Fountain
Health Insurance Coverage by Age in Fountain
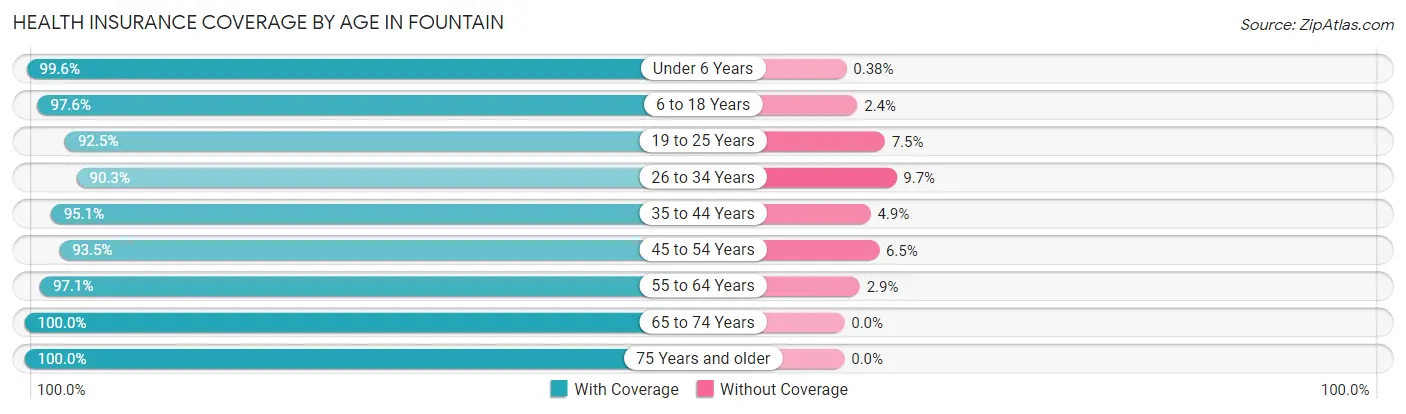
| Age Bracket | With Coverage | Without Coverage |
| Under 6 Years | 2,628 (99.6%) | 10 (0.4%) |
| 6 to 18 Years | 6,085 (97.6%) | 151 (2.4%) |
| 19 to 25 Years | 2,944 (92.5%) | 240 (7.5%) |
| 26 to 34 Years | 3,483 (90.3%) | 374 (9.7%) |
| 35 to 44 Years | 4,210 (95.1%) | 216 (4.9%) |
| 45 to 54 Years | 2,912 (93.5%) | 201 (6.5%) |
| 55 to 64 Years | 2,530 (97.1%) | 75 (2.9%) |
| 65 to 74 Years | 1,369 (100.0%) | 0 (0.0%) |
| 75 Years and older | 669 (100.0%) | 0 (0.0%) |
| Total | 26,830 (95.5%) | 1,267 (4.5%) |
Health Insurance Coverage by Citizenship Status in Fountain
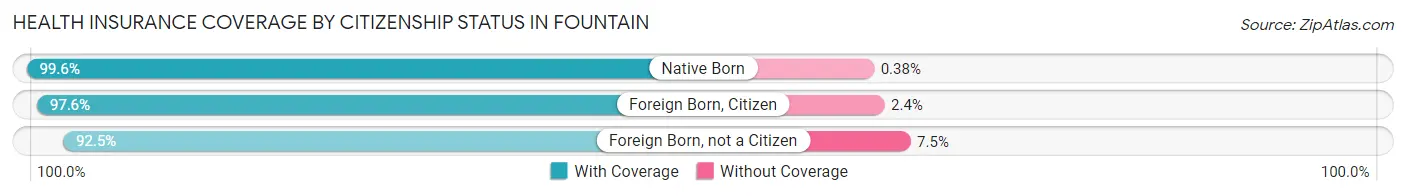
| Citizenship Status | With Coverage | Without Coverage |
| Native Born | 2,628 (99.6%) | 10 (0.4%) |
| Foreign Born, Citizen | 6,085 (97.6%) | 151 (2.4%) |
| Foreign Born, not a Citizen | 2,944 (92.5%) | 240 (7.5%) |
Health Insurance Coverage by Household Income in Fountain
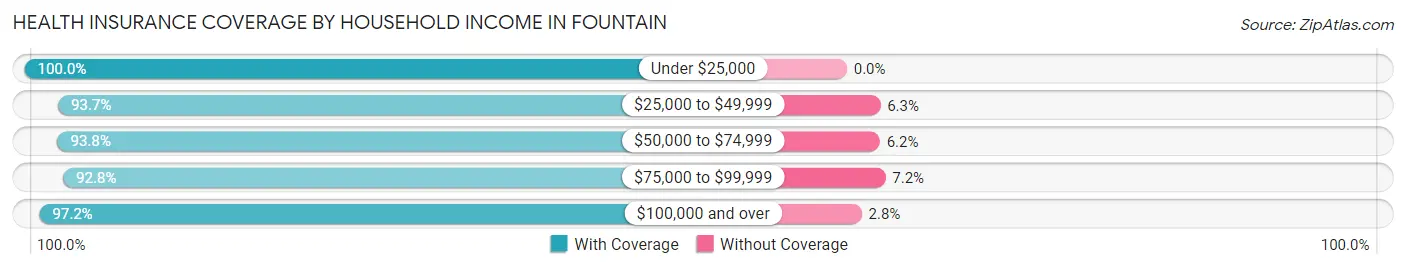
| Household Income | With Coverage | Without Coverage |
| Under $25,000 | 1,866 (100.0%) | 0 (0.0%) |
| $25,000 to $49,999 | 3,997 (93.7%) | 267 (6.3%) |
| $50,000 to $74,999 | 4,165 (93.8%) | 274 (6.2%) |
| $75,000 to $99,999 | 4,996 (92.8%) | 389 (7.2%) |
| $100,000 and over | 11,803 (97.2%) | 337 (2.8%) |
Public vs Private Health Insurance Coverage by Age in Fountain
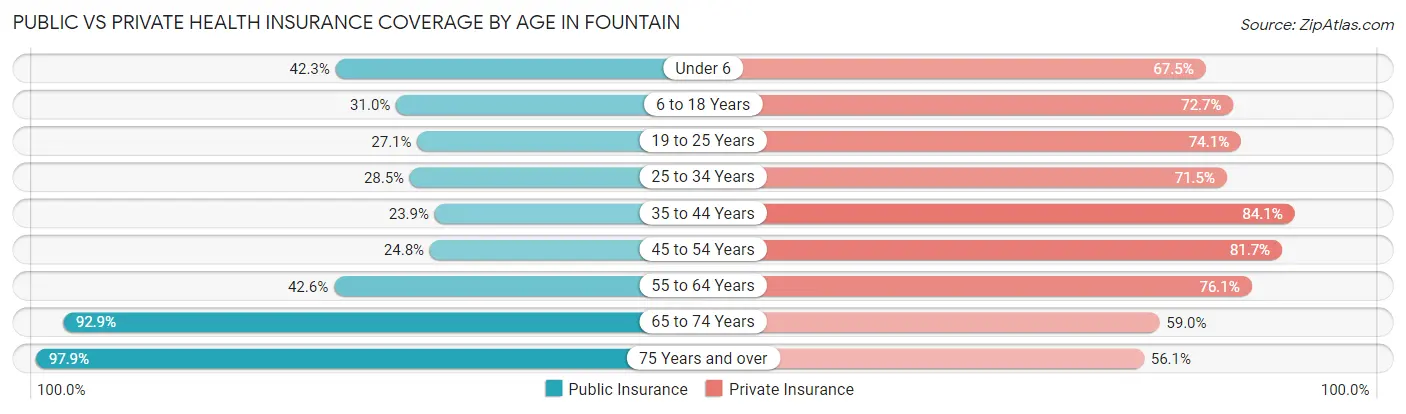
| Age Bracket | Public Insurance | Private Insurance |
| Under 6 | 1,115 (42.3%) | 1,781 (67.5%) |
| 6 to 18 Years | 1,935 (31.0%) | 4,531 (72.7%) |
| 19 to 25 Years | 863 (27.1%) | 2,359 (74.1%) |
| 25 to 34 Years | 1,098 (28.5%) | 2,756 (71.5%) |
| 35 to 44 Years | 1,056 (23.9%) | 3,720 (84.1%) |
| 45 to 54 Years | 771 (24.8%) | 2,543 (81.7%) |
| 55 to 64 Years | 1,109 (42.6%) | 1,981 (76.0%) |
| 65 to 74 Years | 1,272 (92.9%) | 807 (59.0%) |
| 75 Years and over | 655 (97.9%) | 375 (56.0%) |
| Total | 9,874 (35.1%) | 20,853 (74.2%) |
Disability Status by Sex by Age in Fountain
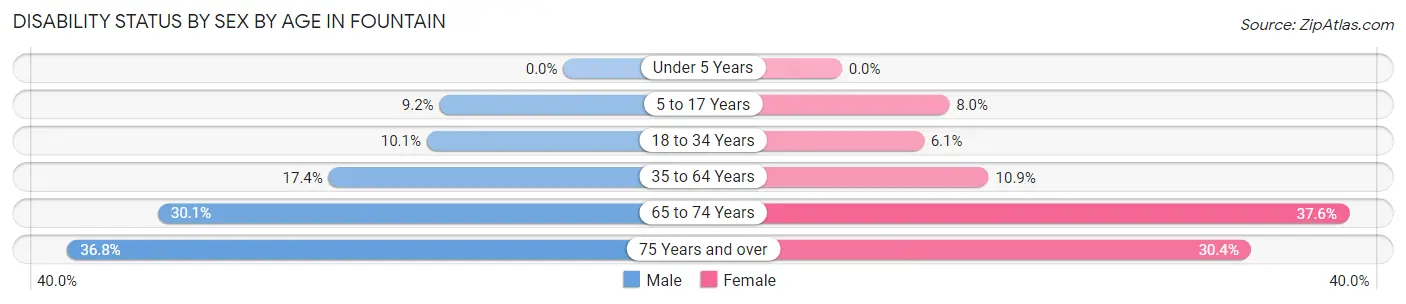
| Age Bracket | Male | Female |
| Under 5 Years | 0 (0.0%) | 0 (0.0%) |
| 5 to 17 Years | 302 (9.2%) | 244 (8.0%) |
| 18 to 34 Years | 316 (10.1%) | 261 (6.1%) |
| 35 to 64 Years | 895 (17.4%) | 546 (10.9%) |
| 65 to 74 Years | 221 (30.1%) | 239 (37.6%) |
| 75 Years and over | 102 (36.8%) | 119 (30.4%) |
Disability Class by Sex by Age in Fountain
Disability Class: Hearing Difficulty
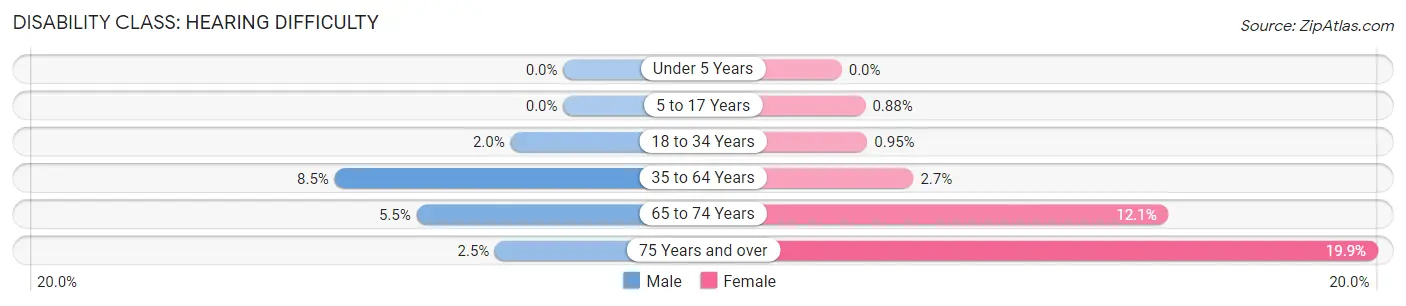
| Age Bracket | Male | Female |
| Under 5 Years | 0 (0.0%) | 0 (0.0%) |
| 5 to 17 Years | 0 (0.0%) | 27 (0.9%) |
| 18 to 34 Years | 61 (2.0%) | 41 (0.9%) |
| 35 to 64 Years | 436 (8.5%) | 133 (2.7%) |
| 65 to 74 Years | 40 (5.4%) | 77 (12.1%) |
| 75 Years and over | 7 (2.5%) | 78 (19.9%) |
Disability Class: Vision Difficulty
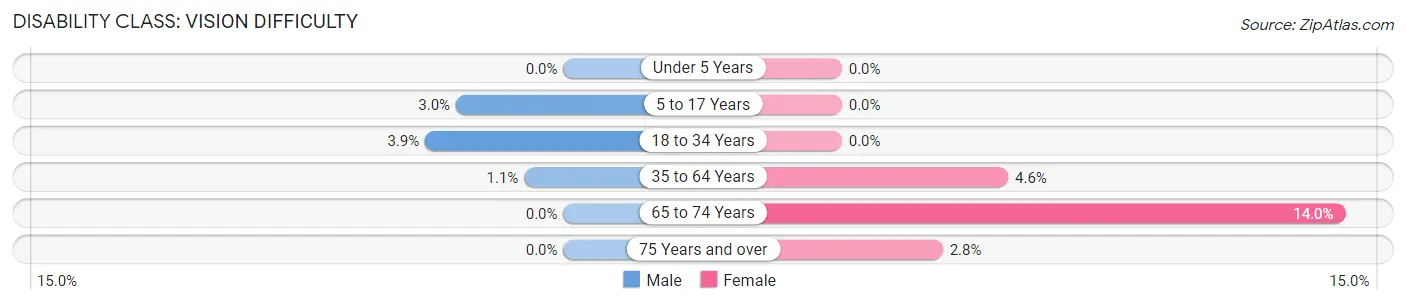
| Age Bracket | Male | Female |
| Under 5 Years | 0 (0.0%) | 0 (0.0%) |
| 5 to 17 Years | 98 (3.0%) | 0 (0.0%) |
| 18 to 34 Years | 120 (3.8%) | 0 (0.0%) |
| 35 to 64 Years | 56 (1.1%) | 232 (4.6%) |
| 65 to 74 Years | 0 (0.0%) | 89 (14.0%) |
| 75 Years and over | 0 (0.0%) | 11 (2.8%) |
Disability Class: Cognitive Difficulty
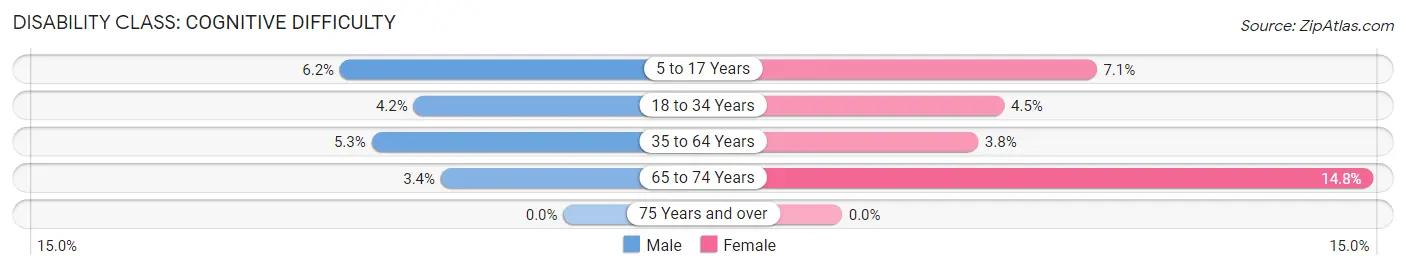
| Age Bracket | Male | Female |
| 5 to 17 Years | 204 (6.2%) | 217 (7.1%) |
| 18 to 34 Years | 130 (4.2%) | 194 (4.5%) |
| 35 to 64 Years | 274 (5.3%) | 190 (3.8%) |
| 65 to 74 Years | 25 (3.4%) | 94 (14.8%) |
| 75 Years and over | 0 (0.0%) | 0 (0.0%) |
Disability Class: Ambulatory Difficulty
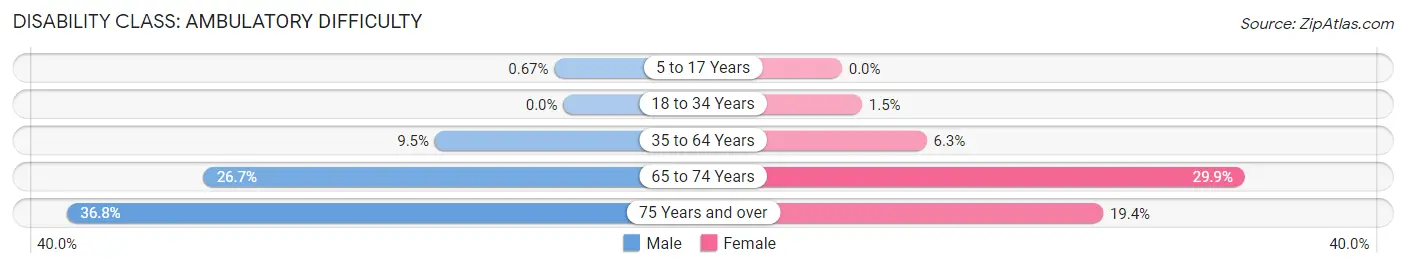
| Age Bracket | Male | Female |
| 5 to 17 Years | 22 (0.7%) | 0 (0.0%) |
| 18 to 34 Years | 0 (0.0%) | 64 (1.5%) |
| 35 to 64 Years | 490 (9.5%) | 315 (6.3%) |
| 65 to 74 Years | 196 (26.7%) | 190 (29.9%) |
| 75 Years and over | 102 (36.8%) | 76 (19.4%) |
Disability Class: Self-Care Difficulty
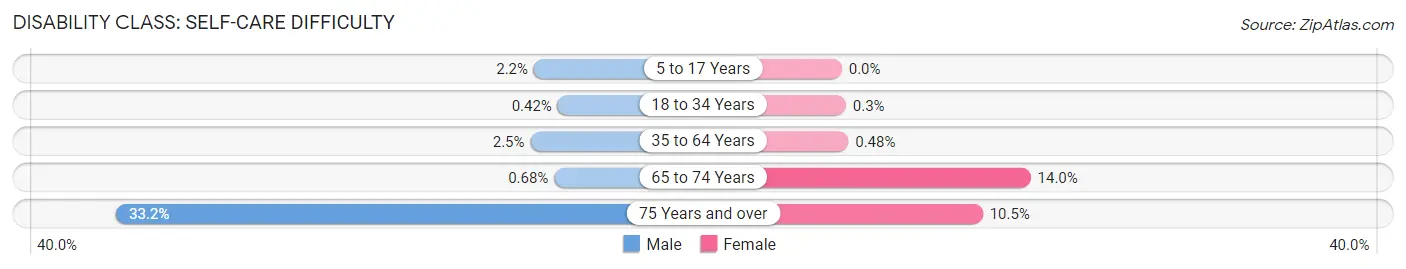
| Age Bracket | Male | Female |
| 5 to 17 Years | 72 (2.2%) | 0 (0.0%) |
| 18 to 34 Years | 13 (0.4%) | 13 (0.3%) |
| 35 to 64 Years | 126 (2.5%) | 24 (0.5%) |
| 65 to 74 Years | 5 (0.7%) | 89 (14.0%) |
| 75 Years and over | 92 (33.2%) | 41 (10.5%) |
Technology Access in Fountain
Computing Device Access in Fountain
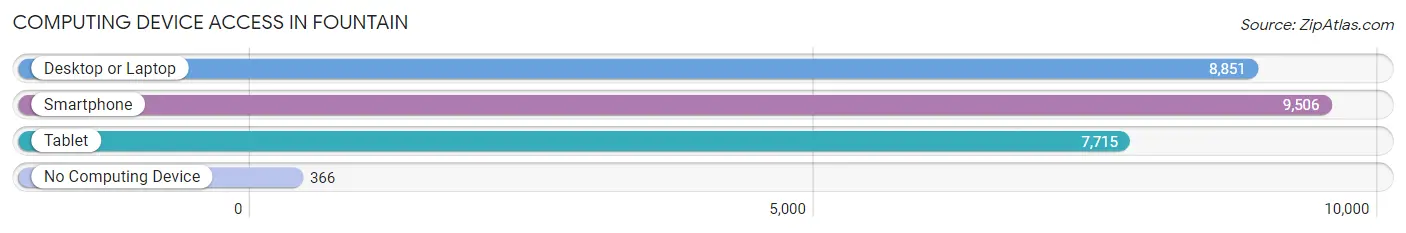
| Device Type | # Households | % Households |
| Desktop or Laptop | 8,851 | 86.8% |
| Smartphone | 9,506 | 93.2% |
| Tablet | 7,715 | 75.6% |
| No Computing Device | 366 | 3.6% |
| Total | 10,203 | 100.0% |
Internet Access in Fountain
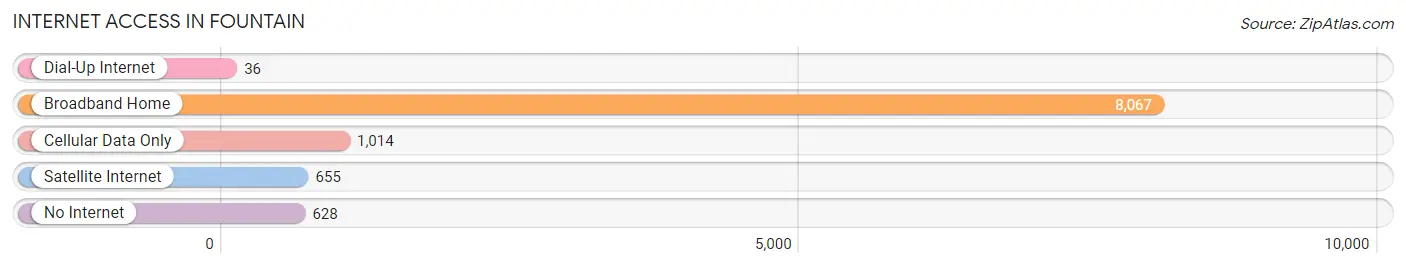
| Internet Type | # Households | % Households |
| Dial-Up Internet | 36 | 0.4% |
| Broadband Home | 8,067 | 79.1% |
| Cellular Data Only | 1,014 | 9.9% |
| Satellite Internet | 655 | 6.4% |
| No Internet | 628 | 6.2% |
| Total | 10,203 | 100.0% |
Fountain Summary
Fountain, Colorado is a small city located in El Paso County, Colorado, United States. It is situated at the base of the Rocky Mountains, just south of Colorado Springs. The city was founded in 1859 and is the oldest settlement in El Paso County. The city has a population of approximately 25,000 people and is part of the Colorado Springs Metropolitan Statistical Area.
Geography
Fountain is located at the base of the Rocky Mountains, just south of Colorado Springs. The city is situated at an elevation of 6,000 feet above sea level and is surrounded by rolling hills and mountains. The city is located in the foothills of the Rocky Mountains and is home to several parks and trails. The city is also home to several lakes, including the Fountain Creek Reservoir, which is a popular spot for fishing and boating.
Climate
Fountain has a semi-arid climate, with hot summers and cold winters. The average temperature in the summer is around 80 degrees Fahrenheit, while the average temperature in the winter is around 30 degrees Fahrenheit. The city receives an average of 16 inches of precipitation per year, with most of it falling in the spring and summer months.
Demographics
As of the 2010 census, the population of Fountain was 25,846. The racial makeup of the city was 79.3% White, 8.2% African American, 0.7% Native American, 1.3% Asian, 0.2% Pacific Islander, 6.7% from other races, and 3.7% from two or more races. Hispanic or Latino of any race were 18.2% of the population.
Economy
Fountain is home to several businesses and industries, including manufacturing, retail, and healthcare. The city is also home to several military bases, including Fort Carson and Peterson Air Force Base. The city is also home to several educational institutions, including the University of Colorado at Colorado Springs and Pikes Peak Community College.
The city is also home to several parks and recreational areas, including the Fountain Creek Nature Center, which is a popular spot for hiking, biking, and bird watching. The city is also home to several golf courses, including the Country Club of Colorado Springs.
Fountain is a great place to live and work, with a strong economy and a diverse population. The city is home to several businesses and industries, as well as several educational institutions and recreational areas. The city is also home to several military bases, making it a great place for those in the military to live and work.
Common Questions
What is Per Capita Income in Fountain?
Per Capita income in Fountain is $32,600.
What is the Median Family Income in Fountain?
Median Family Income in Fountain is $87,782.
What is the Median Household income in Fountain?
Median Household Income in Fountain is $80,311.
What is Income or Wage Gap in Fountain?
Income or Wage Gap in Fountain is 36.8%.
Women in Fountain earn 63.2 cents for every dollar earned by a man.
What is Family Income Deficit in Fountain?
Family Income Deficit in Fountain is $13,568.
Families that are below poverty line in Fountain earn $13,568 less on average than the poverty threshold level.
What is Inequality or Gini Index in Fountain?
Inequality or Gini Index in Fountain is 0.38.
What is the Total Population of Fountain?
Total Population of Fountain is 29,498.
What is the Total Male Population of Fountain?
Total Male Population of Fountain is 14,814.
What is the Total Female Population of Fountain?
Total Female Population of Fountain is 14,684.
What is the Ratio of Males per 100 Females in Fountain?
There are 100.89 Males per 100 Females in Fountain.
What is the Ratio of Females per 100 Males in Fountain?
There are 99.12 Females per 100 Males in Fountain.
What is the Median Population Age in Fountain?
Median Population Age in Fountain is 30.4 Years.
What is the Average Family Size in Fountain
Average Family Size in Fountain is 3.3 People.
What is the Average Household Size in Fountain
Average Household Size in Fountain is 2.9 People.
How Large is the Labor Force in Fountain?
There are 15,099 People in the Labor Forcein in Fountain.
What is the Percentage of People in the Labor Force in Fountain?
68.9% of People are in the Labor Force in Fountain.
What is the Unemployment Rate in Fountain?
Unemployment Rate in Fountain is 7.0%.