Zip Codes with the Highest Percentage of Population Employed in Architecture & Engineering in Loveland, CO
RELATED REPORTS & OPTIONS
Architecture & Engineering
Loveland
Compare Zip Codes
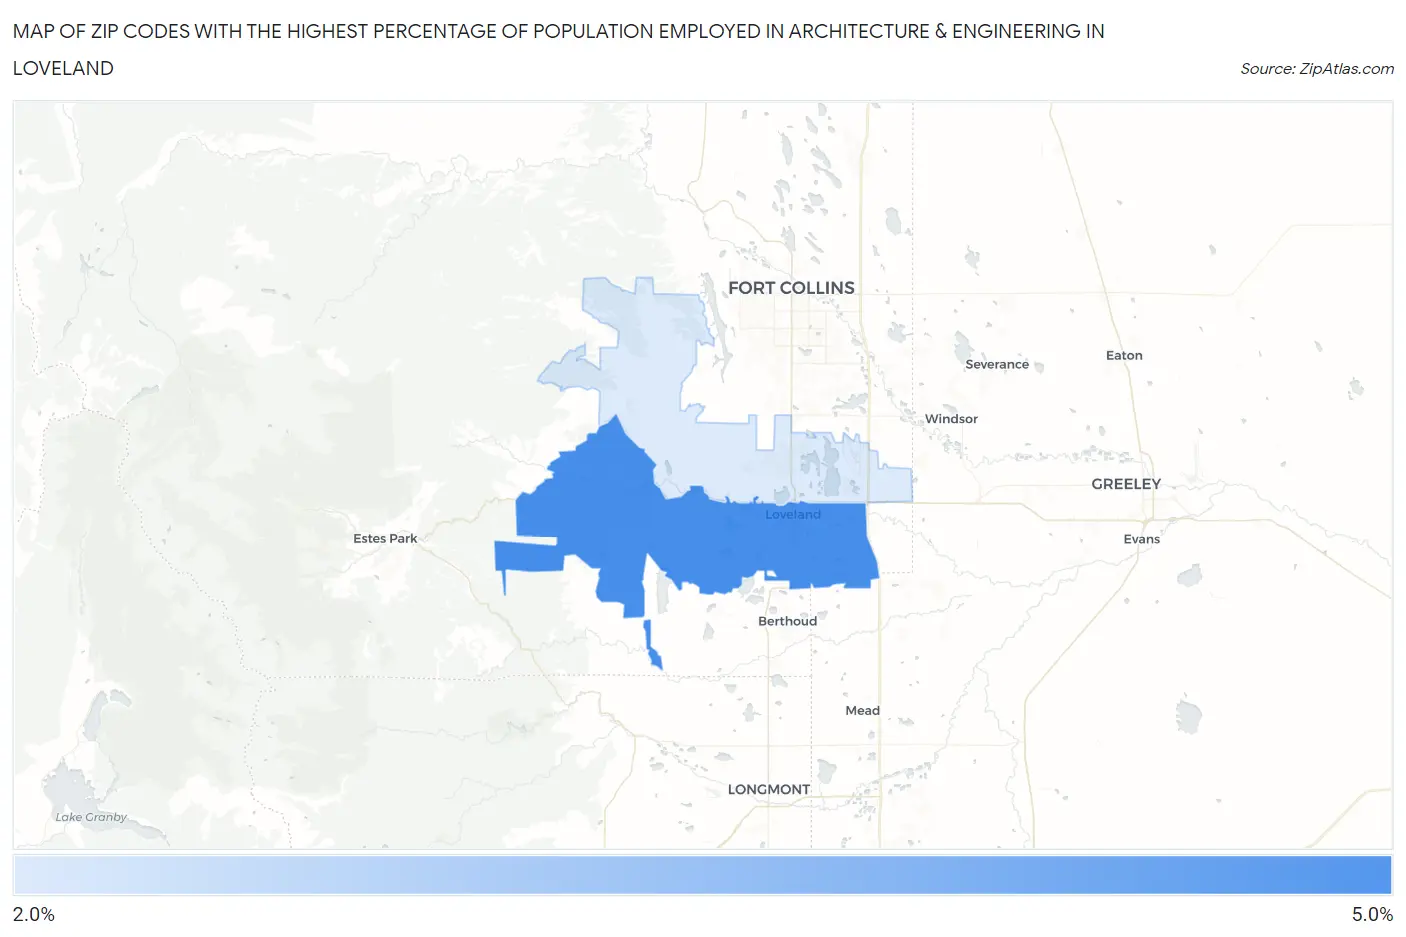
Map of Zip Codes with the Highest Percentage of Population Employed in Architecture & Engineering in Loveland
2.6%
4.3%
Zip Codes with the Highest Percentage of Population Employed in Architecture & Engineering in Loveland, CO
| Zip Code | % Employed | vs State | vs National | |
| 1. | 80537 | 4.3% | 2.9%(+1.43)#58 | 2.1%(+2.20)#2,318 |
| 2. | 80538 | 2.6% | 2.9%(-0.334)#158 | 2.1%(+0.438)#6,632 |
1
Common Questions
What are the Top Zip Codes with the Highest Percentage of Population Employed in Architecture & Engineering in Loveland, CO?
Top Zip Codes with the Highest Percentage of Population Employed in Architecture & Engineering in Loveland, CO are:
What zip code has the Highest Percentage of Population Employed in Architecture & Engineering in Loveland, CO?
80537 has the Highest Percentage of Population Employed in Architecture & Engineering in Loveland, CO with 4.3%.
What is the Percentage of Population Employed in Architecture & Engineering in Loveland, CO?
Percentage of Population Employed in Architecture & Engineering in Loveland is 3.2%.
What is the Percentage of Population Employed in Architecture & Engineering in Colorado?
Percentage of Population Employed in Architecture & Engineering in Colorado is 2.9%.
What is the Percentage of Population Employed in Architecture & Engineering in the United States?
Percentage of Population Employed in Architecture & Engineering in the United States is 2.1%.