Zip Codes with the Highest Percentage of Population Employed in Architecture & Engineering in Golden, CO
RELATED REPORTS & OPTIONS
Architecture & Engineering
Golden
Compare Zip Codes
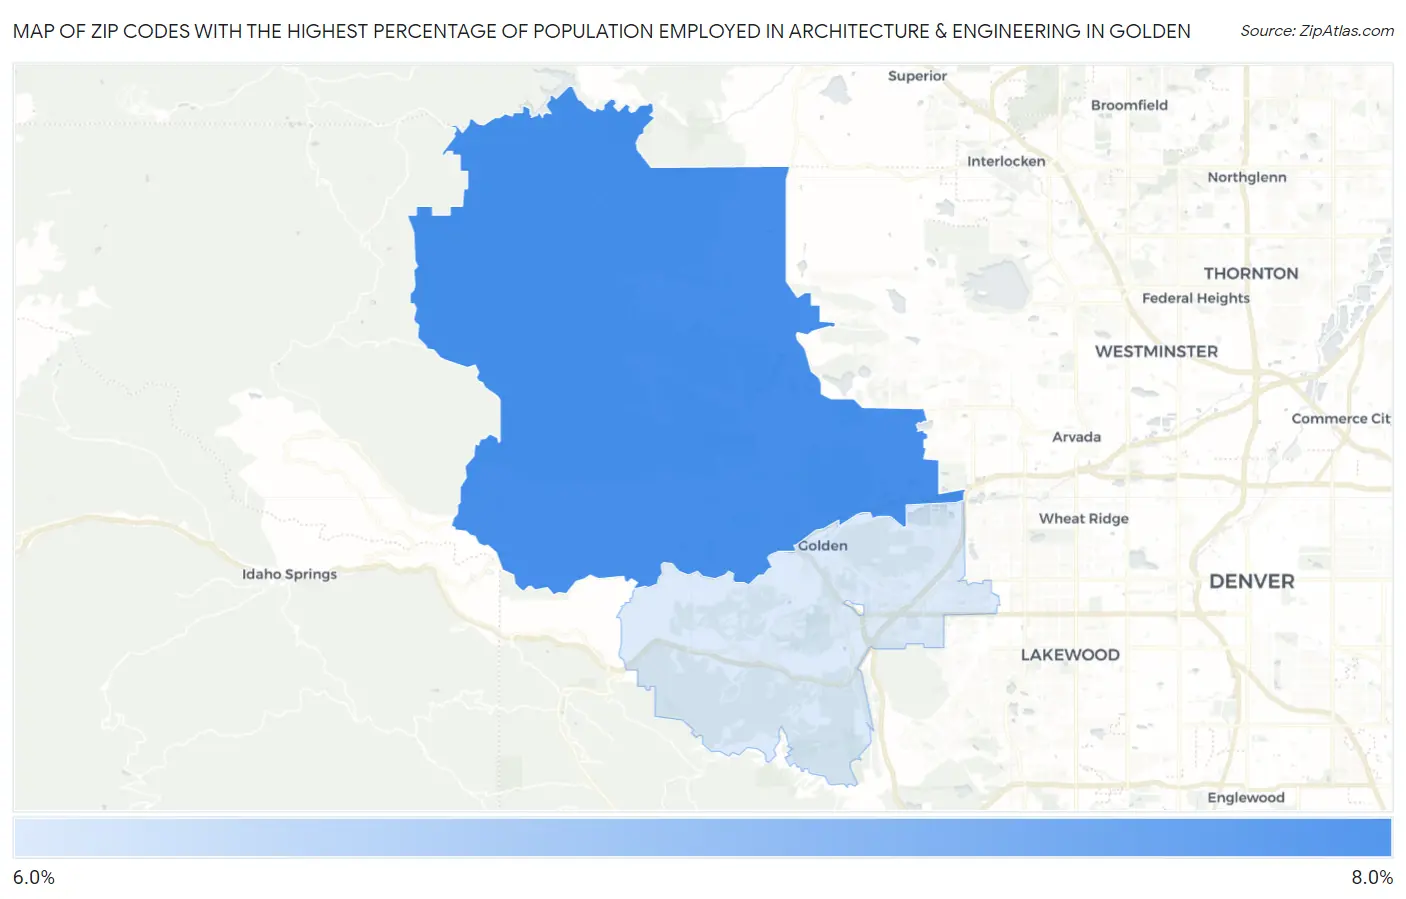
Map of Zip Codes with the Highest Percentage of Population Employed in Architecture & Engineering in Golden
6.1%
6.5%
Zip Codes with the Highest Percentage of Population Employed in Architecture & Engineering in Golden, CO
| Zip Code | % Employed | vs State | vs National | |
| 1. | 80403 | 6.5% | 2.9%(+3.59)#12 | 2.1%(+4.36)#884 |
| 2. | 80401 | 6.1% | 2.9%(+3.19)#16 | 2.1%(+3.96)#1,034 |
1
Common Questions
What are the Top Zip Codes with the Highest Percentage of Population Employed in Architecture & Engineering in Golden, CO?
Top Zip Codes with the Highest Percentage of Population Employed in Architecture & Engineering in Golden, CO are:
What zip code has the Highest Percentage of Population Employed in Architecture & Engineering in Golden, CO?
80403 has the Highest Percentage of Population Employed in Architecture & Engineering in Golden, CO with 6.5%.
What is the Percentage of Population Employed in Architecture & Engineering in Golden, CO?
Percentage of Population Employed in Architecture & Engineering in Golden is 7.3%.
What is the Percentage of Population Employed in Architecture & Engineering in Colorado?
Percentage of Population Employed in Architecture & Engineering in Colorado is 2.9%.
What is the Percentage of Population Employed in Architecture & Engineering in the United States?
Percentage of Population Employed in Architecture & Engineering in the United States is 2.1%.