Zip Codes with the Highest Percentage of Population Employed in Architecture & Engineering in Durango, CO
RELATED REPORTS & OPTIONS
Architecture & Engineering
Durango
Compare Zip Codes
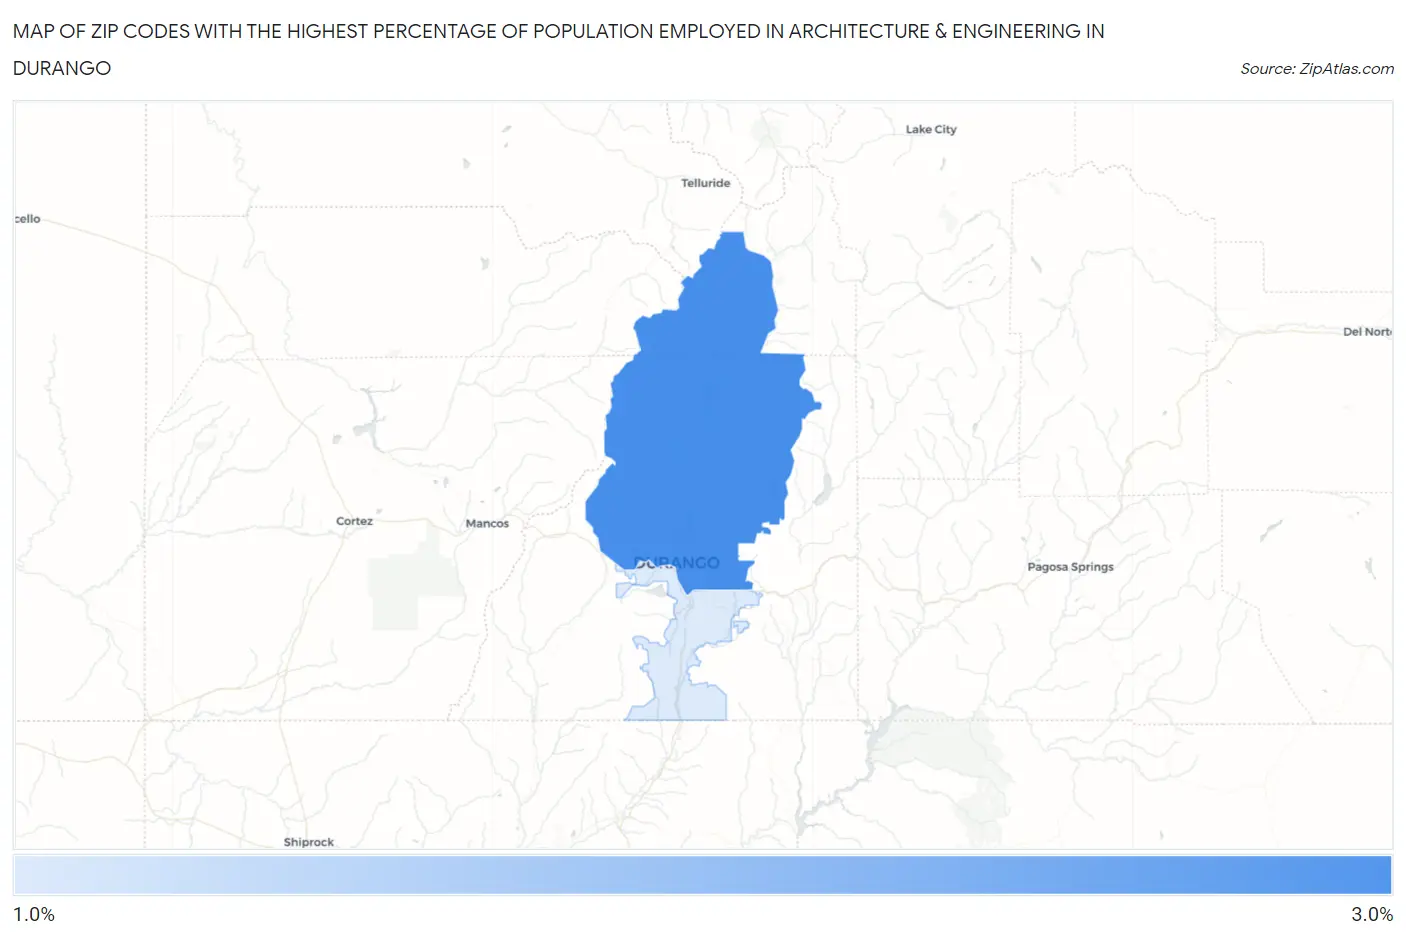
Map of Zip Codes with the Highest Percentage of Population Employed in Architecture & Engineering in Durango
1.7%
2.7%
Zip Codes with the Highest Percentage of Population Employed in Architecture & Engineering in Durango, CO
| Zip Code | % Employed | vs State | vs National | |
| 1. | 81301 | 2.7% | 2.9%(-0.271)#154 | 2.1%(+0.502)#6,361 |
| 2. | 81303 | 1.7% | 2.9%(-1.26)#217 | 2.1%(-0.485)#11,746 |
1
Common Questions
What are the Top Zip Codes with the Highest Percentage of Population Employed in Architecture & Engineering in Durango, CO?
Top Zip Codes with the Highest Percentage of Population Employed in Architecture & Engineering in Durango, CO are:
What zip code has the Highest Percentage of Population Employed in Architecture & Engineering in Durango, CO?
81301 has the Highest Percentage of Population Employed in Architecture & Engineering in Durango, CO with 2.7%.
What is the Percentage of Population Employed in Architecture & Engineering in Durango, CO?
Percentage of Population Employed in Architecture & Engineering in Durango is 2.2%.
What is the Percentage of Population Employed in Architecture & Engineering in Colorado?
Percentage of Population Employed in Architecture & Engineering in Colorado is 2.9%.
What is the Percentage of Population Employed in Architecture & Engineering in the United States?
Percentage of Population Employed in Architecture & Engineering in the United States is 2.1%.