Zip Codes with the Highest Percentage of Population Employed in Architecture & Engineering in Pueblo, CO
RELATED REPORTS & OPTIONS
Architecture & Engineering
Pueblo
Compare Zip Codes
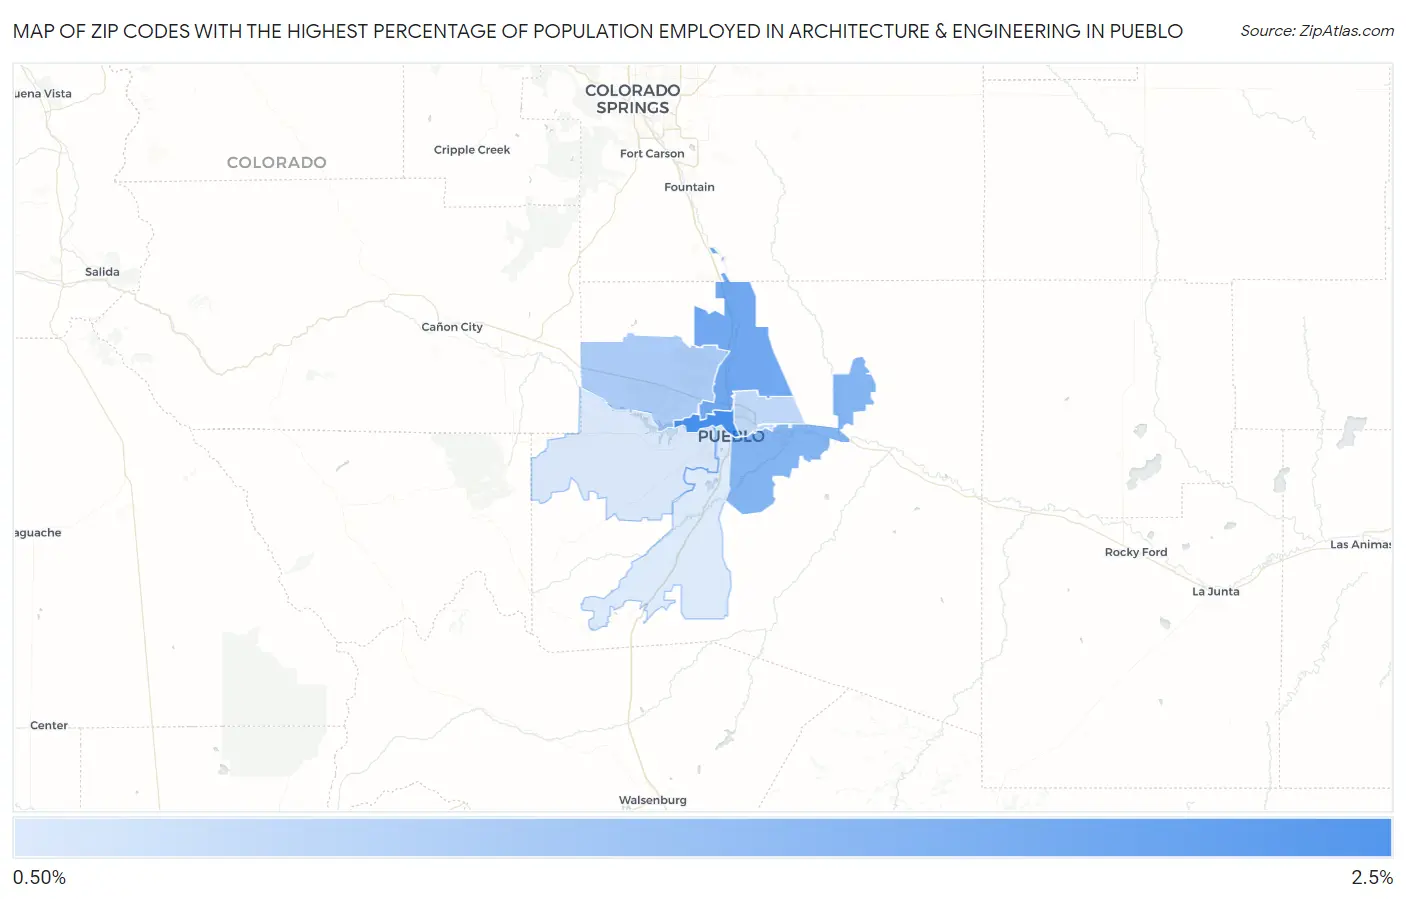
Map of Zip Codes with the Highest Percentage of Population Employed in Architecture & Engineering in Pueblo
1.2%
2.1%
Zip Codes with the Highest Percentage of Population Employed in Architecture & Engineering in Pueblo, CO
| Zip Code | % Employed | vs State | vs National | |
| 1. | 81003 | 2.1% | 2.9%(-0.775)#183 | 2.1%(-0.002)#8,775 |
| 2. | 81008 | 1.9% | 2.9%(-1.02)#201 | 2.1%(-0.247)#10,231 |
| 3. | 81006 | 1.8% | 2.9%(-1.13)#208 | 2.1%(-0.362)#10,894 |
| 4. | 81007 | 1.5% | 2.9%(-1.38)#226 | 2.1%(-0.605)#12,545 |
| 5. | 81001 | 1.4% | 2.9%(-1.50)#236 | 2.1%(-0.729)#13,441 |
| 6. | 81005 | 1.3% | 2.9%(-1.65)#252 | 2.1%(-0.877)#14,508 |
| 7. | 81004 | 1.2% | 2.9%(-1.68)#259 | 2.1%(-0.906)#14,732 |
1
Common Questions
What are the Top 5 Zip Codes with the Highest Percentage of Population Employed in Architecture & Engineering in Pueblo, CO?
Top 5 Zip Codes with the Highest Percentage of Population Employed in Architecture & Engineering in Pueblo, CO are:
What zip code has the Highest Percentage of Population Employed in Architecture & Engineering in Pueblo, CO?
81003 has the Highest Percentage of Population Employed in Architecture & Engineering in Pueblo, CO with 2.1%.
What is the Percentage of Population Employed in Architecture & Engineering in Pueblo, CO?
Percentage of Population Employed in Architecture & Engineering in Pueblo is 1.5%.
What is the Percentage of Population Employed in Architecture & Engineering in Colorado?
Percentage of Population Employed in Architecture & Engineering in Colorado is 2.9%.
What is the Percentage of Population Employed in Architecture & Engineering in the United States?
Percentage of Population Employed in Architecture & Engineering in the United States is 2.1%.