Zip Codes with the Highest Percentage of Population Employed in Architecture & Engineering in Englewood, CO
RELATED REPORTS & OPTIONS
Architecture & Engineering
Englewood
Compare Zip Codes
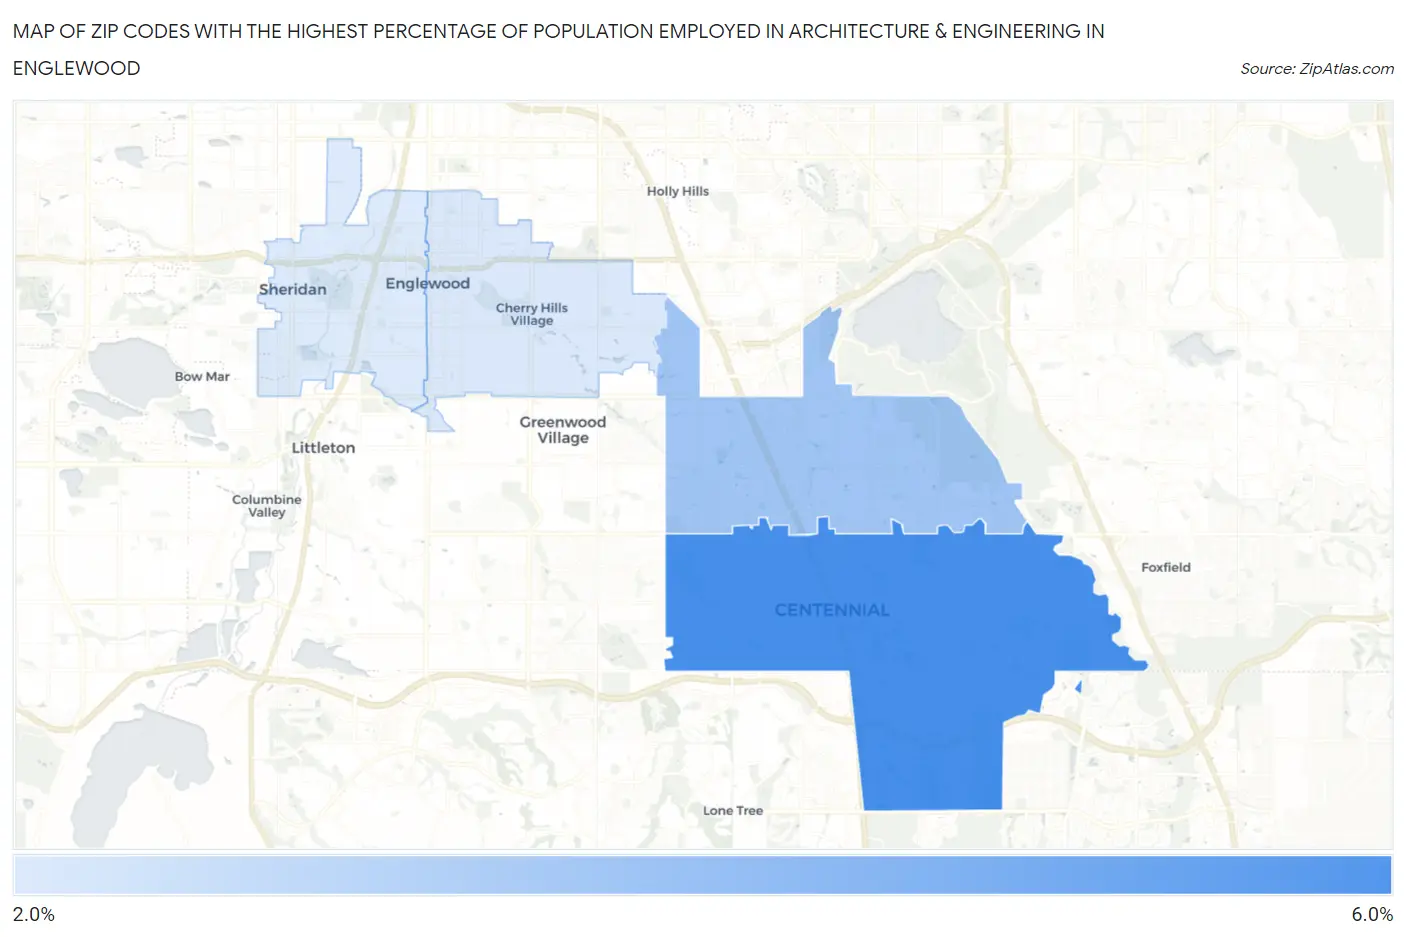
Map of Zip Codes with the Highest Percentage of Population Employed in Architecture & Engineering in Englewood
3.0%
5.4%
Zip Codes with the Highest Percentage of Population Employed in Architecture & Engineering in Englewood, CO
| Zip Code | % Employed | vs State | vs National | |
| 1. | 80112 | 5.4% | 2.9%(+2.52)#28 | 2.1%(+3.29)#1,367 |
| 2. | 80111 | 4.0% | 2.9%(+1.03)#74 | 2.1%(+1.80)#2,842 |
| 3. | 80113 | 3.0% | 2.9%(+0.052)#123 | 2.1%(+0.824)#5,146 |
| 4. | 80110 | 3.0% | 2.9%(+0.031)#125 | 2.1%(+0.804)#5,227 |
1
Common Questions
What are the Top 3 Zip Codes with the Highest Percentage of Population Employed in Architecture & Engineering in Englewood, CO?
Top 3 Zip Codes with the Highest Percentage of Population Employed in Architecture & Engineering in Englewood, CO are:
What zip code has the Highest Percentage of Population Employed in Architecture & Engineering in Englewood, CO?
80112 has the Highest Percentage of Population Employed in Architecture & Engineering in Englewood, CO with 5.4%.
What is the Percentage of Population Employed in Architecture & Engineering in Englewood, CO?
Percentage of Population Employed in Architecture & Engineering in Englewood is 3.5%.
What is the Percentage of Population Employed in Architecture & Engineering in Colorado?
Percentage of Population Employed in Architecture & Engineering in Colorado is 2.9%.
What is the Percentage of Population Employed in Architecture & Engineering in the United States?
Percentage of Population Employed in Architecture & Engineering in the United States is 2.1%.