Norwood, CO Map & Demographics
Norwood Map
Norwood Overview
$28,060
PER CAPITA INCOME
$63,750
AVG FAMILY INCOME
$53,603
AVG HOUSEHOLD INCOME
59.4%
WAGE / INCOME GAP [ % ]
40.6¢/ $1
WAGE / INCOME GAP [ $ ]
0.43
INEQUALITY / GINI INDEX
558
TOTAL POPULATION
281
MALE POPULATION
277
FEMALE POPULATION
101.44
MALES / 100 FEMALES
98.58
FEMALES / 100 MALES
34.5
MEDIAN AGE
2.9
AVG FAMILY SIZE
2.4
AVG HOUSEHOLD SIZE
313
LABOR FORCE [ PEOPLE ]
74.7%
PERCENT IN LABOR FORCE
10.5%
UNEMPLOYMENT RATE
Norwood Zip Codes
Norwood Area Codes
Income in Norwood
Income Overview in Norwood
Per Capita Income in Norwood is $28,060, while median incomes of families and households are $63,750 and $53,603 respectively.
| Characteristic | Number | Measure |
| Per Capita Income | 558 | $28,060 |
| Median Family Income | 142 | $63,750 |
| Mean Family Income | 142 | $88,529 |
| Median Household Income | 233 | $53,603 |
| Mean Household Income | 233 | $75,834 |
| Income Deficit | 142 | $0 |
| Wage / Income Gap (%) | 558 | 59.35% |
| Wage / Income Gap ($) | 558 | 40.65¢ per $1 |
| Gini / Inequality Index | 558 | 0.43 |
Earnings by Sex in Norwood
Average Earnings in Norwood are $33,594, $48,542 for men and $19,732 for women, a difference of 59.4%.
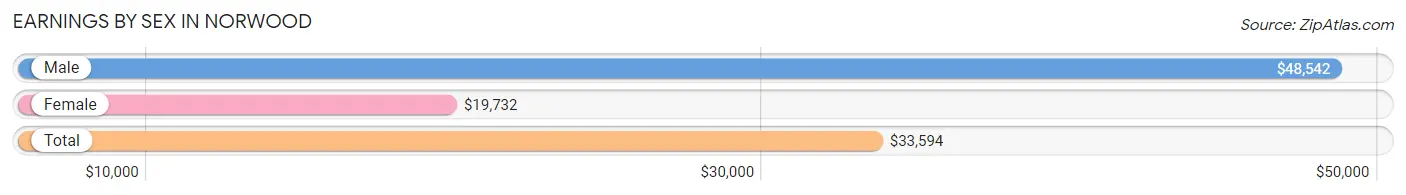
| Sex | Number | Average Earnings |
| Male | 145 (46.5%) | $48,542 |
| Female | 167 (53.5%) | $19,732 |
| Total | 312 (100.0%) | $33,594 |
Earnings by Sex by Income Bracket in Norwood
The most common earnings brackets in Norwood are $30,000 to $34,999 for men (19 | 13.1%) and $15,000 to $17,499 for women (21 | 12.6%).
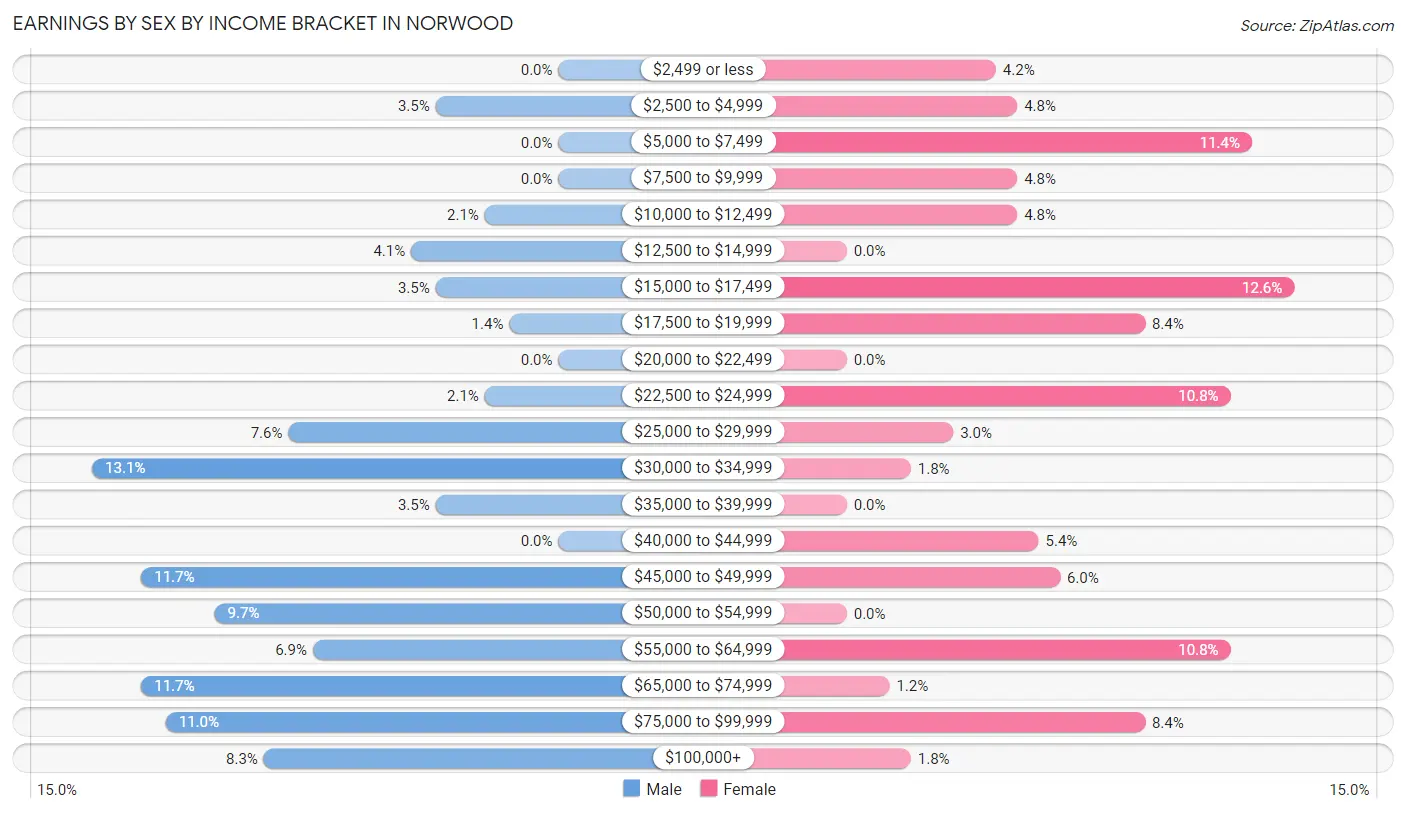
| Income | Male | Female |
| $2,499 or less | 0 (0.0%) | 7 (4.2%) |
| $2,500 to $4,999 | 5 (3.5%) | 8 (4.8%) |
| $5,000 to $7,499 | 0 (0.0%) | 19 (11.4%) |
| $7,500 to $9,999 | 0 (0.0%) | 8 (4.8%) |
| $10,000 to $12,499 | 3 (2.1%) | 8 (4.8%) |
| $12,500 to $14,999 | 6 (4.1%) | 0 (0.0%) |
| $15,000 to $17,499 | 5 (3.5%) | 21 (12.6%) |
| $17,500 to $19,999 | 2 (1.4%) | 14 (8.4%) |
| $20,000 to $22,499 | 0 (0.0%) | 0 (0.0%) |
| $22,500 to $24,999 | 3 (2.1%) | 18 (10.8%) |
| $25,000 to $29,999 | 11 (7.6%) | 5 (3.0%) |
| $30,000 to $34,999 | 19 (13.1%) | 3 (1.8%) |
| $35,000 to $39,999 | 5 (3.5%) | 0 (0.0%) |
| $40,000 to $44,999 | 0 (0.0%) | 9 (5.4%) |
| $45,000 to $49,999 | 17 (11.7%) | 10 (6.0%) |
| $50,000 to $54,999 | 14 (9.7%) | 0 (0.0%) |
| $55,000 to $64,999 | 10 (6.9%) | 18 (10.8%) |
| $65,000 to $74,999 | 17 (11.7%) | 2 (1.2%) |
| $75,000 to $99,999 | 16 (11.0%) | 14 (8.4%) |
| $100,000+ | 12 (8.3%) | 3 (1.8%) |
| Total | 145 (100.0%) | 167 (100.0%) |
Earnings by Sex by Educational Attainment in Norwood
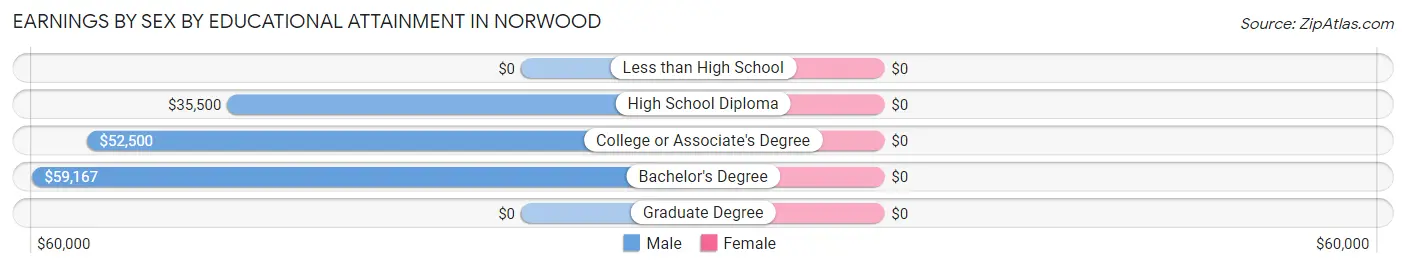
| Educational Attainment | Male Income | Female Income |
| Less than High School | - | - |
| High School Diploma | $35,500 | $0 |
| College or Associate's Degree | $52,500 | $0 |
| Bachelor's Degree | $59,167 | $0 |
| Graduate Degree | - | - |
| Total | $49,167 | $23,403 |
Family Income in Norwood
Family Income Brackets in Norwood
According to the Norwood family income data, there are 39 families falling into the $100,000 to $149,999 income range, which is the most common income bracket and makes up 27.5% of all families.
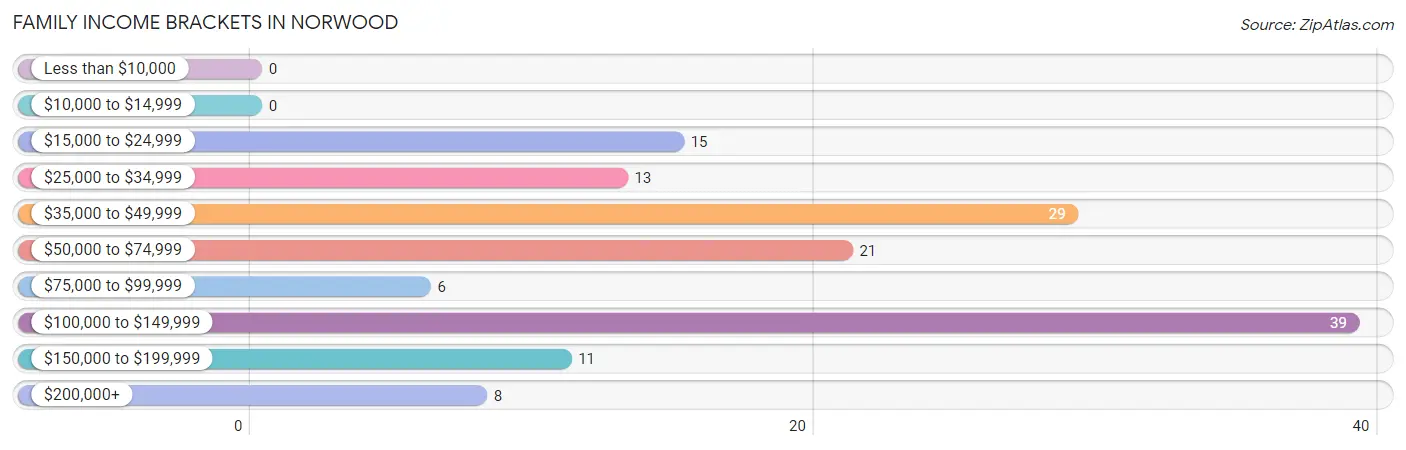
| Income Bracket | # Families | % Families |
| Less than $10,000 | 0 | 0.0% |
| $10,000 to $14,999 | 0 | 0.0% |
| $15,000 to $24,999 | 15 | 10.6% |
| $25,000 to $34,999 | 13 | 9.2% |
| $35,000 to $49,999 | 29 | 20.4% |
| $50,000 to $74,999 | 21 | 14.8% |
| $75,000 to $99,999 | 6 | 4.2% |
| $100,000 to $149,999 | 39 | 27.5% |
| $150,000 to $199,999 | 11 | 7.7% |
| $200,000+ | 8 | 5.6% |
Family Income by Famaliy Size in Norwood
2-person families (57 | 40.1%) account for the highest median family income in Norwood with $125,125 per family, while 2-person families (57 | 40.1%) have the highest median income of $62,562 per family member.
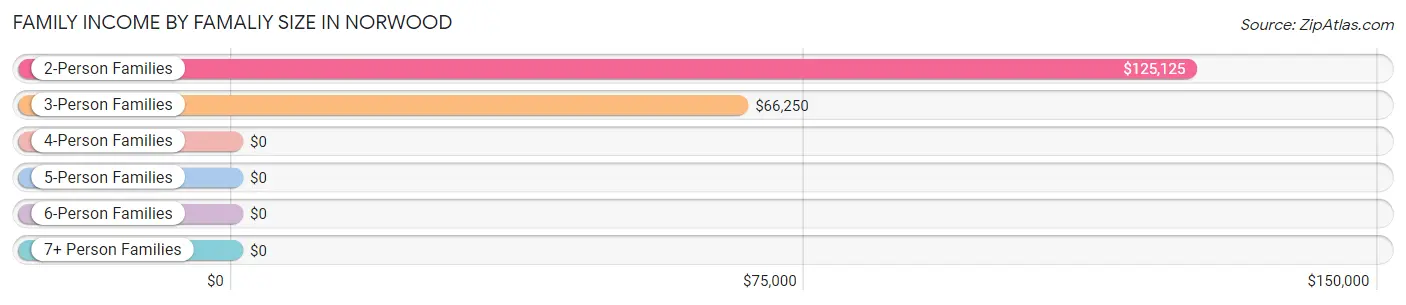
| Income Bracket | # Families | Median Income |
| 2-Person Families | 57 (40.1%) | $125,125 |
| 3-Person Families | 40 (28.2%) | $66,250 |
| 4-Person Families | 29 (20.4%) | $0 |
| 5-Person Families | 11 (7.7%) | $0 |
| 6-Person Families | 5 (3.5%) | $0 |
| 7+ Person Families | 0 (0.0%) | $0 |
| Total | 142 (100.0%) | $63,750 |
Family Income by Number of Earners in Norwood
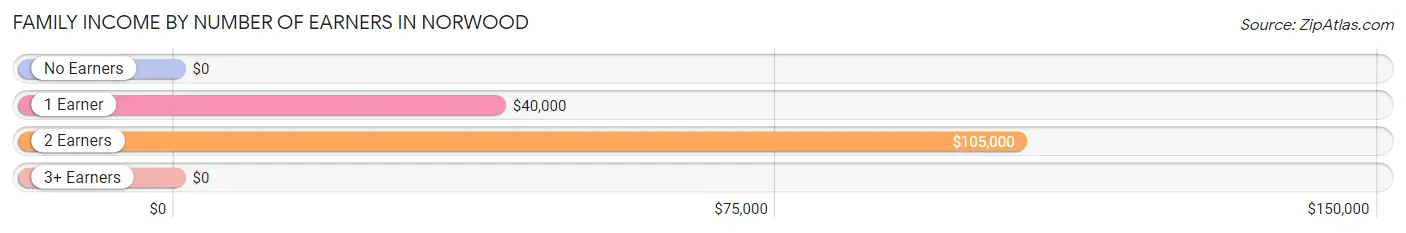
| Number of Earners | # Families | Median Income |
| No Earners | 12 (8.5%) | $0 |
| 1 Earner | 56 (39.4%) | $40,000 |
| 2 Earners | 70 (49.3%) | $105,000 |
| 3+ Earners | 4 (2.8%) | $0 |
| Total | 142 (100.0%) | $63,750 |
Household Income in Norwood
Household Income Brackets in Norwood
With 42 households falling in the category, the $100,000 to $149,999 income range is the most frequent in Norwood, accounting for 18.0% of all households. In contrast, only 7 households (3.0%) fall into the $10,000 to $14,999 income bracket, making it the least populous group.
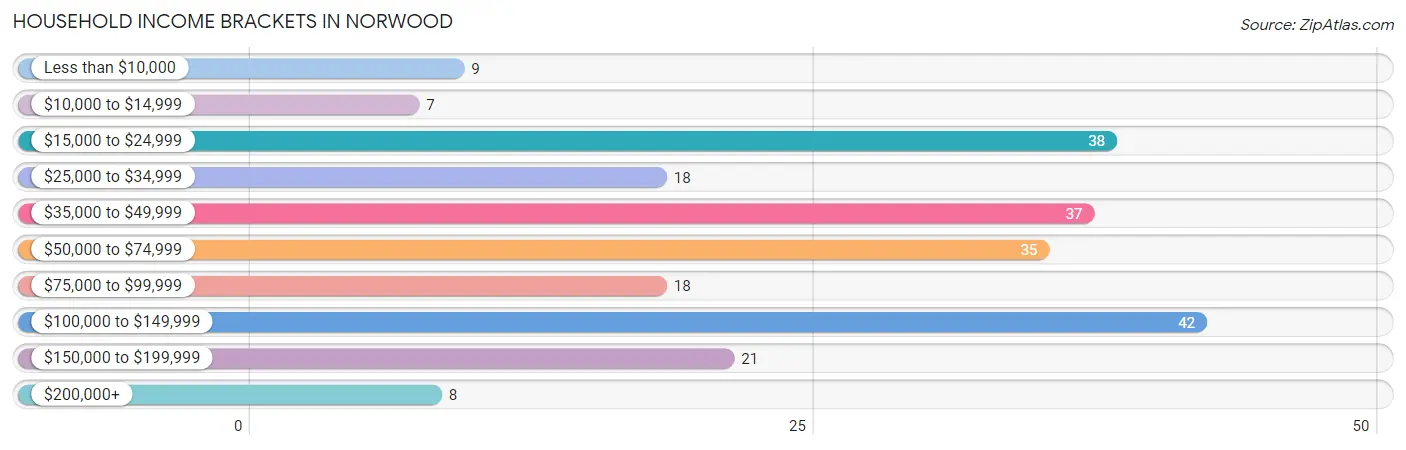
| Income Bracket | # Households | % Households |
| Less than $10,000 | 9 | 3.9% |
| $10,000 to $14,999 | 7 | 3.0% |
| $15,000 to $24,999 | 38 | 16.3% |
| $25,000 to $34,999 | 18 | 7.7% |
| $35,000 to $49,999 | 37 | 15.9% |
| $50,000 to $74,999 | 35 | 15.0% |
| $75,000 to $99,999 | 18 | 7.7% |
| $100,000 to $149,999 | 42 | 18.0% |
| $150,000 to $199,999 | 21 | 9.0% |
| $200,000+ | 8 | 3.4% |
Household Income by Householder Age in Norwood
The median household income in Norwood is $53,603, with the highest median household income of $60,938 found in the 25 to 44 years age bracket for the primary householder. A total of 111 households (47.6%) fall into this category. Meanwhile, the 15 to 24 years age bracket for the primary householder has the lowest median household income of $0, with 10 households (4.3%) in this group.
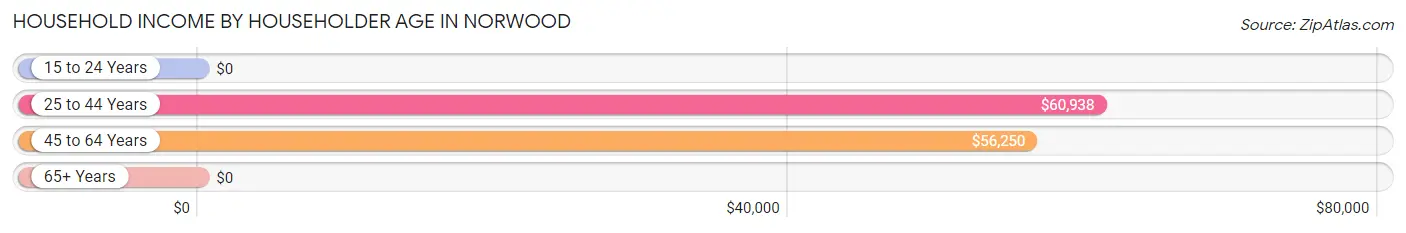
| Income Bracket | # Households | Median Income |
| 15 to 24 Years | 10 (4.3%) | $0 |
| 25 to 44 Years | 111 (47.6%) | $60,938 |
| 45 to 64 Years | 64 (27.5%) | $56,250 |
| 65+ Years | 48 (20.6%) | $0 |
| Total | 233 (100.0%) | $53,603 |
Poverty in Norwood
Income Below Poverty by Sex and Age in Norwood
With 8.2% poverty level for males and 19.5% for females among the residents of Norwood, 15 year old males and 16 and 17 year old females are the most vulnerable to poverty, with 3 males (100.0%) and 2 females (66.7%) in their respective age groups living below the poverty level.
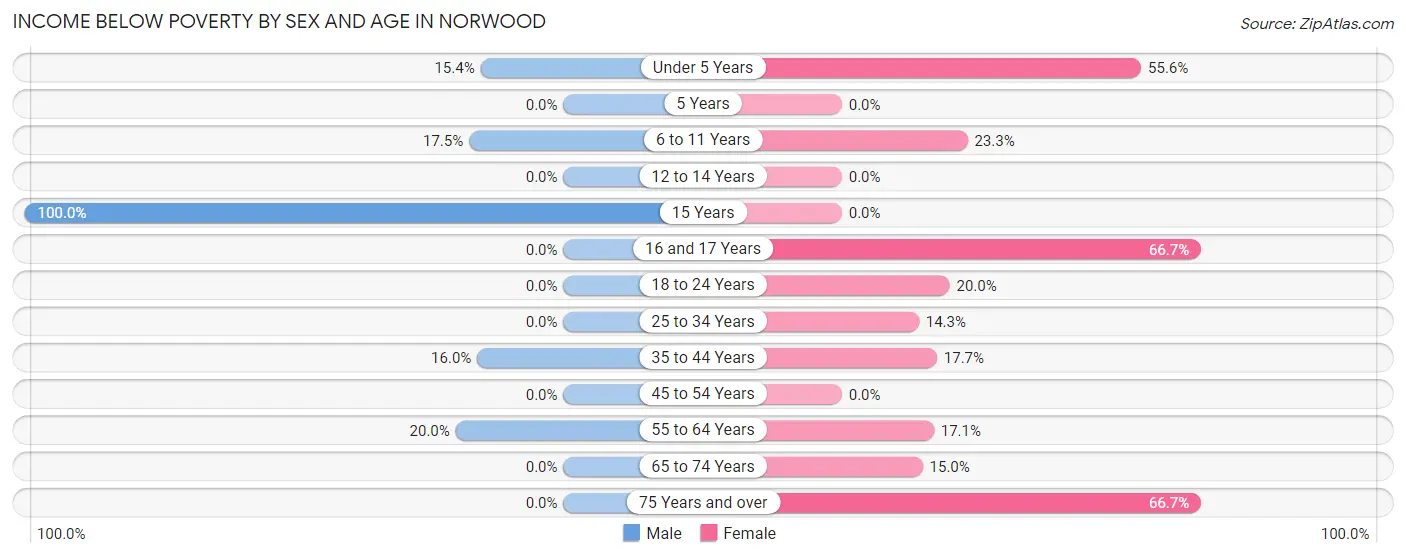
| Age Bracket | Male | Female |
| Under 5 Years | 4 (15.4%) | 5 (55.6%) |
| 5 Years | 0 (0.0%) | 0 (0.0%) |
| 6 to 11 Years | 7 (17.5%) | 7 (23.3%) |
| 12 to 14 Years | 0 (0.0%) | 0 (0.0%) |
| 15 Years | 3 (100.0%) | 0 (0.0%) |
| 16 and 17 Years | 0 (0.0%) | 2 (66.7%) |
| 18 to 24 Years | 0 (0.0%) | 6 (20.0%) |
| 25 to 34 Years | 0 (0.0%) | 9 (14.3%) |
| 35 to 44 Years | 4 (16.0%) | 9 (17.6%) |
| 45 to 54 Years | 0 (0.0%) | 0 (0.0%) |
| 55 to 64 Years | 5 (20.0%) | 7 (17.1%) |
| 65 to 74 Years | 0 (0.0%) | 3 (15.0%) |
| 75 Years and over | 0 (0.0%) | 6 (66.7%) |
| Total | 23 (8.2%) | 54 (19.5%) |
Income Above Poverty by Sex and Age in Norwood
According to the poverty statistics in Norwood, males aged 12 to 14 years and females aged 12 to 14 years are the age groups that are most secure financially, with 100.0% of males and 100.0% of females in these age groups living above the poverty line.
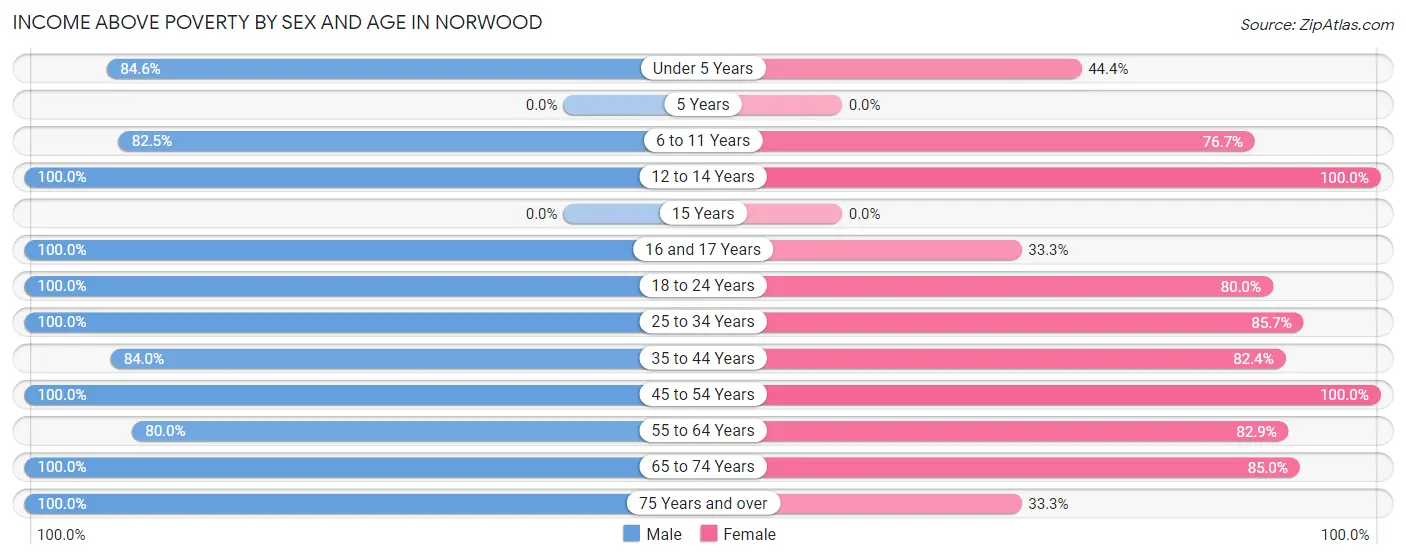
| Age Bracket | Male | Female |
| Under 5 Years | 22 (84.6%) | 4 (44.4%) |
| 5 Years | 0 (0.0%) | 0 (0.0%) |
| 6 to 11 Years | 33 (82.5%) | 23 (76.7%) |
| 12 to 14 Years | 23 (100.0%) | 6 (100.0%) |
| 15 Years | 0 (0.0%) | 0 (0.0%) |
| 16 and 17 Years | 2 (100.0%) | 1 (33.3%) |
| 18 to 24 Years | 3 (100.0%) | 24 (80.0%) |
| 25 to 34 Years | 50 (100.0%) | 54 (85.7%) |
| 35 to 44 Years | 21 (84.0%) | 42 (82.4%) |
| 45 to 54 Years | 46 (100.0%) | 15 (100.0%) |
| 55 to 64 Years | 20 (80.0%) | 34 (82.9%) |
| 65 to 74 Years | 22 (100.0%) | 17 (85.0%) |
| 75 Years and over | 14 (100.0%) | 3 (33.3%) |
| Total | 256 (91.8%) | 223 (80.5%) |
Income Below Poverty Among Married-Couple Families in Norwood
The poverty statistics for married-couple families in Norwood show that 8.9% or 10 of the total 112 families live below the poverty line. Families with 3 or 4 children have the highest poverty rate of 31.2%, comprising of 5 families. On the other hand, families with 1 or 2 children have the lowest poverty rate of 0.0%, which includes 0 families.
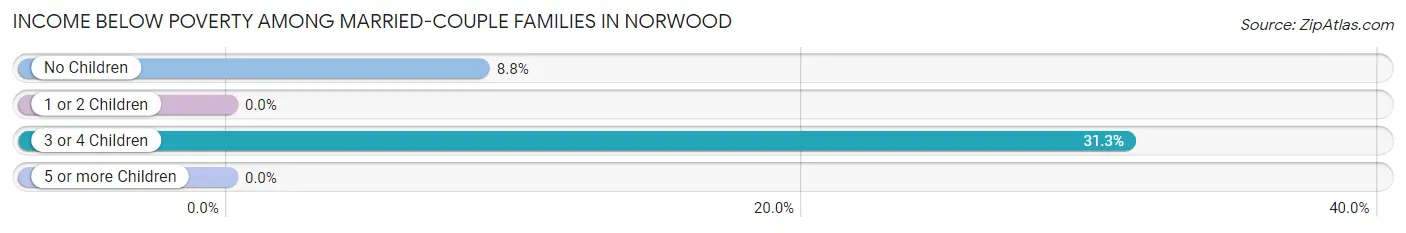
| Children | Above Poverty | Below Poverty |
| No Children | 52 (91.2%) | 5 (8.8%) |
| 1 or 2 Children | 39 (100.0%) | 0 (0.0%) |
| 3 or 4 Children | 11 (68.8%) | 5 (31.2%) |
| 5 or more Children | 0 (0.0%) | 0 (0.0%) |
| Total | 102 (91.1%) | 10 (8.9%) |
Income Below Poverty Among Single-Parent Households in Norwood
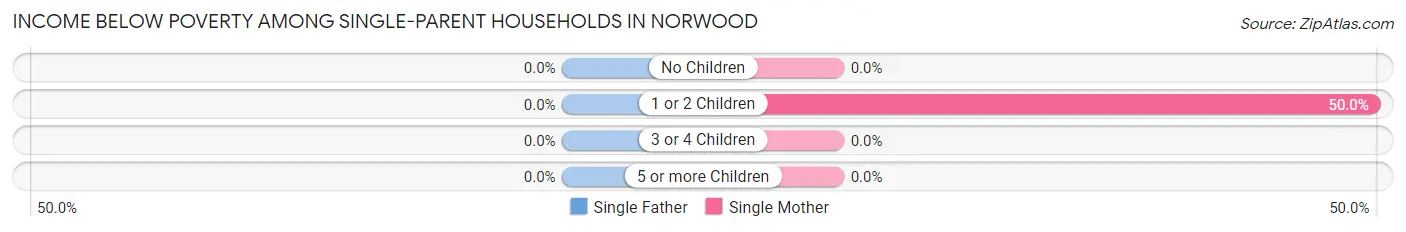
| Children | Single Father | Single Mother |
| No Children | 0 (0.0%) | 0 (0.0%) |
| 1 or 2 Children | 0 (0.0%) | 10 (50.0%) |
| 3 or 4 Children | 0 (0.0%) | 0 (0.0%) |
| 5 or more Children | 0 (0.0%) | 0 (0.0%) |
| Total | 0 (0.0%) | 10 (41.7%) |
Income Below Poverty Among Married-Couple vs Single-Parent Households in Norwood
The poverty data for Norwood shows that 10 of the married-couple family households (8.9%) and 10 of the single-parent households (33.3%) are living below the poverty level. Within the married-couple family households, those with 3 or 4 children have the highest poverty rate, with 5 households (31.2%) falling below the poverty line. Among the single-parent households, those with 1 or 2 children have the highest poverty rate, with 10 household (43.5%) living below poverty.
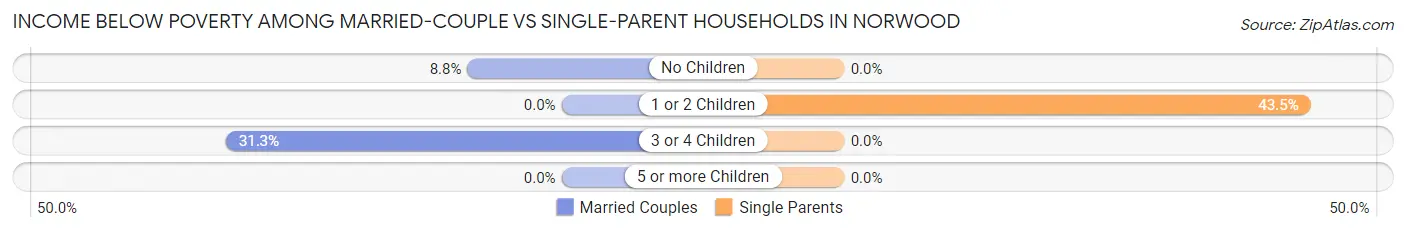
| Children | Married-Couple Families | Single-Parent Households |
| No Children | 5 (8.8%) | 0 (0.0%) |
| 1 or 2 Children | 0 (0.0%) | 10 (43.5%) |
| 3 or 4 Children | 5 (31.2%) | 0 (0.0%) |
| 5 or more Children | 0 (0.0%) | 0 (0.0%) |
| Total | 10 (8.9%) | 10 (33.3%) |
Race in Norwood
The most populous races in Norwood are White / Caucasian (542 | 97.1%), Hispanic or Latino (132 | 23.7%), and Two or more Races (16 | 2.9%).
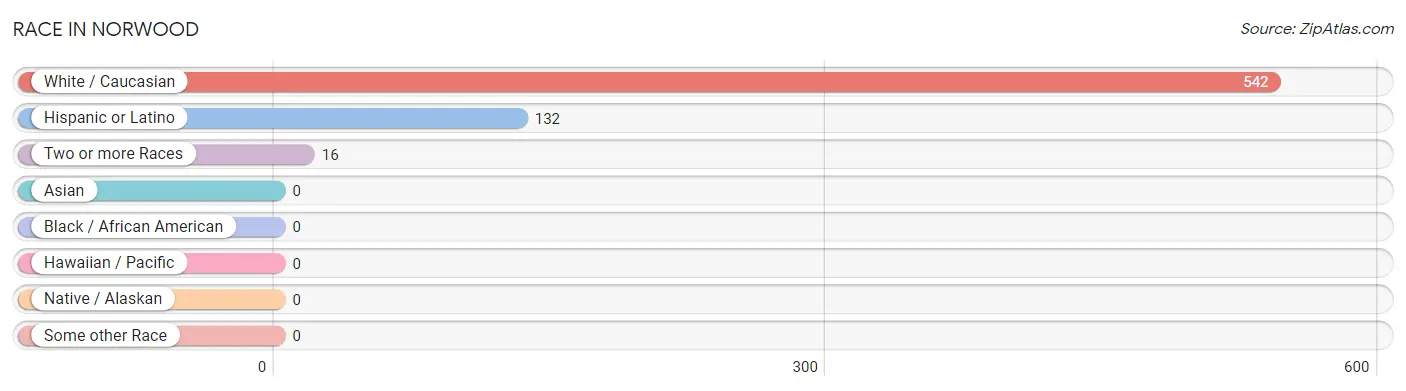
| Race | # Population | % Population |
| Asian | 0 | 0.0% |
| Black / African American | 0 | 0.0% |
| Hawaiian / Pacific | 0 | 0.0% |
| Hispanic or Latino | 132 | 23.7% |
| Native / Alaskan | 0 | 0.0% |
| White / Caucasian | 542 | 97.1% |
| Two or more Races | 16 | 2.9% |
| Some other Race | 0 | 0.0% |
| Total | 558 | 100.0% |
Ancestry in Norwood
The most populous ancestries reported in Norwood are Mexican (132 | 23.7%), English (42 | 7.5%), Irish (40 | 7.2%), German (37 | 6.6%), and Scandinavian (19 | 3.4%), together accounting for 48.4% of all Norwood residents.
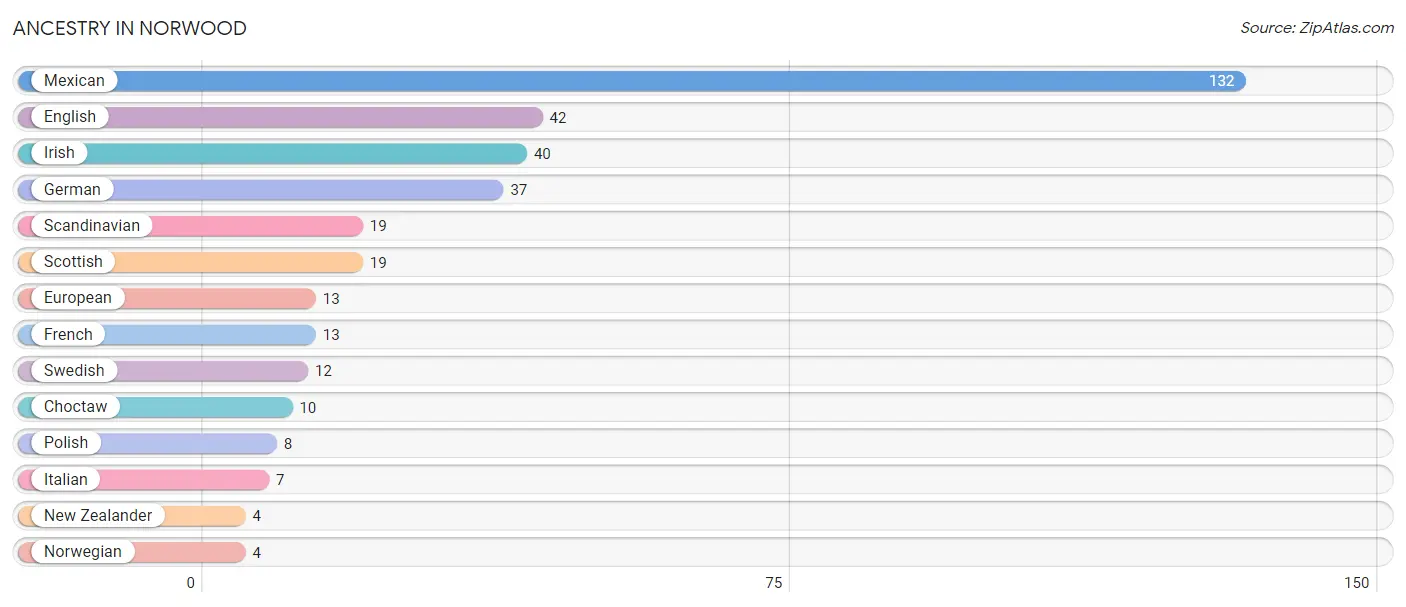
| Ancestry | # Population | % Population |
| Choctaw | 10 | 1.8% |
| English | 42 | 7.5% |
| European | 13 | 2.3% |
| French | 13 | 2.3% |
| German | 37 | 6.6% |
| Irish | 40 | 7.2% |
| Italian | 7 | 1.3% |
| Mexican | 132 | 23.7% |
| New Zealander | 4 | 0.7% |
| Norwegian | 4 | 0.7% |
| Polish | 8 | 1.4% |
| Scandinavian | 19 | 3.4% |
| Scottish | 19 | 3.4% |
| Swedish | 12 | 2.1% | View All 14 Rows |
Immigrants in Norwood
The most numerous immigrant groups reported in Norwood came from Central America (49 | 8.8%), Latin America (49 | 8.8%), Mexico (49 | 8.8%), and Oceania (4 | 0.7%), together accounting for 27.1% of all Norwood residents.
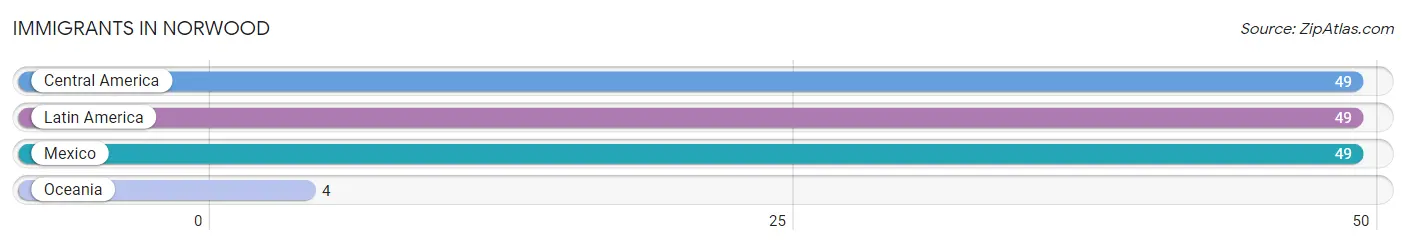
| Immigration Origin | # Population | % Population |
| Central America | 49 | 8.8% |
| Latin America | 49 | 8.8% |
| Mexico | 49 | 8.8% |
| Oceania | 4 | 0.7% | View All 4 Rows |
Sex and Age in Norwood
Sex and Age in Norwood
The most populous age groups in Norwood are 10 to 14 Years (44 | 15.7%) for men and 30 to 34 Years (33 | 11.9%) for women.
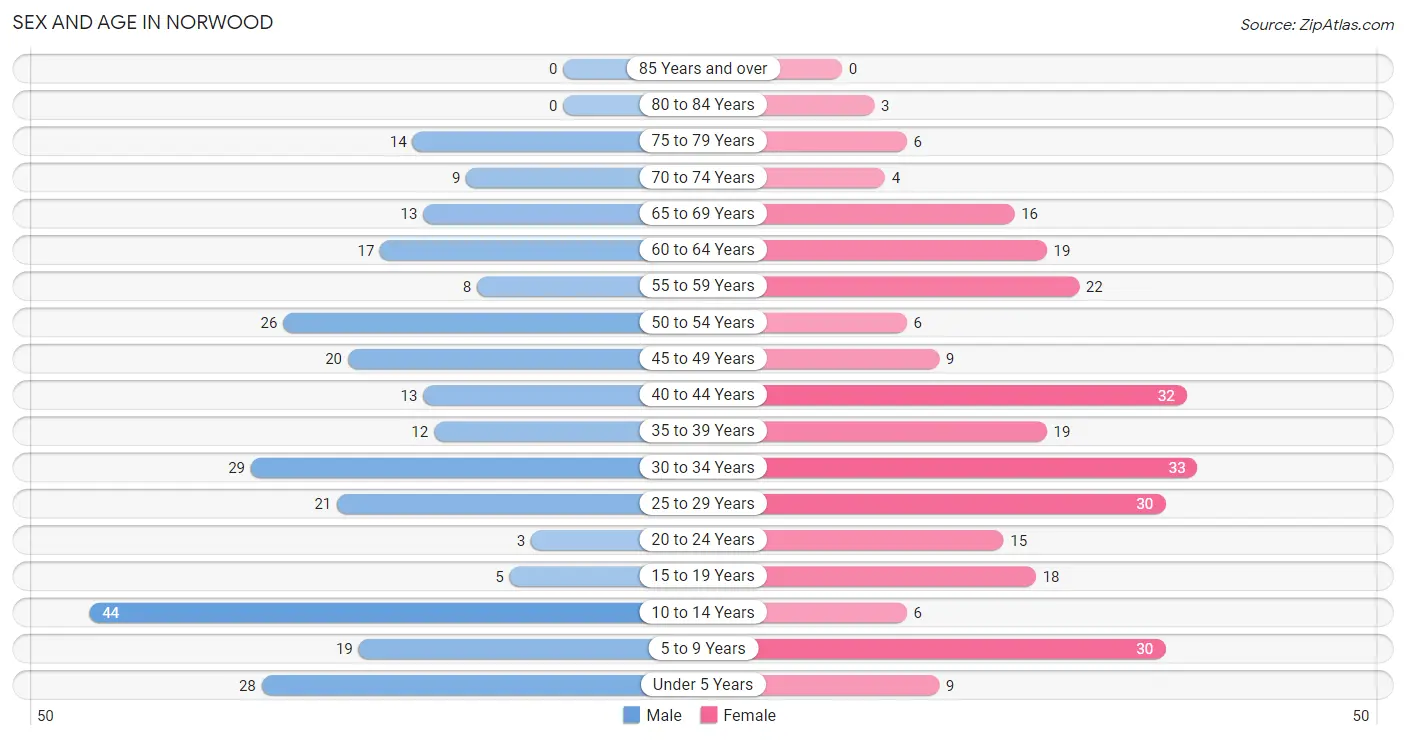
| Age Bracket | Male | Female |
| Under 5 Years | 28 (10.0%) | 9 (3.3%) |
| 5 to 9 Years | 19 (6.8%) | 30 (10.8%) |
| 10 to 14 Years | 44 (15.7%) | 6 (2.2%) |
| 15 to 19 Years | 5 (1.8%) | 18 (6.5%) |
| 20 to 24 Years | 3 (1.1%) | 15 (5.4%) |
| 25 to 29 Years | 21 (7.5%) | 30 (10.8%) |
| 30 to 34 Years | 29 (10.3%) | 33 (11.9%) |
| 35 to 39 Years | 12 (4.3%) | 19 (6.9%) |
| 40 to 44 Years | 13 (4.6%) | 32 (11.6%) |
| 45 to 49 Years | 20 (7.1%) | 9 (3.3%) |
| 50 to 54 Years | 26 (9.2%) | 6 (2.2%) |
| 55 to 59 Years | 8 (2.9%) | 22 (7.9%) |
| 60 to 64 Years | 17 (6.0%) | 19 (6.9%) |
| 65 to 69 Years | 13 (4.6%) | 16 (5.8%) |
| 70 to 74 Years | 9 (3.2%) | 4 (1.4%) |
| 75 to 79 Years | 14 (5.0%) | 6 (2.2%) |
| 80 to 84 Years | 0 (0.0%) | 3 (1.1%) |
| 85 Years and over | 0 (0.0%) | 0 (0.0%) |
| Total | 281 (100.0%) | 277 (100.0%) |
Families and Households in Norwood
Median Family Size in Norwood
The median family size in Norwood is 2.89 persons per family, with single male/father families (6 | 4.2%) accounting for the largest median family size of 3 persons per family. On the other hand, single female/mother families (24 | 16.9%) represent the smallest median family size with 2.54 persons per family.
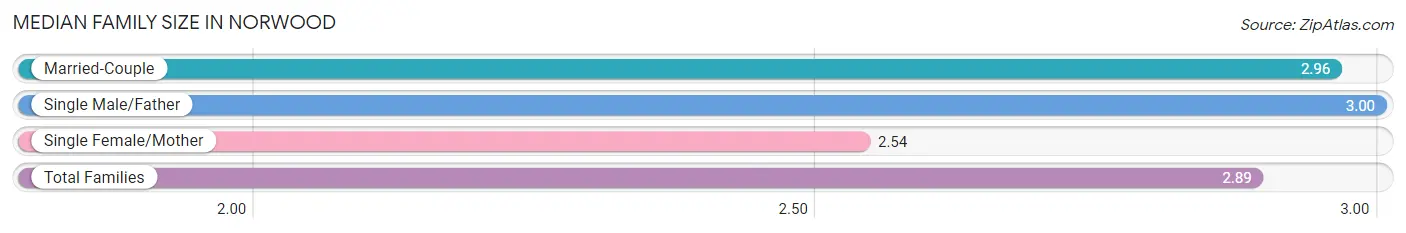
| Family Type | # Families | Family Size |
| Married-Couple | 112 (78.9%) | 2.96 |
| Single Male/Father | 6 (4.2%) | 3.00 |
| Single Female/Mother | 24 (16.9%) | 2.54 |
| Total Families | 142 (100.0%) | 2.89 |
Median Household Size in Norwood
The median household size in Norwood is 2.39 persons per household, with single male/father households (6 | 2.6%) accounting for the largest median household size of 3.33 persons per household. non-family households (91 | 39.1%) represent the smallest median household size with 1.45 persons per household.
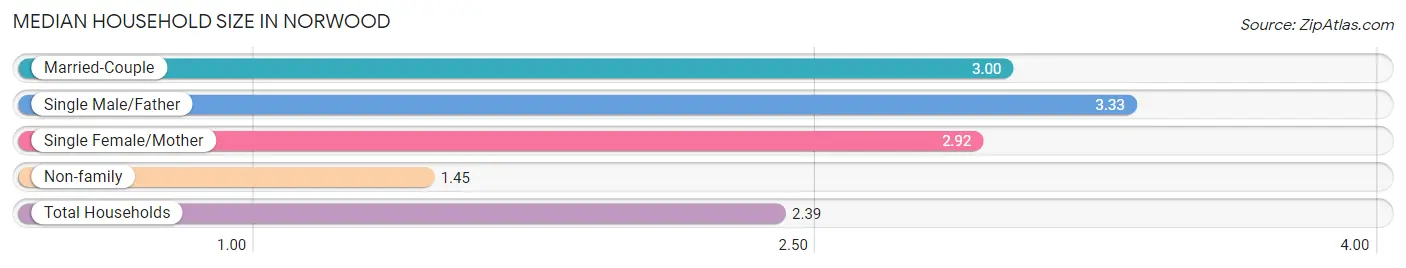
| Household Type | # Households | Household Size |
| Married-Couple | 112 (48.1%) | 3.00 |
| Single Male/Father | 6 (2.6%) | 3.33 |
| Single Female/Mother | 24 (10.3%) | 2.92 |
| Non-family | 91 (39.1%) | 1.45 |
| Total Households | 233 (100.0%) | 2.39 |
Household Size by Marriage Status in Norwood
Out of a total of 233 households in Norwood, 142 (60.9%) are family households, while 91 (39.1%) are nonfamily households. The most numerous type of family households are 2-person households, comprising 49, and the most common type of nonfamily households are 1-person households, comprising 63.
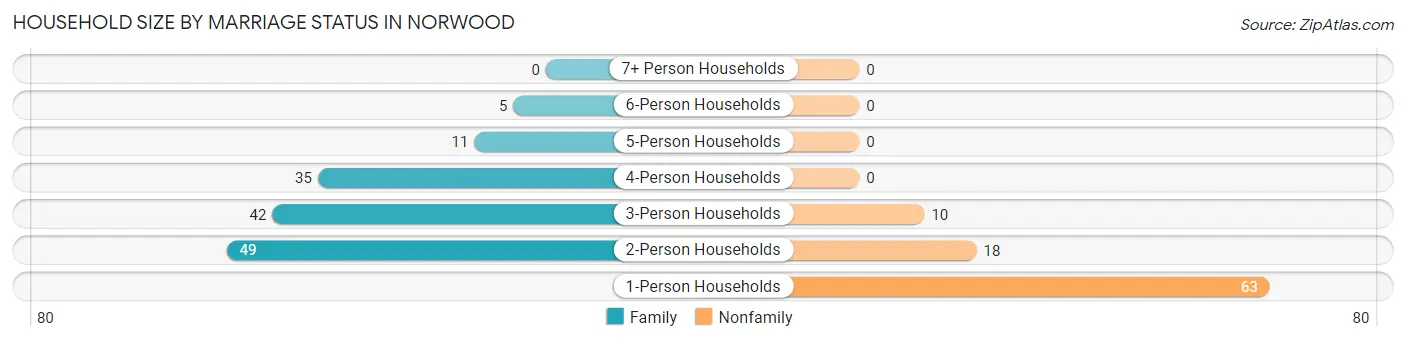
| Household Size | Family Households | Nonfamily Households |
| 1-Person Households | - | 63 (27.0%) |
| 2-Person Households | 49 (21.0%) | 18 (7.7%) |
| 3-Person Households | 42 (18.0%) | 10 (4.3%) |
| 4-Person Households | 35 (15.0%) | 0 (0.0%) |
| 5-Person Households | 11 (4.7%) | 0 (0.0%) |
| 6-Person Households | 5 (2.1%) | 0 (0.0%) |
| 7+ Person Households | 0 (0.0%) | 0 (0.0%) |
| Total | 142 (60.9%) | 91 (39.1%) |
Female Fertility in Norwood
Fertility by Age in Norwood
Average fertility rate in Norwood is 38.0 births per 1,000 women. Women in the age bracket of 20 to 34 years have the highest fertility rate with 77.0 births per 1,000 women. Women in the age bracket of 20 to 34 years acount for 100.0% of all women with births.
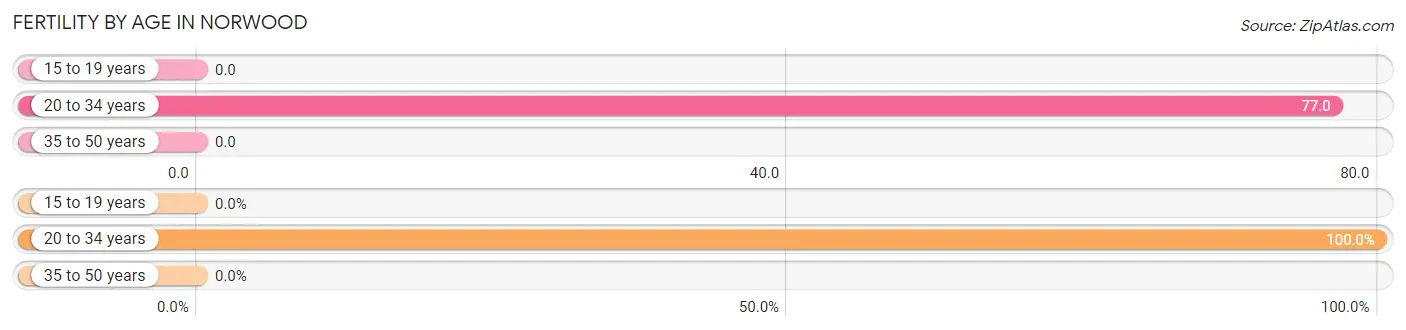
| Age Bracket | Women with Births | Births / 1,000 Women |
| 15 to 19 years | 0 (0.0%) | 0.0 |
| 20 to 34 years | 6 (100.0%) | 77.0 |
| 35 to 50 years | 0 (0.0%) | 0.0 |
| Total | 6 (100.0%) | 38.0 |
Fertility by Age by Marriage Status in Norwood
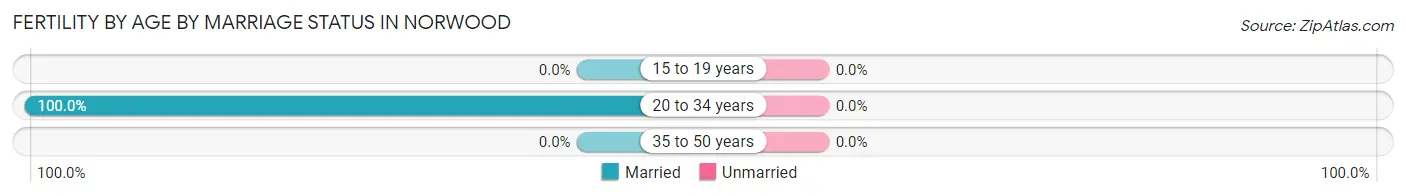
| Age Bracket | Married | Unmarried |
| 15 to 19 years | 0 (0.0%) | 0 (0.0%) |
| 20 to 34 years | 6 (100.0%) | 0 (0.0%) |
| 35 to 50 years | 0 (0.0%) | 0 (0.0%) |
| Total | 6 (100.0%) | 0 (0.0%) |
Fertility by Education in Norwood
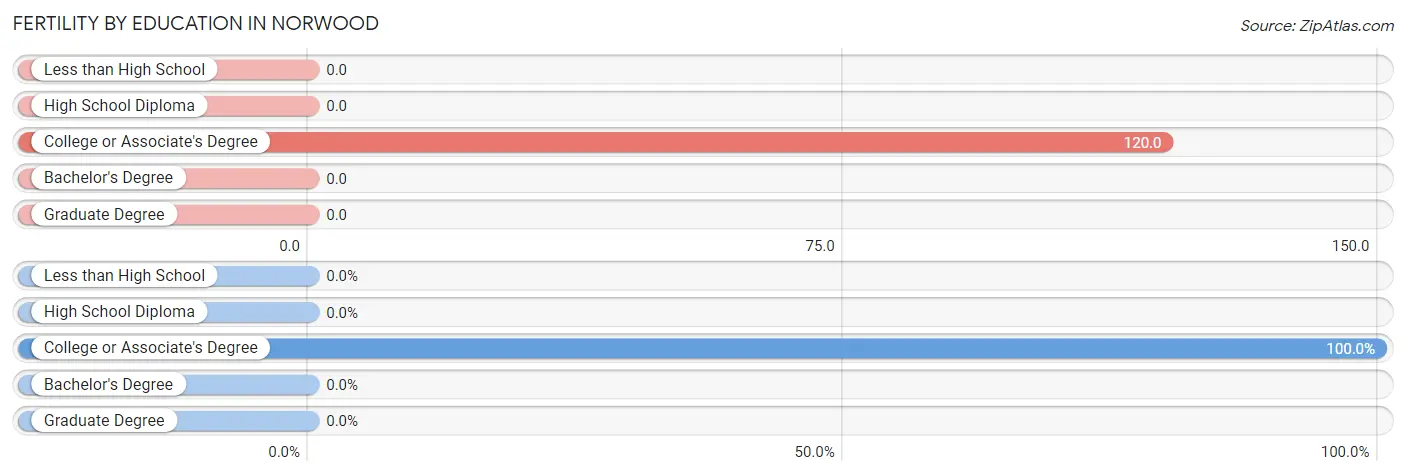
| Educational Attainment | Women with Births | Births / 1,000 Women |
| Less than High School | 0 (0.0%) | 0.0 |
| High School Diploma | 0 (0.0%) | 0.0 |
| College or Associate's Degree | 6 (100.0%) | 120.0 |
| Bachelor's Degree | 0 (0.0%) | 0.0 |
| Graduate Degree | 0 (0.0%) | 0.0 |
| Total | 6 (100.0%) | 38.0 |
Fertility by Education by Marriage Status in Norwood
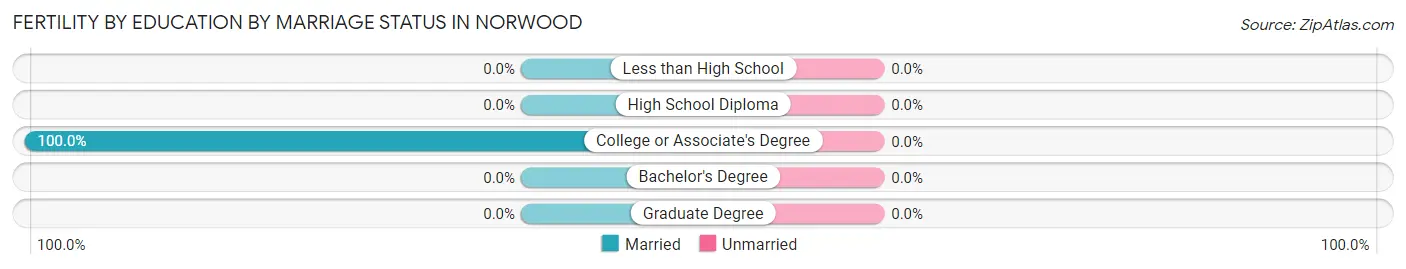
| Educational Attainment | Married | Unmarried |
| Less than High School | 0 (0.0%) | 0 (0.0%) |
| High School Diploma | 0 (0.0%) | 0 (0.0%) |
| College or Associate's Degree | 6 (100.0%) | 0 (0.0%) |
| Bachelor's Degree | 0 (0.0%) | 0 (0.0%) |
| Graduate Degree | 0 (0.0%) | 0 (0.0%) |
| Total | 6 (100.0%) | 0 (0.0%) |
Employment Characteristics in Norwood
Employment by Class of Employer in Norwood
Among the 280 employed individuals in Norwood, private company employees (208 | 74.3%), local government employees (24 | 8.6%), and self-employed (not incorporated) (22 | 7.9%) make up the most common classes of employment.
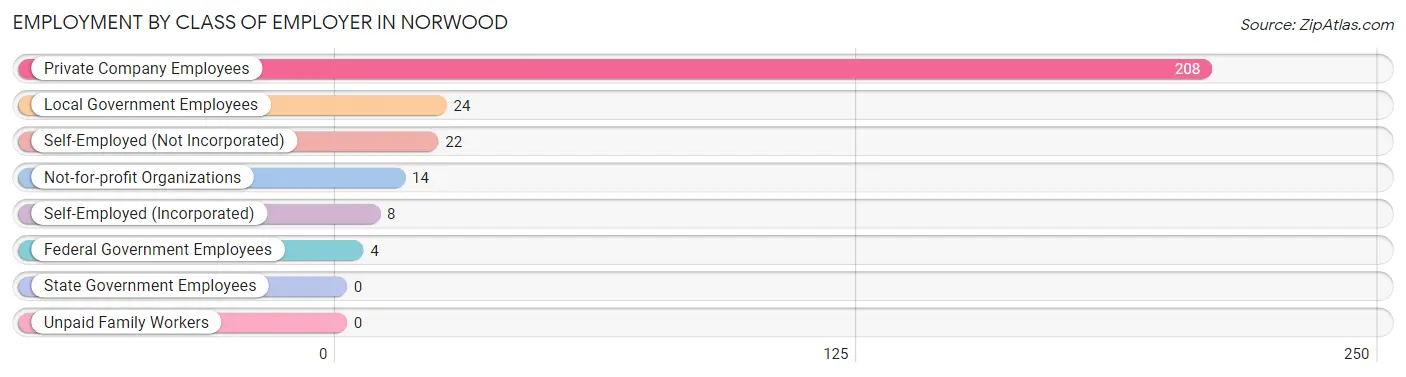
| Employer Class | # Employees | % Employees |
| Private Company Employees | 208 | 74.3% |
| Self-Employed (Incorporated) | 8 | 2.9% |
| Self-Employed (Not Incorporated) | 22 | 7.9% |
| Not-for-profit Organizations | 14 | 5.0% |
| Local Government Employees | 24 | 8.6% |
| State Government Employees | 0 | 0.0% |
| Federal Government Employees | 4 | 1.4% |
| Unpaid Family Workers | 0 | 0.0% |
| Total | 280 | 100.0% |
Employment Status by Age in Norwood
According to the labor force statistics for Norwood, out of the total population over 16 years of age (419), 74.7% or 313 individuals are in the labor force, with 10.5% or 33 of them unemployed. The age group with the highest labor force participation rate is 20 to 24 years, with 100.0% or 18 individuals in the labor force. Within the labor force, the 25 to 29 years age range has the highest percentage of unemployed individuals, with 34.8% or 16 of them being unemployed.
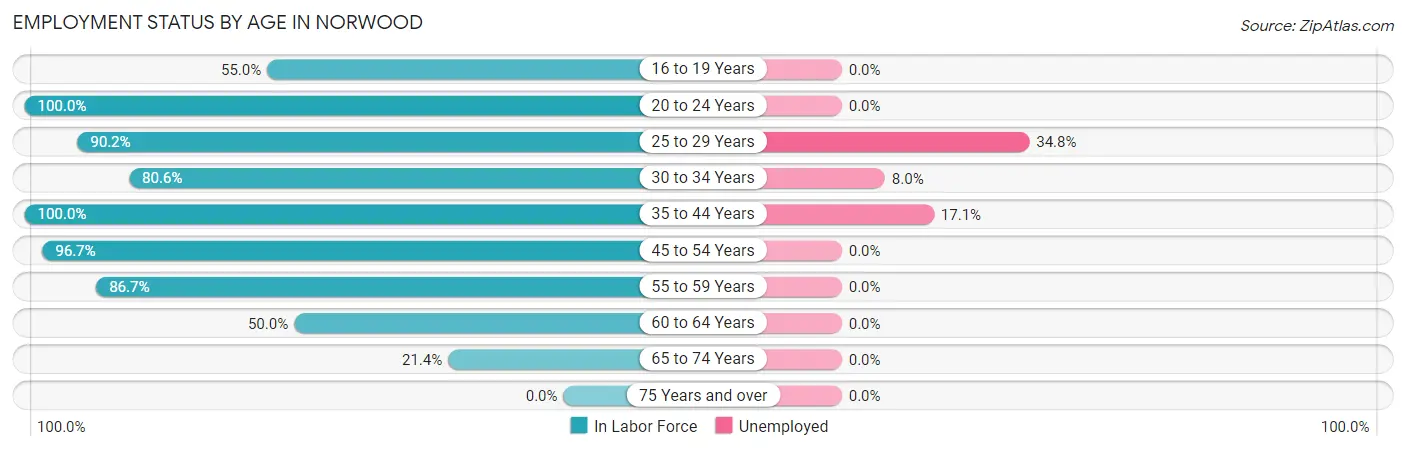
| Age Bracket | In Labor Force | Unemployed |
| 16 to 19 Years | 11 (55.0%) | 0 (0.0%) |
| 20 to 24 Years | 18 (100.0%) | 0 (0.0%) |
| 25 to 29 Years | 46 (90.2%) | 16 (34.8%) |
| 30 to 34 Years | 50 (80.6%) | 4 (8.0%) |
| 35 to 44 Years | 76 (100.0%) | 13 (17.1%) |
| 45 to 54 Years | 59 (96.7%) | 0 (0.0%) |
| 55 to 59 Years | 26 (86.7%) | 0 (0.0%) |
| 60 to 64 Years | 18 (50.0%) | 0 (0.0%) |
| 65 to 74 Years | 9 (21.4%) | 0 (0.0%) |
| 75 Years and over | 0 (0.0%) | 0 (0.0%) |
| Total | 313 (74.7%) | 33 (10.5%) |
Employment Status by Educational Attainment in Norwood
According to labor force statistics for Norwood, 87.0% of individuals (275) out of the total population between 25 and 64 years of age (316) are in the labor force, with 12.0% or 33 of them being unemployed. The group with the highest labor force participation rate are those with the educational attainment of college / associate degree, with 100.0% or 90 individuals in the labor force. Within the labor force, individuals with less than high school education have the highest percentage of unemployment, with 59.3% or 16 of them being unemployed.
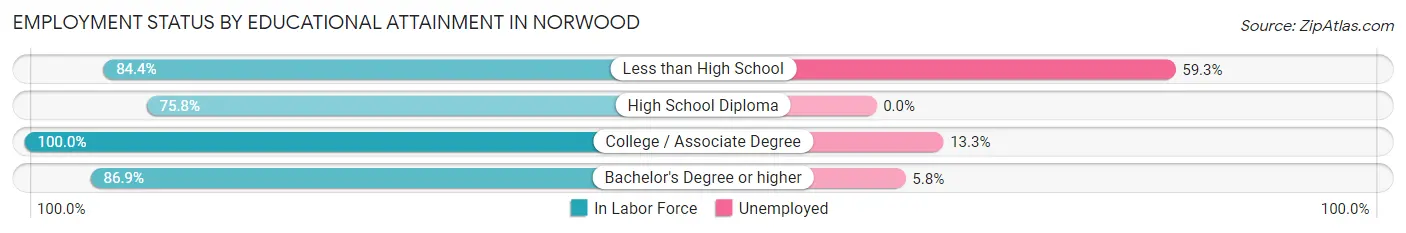
| Educational Attainment | In Labor Force | Unemployed |
| Less than High School | 27 (84.4%) | 19 (59.3%) |
| High School Diploma | 72 (75.8%) | 0 (0.0%) |
| College / Associate Degree | 90 (100.0%) | 12 (13.3%) |
| Bachelor's Degree or higher | 86 (86.9%) | 6 (5.8%) |
| Total | 275 (87.0%) | 38 (12.0%) |
Employment Occupations by Sex in Norwood
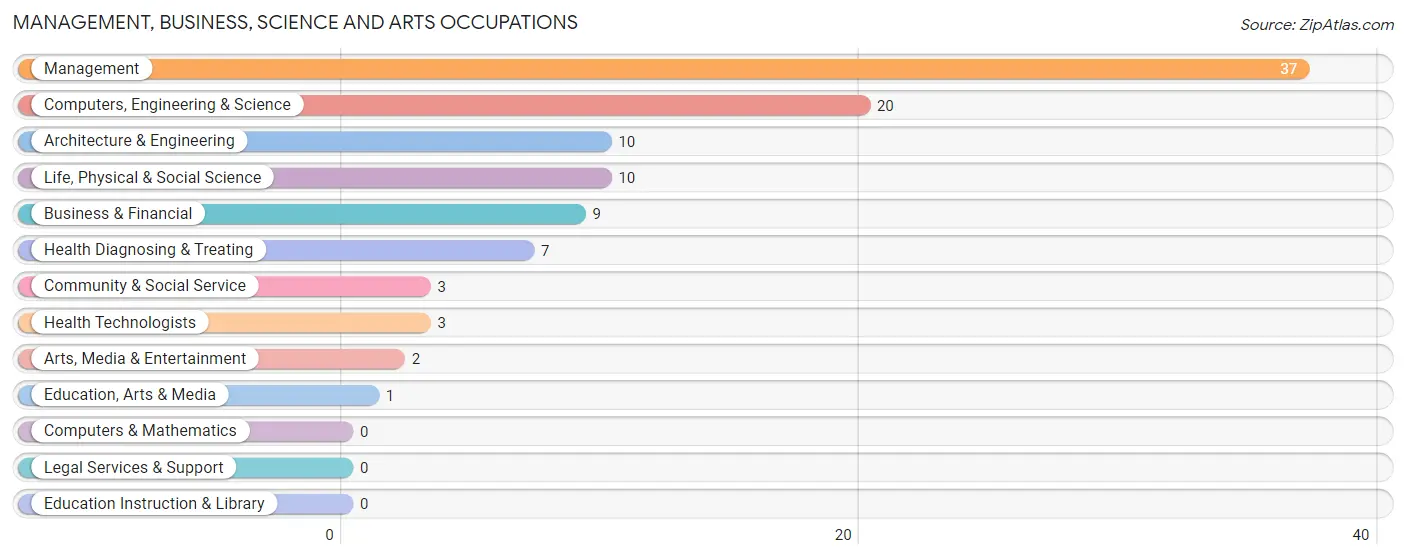
Management, Business, Science and Arts Occupations
The most common Management, Business, Science and Arts occupations in Norwood are Management (37 | 13.2%), Computers, Engineering & Science (20 | 7.1%), Architecture & Engineering (10 | 3.6%), Life, Physical & Social Science (10 | 3.6%), and Business & Financial (9 | 3.2%).
Management, Business, Science and Arts Occupations by Sex
Within the Management, Business, Science and Arts occupations in Norwood, the most male-oriented occupations are Business & Financial (100.0%), Architecture & Engineering (100.0%), and Management (59.5%), while the most female-oriented occupations are Life, Physical & Social Science (100.0%), Community & Social Service (100.0%), and Education, Arts & Media (100.0%).
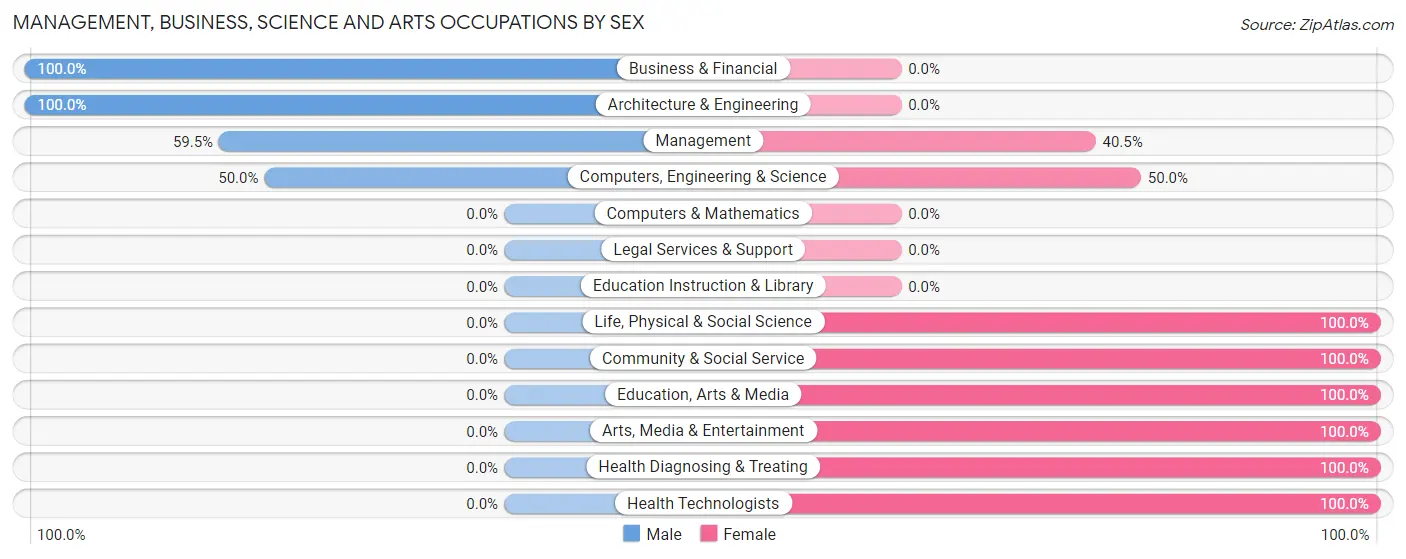
| Occupation | Male | Female |
| Management | 22 (59.5%) | 15 (40.5%) |
| Business & Financial | 9 (100.0%) | 0 (0.0%) |
| Computers, Engineering & Science | 10 (50.0%) | 10 (50.0%) |
| Computers & Mathematics | 0 (0.0%) | 0 (0.0%) |
| Architecture & Engineering | 10 (100.0%) | 0 (0.0%) |
| Life, Physical & Social Science | 0 (0.0%) | 10 (100.0%) |
| Community & Social Service | 0 (0.0%) | 3 (100.0%) |
| Education, Arts & Media | 0 (0.0%) | 1 (100.0%) |
| Legal Services & Support | 0 (0.0%) | 0 (0.0%) |
| Education Instruction & Library | 0 (0.0%) | 0 (0.0%) |
| Arts, Media & Entertainment | 0 (0.0%) | 2 (100.0%) |
| Health Diagnosing & Treating | 0 (0.0%) | 7 (100.0%) |
| Health Technologists | 0 (0.0%) | 3 (100.0%) |
| Total (Category) | 41 (53.9%) | 35 (46.1%) |
| Total (Overall) | 141 (50.4%) | 139 (49.6%) |
Services Occupations
The most common Services occupations in Norwood are Cleaning & Maintenance (31 | 11.1%), Food Preparation & Serving (27 | 9.6%), Personal Care & Service (12 | 4.3%), Security & Protection (7 | 2.5%), and Healthcare Support (4 | 1.4%).
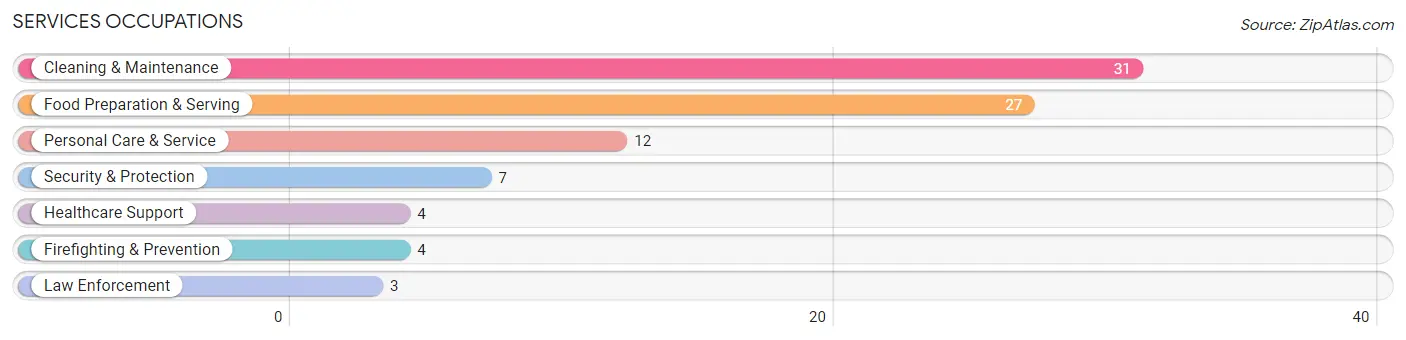
Services Occupations by Sex
Within the Services occupations in Norwood, the most male-oriented occupations are Firefighting & Prevention (100.0%), Security & Protection (57.1%), and Cleaning & Maintenance (45.2%), while the most female-oriented occupations are Healthcare Support (100.0%), Law Enforcement (100.0%), and Food Preparation & Serving (77.8%).
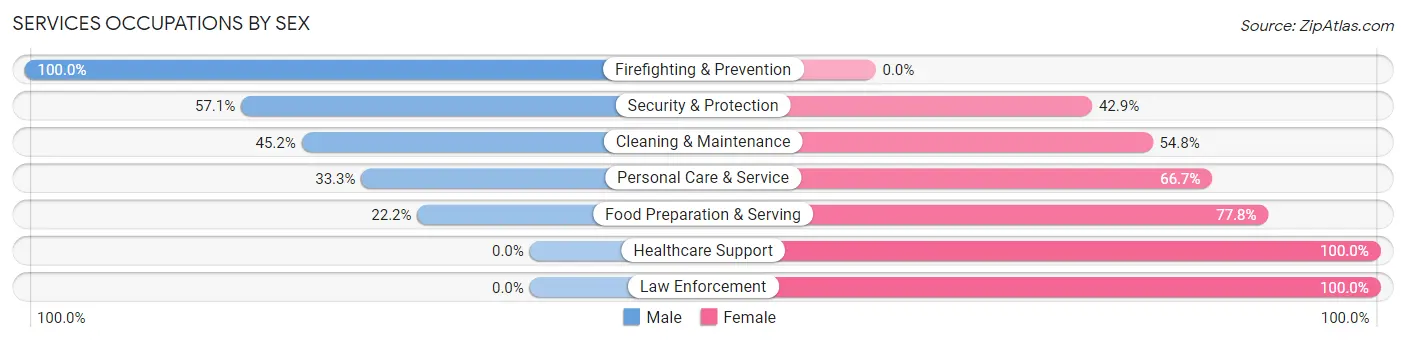
| Occupation | Male | Female |
| Healthcare Support | 0 (0.0%) | 4 (100.0%) |
| Security & Protection | 4 (57.1%) | 3 (42.9%) |
| Firefighting & Prevention | 4 (100.0%) | 0 (0.0%) |
| Law Enforcement | 0 (0.0%) | 3 (100.0%) |
| Food Preparation & Serving | 6 (22.2%) | 21 (77.8%) |
| Cleaning & Maintenance | 14 (45.2%) | 17 (54.8%) |
| Personal Care & Service | 4 (33.3%) | 8 (66.7%) |
| Total (Category) | 28 (34.6%) | 53 (65.4%) |
| Total (Overall) | 141 (50.4%) | 139 (49.6%) |
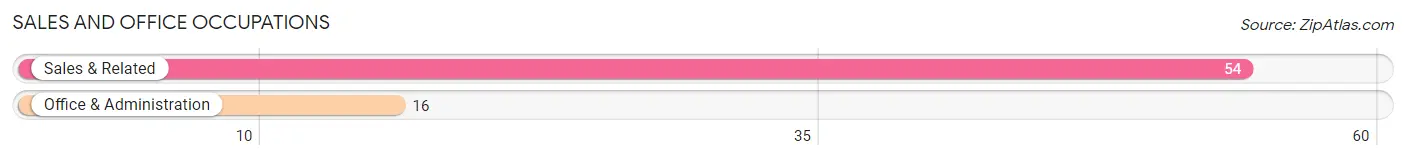
Sales and Office Occupations
The most common Sales and Office occupations in Norwood are Sales & Related (54 | 19.3%), and Office & Administration (16 | 5.7%).
Sales and Office Occupations by Sex
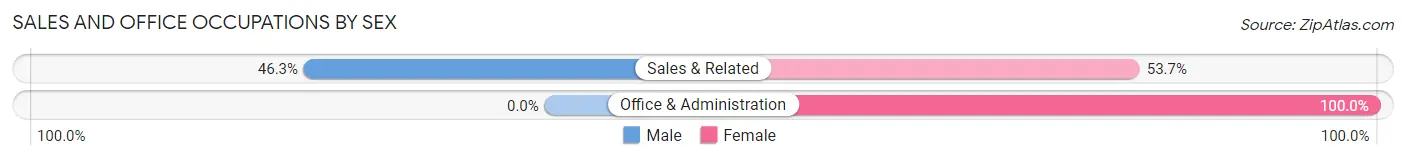
| Occupation | Male | Female |
| Sales & Related | 25 (46.3%) | 29 (53.7%) |
| Office & Administration | 0 (0.0%) | 16 (100.0%) |
| Total (Category) | 25 (35.7%) | 45 (64.3%) |
| Total (Overall) | 141 (50.4%) | 139 (49.6%) |
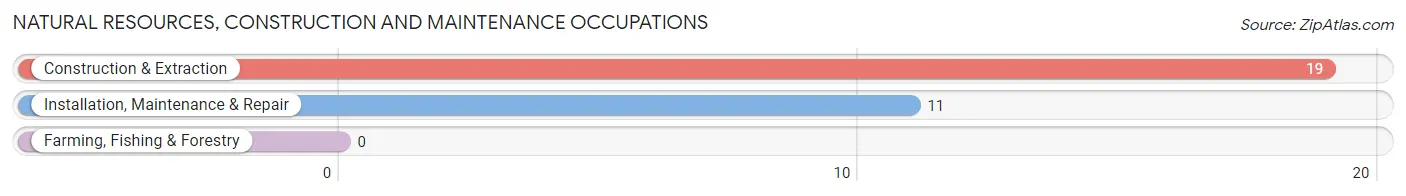
Natural Resources, Construction and Maintenance Occupations
The most common Natural Resources, Construction and Maintenance occupations in Norwood are Construction & Extraction (19 | 6.8%), and Installation, Maintenance & Repair (11 | 3.9%).
Natural Resources, Construction and Maintenance Occupations by Sex
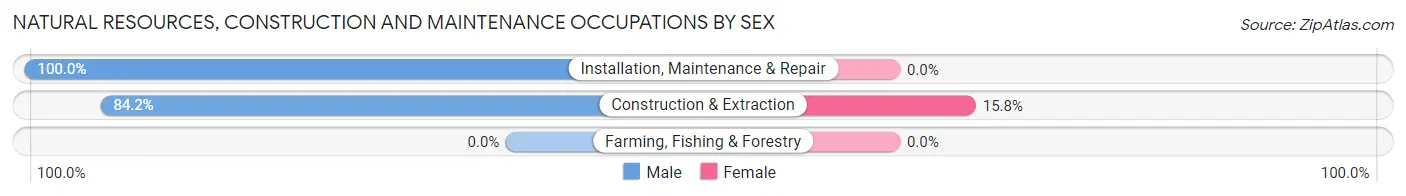
| Occupation | Male | Female |
| Farming, Fishing & Forestry | 0 (0.0%) | 0 (0.0%) |
| Construction & Extraction | 16 (84.2%) | 3 (15.8%) |
| Installation, Maintenance & Repair | 11 (100.0%) | 0 (0.0%) |
| Total (Category) | 27 (90.0%) | 3 (10.0%) |
| Total (Overall) | 141 (50.4%) | 139 (49.6%) |
Production, Transportation and Moving Occupations
The most common Production, Transportation and Moving occupations in Norwood are Production (13 | 4.6%), and Transportation (10 | 3.6%).
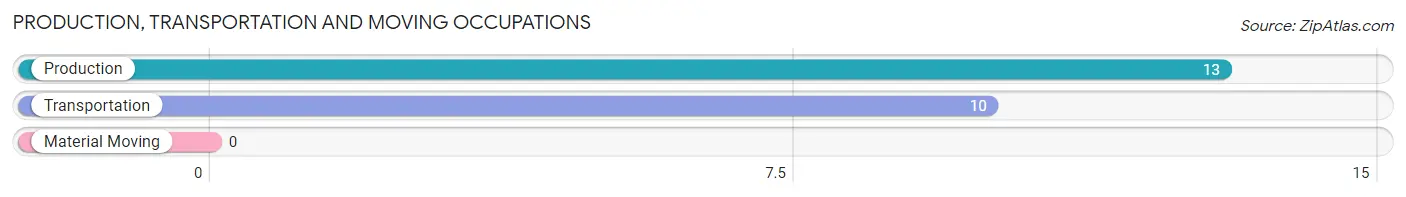
Production, Transportation and Moving Occupations by Sex
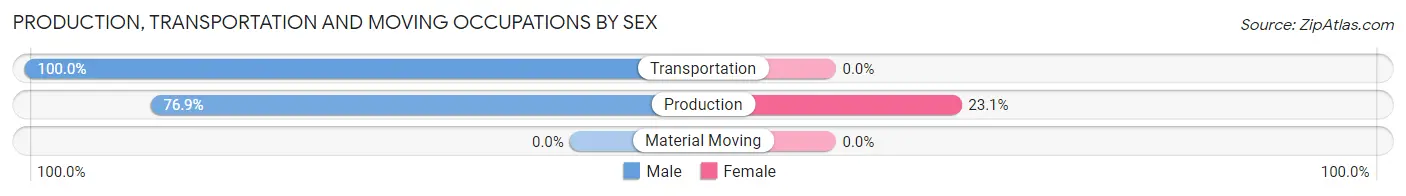
| Occupation | Male | Female |
| Production | 10 (76.9%) | 3 (23.1%) |
| Transportation | 10 (100.0%) | 0 (0.0%) |
| Material Moving | 0 (0.0%) | 0 (0.0%) |
| Total (Category) | 20 (87.0%) | 3 (13.0%) |
| Total (Overall) | 141 (50.4%) | 139 (49.6%) |
Employment Industries by Sex in Norwood
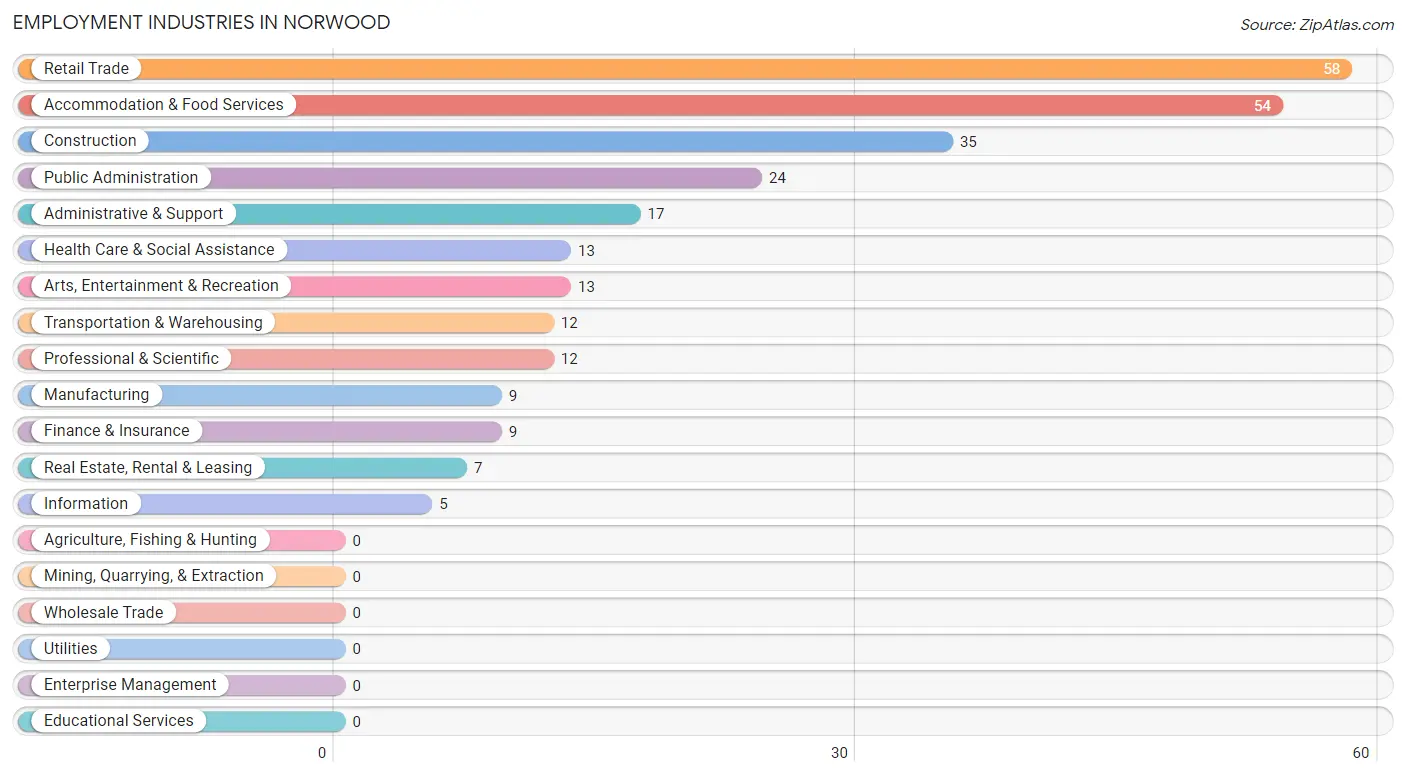
Employment Industries in Norwood
The major employment industries in Norwood include Retail Trade (58 | 20.7%), Accommodation & Food Services (54 | 19.3%), Construction (35 | 12.5%), Public Administration (24 | 8.6%), and Administrative & Support (17 | 6.1%).
Employment Industries by Sex in Norwood
The Norwood industries that see more men than women are Finance & Insurance (100.0%), Real Estate, Rental & Leasing (100.0%), and Professional & Scientific (83.3%), whereas the industries that tend to have a higher number of women are Information (100.0%), Health Care & Social Assistance (100.0%), and Administrative & Support (70.6%).
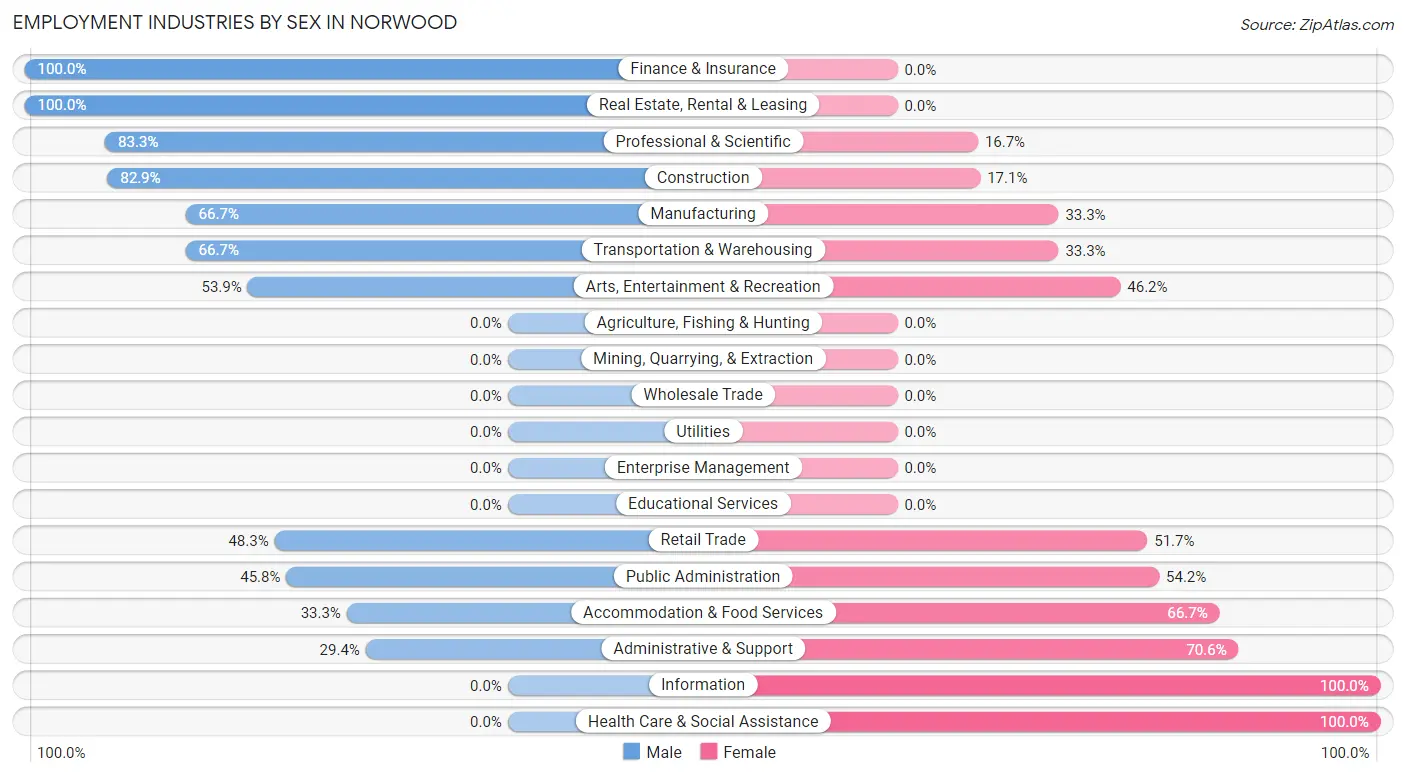
| Industry | Male | Female |
| Agriculture, Fishing & Hunting | 0 (0.0%) | 0 (0.0%) |
| Mining, Quarrying, & Extraction | 0 (0.0%) | 0 (0.0%) |
| Construction | 29 (82.9%) | 6 (17.1%) |
| Manufacturing | 6 (66.7%) | 3 (33.3%) |
| Wholesale Trade | 0 (0.0%) | 0 (0.0%) |
| Retail Trade | 28 (48.3%) | 30 (51.7%) |
| Transportation & Warehousing | 8 (66.7%) | 4 (33.3%) |
| Utilities | 0 (0.0%) | 0 (0.0%) |
| Information | 0 (0.0%) | 5 (100.0%) |
| Finance & Insurance | 9 (100.0%) | 0 (0.0%) |
| Real Estate, Rental & Leasing | 7 (100.0%) | 0 (0.0%) |
| Professional & Scientific | 10 (83.3%) | 2 (16.7%) |
| Enterprise Management | 0 (0.0%) | 0 (0.0%) |
| Administrative & Support | 5 (29.4%) | 12 (70.6%) |
| Educational Services | 0 (0.0%) | 0 (0.0%) |
| Health Care & Social Assistance | 0 (0.0%) | 13 (100.0%) |
| Arts, Entertainment & Recreation | 7 (53.8%) | 6 (46.2%) |
| Accommodation & Food Services | 18 (33.3%) | 36 (66.7%) |
| Public Administration | 11 (45.8%) | 13 (54.2%) |
| Total | 141 (50.4%) | 139 (49.6%) |
Education in Norwood
School Enrollment in Norwood
The most common levels of schooling among the 123 students in Norwood are elementary school (52 | 42.3%), middle school (43 | 35.0%), and high school (23 | 18.7%).
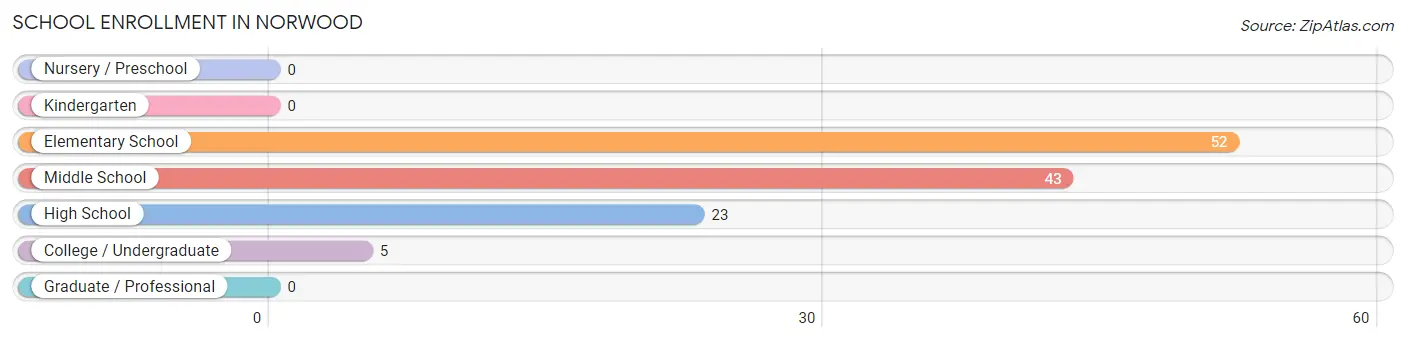
| School Level | # Students | % Students |
| Nursery / Preschool | 0 | 0.0% |
| Kindergarten | 0 | 0.0% |
| Elementary School | 52 | 42.3% |
| Middle School | 43 | 35.0% |
| High School | 23 | 18.7% |
| College / Undergraduate | 5 | 4.1% |
| Graduate / Professional | 0 | 0.0% |
| Total | 123 | 100.0% |
School Enrollment by Age by Funding Source in Norwood
Out of a total of 123 students who are enrolled in schools in Norwood, 13 (10.6%) attend a private institution, while the remaining 110 (89.4%) are enrolled in public schools. The age group of 10 to 14 year olds has the highest likelihood of being enrolled in private schools, with 13 (26.0% in the age bracket) enrolled. Conversely, the age group of 5 to 9 year old has the lowest likelihood of being enrolled in a private school, with 49 (100.0% in the age bracket) attending a public institution.
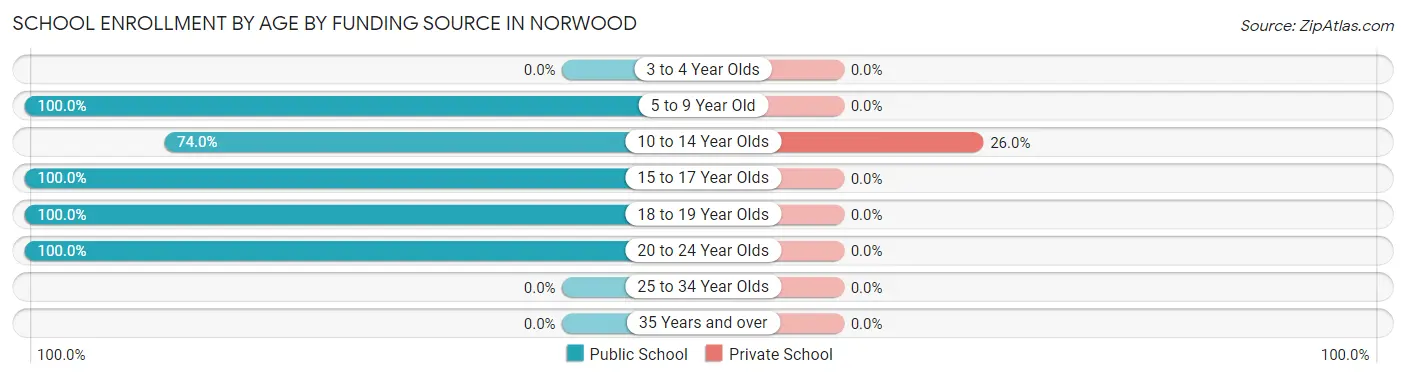
| Age Bracket | Public School | Private School |
| 3 to 4 Year Olds | 0 (0.0%) | 0 (0.0%) |
| 5 to 9 Year Old | 49 (100.0%) | 0 (0.0%) |
| 10 to 14 Year Olds | 37 (74.0%) | 13 (26.0%) |
| 15 to 17 Year Olds | 8 (100.0%) | 0 (0.0%) |
| 18 to 19 Year Olds | 11 (100.0%) | 0 (0.0%) |
| 20 to 24 Year Olds | 5 (100.0%) | 0 (0.0%) |
| 25 to 34 Year Olds | 0 (0.0%) | 0 (0.0%) |
| 35 Years and over | 0 (0.0%) | 0 (0.0%) |
| Total | 110 (89.4%) | 13 (10.6%) |
Educational Attainment by Field of Study in Norwood
Liberal arts & history (19 | 16.1%), bio, nature & agricultural (18 | 15.2%), business (18 | 15.2%), literature & languages (16 | 13.6%), and engineering (14 | 11.9%) are the most common fields of study among 118 individuals in Norwood who have obtained a bachelor's degree or higher.
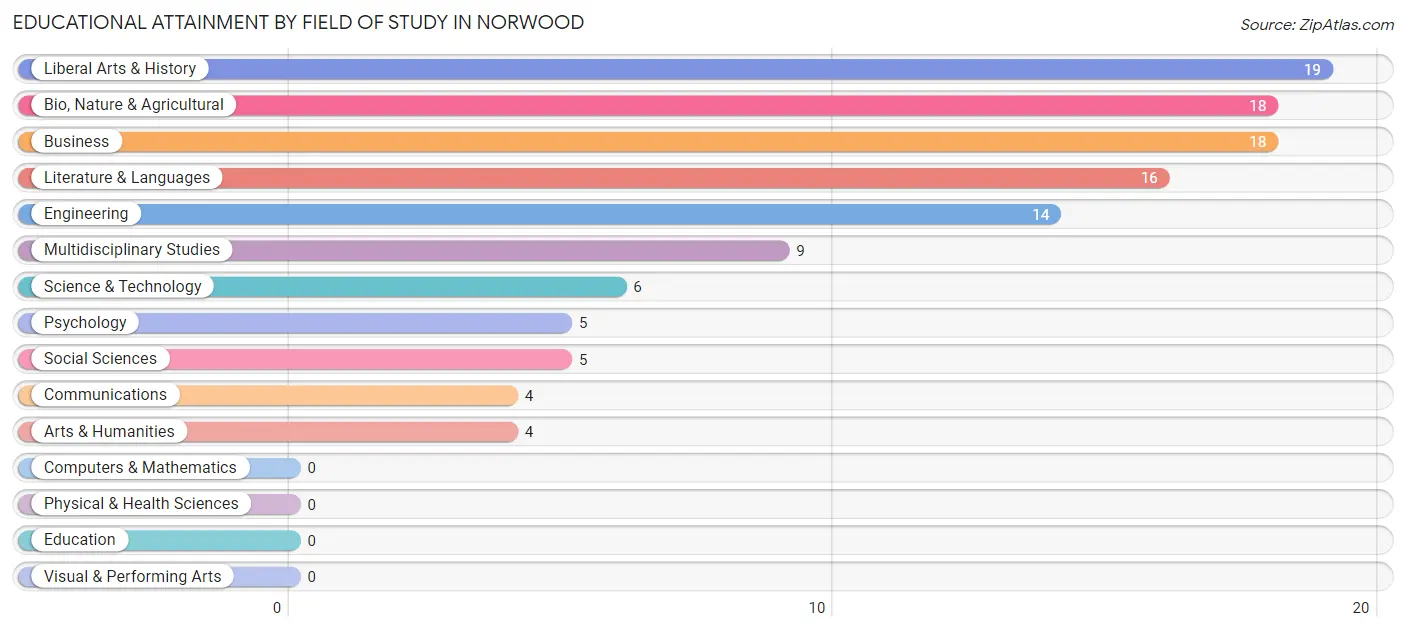
| Field of Study | # Graduates | % Graduates |
| Computers & Mathematics | 0 | 0.0% |
| Bio, Nature & Agricultural | 18 | 15.2% |
| Physical & Health Sciences | 0 | 0.0% |
| Psychology | 5 | 4.2% |
| Social Sciences | 5 | 4.2% |
| Engineering | 14 | 11.9% |
| Multidisciplinary Studies | 9 | 7.6% |
| Science & Technology | 6 | 5.1% |
| Business | 18 | 15.2% |
| Education | 0 | 0.0% |
| Literature & Languages | 16 | 13.6% |
| Liberal Arts & History | 19 | 16.1% |
| Visual & Performing Arts | 0 | 0.0% |
| Communications | 4 | 3.4% |
| Arts & Humanities | 4 | 3.4% |
| Total | 118 | 100.0% |
Transportation & Commute in Norwood
Vehicle Availability by Sex in Norwood
The most prevalent vehicle ownership categories in Norwood are males with 2 vehicles (70, accounting for 49.6%) and females with 2 vehicles (75, making up 50.4%).
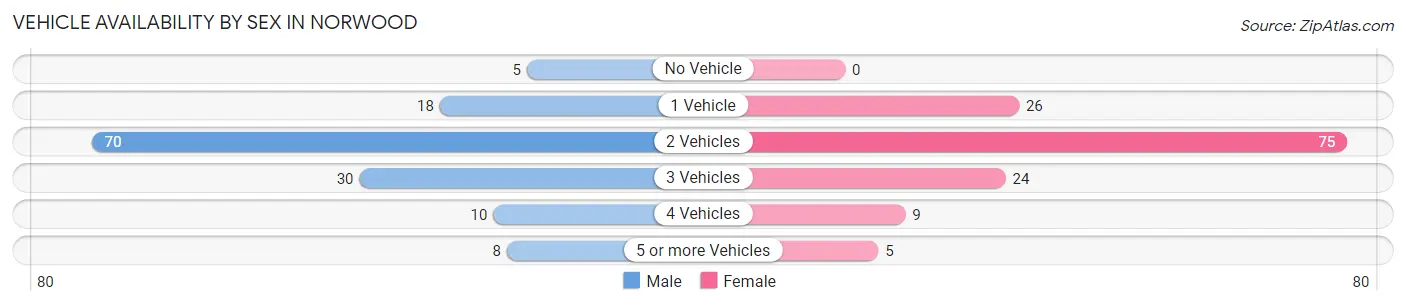
| Vehicles Available | Male | Female |
| No Vehicle | 5 (3.5%) | 0 (0.0%) |
| 1 Vehicle | 18 (12.8%) | 26 (18.7%) |
| 2 Vehicles | 70 (49.6%) | 75 (54.0%) |
| 3 Vehicles | 30 (21.3%) | 24 (17.3%) |
| 4 Vehicles | 10 (7.1%) | 9 (6.5%) |
| 5 or more Vehicles | 8 (5.7%) | 5 (3.6%) |
| Total | 141 (100.0%) | 139 (100.0%) |
Commute Time in Norwood
The most frequently occuring commute durations in Norwood are 45 to 59 minutes (110 commuters, 44.4%), 5 to 9 minutes (57 commuters, 23.0%), and 30 to 34 minutes (21 commuters, 8.5%).
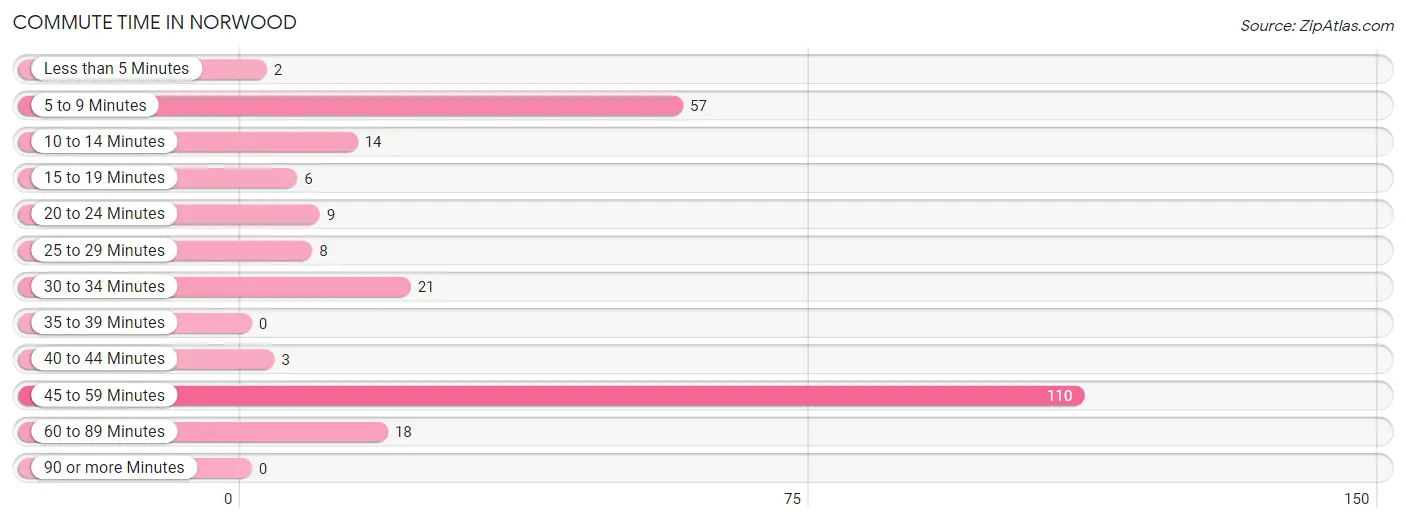
| Commute Time | # Commuters | % Commuters |
| Less than 5 Minutes | 2 | 0.8% |
| 5 to 9 Minutes | 57 | 23.0% |
| 10 to 14 Minutes | 14 | 5.7% |
| 15 to 19 Minutes | 6 | 2.4% |
| 20 to 24 Minutes | 9 | 3.6% |
| 25 to 29 Minutes | 8 | 3.2% |
| 30 to 34 Minutes | 21 | 8.5% |
| 35 to 39 Minutes | 0 | 0.0% |
| 40 to 44 Minutes | 3 | 1.2% |
| 45 to 59 Minutes | 110 | 44.4% |
| 60 to 89 Minutes | 18 | 7.3% |
| 90 or more Minutes | 0 | 0.0% |
Commute Time by Sex in Norwood
The most common commute times in Norwood are 45 to 59 minutes (58 commuters, 43.9%) for males and 45 to 59 minutes (52 commuters, 44.8%) for females.
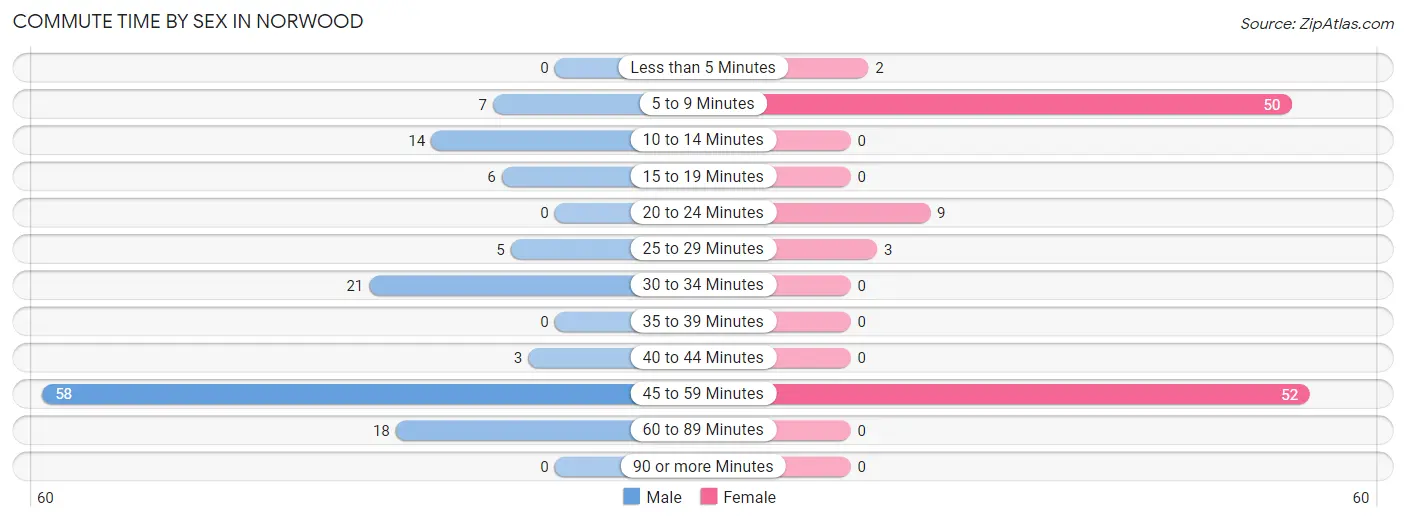
| Commute Time | Male | Female |
| Less than 5 Minutes | 0 (0.0%) | 2 (1.7%) |
| 5 to 9 Minutes | 7 (5.3%) | 50 (43.1%) |
| 10 to 14 Minutes | 14 (10.6%) | 0 (0.0%) |
| 15 to 19 Minutes | 6 (4.5%) | 0 (0.0%) |
| 20 to 24 Minutes | 0 (0.0%) | 9 (7.8%) |
| 25 to 29 Minutes | 5 (3.8%) | 3 (2.6%) |
| 30 to 34 Minutes | 21 (15.9%) | 0 (0.0%) |
| 35 to 39 Minutes | 0 (0.0%) | 0 (0.0%) |
| 40 to 44 Minutes | 3 (2.3%) | 0 (0.0%) |
| 45 to 59 Minutes | 58 (43.9%) | 52 (44.8%) |
| 60 to 89 Minutes | 18 (13.6%) | 0 (0.0%) |
| 90 or more Minutes | 0 (0.0%) | 0 (0.0%) |
Time of Departure to Work by Sex in Norwood
The most frequent times of departure to work in Norwood are 6:00 AM to 6:29 AM (33, 25.0%) for males and 7:00 AM to 7:29 AM (31, 26.7%) for females.
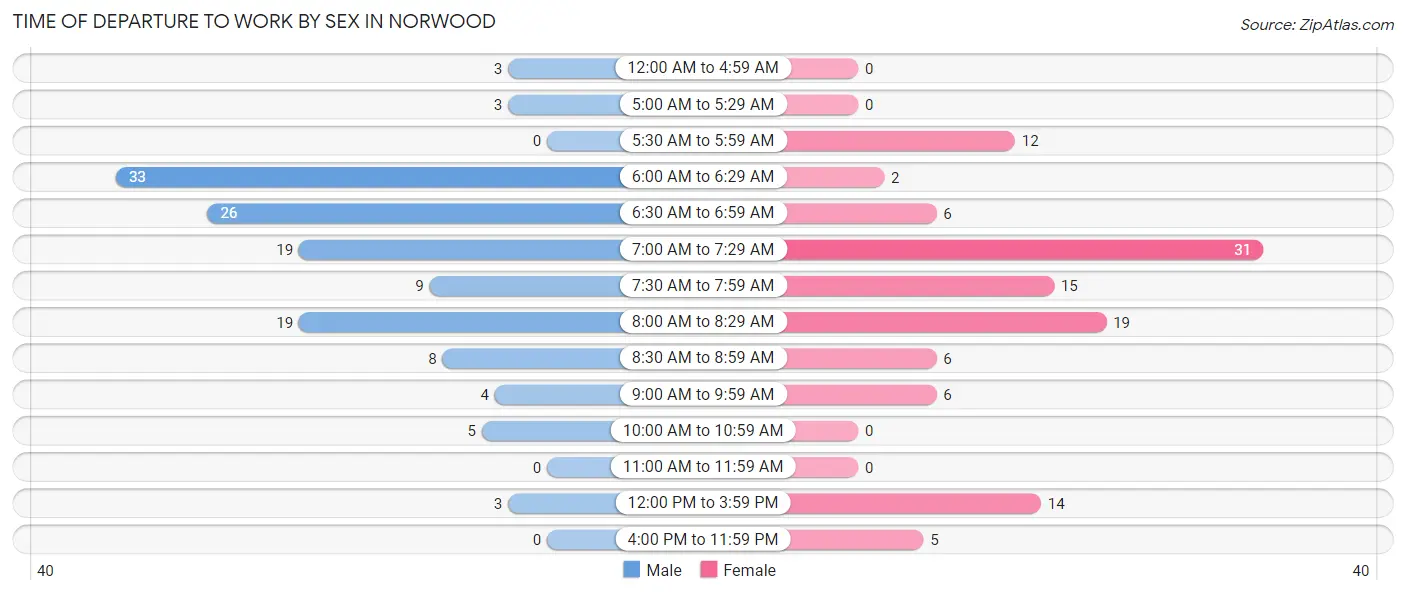
| Time of Departure | Male | Female |
| 12:00 AM to 4:59 AM | 3 (2.3%) | 0 (0.0%) |
| 5:00 AM to 5:29 AM | 3 (2.3%) | 0 (0.0%) |
| 5:30 AM to 5:59 AM | 0 (0.0%) | 12 (10.3%) |
| 6:00 AM to 6:29 AM | 33 (25.0%) | 2 (1.7%) |
| 6:30 AM to 6:59 AM | 26 (19.7%) | 6 (5.2%) |
| 7:00 AM to 7:29 AM | 19 (14.4%) | 31 (26.7%) |
| 7:30 AM to 7:59 AM | 9 (6.8%) | 15 (12.9%) |
| 8:00 AM to 8:29 AM | 19 (14.4%) | 19 (16.4%) |
| 8:30 AM to 8:59 AM | 8 (6.1%) | 6 (5.2%) |
| 9:00 AM to 9:59 AM | 4 (3.0%) | 6 (5.2%) |
| 10:00 AM to 10:59 AM | 5 (3.8%) | 0 (0.0%) |
| 11:00 AM to 11:59 AM | 0 (0.0%) | 0 (0.0%) |
| 12:00 PM to 3:59 PM | 3 (2.3%) | 14 (12.1%) |
| 4:00 PM to 11:59 PM | 0 (0.0%) | 5 (4.3%) |
| Total | 132 (100.0%) | 116 (100.0%) |
Housing Occupancy in Norwood
Occupancy by Ownership in Norwood
Of the total 233 dwellings in Norwood, owner-occupied units account for 120 (51.5%), while renter-occupied units make up 113 (48.5%).
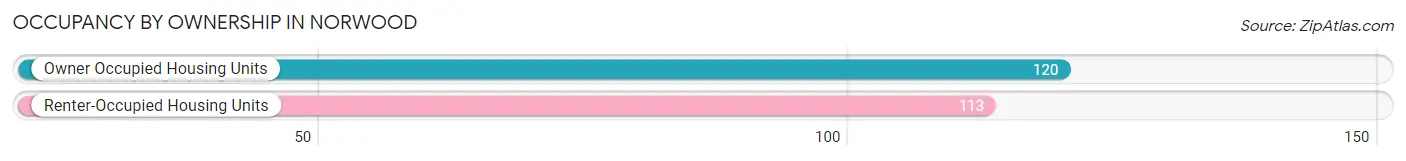
| Occupancy | # Housing Units | % Housing Units |
| Owner Occupied Housing Units | 120 | 51.5% |
| Renter-Occupied Housing Units | 113 | 48.5% |
| Total Occupied Housing Units | 233 | 100.0% |
Occupancy by Household Size in Norwood
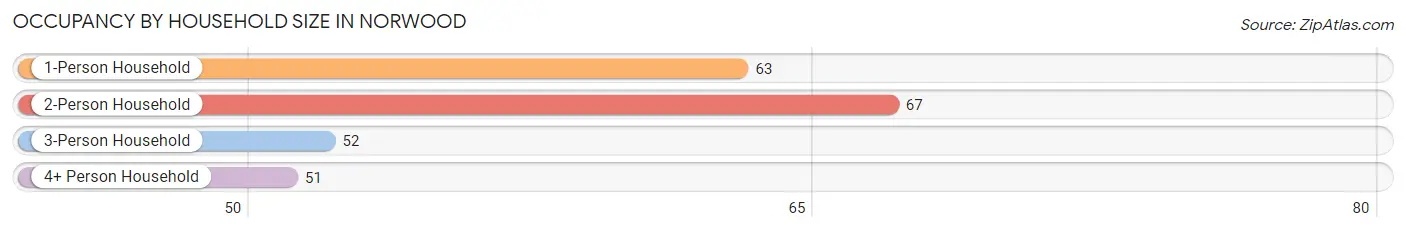
| Household Size | # Housing Units | % Housing Units |
| 1-Person Household | 63 | 27.0% |
| 2-Person Household | 67 | 28.8% |
| 3-Person Household | 52 | 22.3% |
| 4+ Person Household | 51 | 21.9% |
| Total Housing Units | 233 | 100.0% |
Occupancy by Ownership by Household Size in Norwood
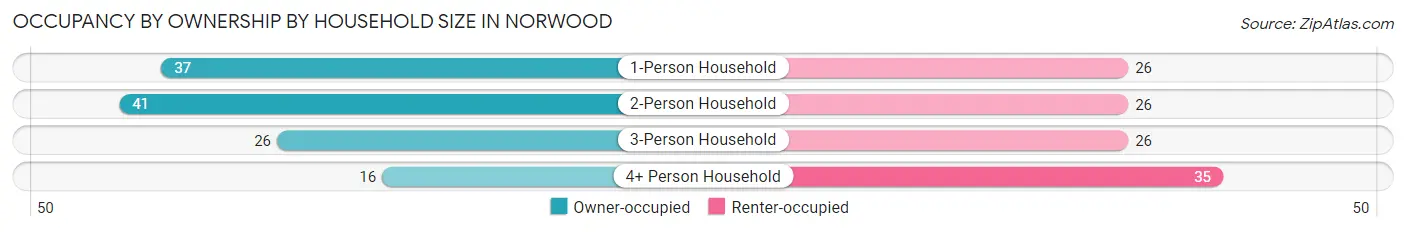
| Household Size | Owner-occupied | Renter-occupied |
| 1-Person Household | 37 (58.7%) | 26 (41.3%) |
| 2-Person Household | 41 (61.2%) | 26 (38.8%) |
| 3-Person Household | 26 (50.0%) | 26 (50.0%) |
| 4+ Person Household | 16 (31.4%) | 35 (68.6%) |
| Total Housing Units | 120 (51.5%) | 113 (48.5%) |
Occupancy by Educational Attainment in Norwood
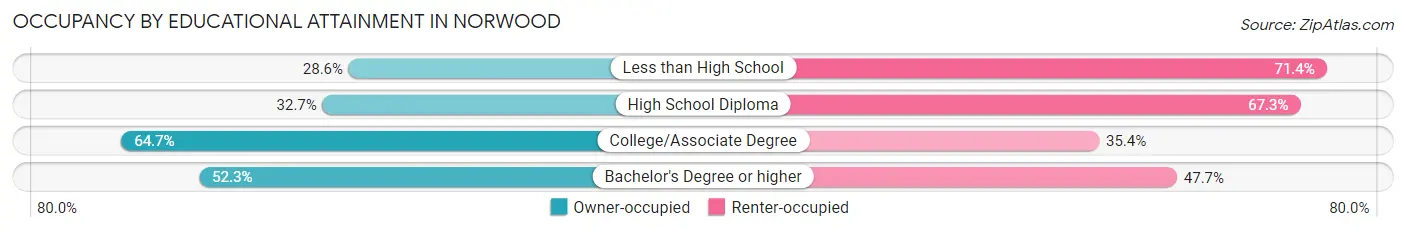
| Household Size | Owner-occupied | Renter-occupied |
| Less than High School | 4 (28.6%) | 10 (71.4%) |
| High School Diploma | 18 (32.7%) | 37 (67.3%) |
| College/Associate Degree | 64 (64.6%) | 35 (35.3%) |
| Bachelor's Degree or higher | 34 (52.3%) | 31 (47.7%) |
Occupancy by Age of Householder in Norwood
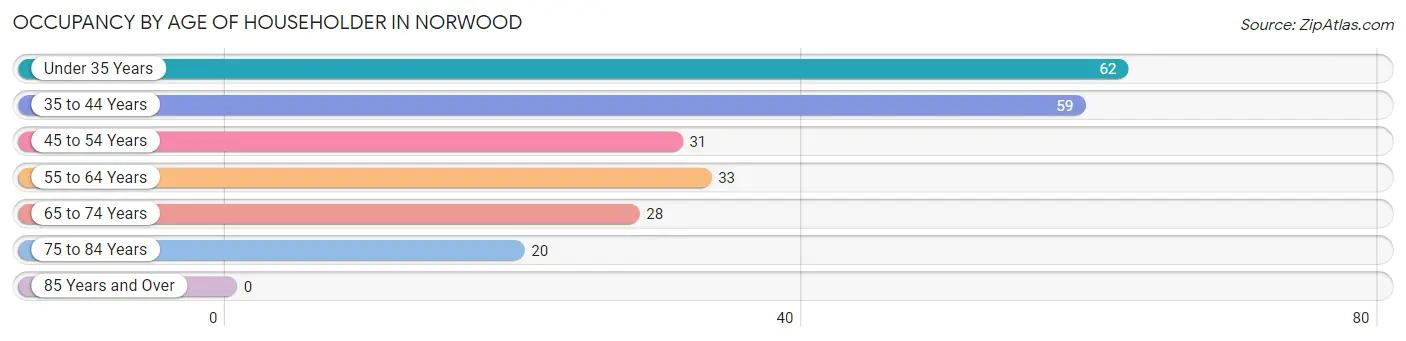
| Age Bracket | # Households | % Households |
| Under 35 Years | 62 | 26.6% |
| 35 to 44 Years | 59 | 25.3% |
| 45 to 54 Years | 31 | 13.3% |
| 55 to 64 Years | 33 | 14.2% |
| 65 to 74 Years | 28 | 12.0% |
| 75 to 84 Years | 20 | 8.6% |
| 85 Years and Over | 0 | 0.0% |
| Total | 233 | 100.0% |
Housing Finances in Norwood
Median Income by Occupancy in Norwood
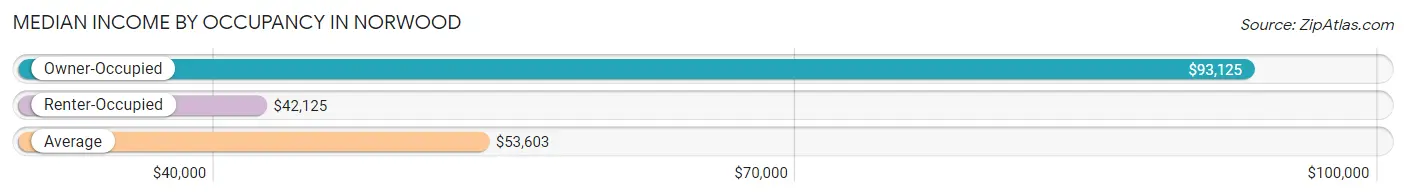
| Occupancy Type | # Households | Median Income |
| Owner-Occupied | 120 (51.5%) | $93,125 |
| Renter-Occupied | 113 (48.5%) | $42,125 |
| Average | 233 (100.0%) | $53,603 |
Occupancy by Householder Income Bracket in Norwood
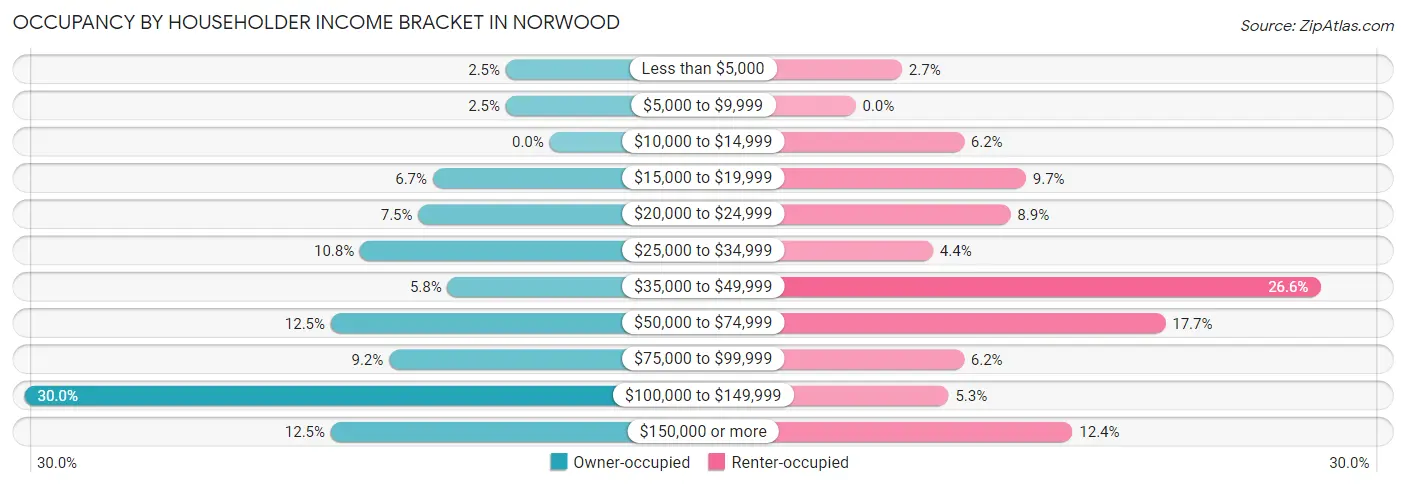
| Income Bracket | Owner-occupied | Renter-occupied |
| Less than $5,000 | 3 (2.5%) | 3 (2.6%) |
| $5,000 to $9,999 | 3 (2.5%) | 0 (0.0%) |
| $10,000 to $14,999 | 0 (0.0%) | 7 (6.2%) |
| $15,000 to $19,999 | 8 (6.7%) | 11 (9.7%) |
| $20,000 to $24,999 | 9 (7.5%) | 10 (8.8%) |
| $25,000 to $34,999 | 13 (10.8%) | 5 (4.4%) |
| $35,000 to $49,999 | 7 (5.8%) | 30 (26.6%) |
| $50,000 to $74,999 | 15 (12.5%) | 20 (17.7%) |
| $75,000 to $99,999 | 11 (9.2%) | 7 (6.2%) |
| $100,000 to $149,999 | 36 (30.0%) | 6 (5.3%) |
| $150,000 or more | 15 (12.5%) | 14 (12.4%) |
| Total | 120 (100.0%) | 113 (100.0%) |
Monthly Housing Cost Tiers in Norwood
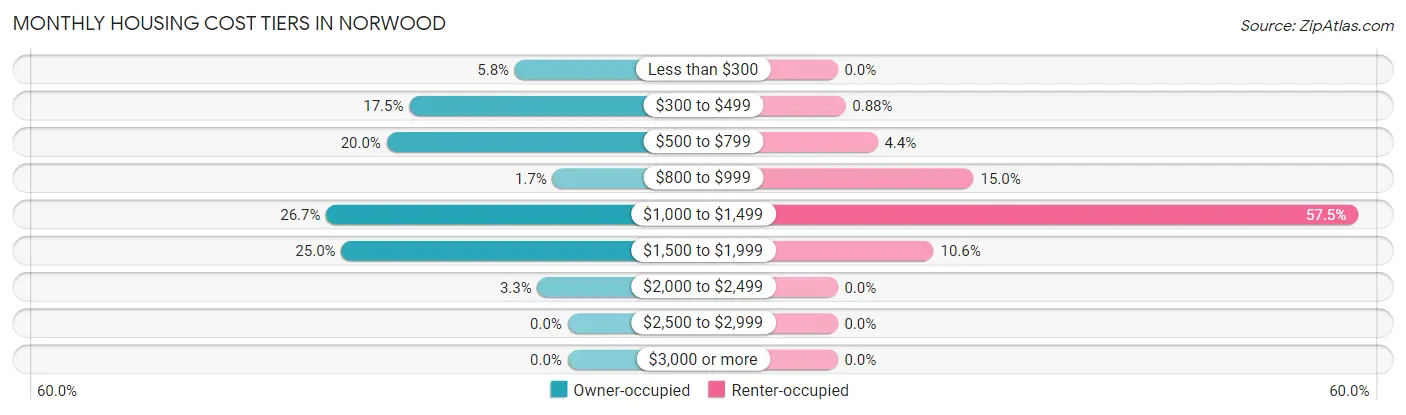
| Monthly Cost | Owner-occupied | Renter-occupied |
| Less than $300 | 7 (5.8%) | 0 (0.0%) |
| $300 to $499 | 21 (17.5%) | 1 (0.9%) |
| $500 to $799 | 24 (20.0%) | 5 (4.4%) |
| $800 to $999 | 2 (1.7%) | 17 (15.0%) |
| $1,000 to $1,499 | 32 (26.7%) | 65 (57.5%) |
| $1,500 to $1,999 | 30 (25.0%) | 12 (10.6%) |
| $2,000 to $2,499 | 4 (3.3%) | 0 (0.0%) |
| $2,500 to $2,999 | 0 (0.0%) | 0 (0.0%) |
| $3,000 or more | 0 (0.0%) | 0 (0.0%) |
| Total | 120 (100.0%) | 113 (100.0%) |
Physical Housing Characteristics in Norwood
Housing Structures in Norwood
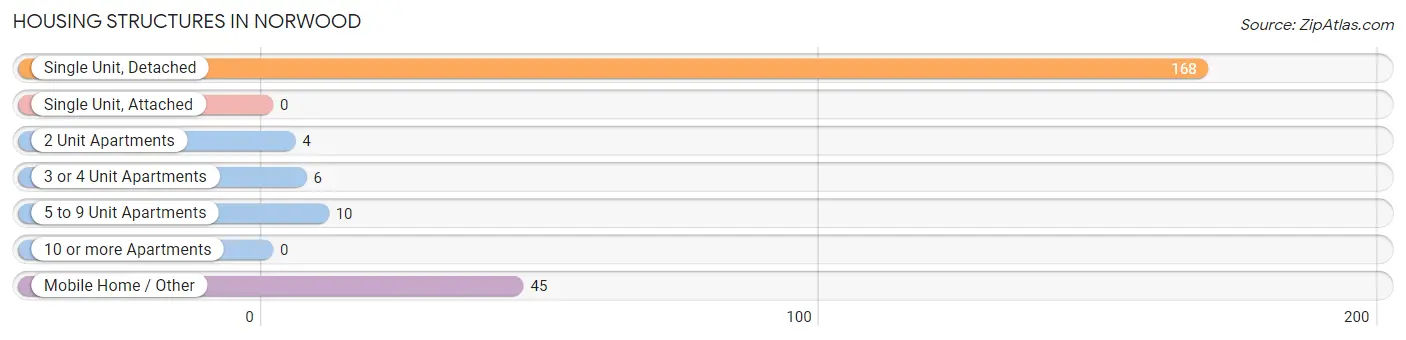
| Structure Type | # Housing Units | % Housing Units |
| Single Unit, Detached | 168 | 72.1% |
| Single Unit, Attached | 0 | 0.0% |
| 2 Unit Apartments | 4 | 1.7% |
| 3 or 4 Unit Apartments | 6 | 2.6% |
| 5 to 9 Unit Apartments | 10 | 4.3% |
| 10 or more Apartments | 0 | 0.0% |
| Mobile Home / Other | 45 | 19.3% |
| Total | 233 | 100.0% |
Housing Structures by Occupancy in Norwood
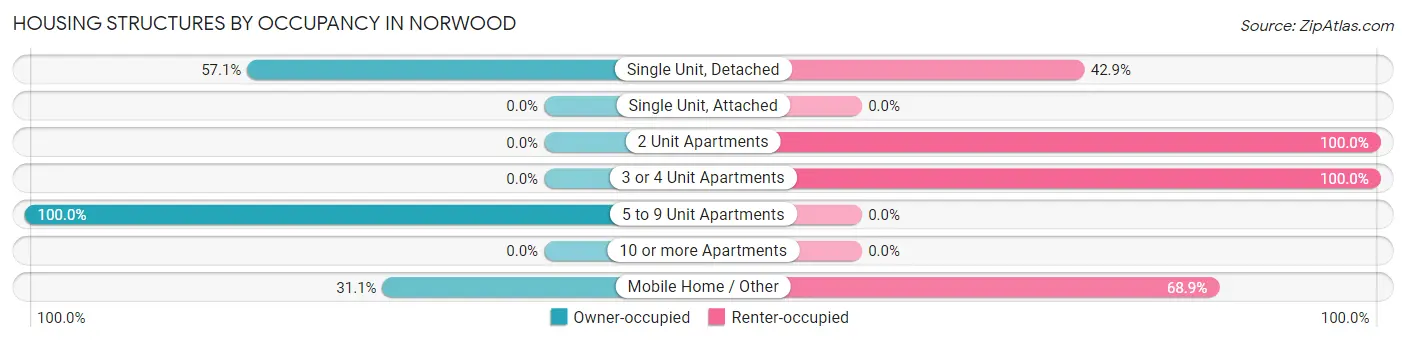
| Structure Type | Owner-occupied | Renter-occupied |
| Single Unit, Detached | 96 (57.1%) | 72 (42.9%) |
| Single Unit, Attached | 0 (0.0%) | 0 (0.0%) |
| 2 Unit Apartments | 0 (0.0%) | 4 (100.0%) |
| 3 or 4 Unit Apartments | 0 (0.0%) | 6 (100.0%) |
| 5 to 9 Unit Apartments | 10 (100.0%) | 0 (0.0%) |
| 10 or more Apartments | 0 (0.0%) | 0 (0.0%) |
| Mobile Home / Other | 14 (31.1%) | 31 (68.9%) |
| Total | 120 (51.5%) | 113 (48.5%) |
Housing Structures by Number of Rooms in Norwood
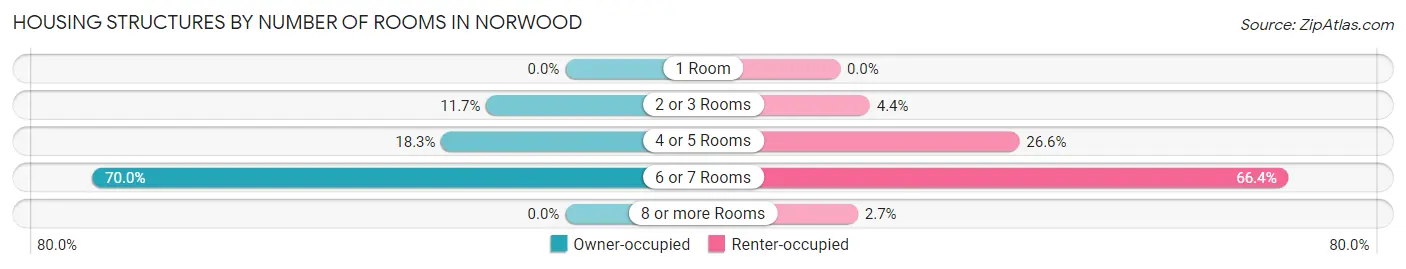
| Number of Rooms | Owner-occupied | Renter-occupied |
| 1 Room | 0 (0.0%) | 0 (0.0%) |
| 2 or 3 Rooms | 14 (11.7%) | 5 (4.4%) |
| 4 or 5 Rooms | 22 (18.3%) | 30 (26.6%) |
| 6 or 7 Rooms | 84 (70.0%) | 75 (66.4%) |
| 8 or more Rooms | 0 (0.0%) | 3 (2.6%) |
| Total | 120 (100.0%) | 113 (100.0%) |
Housing Structure by Heating Type in Norwood
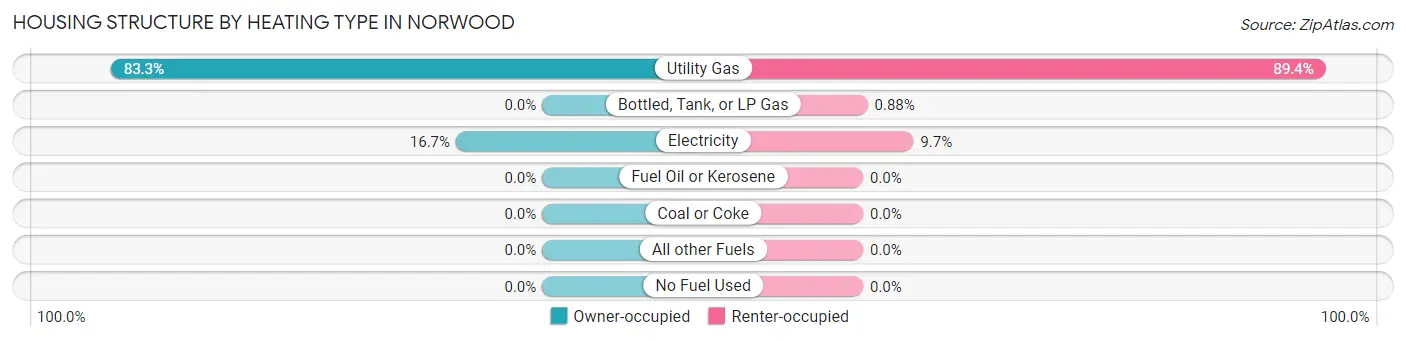
| Heating Type | Owner-occupied | Renter-occupied |
| Utility Gas | 100 (83.3%) | 101 (89.4%) |
| Bottled, Tank, or LP Gas | 0 (0.0%) | 1 (0.9%) |
| Electricity | 20 (16.7%) | 11 (9.7%) |
| Fuel Oil or Kerosene | 0 (0.0%) | 0 (0.0%) |
| Coal or Coke | 0 (0.0%) | 0 (0.0%) |
| All other Fuels | 0 (0.0%) | 0 (0.0%) |
| No Fuel Used | 0 (0.0%) | 0 (0.0%) |
| Total | 120 (100.0%) | 113 (100.0%) |
Household Vehicle Usage in Norwood
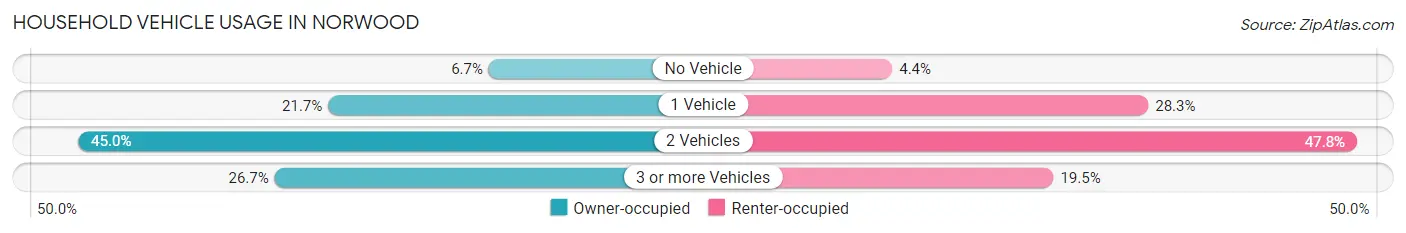
| Vehicles per Household | Owner-occupied | Renter-occupied |
| No Vehicle | 8 (6.7%) | 5 (4.4%) |
| 1 Vehicle | 26 (21.7%) | 32 (28.3%) |
| 2 Vehicles | 54 (45.0%) | 54 (47.8%) |
| 3 or more Vehicles | 32 (26.7%) | 22 (19.5%) |
| Total | 120 (100.0%) | 113 (100.0%) |
Real Estate & Mortgages in Norwood
Real Estate and Mortgage Overview in Norwood
| Characteristic | Without Mortgage | With Mortgage |
| Housing Units | 34 | 86 |
| Median Property Value | $415,400 | $257,100 |
| Median Household Income | $99,167 | $7 |
| Monthly Housing Costs | $448 | $0 |
| Real Estate Taxes | $1,077 | $0 |
Property Value by Mortgage Status in Norwood
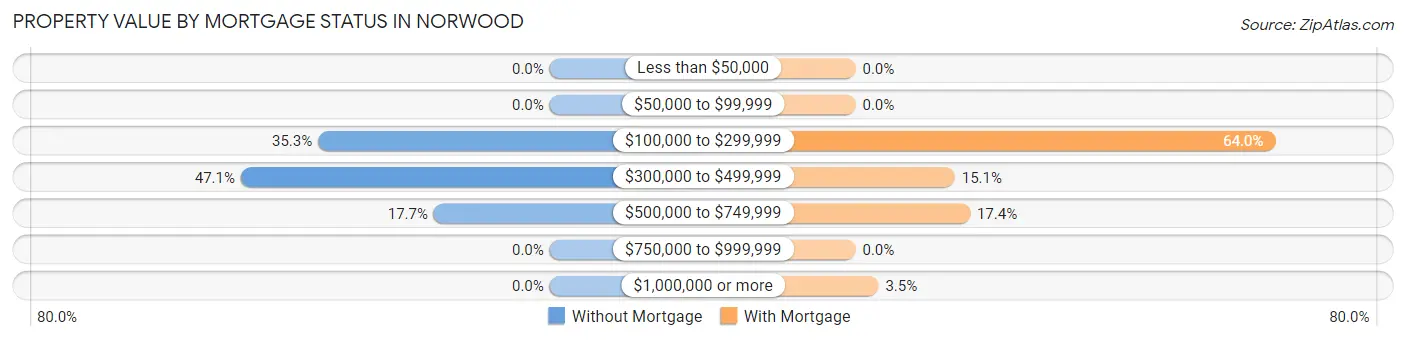
| Property Value | Without Mortgage | With Mortgage |
| Less than $50,000 | 0 (0.0%) | 0 (0.0%) |
| $50,000 to $99,999 | 0 (0.0%) | 0 (0.0%) |
| $100,000 to $299,999 | 12 (35.3%) | 55 (63.9%) |
| $300,000 to $499,999 | 16 (47.1%) | 13 (15.1%) |
| $500,000 to $749,999 | 6 (17.6%) | 15 (17.4%) |
| $750,000 to $999,999 | 0 (0.0%) | 0 (0.0%) |
| $1,000,000 or more | 0 (0.0%) | 3 (3.5%) |
| Total | 34 (100.0%) | 86 (100.0%) |
Household Income by Mortgage Status in Norwood
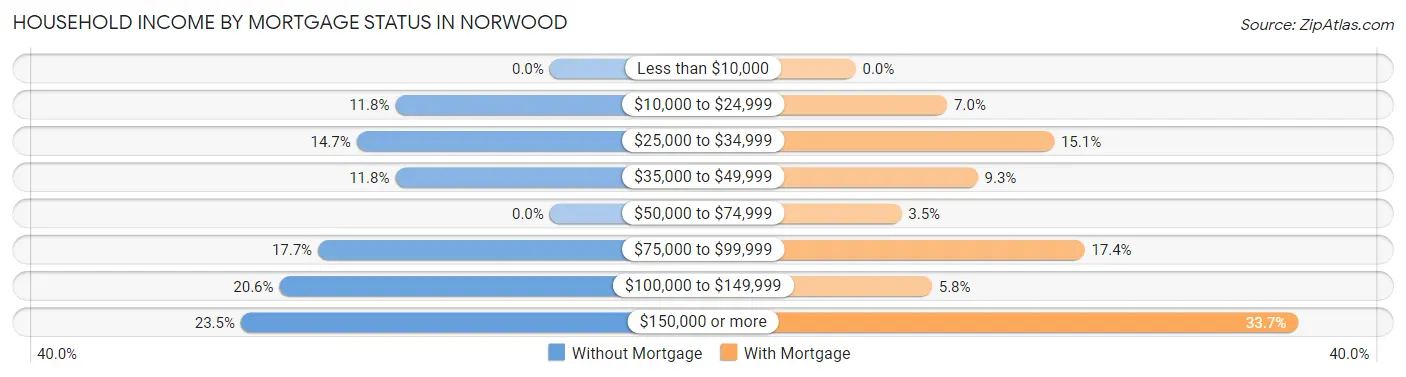
| Household Income | Without Mortgage | With Mortgage |
| Less than $10,000 | 0 (0.0%) | 0 (0.0%) |
| $10,000 to $24,999 | 4 (11.8%) | 6 (7.0%) |
| $25,000 to $34,999 | 5 (14.7%) | 13 (15.1%) |
| $35,000 to $49,999 | 4 (11.8%) | 8 (9.3%) |
| $50,000 to $74,999 | 0 (0.0%) | 3 (3.5%) |
| $75,000 to $99,999 | 6 (17.6%) | 15 (17.4%) |
| $100,000 to $149,999 | 7 (20.6%) | 5 (5.8%) |
| $150,000 or more | 8 (23.5%) | 29 (33.7%) |
| Total | 34 (100.0%) | 86 (100.0%) |
Property Value to Household Income Ratio in Norwood

| Value-to-Income Ratio | Without Mortgage | With Mortgage |
| Less than 2.0x | 12 (35.3%) | 68,750 (79,941.9%) |
| 2.0x to 2.9x | 3 (8.8%) | 8 (9.3%) |
| 3.0x to 3.9x | 0 (0.0%) | 22 (25.6%) |
| 4.0x or more | 19 (55.9%) | 7 (8.1%) |
| Total | 34 (100.0%) | 86 (100.0%) |
Real Estate Taxes by Mortgage Status in Norwood
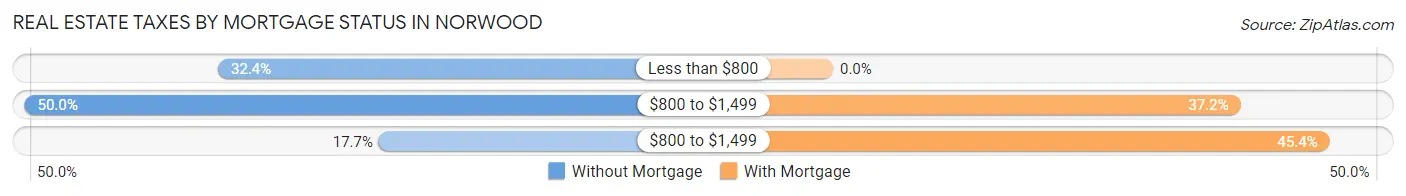
| Property Taxes | Without Mortgage | With Mortgage |
| Less than $800 | 11 (32.4%) | 0 (0.0%) |
| $800 to $1,499 | 17 (50.0%) | 32 (37.2%) |
| $800 to $1,499 | 6 (17.6%) | 39 (45.4%) |
| Total | 34 (100.0%) | 86 (100.0%) |
Health & Disability in Norwood
Health Insurance Coverage by Age in Norwood
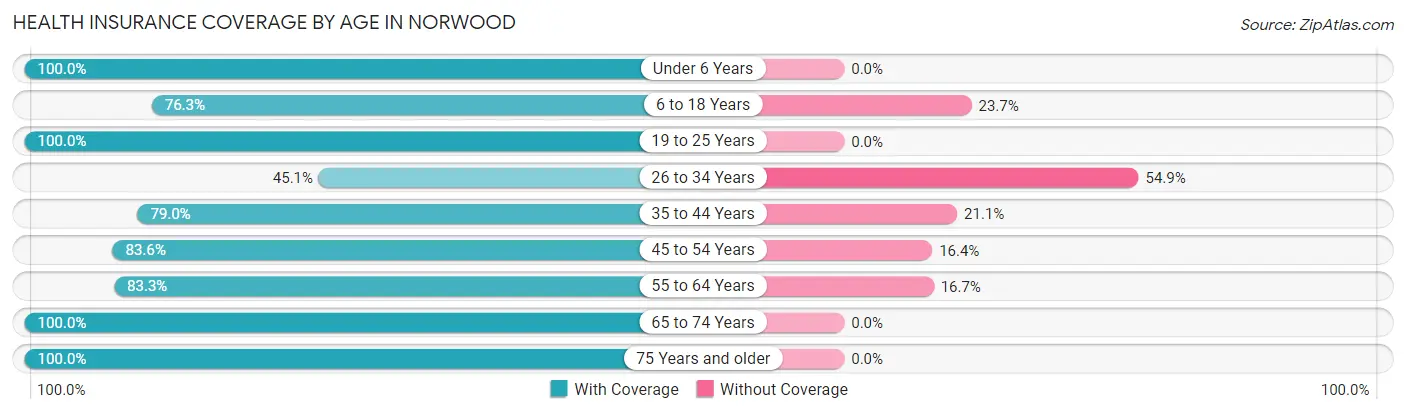
| Age Bracket | With Coverage | Without Coverage |
| Under 6 Years | 37 (100.0%) | 0 (0.0%) |
| 6 to 18 Years | 90 (76.3%) | 28 (23.7%) |
| 19 to 25 Years | 22 (100.0%) | 0 (0.0%) |
| 26 to 34 Years | 51 (45.1%) | 62 (54.9%) |
| 35 to 44 Years | 60 (78.9%) | 16 (21.0%) |
| 45 to 54 Years | 51 (83.6%) | 10 (16.4%) |
| 55 to 64 Years | 55 (83.3%) | 11 (16.7%) |
| 65 to 74 Years | 42 (100.0%) | 0 (0.0%) |
| 75 Years and older | 23 (100.0%) | 0 (0.0%) |
| Total | 431 (77.2%) | 127 (22.8%) |
Health Insurance Coverage by Citizenship Status in Norwood
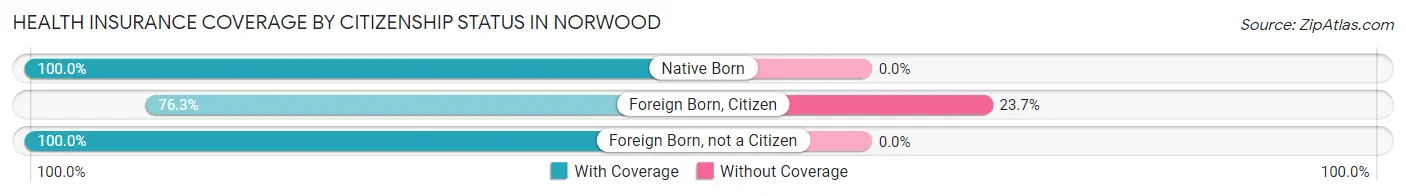
| Citizenship Status | With Coverage | Without Coverage |
| Native Born | 37 (100.0%) | 0 (0.0%) |
| Foreign Born, Citizen | 90 (76.3%) | 28 (23.7%) |
| Foreign Born, not a Citizen | 22 (100.0%) | 0 (0.0%) |
Health Insurance Coverage by Household Income in Norwood
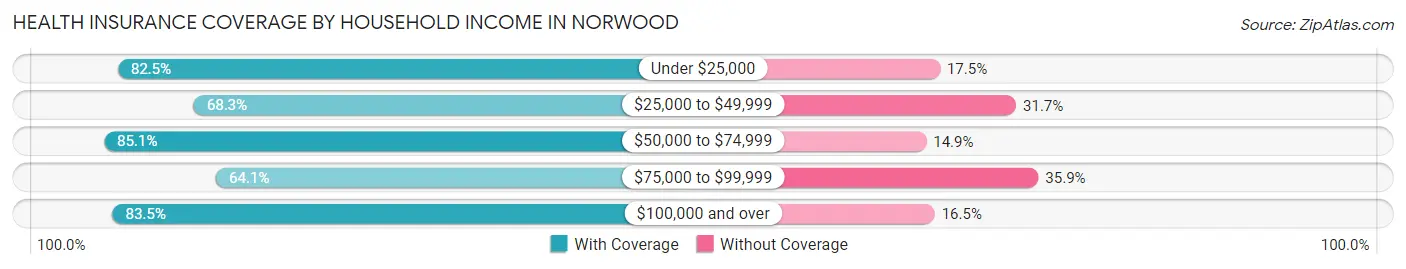
| Household Income | With Coverage | Without Coverage |
| Under $25,000 | 52 (82.5%) | 11 (17.5%) |
| $25,000 to $49,999 | 127 (68.3%) | 59 (31.7%) |
| $50,000 to $74,999 | 80 (85.1%) | 14 (14.9%) |
| $75,000 to $99,999 | 25 (64.1%) | 14 (35.9%) |
| $100,000 and over | 147 (83.5%) | 29 (16.5%) |
Public vs Private Health Insurance Coverage by Age in Norwood
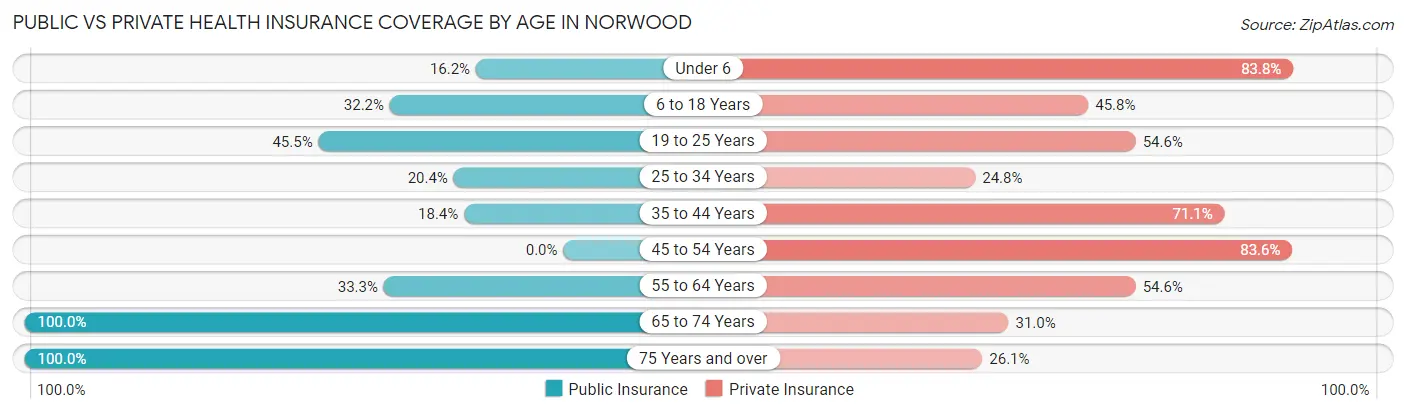
| Age Bracket | Public Insurance | Private Insurance |
| Under 6 | 6 (16.2%) | 31 (83.8%) |
| 6 to 18 Years | 38 (32.2%) | 54 (45.8%) |
| 19 to 25 Years | 10 (45.5%) | 12 (54.5%) |
| 25 to 34 Years | 23 (20.3%) | 28 (24.8%) |
| 35 to 44 Years | 14 (18.4%) | 54 (71.1%) |
| 45 to 54 Years | 0 (0.0%) | 51 (83.6%) |
| 55 to 64 Years | 22 (33.3%) | 36 (54.5%) |
| 65 to 74 Years | 42 (100.0%) | 13 (30.9%) |
| 75 Years and over | 23 (100.0%) | 6 (26.1%) |
| Total | 178 (31.9%) | 285 (51.1%) |
Disability Status by Sex by Age in Norwood
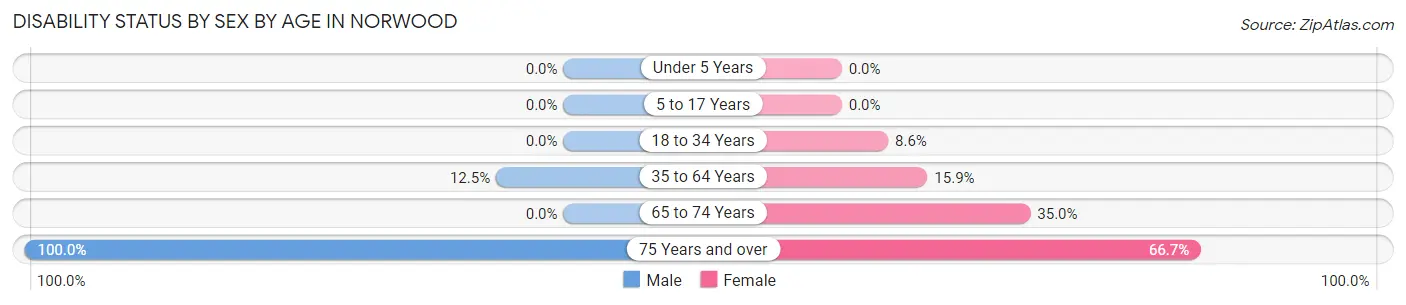
| Age Bracket | Male | Female |
| Under 5 Years | 0 (0.0%) | 0 (0.0%) |
| 5 to 17 Years | 0 (0.0%) | 0 (0.0%) |
| 18 to 34 Years | 0 (0.0%) | 8 (8.6%) |
| 35 to 64 Years | 12 (12.5%) | 17 (15.9%) |
| 65 to 74 Years | 0 (0.0%) | 7 (35.0%) |
| 75 Years and over | 14 (100.0%) | 6 (66.7%) |
Disability Class by Sex by Age in Norwood
Disability Class: Hearing Difficulty
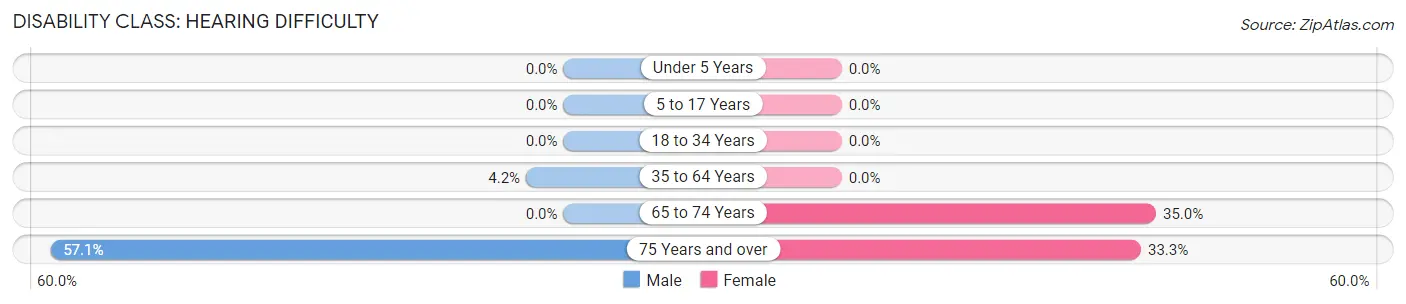
| Age Bracket | Male | Female |
| Under 5 Years | 0 (0.0%) | 0 (0.0%) |
| 5 to 17 Years | 0 (0.0%) | 0 (0.0%) |
| 18 to 34 Years | 0 (0.0%) | 0 (0.0%) |
| 35 to 64 Years | 4 (4.2%) | 0 (0.0%) |
| 65 to 74 Years | 0 (0.0%) | 7 (35.0%) |
| 75 Years and over | 8 (57.1%) | 3 (33.3%) |
Disability Class: Vision Difficulty
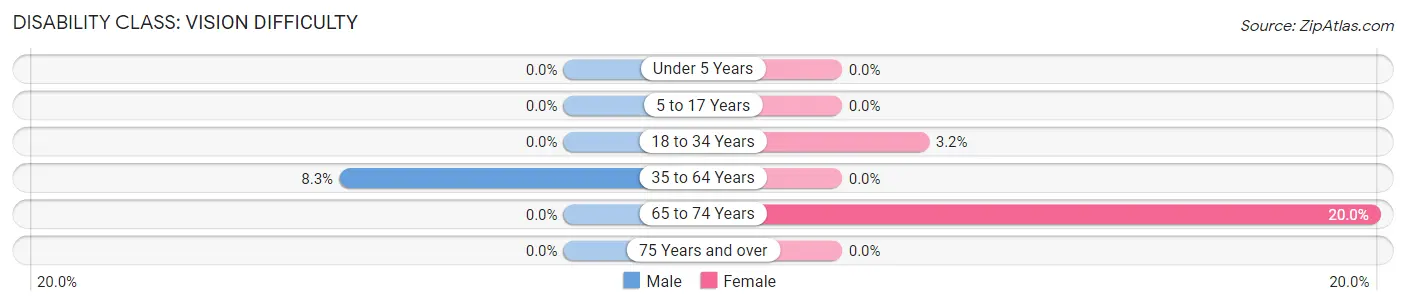
| Age Bracket | Male | Female |
| Under 5 Years | 0 (0.0%) | 0 (0.0%) |
| 5 to 17 Years | 0 (0.0%) | 0 (0.0%) |
| 18 to 34 Years | 0 (0.0%) | 3 (3.2%) |
| 35 to 64 Years | 8 (8.3%) | 0 (0.0%) |
| 65 to 74 Years | 0 (0.0%) | 4 (20.0%) |
| 75 Years and over | 0 (0.0%) | 0 (0.0%) |
Disability Class: Cognitive Difficulty
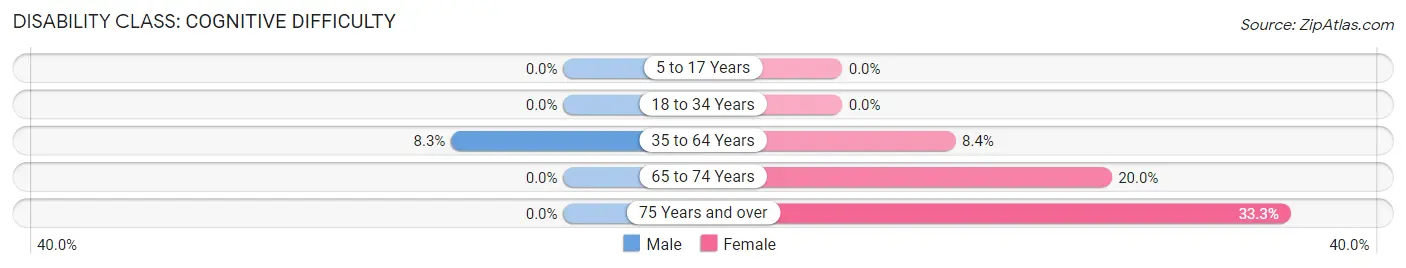
| Age Bracket | Male | Female |
| 5 to 17 Years | 0 (0.0%) | 0 (0.0%) |
| 18 to 34 Years | 0 (0.0%) | 0 (0.0%) |
| 35 to 64 Years | 8 (8.3%) | 9 (8.4%) |
| 65 to 74 Years | 0 (0.0%) | 4 (20.0%) |
| 75 Years and over | 0 (0.0%) | 3 (33.3%) |
Disability Class: Ambulatory Difficulty
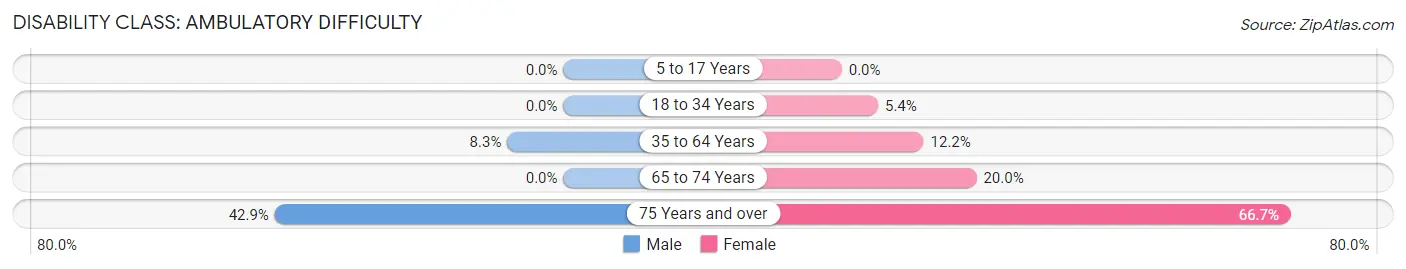
| Age Bracket | Male | Female |
| 5 to 17 Years | 0 (0.0%) | 0 (0.0%) |
| 18 to 34 Years | 0 (0.0%) | 5 (5.4%) |
| 35 to 64 Years | 8 (8.3%) | 13 (12.1%) |
| 65 to 74 Years | 0 (0.0%) | 4 (20.0%) |
| 75 Years and over | 6 (42.9%) | 6 (66.7%) |
Disability Class: Self-Care Difficulty
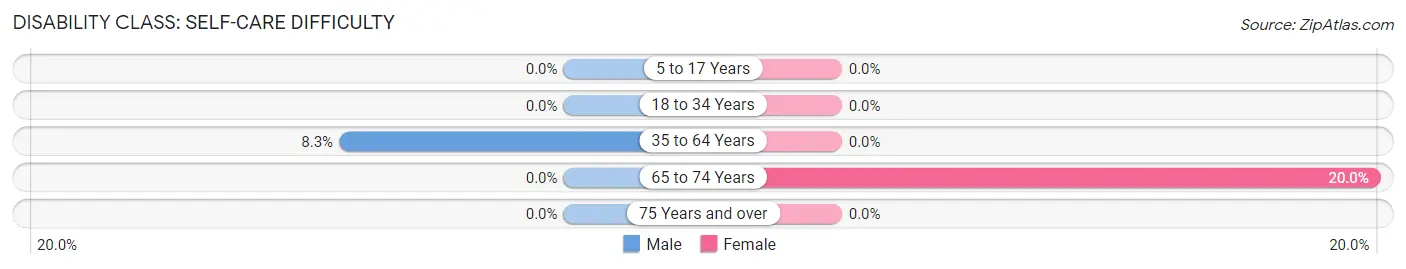
| Age Bracket | Male | Female |
| 5 to 17 Years | 0 (0.0%) | 0 (0.0%) |
| 18 to 34 Years | 0 (0.0%) | 0 (0.0%) |
| 35 to 64 Years | 8 (8.3%) | 0 (0.0%) |
| 65 to 74 Years | 0 (0.0%) | 4 (20.0%) |
| 75 Years and over | 0 (0.0%) | 0 (0.0%) |
Technology Access in Norwood
Computing Device Access in Norwood
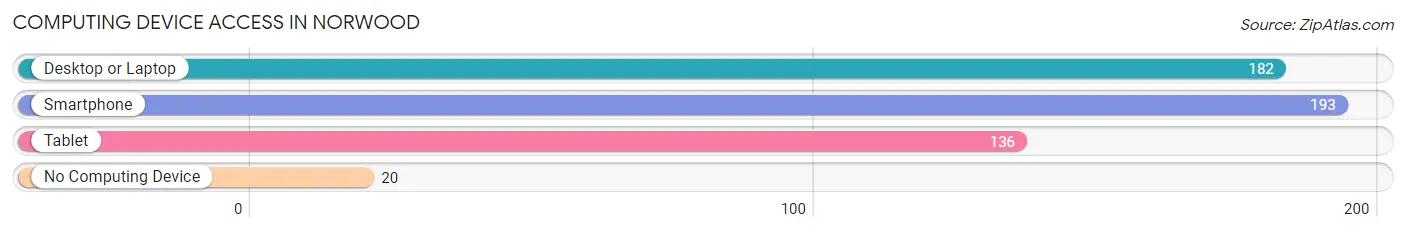
| Device Type | # Households | % Households |
| Desktop or Laptop | 182 | 78.1% |
| Smartphone | 193 | 82.8% |
| Tablet | 136 | 58.4% |
| No Computing Device | 20 | 8.6% |
| Total | 233 | 100.0% |
Internet Access in Norwood
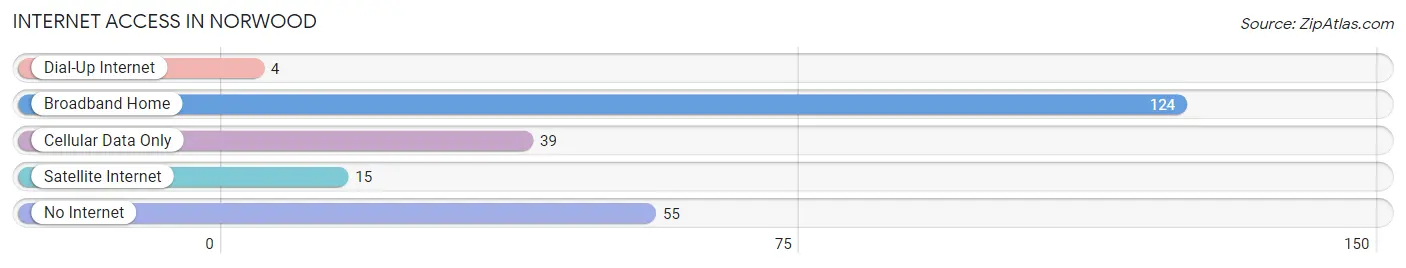
| Internet Type | # Households | % Households |
| Dial-Up Internet | 4 | 1.7% |
| Broadband Home | 124 | 53.2% |
| Cellular Data Only | 39 | 16.7% |
| Satellite Internet | 15 | 6.4% |
| No Internet | 55 | 23.6% |
| Total | 233 | 100.0% |
Norwood Summary
Norwood is a small town located in the San Miguel County of Colorado. It is situated in the Uncompahgre Valley, at the base of the San Juan Mountains. The town has a population of approximately 1,000 people and is located about 20 miles south of Telluride.
History
Norwood was founded in 1881 by a group of miners who were looking for gold and silver in the area. The town was named after the nearby Norwood Creek. The town quickly grew and by 1883, it had a population of over 500 people. The town was incorporated in 1887 and by 1890, it had a population of over 1,000 people.
The town was a major hub for the mining industry in the area and was home to several large mines, including the Norwood Mine, the Silver King Mine, and the Silver Queen Mine. The town also had a large smelter and several other businesses.
In the early 1900s, the mining industry began to decline and the town's population began to decrease. By the 1950s, the population had dropped to just over 500 people.
Geography
Norwood is located in the Uncompahgre Valley, at the base of the San Juan Mountains. The town is situated at an elevation of 7,000 feet and is surrounded by mountains and forests. The town is located about 20 miles south of Telluride and is about a two-hour drive from Grand Junction.
The climate in Norwood is semi-arid, with hot summers and cold winters. The average annual temperature is around 50 degrees Fahrenheit. The town receives an average of 12 inches of precipitation per year.
Economy
The economy of Norwood is largely based on tourism and agriculture. The town is a popular destination for outdoor recreation, such as camping, fishing, and hiking. The town is also home to several wineries and breweries.
Agriculture is also an important part of the local economy. The town is home to several farms and ranches, which produce a variety of crops, including hay, alfalfa, and potatoes.
Demographics
As of the 2010 census, the population of Norwood was 1,037. The town is predominantly white, with about 90% of the population being Caucasian. The median household income is around $45,000 and the median home value is around $200,000.
The town is served by the Norwood School District, which includes one elementary school, one middle school, and one high school. The town is also home to several churches, including the Norwood United Methodist Church and the Norwood Presbyterian Church.
Common Questions
What is Per Capita Income in Norwood?
Per Capita income in Norwood is $28,060.
What is the Median Family Income in Norwood?
Median Family Income in Norwood is $63,750.
What is the Median Household income in Norwood?
Median Household Income in Norwood is $53,603.
What is Income or Wage Gap in Norwood?
Income or Wage Gap in Norwood is 59.4%.
Women in Norwood earn 40.6 cents for every dollar earned by a man.
What is Inequality or Gini Index in Norwood?
Inequality or Gini Index in Norwood is 0.43.
What is the Total Population of Norwood?
Total Population of Norwood is 558.
What is the Total Male Population of Norwood?
Total Male Population of Norwood is 281.
What is the Total Female Population of Norwood?
Total Female Population of Norwood is 277.
What is the Ratio of Males per 100 Females in Norwood?
There are 101.44 Males per 100 Females in Norwood.
What is the Ratio of Females per 100 Males in Norwood?
There are 98.58 Females per 100 Males in Norwood.
What is the Median Population Age in Norwood?
Median Population Age in Norwood is 34.5 Years.
What is the Average Family Size in Norwood
Average Family Size in Norwood is 2.9 People.
What is the Average Household Size in Norwood
Average Household Size in Norwood is 2.4 People.
How Large is the Labor Force in Norwood?
There are 313 People in the Labor Forcein in Norwood.
What is the Percentage of People in the Labor Force in Norwood?
74.7% of People are in the Labor Force in Norwood.
What is the Unemployment Rate in Norwood?
Unemployment Rate in Norwood is 10.5%.