Zip Codes with the Highest Percentage of Population Employed in Architecture & Engineering in Broomfield, CO
RELATED REPORTS & OPTIONS
Architecture & Engineering
Broomfield
Compare Zip Codes
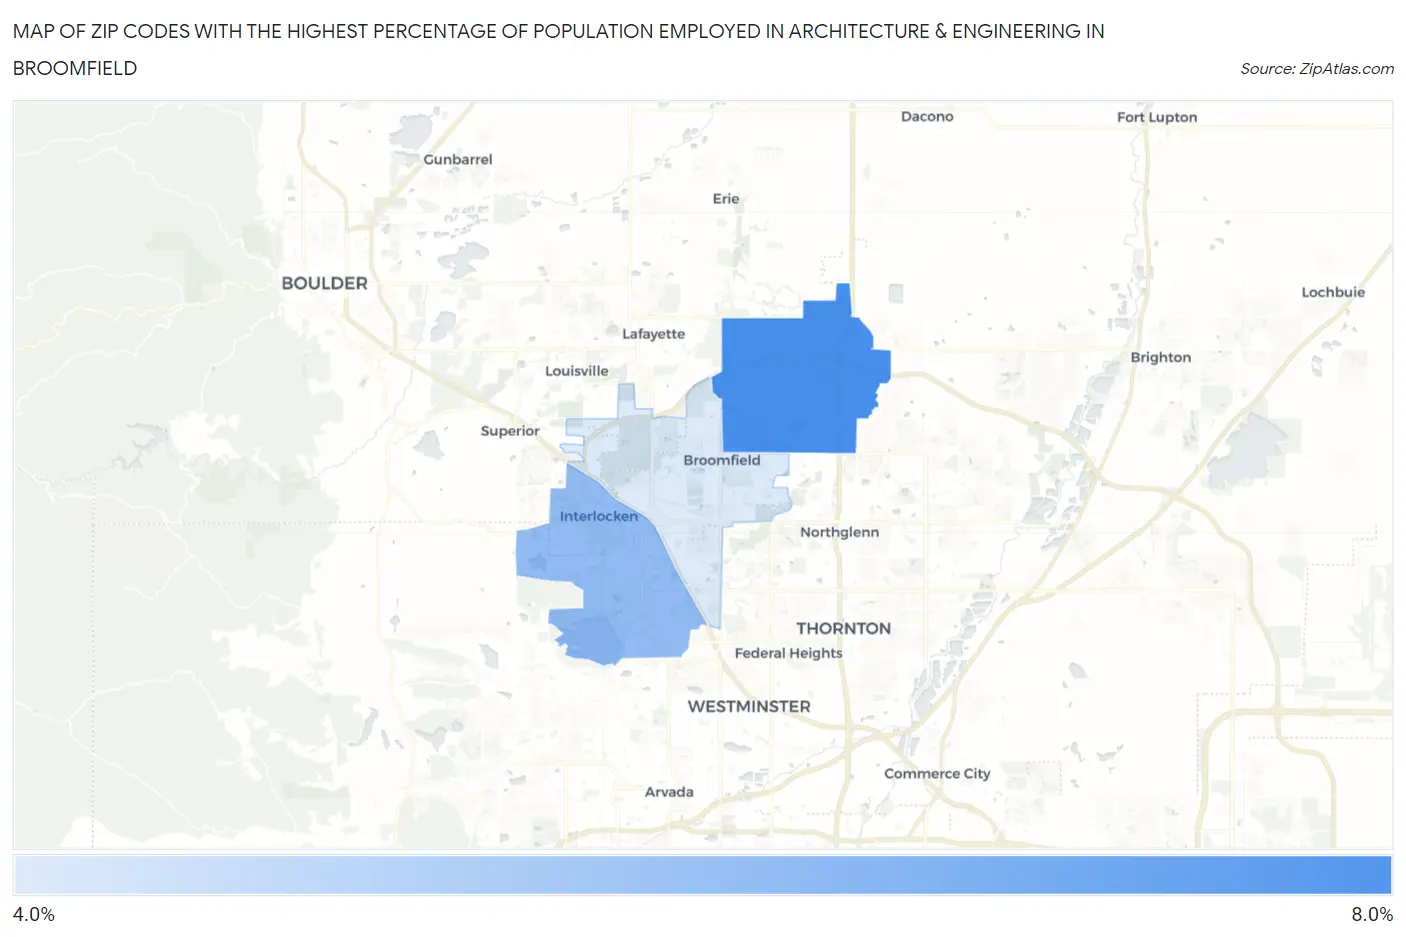
Map of Zip Codes with the Highest Percentage of Population Employed in Architecture & Engineering in Broomfield
4.5%
7.0%
Zip Codes with the Highest Percentage of Population Employed in Architecture & Engineering in Broomfield, CO
| Zip Code | % Employed | vs State | vs National | |
| 1. | 80023 | 7.0% | 2.9%(+4.04)#10 | 2.1%(+4.81)#758 |
| 2. | 80021 | 5.7% | 2.9%(+2.81)#22 | 2.1%(+3.58)#1,203 |
| 3. | 80020 | 4.5% | 2.9%(+1.57)#54 | 2.1%(+2.34)#2,134 |
1
Common Questions
What are the Top Zip Codes with the Highest Percentage of Population Employed in Architecture & Engineering in Broomfield, CO?
Top Zip Codes with the Highest Percentage of Population Employed in Architecture & Engineering in Broomfield, CO are:
What zip code has the Highest Percentage of Population Employed in Architecture & Engineering in Broomfield, CO?
80023 has the Highest Percentage of Population Employed in Architecture & Engineering in Broomfield, CO with 7.0%.
What is the Percentage of Population Employed in Architecture & Engineering in Broomfield, CO?
Percentage of Population Employed in Architecture & Engineering in Broomfield is 5.9%.
What is the Percentage of Population Employed in Architecture & Engineering in Colorado?
Percentage of Population Employed in Architecture & Engineering in Colorado is 2.9%.
What is the Percentage of Population Employed in Architecture & Engineering in the United States?
Percentage of Population Employed in Architecture & Engineering in the United States is 2.1%.