Clifton, CO Map & Demographics
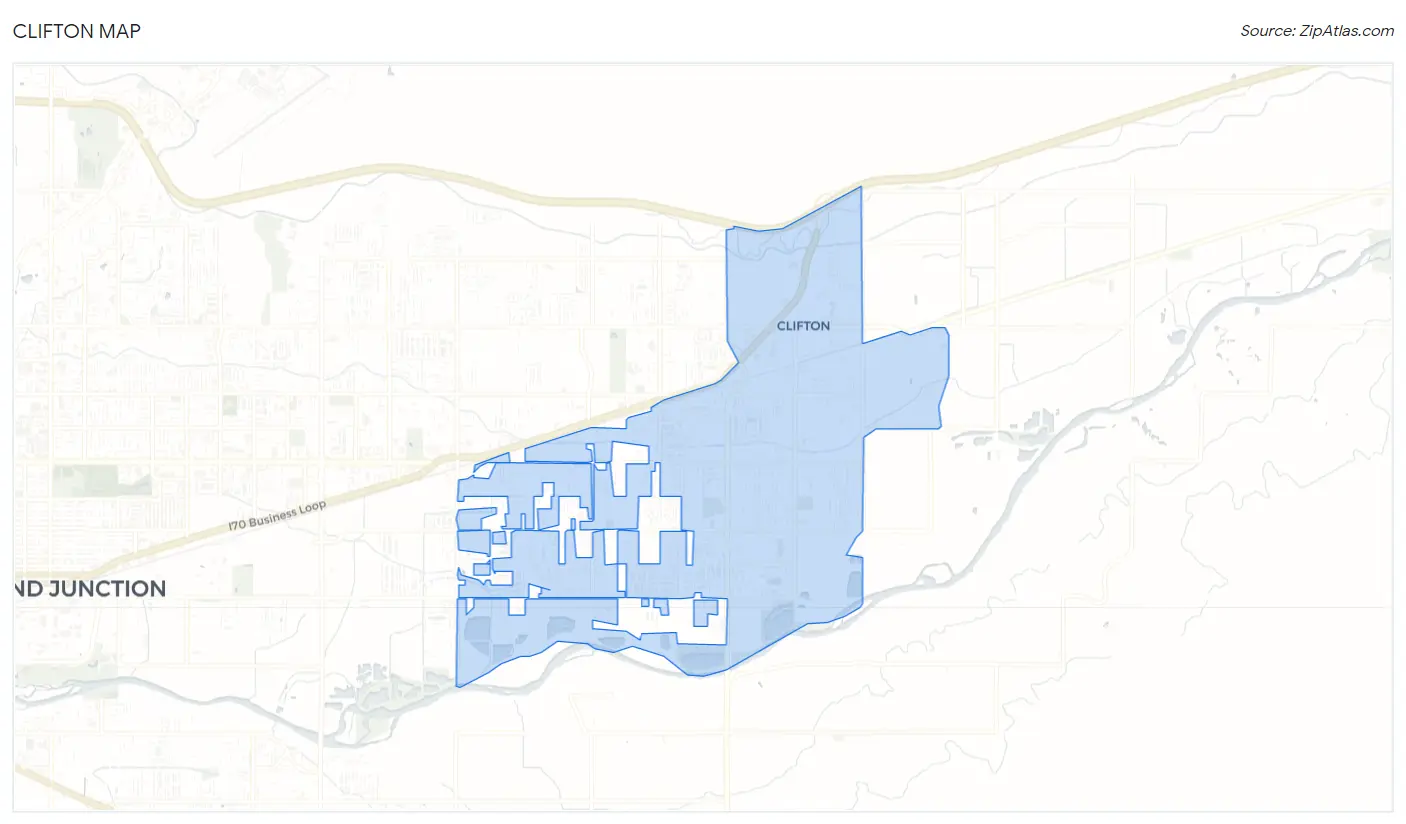
Clifton Map
Clifton Overview
$26,116
PER CAPITA INCOME
$60,203
AVG FAMILY INCOME
$55,108
AVG HOUSEHOLD INCOME
20.9%
WAGE / INCOME GAP [ % ]
79.1¢/ $1
WAGE / INCOME GAP [ $ ]
0.42
INEQUALITY / GINI INDEX
19,443
TOTAL POPULATION
9,461
MALE POPULATION
9,982
FEMALE POPULATION
94.78
MALES / 100 FEMALES
105.51
FEMALES / 100 MALES
35.3
MEDIAN AGE
3.1
AVG FAMILY SIZE
2.6
AVG HOUSEHOLD SIZE
9,509
LABOR FORCE [ PEOPLE ]
62.1%
PERCENT IN LABOR FORCE
9.1%
UNEMPLOYMENT RATE
Clifton Zip Codes
Clifton Area Codes
Income in Clifton
Income Overview in Clifton
Per Capita Income in Clifton is $26,116, while median incomes of families and households are $60,203 and $55,108 respectively.
| Characteristic | Number | Measure |
| Per Capita Income | 19,443 | $26,116 |
| Median Family Income | 4,916 | $60,203 |
| Mean Family Income | 4,916 | $72,004 |
| Median Household Income | 7,589 | $55,108 |
| Mean Household Income | 7,589 | $64,879 |
| Income Deficit | 4,916 | $0 |
| Wage / Income Gap (%) | 19,443 | 20.88% |
| Wage / Income Gap ($) | 19,443 | 79.12¢ per $1 |
| Gini / Inequality Index | 19,443 | 0.42 |
Earnings by Sex in Clifton
Average Earnings in Clifton are $36,668, $41,155 for men and $32,560 for women, a difference of 20.9%.
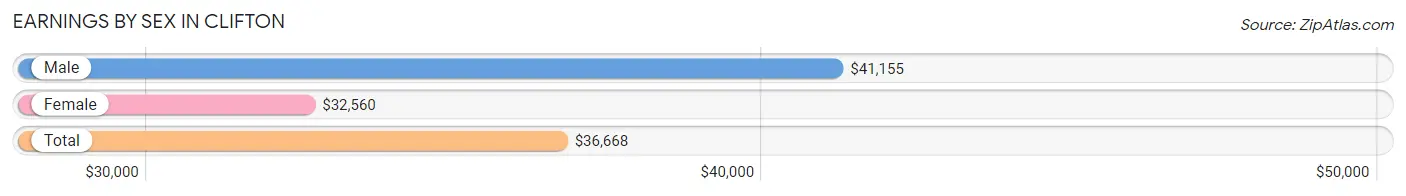
| Sex | Number | Average Earnings |
| Male | 5,149 (52.5%) | $41,155 |
| Female | 4,650 (47.4%) | $32,560 |
| Total | 9,799 (100.0%) | $36,668 |
Earnings by Sex by Income Bracket in Clifton
The most common earnings brackets in Clifton are $35,000 to $39,999 for men (575 | 11.2%) and $30,000 to $34,999 for women (674 | 14.5%).
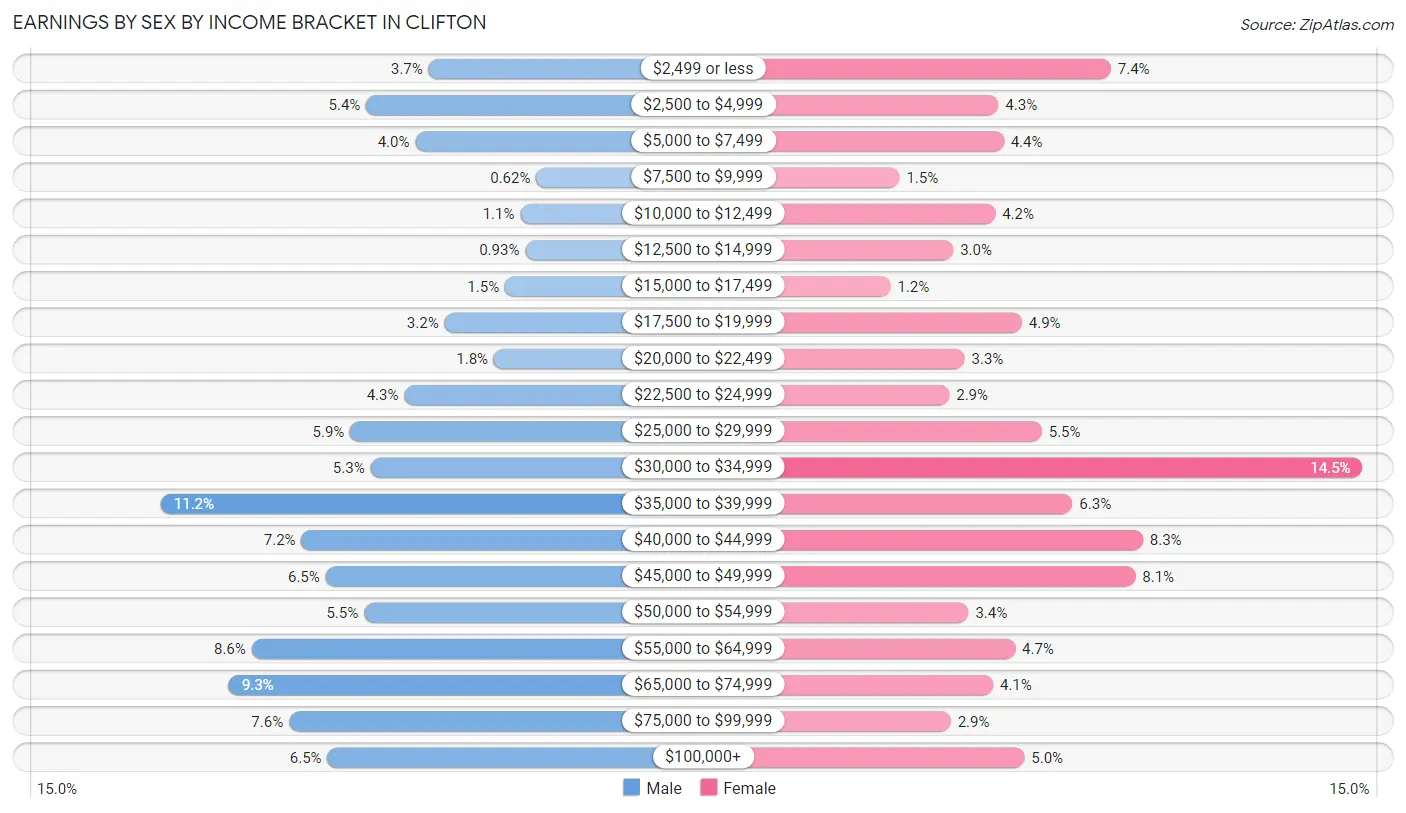
| Income | Male | Female |
| $2,499 or less | 188 (3.6%) | 345 (7.4%) |
| $2,500 to $4,999 | 278 (5.4%) | 198 (4.3%) |
| $5,000 to $7,499 | 207 (4.0%) | 205 (4.4%) |
| $7,500 to $9,999 | 32 (0.6%) | 69 (1.5%) |
| $10,000 to $12,499 | 55 (1.1%) | 194 (4.2%) |
| $12,500 to $14,999 | 48 (0.9%) | 139 (3.0%) |
| $15,000 to $17,499 | 77 (1.5%) | 57 (1.2%) |
| $17,500 to $19,999 | 165 (3.2%) | 229 (4.9%) |
| $20,000 to $22,499 | 93 (1.8%) | 154 (3.3%) |
| $22,500 to $24,999 | 223 (4.3%) | 134 (2.9%) |
| $25,000 to $29,999 | 301 (5.9%) | 255 (5.5%) |
| $30,000 to $34,999 | 272 (5.3%) | 674 (14.5%) |
| $35,000 to $39,999 | 575 (11.2%) | 295 (6.3%) |
| $40,000 to $44,999 | 372 (7.2%) | 387 (8.3%) |
| $45,000 to $49,999 | 337 (6.5%) | 377 (8.1%) |
| $50,000 to $54,999 | 281 (5.5%) | 159 (3.4%) |
| $55,000 to $64,999 | 444 (8.6%) | 220 (4.7%) |
| $65,000 to $74,999 | 477 (9.3%) | 191 (4.1%) |
| $75,000 to $99,999 | 390 (7.6%) | 136 (2.9%) |
| $100,000+ | 334 (6.5%) | 232 (5.0%) |
| Total | 5,149 (100.0%) | 4,650 (100.0%) |
Earnings by Sex by Educational Attainment in Clifton
Average earnings in Clifton are $43,314 for men and $35,206 for women, a difference of 18.7%. Men with an educational attainment of college or associate's degree enjoy the highest average annual earnings of $50,319, while those with less than high school education earn the least with $35,592. Women with an educational attainment of graduate degree earn the most with the average annual earnings of $53,056, while those with less than high school education have the smallest earnings of $25,833.
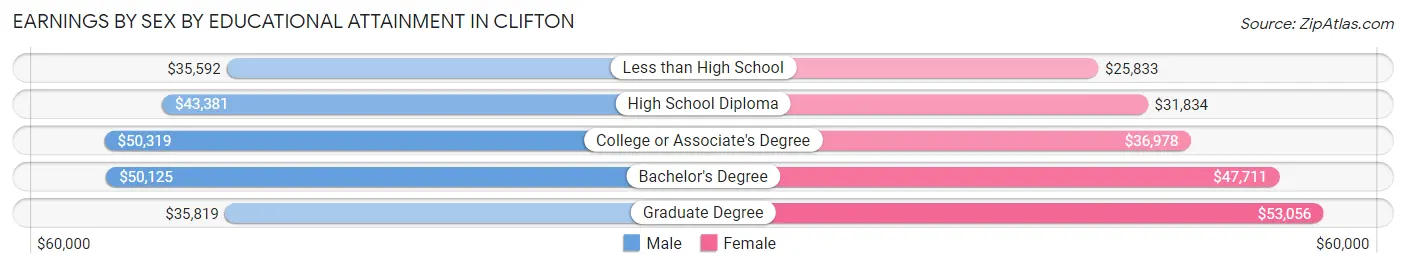
| Educational Attainment | Male Income | Female Income |
| Less than High School | $35,592 | $25,833 |
| High School Diploma | $43,381 | $31,834 |
| College or Associate's Degree | $50,319 | $36,978 |
| Bachelor's Degree | $50,125 | $47,711 |
| Graduate Degree | $35,819 | $53,056 |
| Total | $43,314 | $35,206 |
Family Income in Clifton
Family Income Brackets in Clifton
According to the Clifton family income data, there are 1,195 families falling into the $50,000 to $74,999 income range, which is the most common income bracket and makes up 24.3% of all families. Conversely, the $10,000 to $14,999 income bracket is the least frequent group with only 93 families (1.9%) belonging to this category.
| Income Bracket | # Families | % Families |
| Less than $10,000 | 246 | 5.0% |
| $10,000 to $14,999 | 93 | 1.9% |
| $15,000 to $24,999 | 339 | 6.9% |
| $25,000 to $34,999 | 556 | 11.3% |
| $35,000 to $49,999 | 747 | 15.2% |
| $50,000 to $74,999 | 1,195 | 24.3% |
| $75,000 to $99,999 | 703 | 14.3% |
| $100,000 to $149,999 | 565 | 11.5% |
| $150,000 to $199,999 | 315 | 6.4% |
| $200,000+ | 152 | 3.1% |
Family Income by Famaliy Size in Clifton
7+ person families (193 | 3.9%) account for the highest median family income in Clifton with $105,443 per family, while 2-person families (2,636 | 53.6%) have the highest median income of $27,900 per family member.
| Income Bracket | # Families | Median Income |
| 2-Person Families | 2,636 (53.6%) | $55,799 |
| 3-Person Families | 780 (15.9%) | $46,786 |
| 4-Person Families | 780 (15.9%) | $72,825 |
| 5-Person Families | 305 (6.2%) | $0 |
| 6-Person Families | 222 (4.5%) | $76,090 |
| 7+ Person Families | 193 (3.9%) | $105,443 |
| Total | 4,916 (100.0%) | $60,203 |
Family Income by Number of Earners in Clifton
The median family income in Clifton is $60,203, with families comprising 3+ earners (497) having the highest median family income of $107,214, while families with no earners (503) have the lowest median family income of $36,696, accounting for 10.1% and 10.2% of families, respectively.
| Number of Earners | # Families | Median Income |
| No Earners | 503 (10.2%) | $36,696 |
| 1 Earner | 2,325 (47.3%) | $44,473 |
| 2 Earners | 1,591 (32.4%) | $84,938 |
| 3+ Earners | 497 (10.1%) | $107,214 |
| Total | 4,916 (100.0%) | $60,203 |
Household Income in Clifton
Household Income Brackets in Clifton
With 1,579 households falling in the category, the $50,000 to $74,999 income range is the most frequent in Clifton, accounting for 20.8% of all households. In contrast, only 152 households (2.0%) fall into the $200,000+ income bracket, making it the least populous group.
| Income Bracket | # Households | % Households |
| Less than $10,000 | 668 | 8.8% |
| $10,000 to $14,999 | 273 | 3.6% |
| $15,000 to $24,999 | 668 | 8.8% |
| $25,000 to $34,999 | 956 | 12.6% |
| $35,000 to $49,999 | 1,055 | 13.9% |
| $50,000 to $74,999 | 1,579 | 20.8% |
| $75,000 to $99,999 | 949 | 12.5% |
| $100,000 to $149,999 | 911 | 12.0% |
| $150,000 to $199,999 | 379 | 5.0% |
| $200,000+ | 152 | 2.0% |
Household Income by Householder Age in Clifton
The median household income in Clifton is $55,108, with the highest median household income of $63,450 found in the 45 to 64 years age bracket for the primary householder. A total of 2,548 households (33.6%) fall into this category. Meanwhile, the 65+ years age bracket for the primary householder has the lowest median household income of $34,711, with 1,798 households (23.7%) in this group.
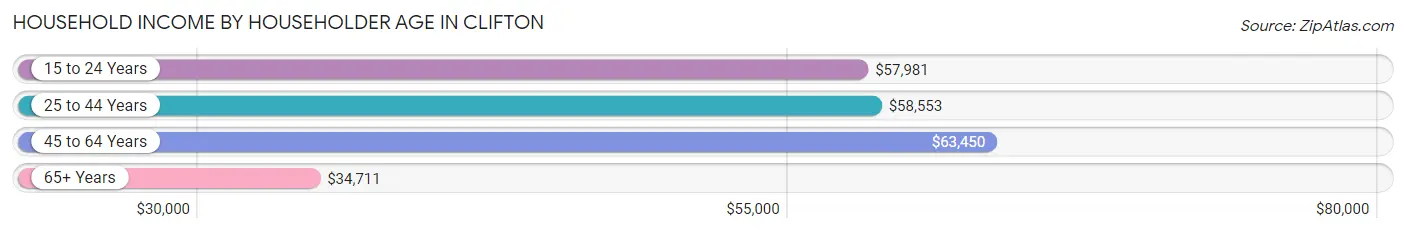
| Income Bracket | # Households | Median Income |
| 15 to 24 Years | 369 (4.9%) | $57,981 |
| 25 to 44 Years | 2,874 (37.9%) | $58,553 |
| 45 to 64 Years | 2,548 (33.6%) | $63,450 |
| 65+ Years | 1,798 (23.7%) | $34,711 |
| Total | 7,589 (100.0%) | $55,108 |
Poverty in Clifton
Income Below Poverty by Sex and Age in Clifton
With 12.6% poverty level for males and 18.4% for females among the residents of Clifton, under 5 year old males and under 5 year old females are the most vulnerable to poverty, with 171 males (28.1%) and 294 females (57.1%) in their respective age groups living below the poverty level.
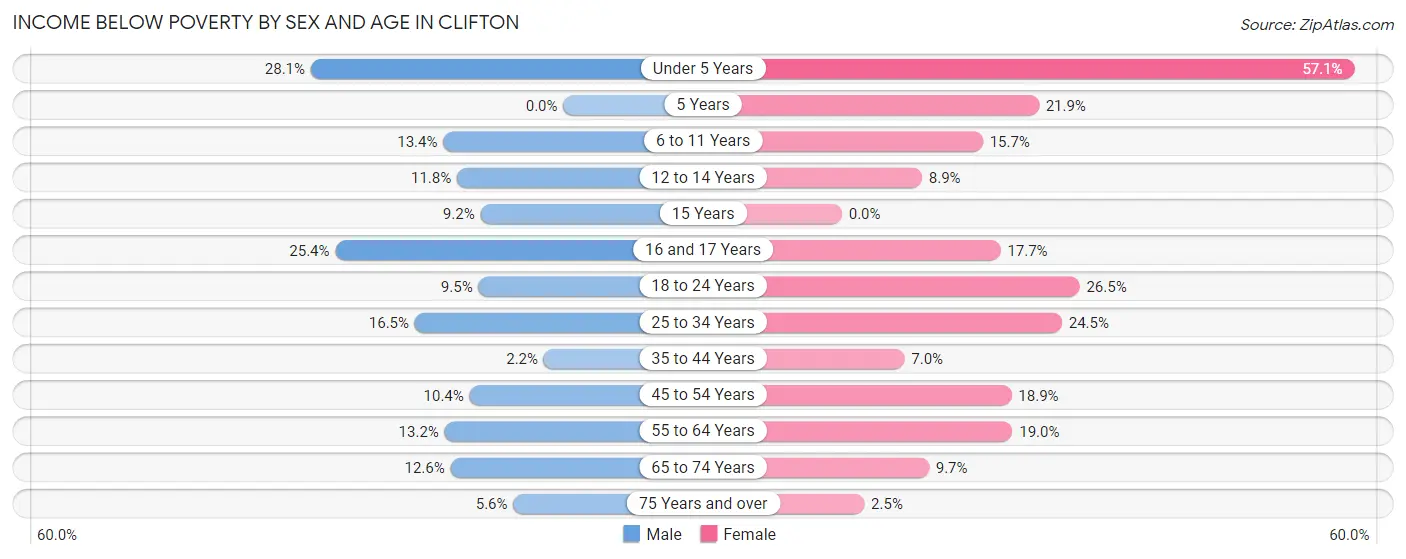
| Age Bracket | Male | Female |
| Under 5 Years | 171 (28.1%) | 294 (57.1%) |
| 5 Years | 0 (0.0%) | 66 (21.9%) |
| 6 to 11 Years | 155 (13.4%) | 121 (15.7%) |
| 12 to 14 Years | 18 (11.8%) | 19 (8.9%) |
| 15 Years | 12 (9.2%) | 0 (0.0%) |
| 16 and 17 Years | 81 (25.4%) | 50 (17.7%) |
| 18 to 24 Years | 89 (9.5%) | 248 (26.5%) |
| 25 to 34 Years | 244 (16.5%) | 380 (24.5%) |
| 35 to 44 Years | 25 (2.2%) | 99 (7.0%) |
| 45 to 54 Years | 111 (10.4%) | 224 (18.9%) |
| 55 to 64 Years | 133 (13.2%) | 210 (19.0%) |
| 65 to 74 Years | 121 (12.6%) | 90 (9.7%) |
| 75 Years and over | 21 (5.6%) | 15 (2.5%) |
| Total | 1,181 (12.6%) | 1,816 (18.4%) |
Income Above Poverty by Sex and Age in Clifton
According to the poverty statistics in Clifton, males aged 5 years and females aged 15 years are the age groups that are most secure financially, with 100.0% of males and 100.0% of females in these age groups living above the poverty line.
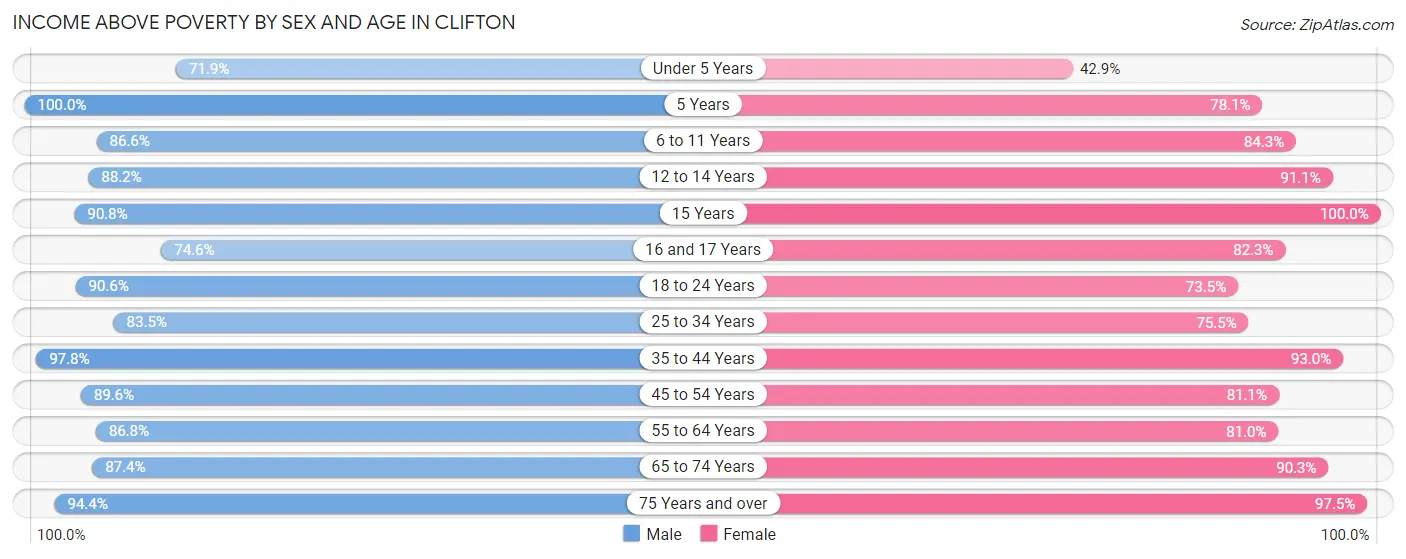
| Age Bracket | Male | Female |
| Under 5 Years | 437 (71.9%) | 221 (42.9%) |
| 5 Years | 65 (100.0%) | 235 (78.1%) |
| 6 to 11 Years | 1,004 (86.6%) | 650 (84.3%) |
| 12 to 14 Years | 134 (88.2%) | 194 (91.1%) |
| 15 Years | 118 (90.8%) | 68 (100.0%) |
| 16 and 17 Years | 238 (74.6%) | 233 (82.3%) |
| 18 to 24 Years | 853 (90.5%) | 689 (73.5%) |
| 25 to 34 Years | 1,231 (83.5%) | 1,171 (75.5%) |
| 35 to 44 Years | 1,125 (97.8%) | 1,322 (93.0%) |
| 45 to 54 Years | 952 (89.6%) | 962 (81.1%) |
| 55 to 64 Years | 873 (86.8%) | 896 (81.0%) |
| 65 to 74 Years | 842 (87.4%) | 839 (90.3%) |
| 75 Years and over | 356 (94.4%) | 588 (97.5%) |
| Total | 8,228 (87.5%) | 8,068 (81.6%) |
Income Below Poverty Among Married-Couple Families in Clifton
The poverty statistics for married-couple families in Clifton show that 7.0% or 213 of the total 3,056 families live below the poverty line. Families with 3 or 4 children have the highest poverty rate of 22.3%, comprising of 73 families. On the other hand, families with 5 or more children have the lowest poverty rate of 0.0%, which includes 0 families.
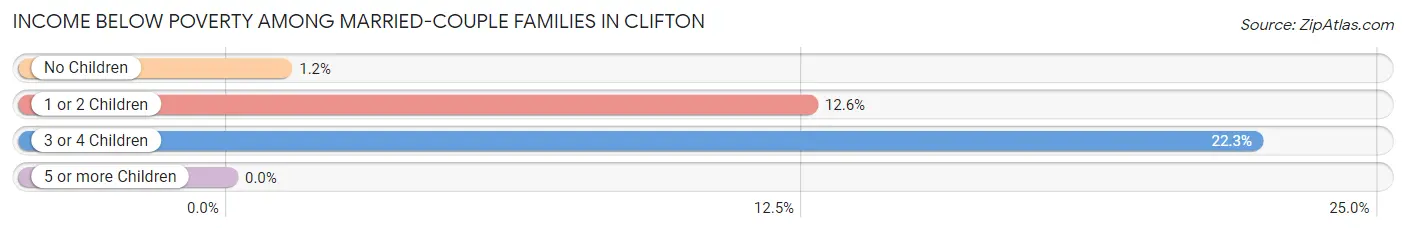
| Children | Above Poverty | Below Poverty |
| No Children | 1,670 (98.8%) | 20 (1.2%) |
| 1 or 2 Children | 831 (87.4%) | 120 (12.6%) |
| 3 or 4 Children | 254 (77.7%) | 73 (22.3%) |
| 5 or more Children | 88 (100.0%) | 0 (0.0%) |
| Total | 2,843 (93.0%) | 213 (7.0%) |
Income Below Poverty Among Single-Parent Households in Clifton
According to the poverty data in Clifton, 4.4% or 25 single-father households and 27.8% or 357 single-mother households are living below the poverty line. Among single-father households, those with 3 or 4 children have the highest poverty rate, with 5 households (14.7%) experiencing poverty. Likewise, among single-mother households, those with 1 or 2 children have the highest poverty rate, with 247 households (31.5%) falling below the poverty line.
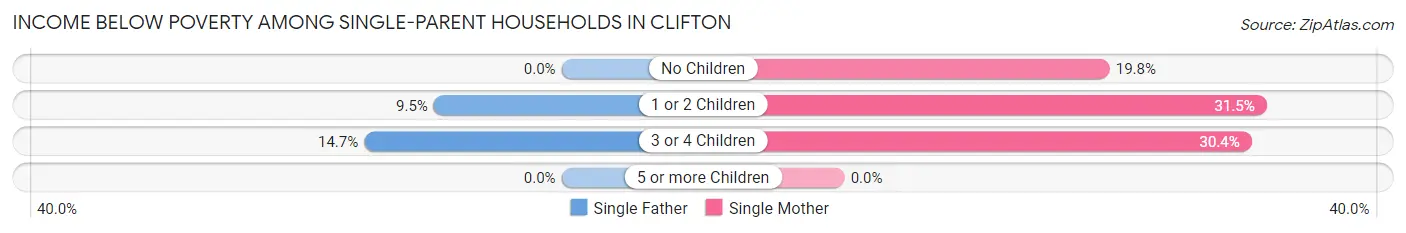
| Children | Single Father | Single Mother |
| No Children | 0 (0.0%) | 79 (19.8%) |
| 1 or 2 Children | 20 (9.5%) | 247 (31.5%) |
| 3 or 4 Children | 5 (14.7%) | 31 (30.4%) |
| 5 or more Children | 0 (0.0%) | 0 (0.0%) |
| Total | 25 (4.4%) | 357 (27.8%) |
Income Below Poverty Among Married-Couple vs Single-Parent Households in Clifton
The poverty data for Clifton shows that 213 of the married-couple family households (7.0%) and 382 of the single-parent households (20.5%) are living below the poverty level. Within the married-couple family households, those with 3 or 4 children have the highest poverty rate, with 73 households (22.3%) falling below the poverty line. Among the single-parent households, those with 1 or 2 children have the highest poverty rate, with 267 household (26.9%) living below poverty.
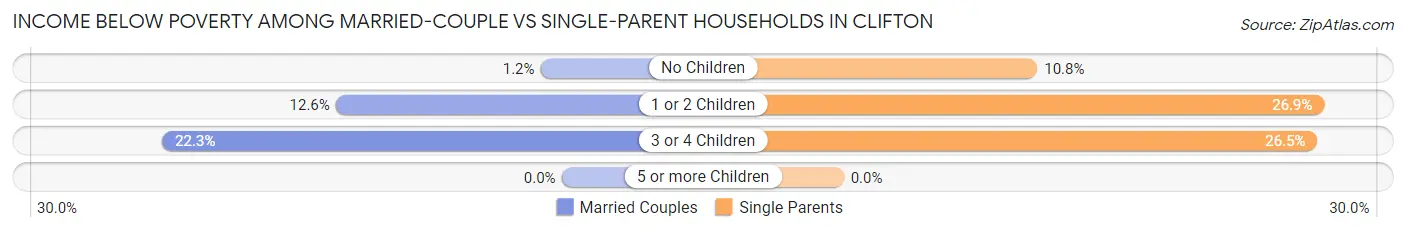
| Children | Married-Couple Families | Single-Parent Households |
| No Children | 20 (1.2%) | 79 (10.8%) |
| 1 or 2 Children | 120 (12.6%) | 267 (26.9%) |
| 3 or 4 Children | 73 (22.3%) | 36 (26.5%) |
| 5 or more Children | 0 (0.0%) | 0 (0.0%) |
| Total | 213 (7.0%) | 382 (20.5%) |
Race in Clifton
The most populous races in Clifton are White / Caucasian (16,332 | 84.0%), Hispanic or Latino (5,073 | 26.1%), and Two or more Races (2,274 | 11.7%).
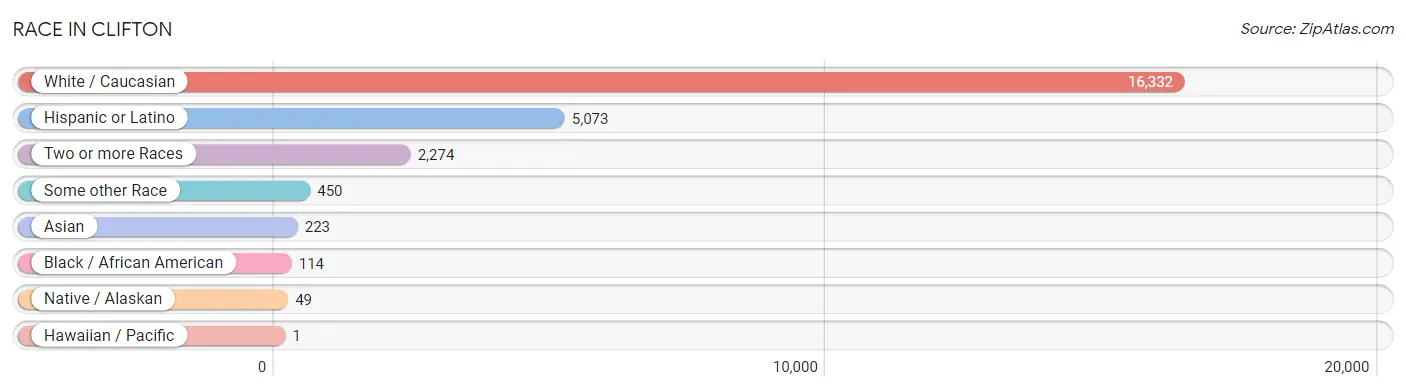
| Race | # Population | % Population |
| Asian | 223 | 1.1% |
| Black / African American | 114 | 0.6% |
| Hawaiian / Pacific | 1 | 0.0% |
| Hispanic or Latino | 5,073 | 26.1% |
| Native / Alaskan | 49 | 0.3% |
| White / Caucasian | 16,332 | 84.0% |
| Two or more Races | 2,274 | 11.7% |
| Some other Race | 450 | 2.3% |
| Total | 19,443 | 100.0% |
Ancestry in Clifton
The most populous ancestries reported in Clifton are German (3,442 | 17.7%), Mexican (3,289 | 16.9%), Irish (2,603 | 13.4%), English (2,282 | 11.7%), and American (761 | 3.9%), together accounting for 63.7% of all Clifton residents.
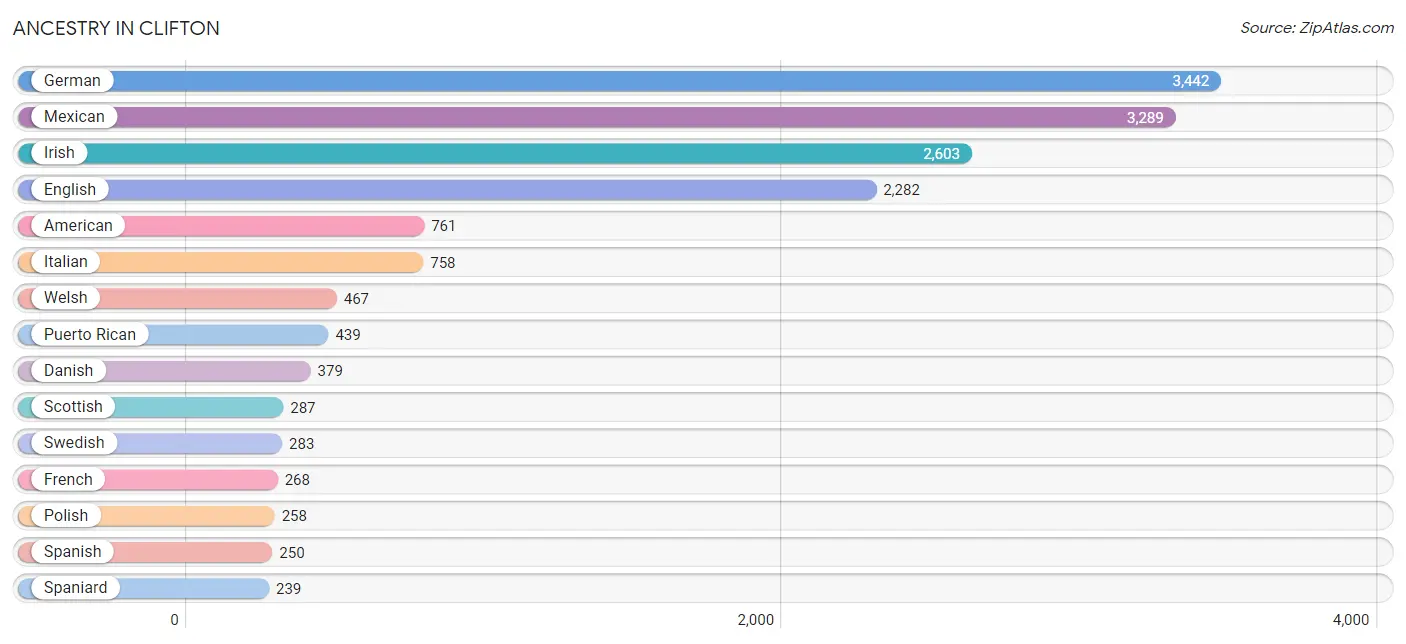
| Ancestry | # Population | % Population |
| American | 761 | 3.9% |
| Apache | 68 | 0.4% |
| Arab | 232 | 1.2% |
| Austrian | 88 | 0.4% |
| Belgian | 15 | 0.1% |
| Bhutanese | 24 | 0.1% |
| Blackfeet | 20 | 0.1% |
| British | 42 | 0.2% |
| Central American | 68 | 0.4% |
| Cherokee | 152 | 0.8% |
| Chilean | 18 | 0.1% |
| Choctaw | 22 | 0.1% |
| Czech | 87 | 0.4% |
| Danish | 379 | 1.9% |
| Dutch | 156 | 0.8% |
| English | 2,282 | 11.7% |
| European | 152 | 0.8% |
| Finnish | 14 | 0.1% |
| French | 268 | 1.4% |
| French Canadian | 89 | 0.5% |
| German | 3,442 | 17.7% |
| Greek | 163 | 0.8% |
| Guatemalan | 7 | 0.0% |
| Hungarian | 6 | 0.0% |
| Indian (Asian) | 52 | 0.3% |
| Irish | 2,603 | 13.4% |
| Italian | 758 | 3.9% |
| Korean | 68 | 0.4% |
| Lebanese | 17 | 0.1% |
| Mexican | 3,289 | 16.9% |
| Native Hawaiian | 1 | 0.0% |
| Navajo | 23 | 0.1% |
| Northern European | 29 | 0.2% |
| Norwegian | 135 | 0.7% |
| Panamanian | 38 | 0.2% |
| Pima | 27 | 0.1% |
| Polish | 258 | 1.3% |
| Portuguese | 107 | 0.5% |
| Puerto Rican | 439 | 2.3% |
| Russian | 159 | 0.8% |
| Salvadoran | 23 | 0.1% |
| Scandinavian | 9 | 0.1% |
| Scotch-Irish | 152 | 0.8% |
| Scottish | 287 | 1.5% |
| Slavic | 13 | 0.1% |
| South American | 18 | 0.1% |
| Spaniard | 239 | 1.2% |
| Spanish | 250 | 1.3% |
| Sri Lankan | 94 | 0.5% |
| Swedish | 283 | 1.5% |
| Swiss | 60 | 0.3% |
| Syrian | 214 | 1.1% |
| Thai | 61 | 0.3% |
| Turkish | 15 | 0.1% |
| Ukrainian | 86 | 0.4% |
| Ute | 22 | 0.1% |
| Welsh | 467 | 2.4% | View All 57 Rows |
Immigrants in Clifton
The most numerous immigrant groups reported in Clifton came from Central America (884 | 4.5%), Latin America (884 | 4.5%), Mexico (847 | 4.4%), Asia (352 | 1.8%), and South Eastern Asia (120 | 0.6%), together accounting for 15.9% of all Clifton residents.
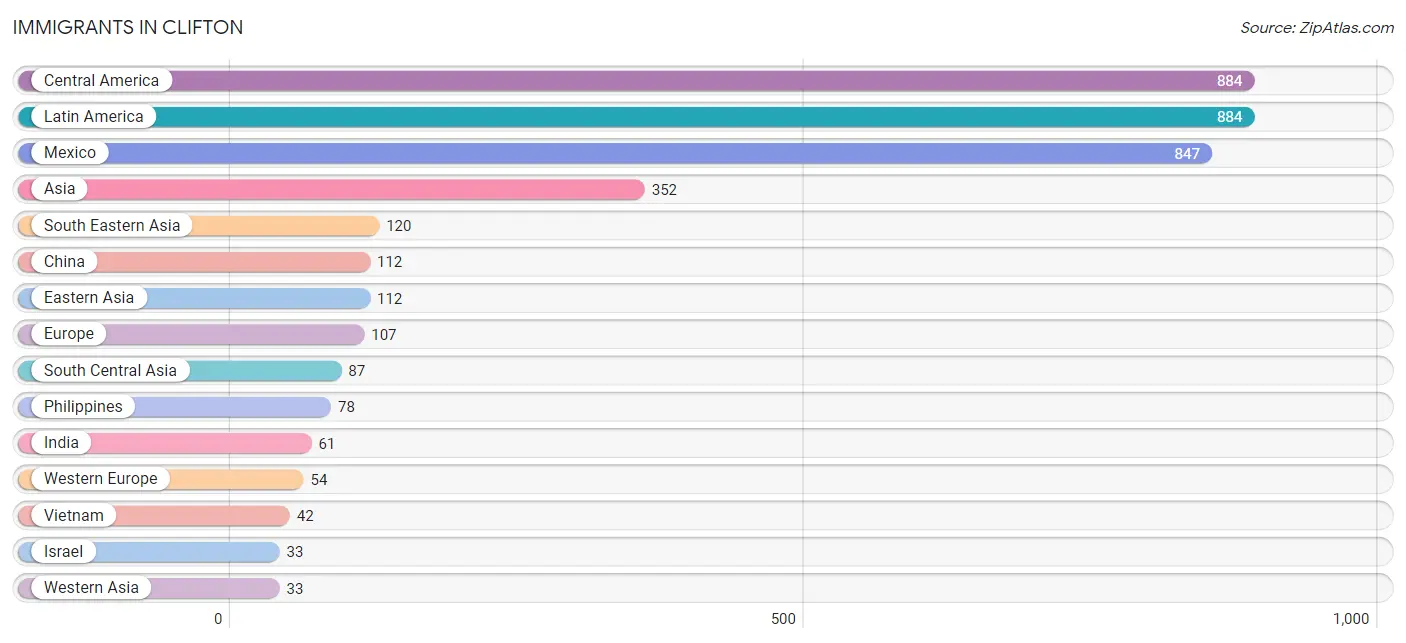
| Immigration Origin | # Population | % Population |
| Africa | 14 | 0.1% |
| Asia | 352 | 1.8% |
| Central America | 884 | 4.5% |
| China | 112 | 0.6% |
| Eastern Asia | 112 | 0.6% |
| Eastern Europe | 24 | 0.1% |
| El Salvador | 23 | 0.1% |
| England | 15 | 0.1% |
| Europe | 107 | 0.5% |
| France | 29 | 0.2% |
| India | 61 | 0.3% |
| Israel | 33 | 0.2% |
| Latin America | 884 | 4.5% |
| Mexico | 847 | 4.4% |
| Northern Europe | 29 | 0.2% |
| Panama | 14 | 0.1% |
| Philippines | 78 | 0.4% |
| South Africa | 14 | 0.1% |
| South Central Asia | 87 | 0.4% |
| South Eastern Asia | 120 | 0.6% |
| Sweden | 14 | 0.1% |
| Switzerland | 25 | 0.1% |
| Ukraine | 24 | 0.1% |
| Vietnam | 42 | 0.2% |
| Western Asia | 33 | 0.2% |
| Western Europe | 54 | 0.3% | View All 26 Rows |
Sex and Age in Clifton
Sex and Age in Clifton
The most populous age groups in Clifton are 5 to 9 Years (1,007 | 10.6%) for men and 5 to 9 Years (945 | 9.5%) for women.
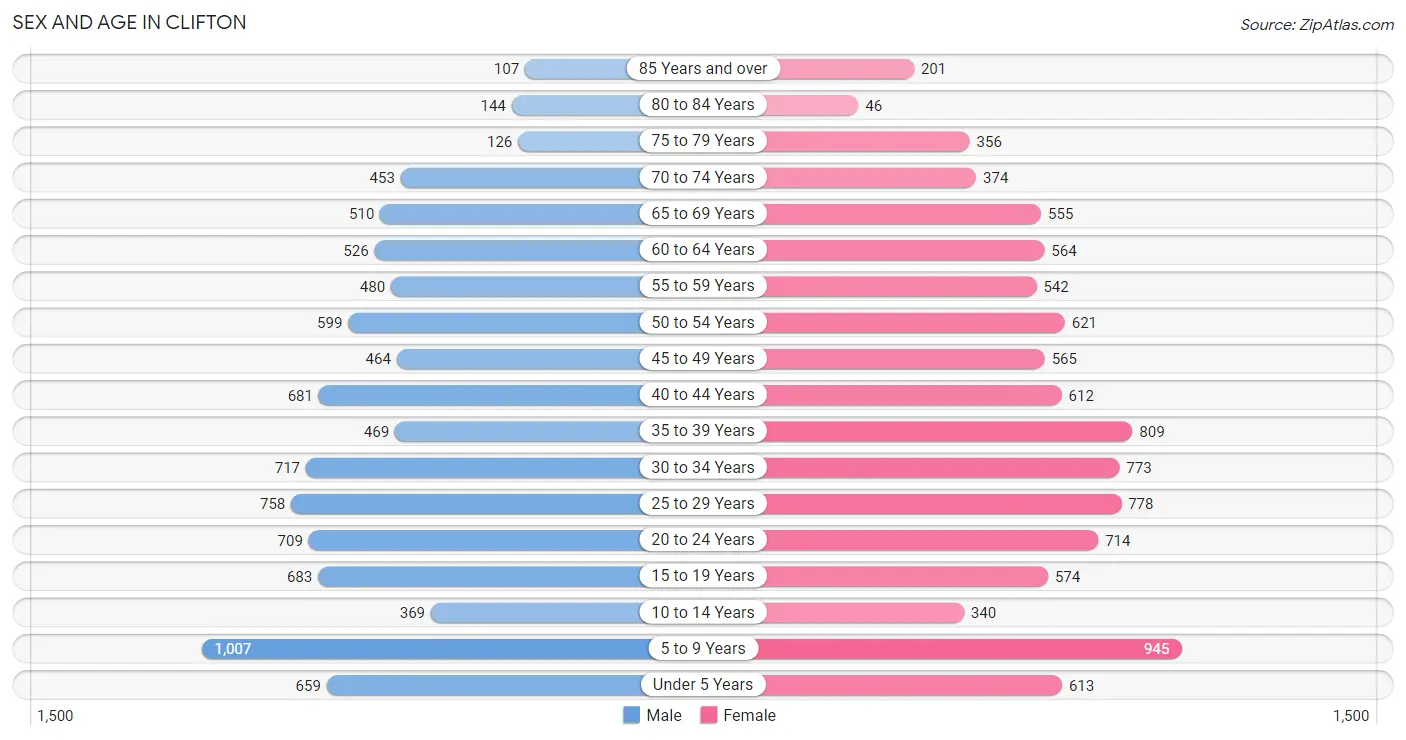
| Age Bracket | Male | Female |
| Under 5 Years | 659 (7.0%) | 613 (6.1%) |
| 5 to 9 Years | 1,007 (10.6%) | 945 (9.5%) |
| 10 to 14 Years | 369 (3.9%) | 340 (3.4%) |
| 15 to 19 Years | 683 (7.2%) | 574 (5.8%) |
| 20 to 24 Years | 709 (7.5%) | 714 (7.1%) |
| 25 to 29 Years | 758 (8.0%) | 778 (7.8%) |
| 30 to 34 Years | 717 (7.6%) | 773 (7.7%) |
| 35 to 39 Years | 469 (5.0%) | 809 (8.1%) |
| 40 to 44 Years | 681 (7.2%) | 612 (6.1%) |
| 45 to 49 Years | 464 (4.9%) | 565 (5.7%) |
| 50 to 54 Years | 599 (6.3%) | 621 (6.2%) |
| 55 to 59 Years | 480 (5.1%) | 542 (5.4%) |
| 60 to 64 Years | 526 (5.6%) | 564 (5.7%) |
| 65 to 69 Years | 510 (5.4%) | 555 (5.6%) |
| 70 to 74 Years | 453 (4.8%) | 374 (3.7%) |
| 75 to 79 Years | 126 (1.3%) | 356 (3.6%) |
| 80 to 84 Years | 144 (1.5%) | 46 (0.5%) |
| 85 Years and over | 107 (1.1%) | 201 (2.0%) |
| Total | 9,461 (100.0%) | 9,982 (100.0%) |
Families and Households in Clifton
Median Family Size in Clifton
The median family size in Clifton is 3.09 persons per family, with married-couple families (3,056 | 62.2%) accounting for the largest median family size of 3.32 persons per family. On the other hand, single male/father families (574 | 11.7%) represent the smallest median family size with 2.50 persons per family.
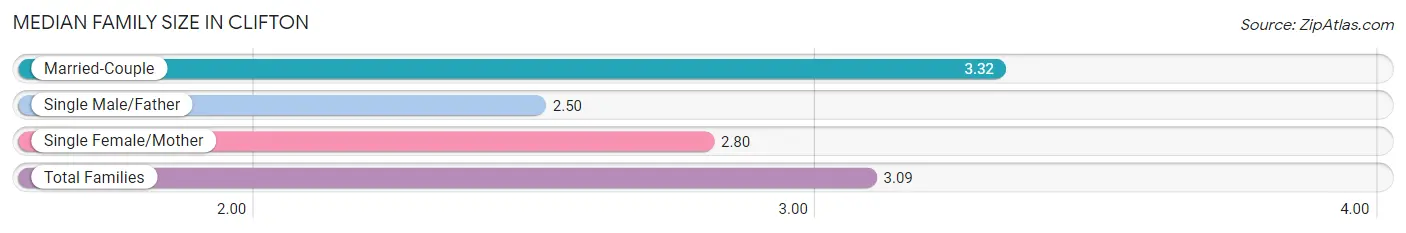
| Family Type | # Families | Family Size |
| Married-Couple | 3,056 (62.2%) | 3.32 |
| Single Male/Father | 574 (11.7%) | 2.50 |
| Single Female/Mother | 1,286 (26.2%) | 2.80 |
| Total Families | 4,916 (100.0%) | 3.09 |
Median Household Size in Clifton
The median household size in Clifton is 2.56 persons per household, with married-couple households (3,056 | 40.3%) accounting for the largest median household size of 3.37 persons per household. non-family households (2,673 | 35.2%) represent the smallest median household size with 1.35 persons per household.
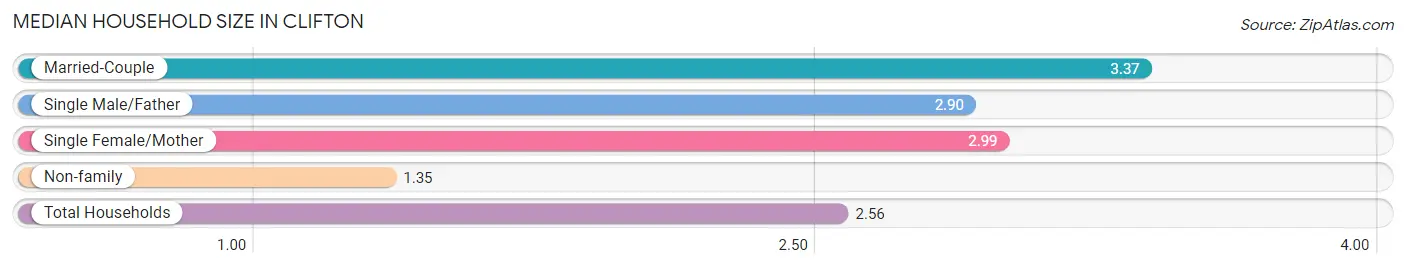
| Household Type | # Households | Household Size |
| Married-Couple | 3,056 (40.3%) | 3.37 |
| Single Male/Father | 574 (7.6%) | 2.90 |
| Single Female/Mother | 1,286 (17.0%) | 2.99 |
| Non-family | 2,673 (35.2%) | 1.35 |
| Total Households | 7,589 (100.0%) | 2.56 |
Household Size by Marriage Status in Clifton
Out of a total of 7,589 households in Clifton, 4,916 (64.8%) are family households, while 2,673 (35.2%) are nonfamily households. The most numerous type of family households are 2-person households, comprising 2,288, and the most common type of nonfamily households are 1-person households, comprising 1,927.
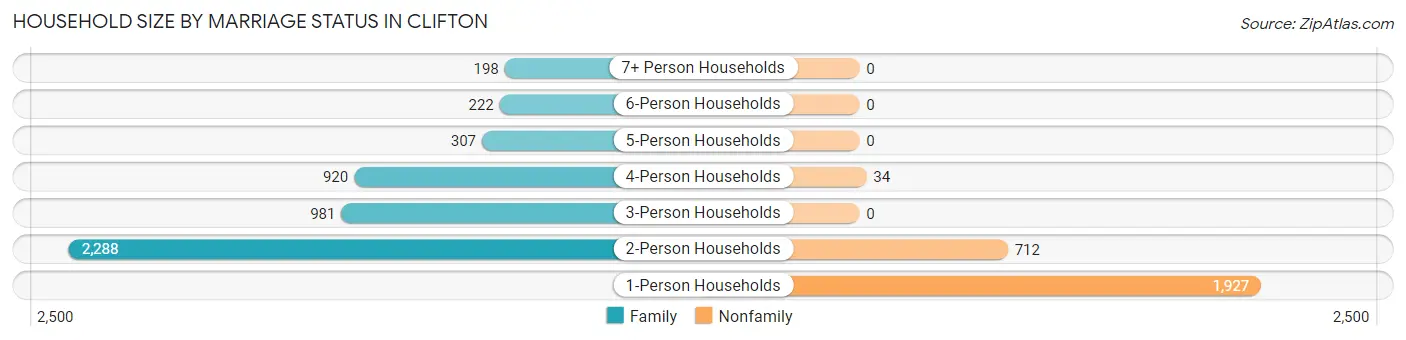
| Household Size | Family Households | Nonfamily Households |
| 1-Person Households | - | 1,927 (25.4%) |
| 2-Person Households | 2,288 (30.1%) | 712 (9.4%) |
| 3-Person Households | 981 (12.9%) | 0 (0.0%) |
| 4-Person Households | 920 (12.1%) | 34 (0.4%) |
| 5-Person Households | 307 (4.1%) | 0 (0.0%) |
| 6-Person Households | 222 (2.9%) | 0 (0.0%) |
| 7+ Person Households | 198 (2.6%) | 0 (0.0%) |
| Total | 4,916 (64.8%) | 2,673 (35.2%) |
Female Fertility in Clifton
Fertility by Age in Clifton
Average fertility rate in Clifton is 39.0 births per 1,000 women. Women in the age bracket of 20 to 34 years have the highest fertility rate with 67.0 births per 1,000 women. Women in the age bracket of 20 to 34 years acount for 80.0% of all women with births.
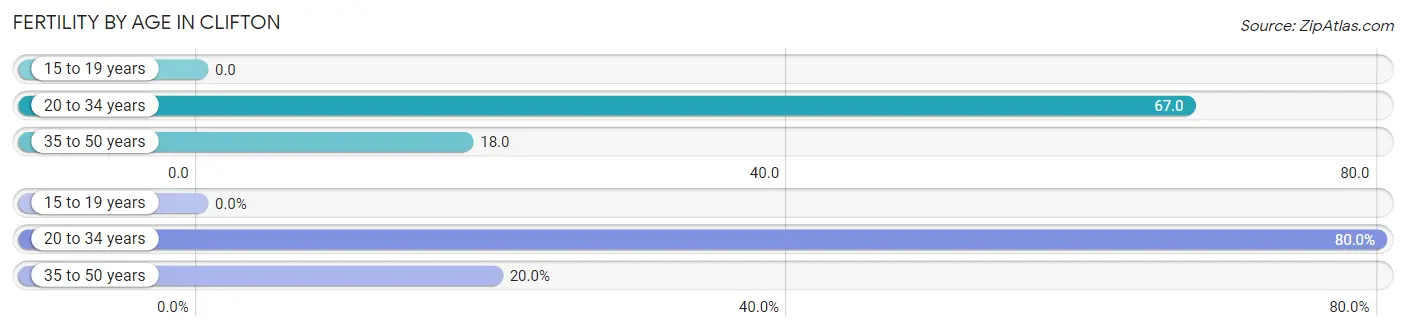
| Age Bracket | Women with Births | Births / 1,000 Women |
| 15 to 19 years | 0 (0.0%) | 0.0 |
| 20 to 34 years | 152 (80.0%) | 67.0 |
| 35 to 50 years | 38 (20.0%) | 18.0 |
| Total | 190 (100.0%) | 39.0 |
Fertility by Age by Marriage Status in Clifton
79.5% of women with births (190) in Clifton are married. The highest percentage of unmarried women with births falls into 20 to 34 years age bracket with 25.7% of them unmarried at the time of birth, while the lowest percentage of unmarried women with births belong to 35 to 50 years age bracket with 0.0% of them unmarried.
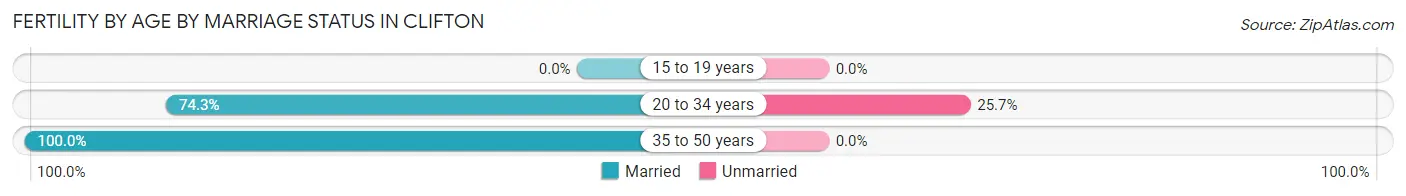
| Age Bracket | Married | Unmarried |
| 15 to 19 years | 0 (0.0%) | 0 (0.0%) |
| 20 to 34 years | 113 (74.3%) | 39 (25.7%) |
| 35 to 50 years | 38 (100.0%) | 0 (0.0%) |
| Total | 151 (79.5%) | 39 (20.5%) |
Fertility by Education in Clifton
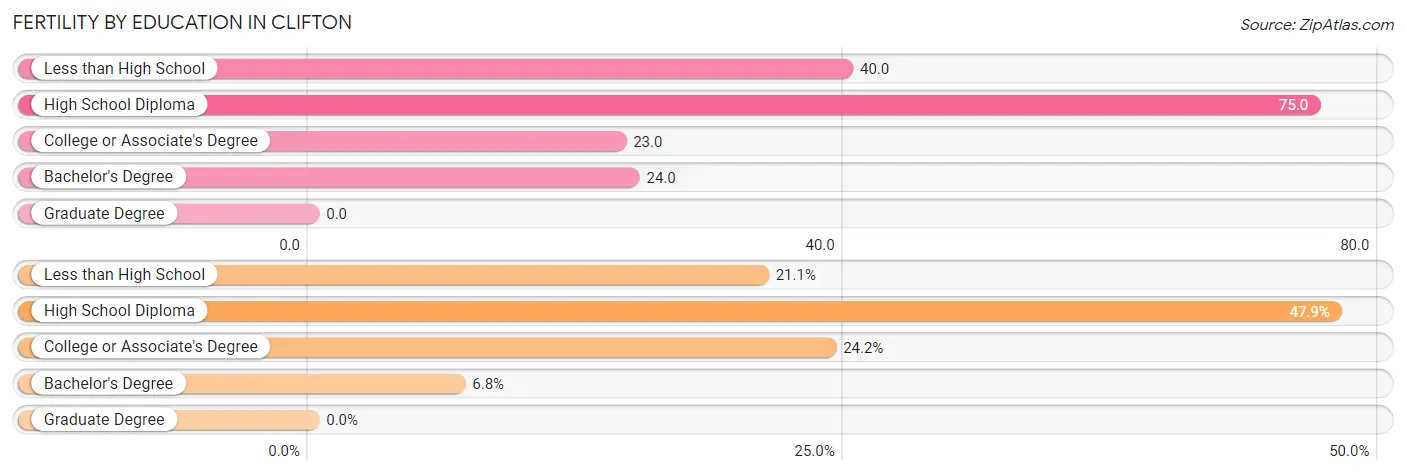
| Educational Attainment | Women with Births | Births / 1,000 Women |
| Less than High School | 40 (21.0%) | 40.0 |
| High School Diploma | 91 (47.9%) | 75.0 |
| College or Associate's Degree | 46 (24.2%) | 23.0 |
| Bachelor's Degree | 13 (6.8%) | 24.0 |
| Graduate Degree | 0 (0.0%) | 0.0 |
| Total | 190 (100.0%) | 39.0 |
Fertility by Education by Marriage Status in Clifton
20.5% of women with births in Clifton are unmarried. Women with the educational attainment of less than high school are most likely to be married with 100.0% of them married at childbirth, while women with the educational attainment of high school diploma are least likely to be married with 42.9% of them unmarried at childbirth.
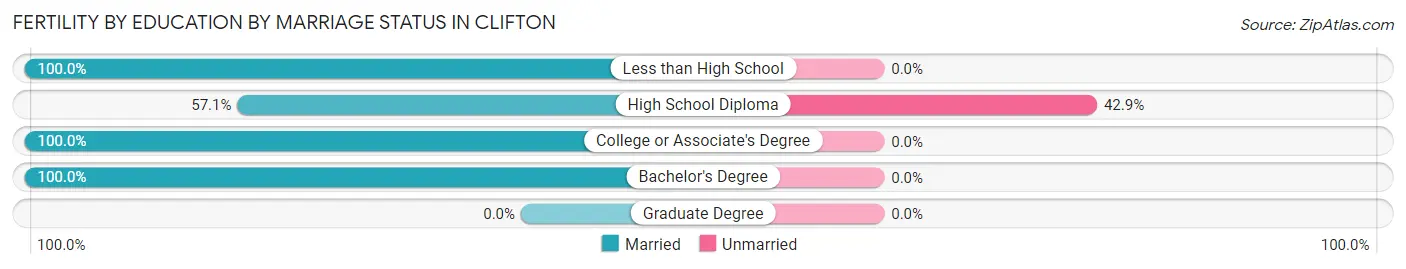
| Educational Attainment | Married | Unmarried |
| Less than High School | 40 (100.0%) | 0 (0.0%) |
| High School Diploma | 52 (57.1%) | 39 (42.9%) |
| College or Associate's Degree | 46 (100.0%) | 0 (0.0%) |
| Bachelor's Degree | 13 (100.0%) | 0 (0.0%) |
| Graduate Degree | 0 (0.0%) | 0 (0.0%) |
| Total | 151 (79.5%) | 39 (20.5%) |
Employment Characteristics in Clifton
Employment by Class of Employer in Clifton
Among the 8,427 employed individuals in Clifton, private company employees (5,942 | 70.5%), not-for-profit organizations (926 | 11.0%), and local government employees (548 | 6.5%) make up the most common classes of employment.
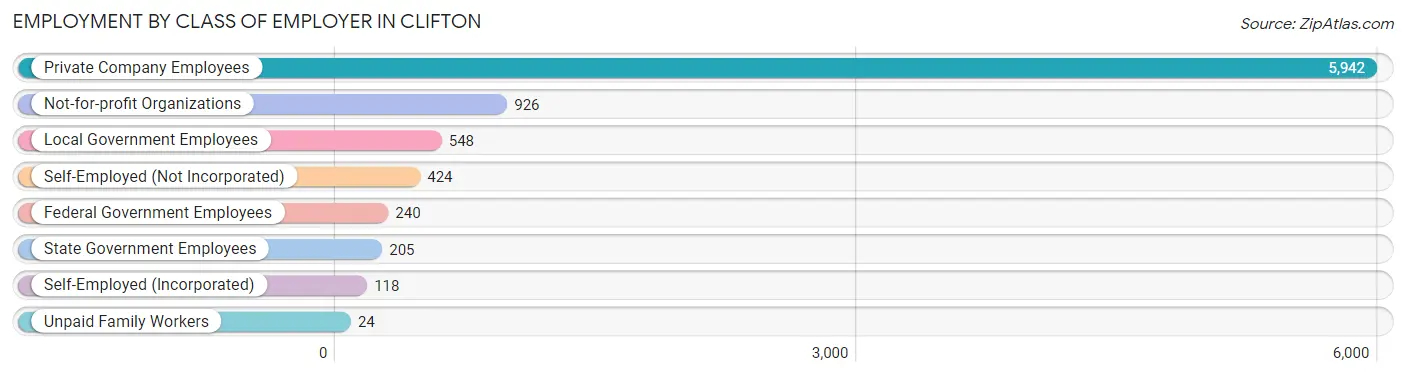
| Employer Class | # Employees | % Employees |
| Private Company Employees | 5,942 | 70.5% |
| Self-Employed (Incorporated) | 118 | 1.4% |
| Self-Employed (Not Incorporated) | 424 | 5.0% |
| Not-for-profit Organizations | 926 | 11.0% |
| Local Government Employees | 548 | 6.5% |
| State Government Employees | 205 | 2.4% |
| Federal Government Employees | 240 | 2.9% |
| Unpaid Family Workers | 24 | 0.3% |
| Total | 8,427 | 100.0% |
Employment Status by Age in Clifton
According to the labor force statistics for Clifton, out of the total population over 16 years of age (15,312), 62.1% or 9,509 individuals are in the labor force, with 9.1% or 865 of them unemployed. The age group with the highest labor force participation rate is 30 to 34 years, with 86.6% or 1,290 individuals in the labor force. Within the labor force, the 16 to 19 years age range has the highest percentage of unemployed individuals, with 24.9% or 112 of them being unemployed.
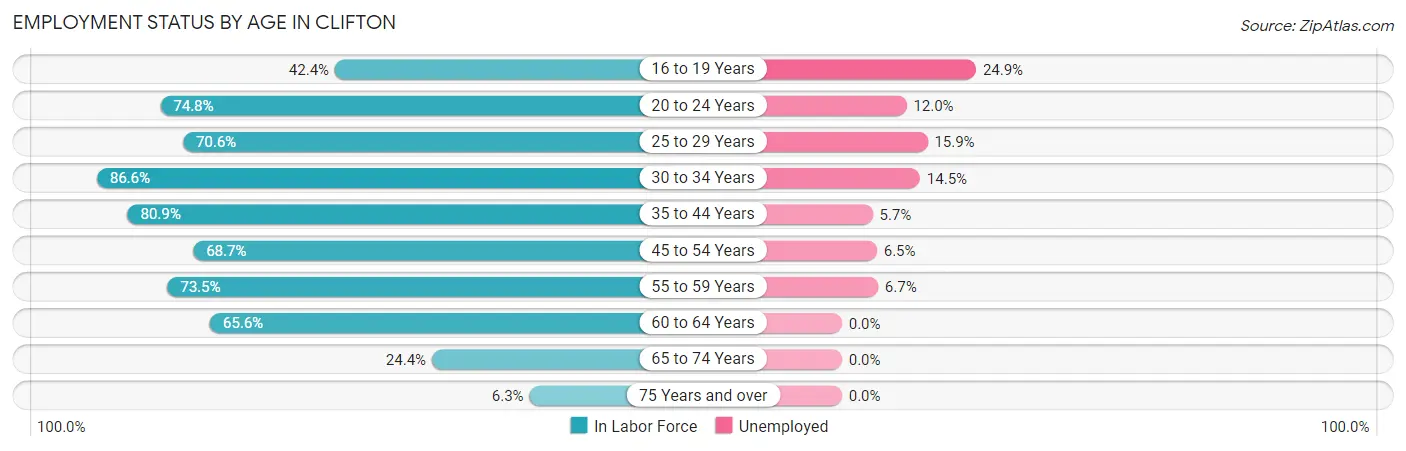
| Age Bracket | In Labor Force | Unemployed |
| 16 to 19 Years | 449 (42.4%) | 112 (24.9%) |
| 20 to 24 Years | 1,064 (74.8%) | 128 (12.0%) |
| 25 to 29 Years | 1,084 (70.6%) | 172 (15.9%) |
| 30 to 34 Years | 1,290 (86.6%) | 187 (14.5%) |
| 35 to 44 Years | 2,080 (80.9%) | 119 (5.7%) |
| 45 to 54 Years | 1,545 (68.7%) | 100 (6.5%) |
| 55 to 59 Years | 751 (73.5%) | 50 (6.7%) |
| 60 to 64 Years | 715 (65.6%) | 0 (0.0%) |
| 65 to 74 Years | 462 (24.4%) | 0 (0.0%) |
| 75 Years and over | 62 (6.3%) | 0 (0.0%) |
| Total | 9,509 (62.1%) | 865 (9.1%) |
Employment Status by Educational Attainment in Clifton
According to labor force statistics for Clifton, 75.0% of individuals (7,468) out of the total population between 25 and 64 years of age (9,958) are in the labor force, with 8.4% or 627 of them being unemployed. The group with the highest labor force participation rate are those with the educational attainment of college / associate degree, with 81.4% or 3,125 individuals in the labor force. Within the labor force, individuals with less than high school education have the highest percentage of unemployment, with 19.9% or 155 of them being unemployed.
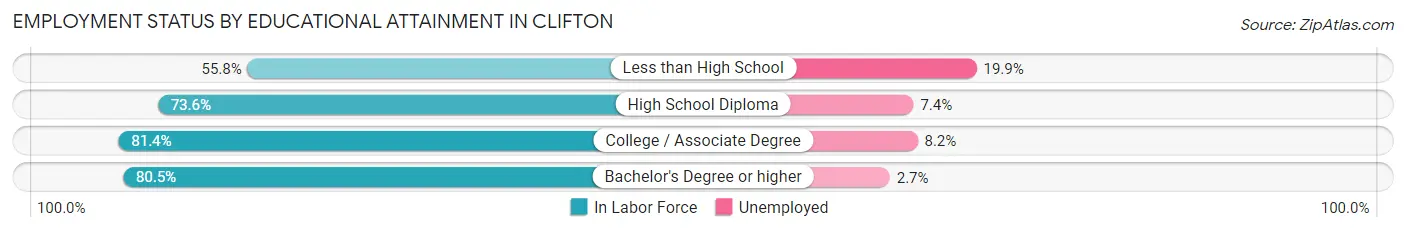
| Educational Attainment | In Labor Force | Unemployed |
| Less than High School | 778 (55.8%) | 278 (19.9%) |
| High School Diploma | 2,569 (73.6%) | 258 (7.4%) |
| College / Associate Degree | 3,125 (81.4%) | 315 (8.2%) |
| Bachelor's Degree or higher | 993 (80.5%) | 33 (2.7%) |
| Total | 7,468 (75.0%) | 836 (8.4%) |
Employment Occupations by Sex in Clifton
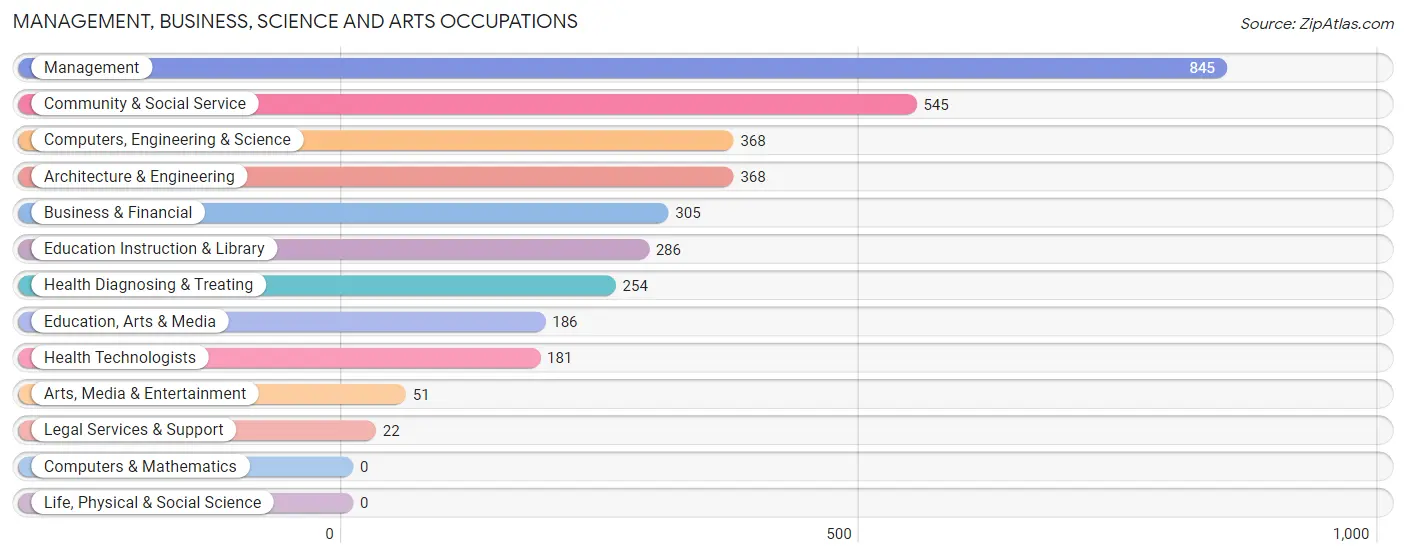
Management, Business, Science and Arts Occupations
The most common Management, Business, Science and Arts occupations in Clifton are Management (845 | 9.8%), Community & Social Service (545 | 6.3%), Computers, Engineering & Science (368 | 4.3%), Architecture & Engineering (368 | 4.3%), and Business & Financial (305 | 3.5%).
Management, Business, Science and Arts Occupations by Sex
Within the Management, Business, Science and Arts occupations in Clifton, the most male-oriented occupations are Legal Services & Support (100.0%), Computers, Engineering & Science (69.6%), and Architecture & Engineering (69.6%), while the most female-oriented occupations are Business & Financial (91.5%), Health Diagnosing & Treating (85.4%), and Education Instruction & Library (85.3%).
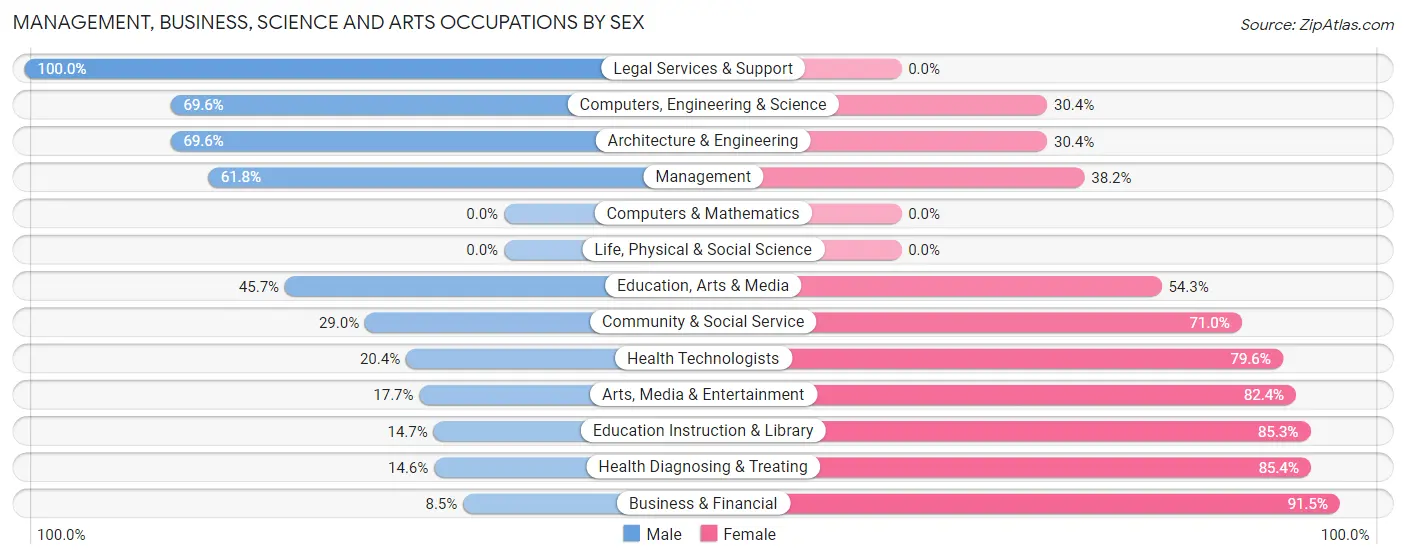
| Occupation | Male | Female |
| Management | 522 (61.8%) | 323 (38.2%) |
| Business & Financial | 26 (8.5%) | 279 (91.5%) |
| Computers, Engineering & Science | 256 (69.6%) | 112 (30.4%) |
| Computers & Mathematics | 0 (0.0%) | 0 (0.0%) |
| Architecture & Engineering | 256 (69.6%) | 112 (30.4%) |
| Life, Physical & Social Science | 0 (0.0%) | 0 (0.0%) |
| Community & Social Service | 158 (29.0%) | 387 (71.0%) |
| Education, Arts & Media | 85 (45.7%) | 101 (54.3%) |
| Legal Services & Support | 22 (100.0%) | 0 (0.0%) |
| Education Instruction & Library | 42 (14.7%) | 244 (85.3%) |
| Arts, Media & Entertainment | 9 (17.6%) | 42 (82.4%) |
| Health Diagnosing & Treating | 37 (14.6%) | 217 (85.4%) |
| Health Technologists | 37 (20.4%) | 144 (79.6%) |
| Total (Category) | 999 (43.1%) | 1,318 (56.9%) |
| Total (Overall) | 4,561 (52.8%) | 4,074 (47.2%) |
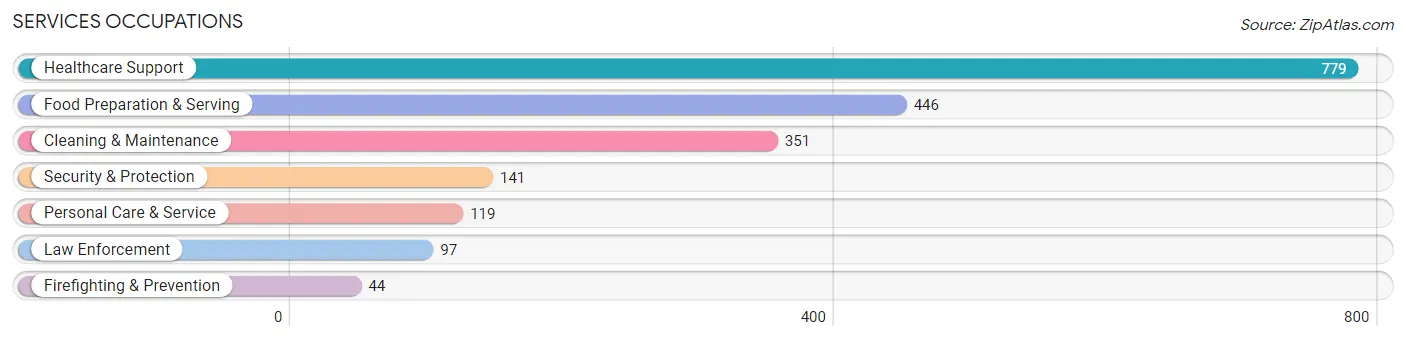
Services Occupations
The most common Services occupations in Clifton are Healthcare Support (779 | 9.0%), Food Preparation & Serving (446 | 5.2%), Cleaning & Maintenance (351 | 4.1%), Security & Protection (141 | 1.6%), and Personal Care & Service (119 | 1.4%).
Services Occupations by Sex
Within the Services occupations in Clifton, the most male-oriented occupations are Cleaning & Maintenance (62.1%), Firefighting & Prevention (54.5%), and Security & Protection (53.2%), while the most female-oriented occupations are Healthcare Support (87.8%), Personal Care & Service (85.7%), and Food Preparation & Serving (50.9%).
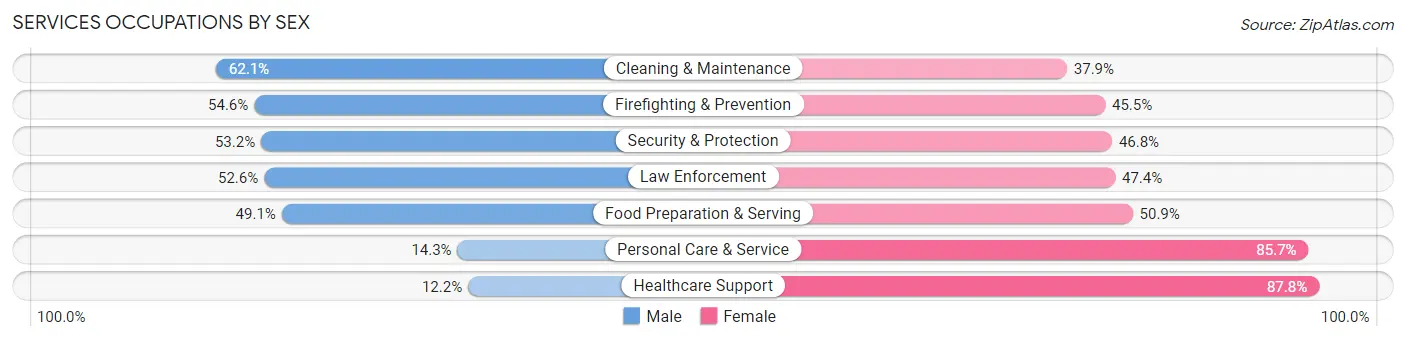
| Occupation | Male | Female |
| Healthcare Support | 95 (12.2%) | 684 (87.8%) |
| Security & Protection | 75 (53.2%) | 66 (46.8%) |
| Firefighting & Prevention | 24 (54.5%) | 20 (45.5%) |
| Law Enforcement | 51 (52.6%) | 46 (47.4%) |
| Food Preparation & Serving | 219 (49.1%) | 227 (50.9%) |
| Cleaning & Maintenance | 218 (62.1%) | 133 (37.9%) |
| Personal Care & Service | 17 (14.3%) | 102 (85.7%) |
| Total (Category) | 624 (34.0%) | 1,212 (66.0%) |
| Total (Overall) | 4,561 (52.8%) | 4,074 (47.2%) |
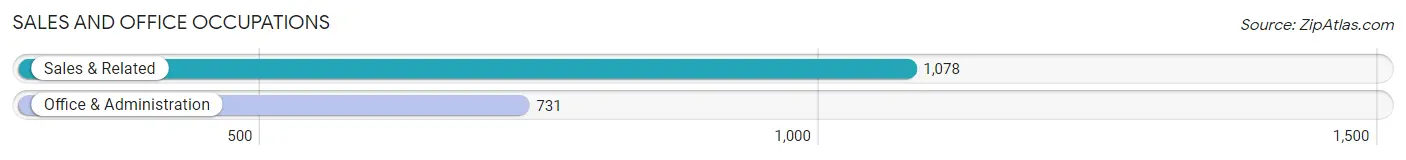
Sales and Office Occupations
The most common Sales and Office occupations in Clifton are Sales & Related (1,078 | 12.5%), and Office & Administration (731 | 8.5%).
Sales and Office Occupations by Sex
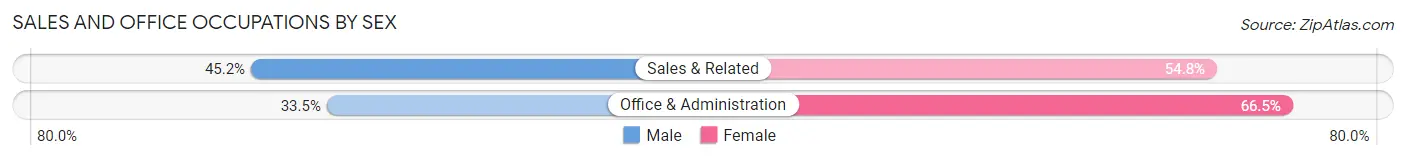
| Occupation | Male | Female |
| Sales & Related | 487 (45.2%) | 591 (54.8%) |
| Office & Administration | 245 (33.5%) | 486 (66.5%) |
| Total (Category) | 732 (40.5%) | 1,077 (59.5%) |
| Total (Overall) | 4,561 (52.8%) | 4,074 (47.2%) |
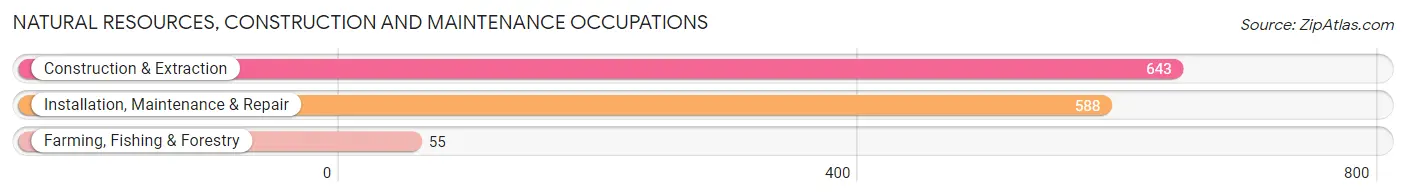
Natural Resources, Construction and Maintenance Occupations
The most common Natural Resources, Construction and Maintenance occupations in Clifton are Construction & Extraction (643 | 7.4%), Installation, Maintenance & Repair (588 | 6.8%), and Farming, Fishing & Forestry (55 | 0.6%).
Natural Resources, Construction and Maintenance Occupations by Sex
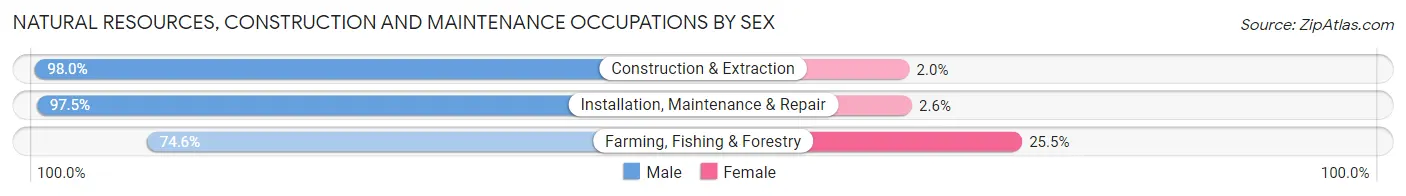
| Occupation | Male | Female |
| Farming, Fishing & Forestry | 41 (74.6%) | 14 (25.5%) |
| Construction & Extraction | 630 (98.0%) | 13 (2.0%) |
| Installation, Maintenance & Repair | 573 (97.5%) | 15 (2.5%) |
| Total (Category) | 1,244 (96.7%) | 42 (3.3%) |
| Total (Overall) | 4,561 (52.8%) | 4,074 (47.2%) |
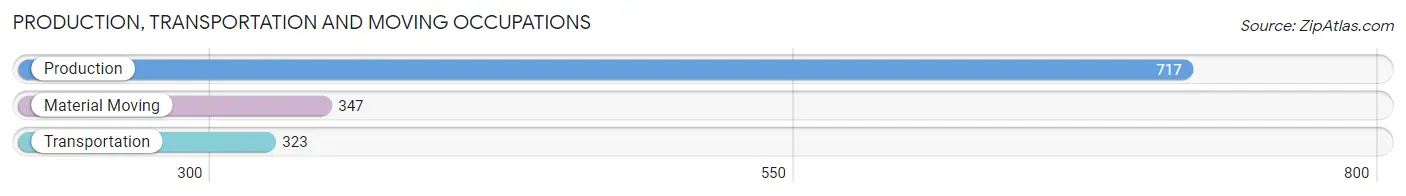
Production, Transportation and Moving Occupations
The most common Production, Transportation and Moving occupations in Clifton are Production (717 | 8.3%), Material Moving (347 | 4.0%), and Transportation (323 | 3.7%).
Production, Transportation and Moving Occupations by Sex
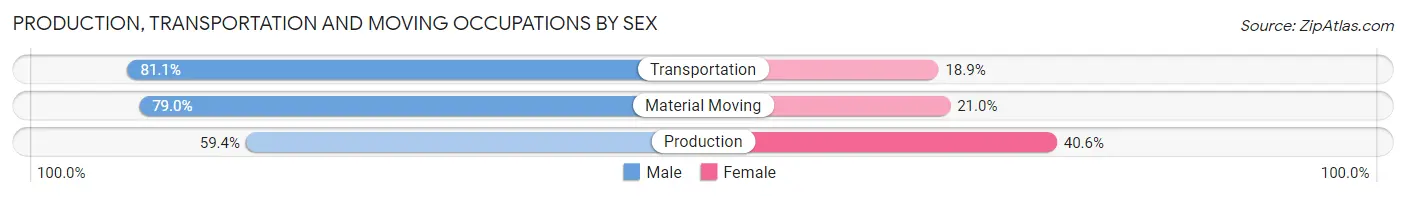
| Occupation | Male | Female |
| Production | 426 (59.4%) | 291 (40.6%) |
| Transportation | 262 (81.1%) | 61 (18.9%) |
| Material Moving | 274 (79.0%) | 73 (21.0%) |
| Total (Category) | 962 (69.4%) | 425 (30.6%) |
| Total (Overall) | 4,561 (52.8%) | 4,074 (47.2%) |
Employment Industries by Sex in Clifton
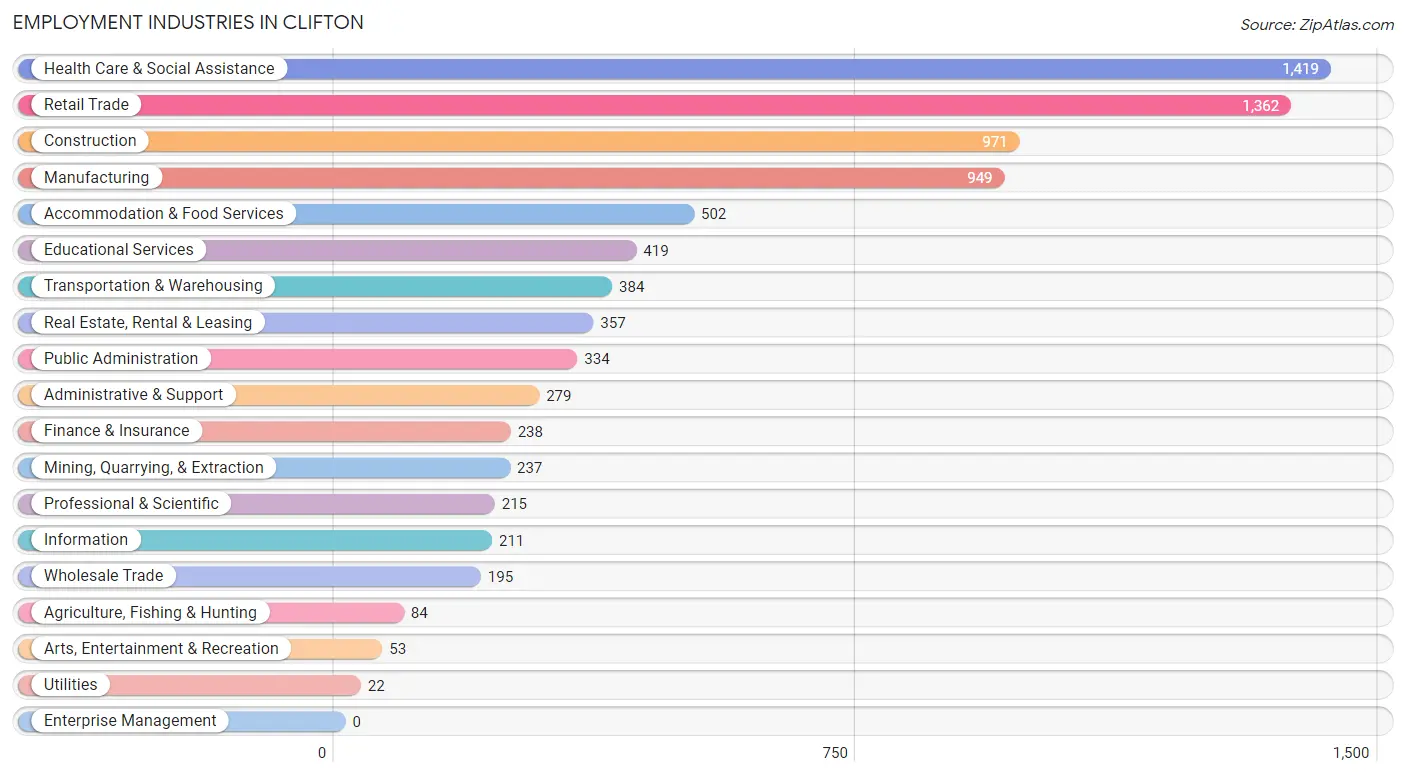
Employment Industries in Clifton
The major employment industries in Clifton include Health Care & Social Assistance (1,419 | 16.4%), Retail Trade (1,362 | 15.8%), Construction (971 | 11.2%), Manufacturing (949 | 11.0%), and Accommodation & Food Services (502 | 5.8%).
Employment Industries by Sex in Clifton
The Clifton industries that see more men than women are Agriculture, Fishing & Hunting (100.0%), Mining, Quarrying, & Extraction (100.0%), and Utilities (100.0%), whereas the industries that tend to have a higher number of women are Health Care & Social Assistance (83.7%), Educational Services (80.2%), and Finance & Insurance (74.8%).
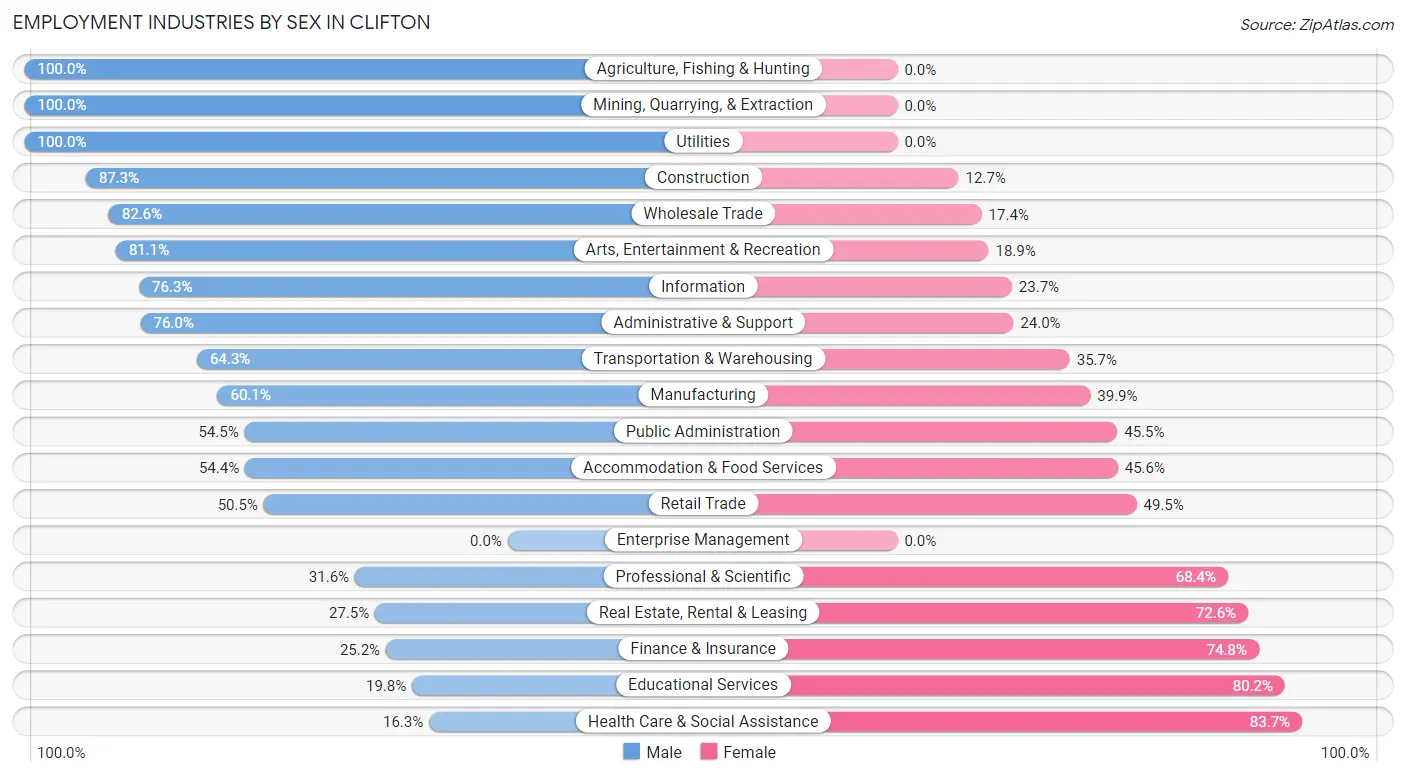
| Industry | Male | Female |
| Agriculture, Fishing & Hunting | 84 (100.0%) | 0 (0.0%) |
| Mining, Quarrying, & Extraction | 237 (100.0%) | 0 (0.0%) |
| Construction | 848 (87.3%) | 123 (12.7%) |
| Manufacturing | 570 (60.1%) | 379 (39.9%) |
| Wholesale Trade | 161 (82.6%) | 34 (17.4%) |
| Retail Trade | 688 (50.5%) | 674 (49.5%) |
| Transportation & Warehousing | 247 (64.3%) | 137 (35.7%) |
| Utilities | 22 (100.0%) | 0 (0.0%) |
| Information | 161 (76.3%) | 50 (23.7%) |
| Finance & Insurance | 60 (25.2%) | 178 (74.8%) |
| Real Estate, Rental & Leasing | 98 (27.5%) | 259 (72.6%) |
| Professional & Scientific | 68 (31.6%) | 147 (68.4%) |
| Enterprise Management | 0 (0.0%) | 0 (0.0%) |
| Administrative & Support | 212 (76.0%) | 67 (24.0%) |
| Educational Services | 83 (19.8%) | 336 (80.2%) |
| Health Care & Social Assistance | 231 (16.3%) | 1,188 (83.7%) |
| Arts, Entertainment & Recreation | 43 (81.1%) | 10 (18.9%) |
| Accommodation & Food Services | 273 (54.4%) | 229 (45.6%) |
| Public Administration | 182 (54.5%) | 152 (45.5%) |
| Total | 4,561 (52.8%) | 4,074 (47.2%) |
Education in Clifton
School Enrollment in Clifton
The most common levels of schooling among the 4,504 students in Clifton are elementary school (1,473 | 32.7%), high school (1,085 | 24.1%), and college / undergraduate (843 | 18.7%).
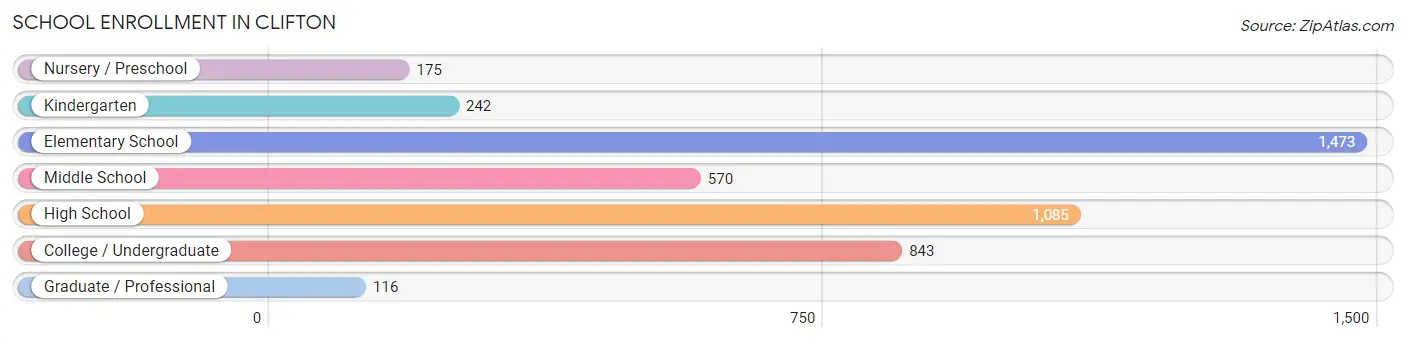
| School Level | # Students | % Students |
| Nursery / Preschool | 175 | 3.9% |
| Kindergarten | 242 | 5.4% |
| Elementary School | 1,473 | 32.7% |
| Middle School | 570 | 12.7% |
| High School | 1,085 | 24.1% |
| College / Undergraduate | 843 | 18.7% |
| Graduate / Professional | 116 | 2.6% |
| Total | 4,504 | 100.0% |
School Enrollment by Age by Funding Source in Clifton
Out of a total of 4,504 students who are enrolled in schools in Clifton, 270 (6.0%) attend a private institution, while the remaining 4,234 (94.0%) are enrolled in public schools. The age group of 3 to 4 year olds has the highest likelihood of being enrolled in private schools, with 28 (16.0% in the age bracket) enrolled. Conversely, the age group of 18 to 19 year olds has the lowest likelihood of being enrolled in a private school, with 237 (100.0% in the age bracket) attending a public institution.
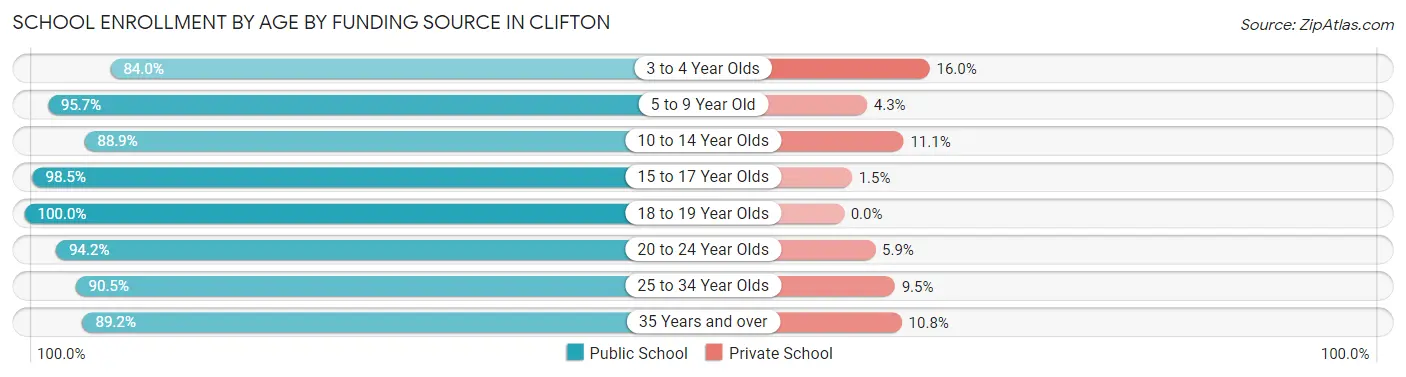
| Age Bracket | Public School | Private School |
| 3 to 4 Year Olds | 147 (84.0%) | 28 (16.0%) |
| 5 to 9 Year Old | 1,593 (95.7%) | 72 (4.3%) |
| 10 to 14 Year Olds | 630 (88.9%) | 79 (11.1%) |
| 15 to 17 Year Olds | 789 (98.5%) | 12 (1.5%) |
| 18 to 19 Year Olds | 237 (100.0%) | 0 (0.0%) |
| 20 to 24 Year Olds | 306 (94.2%) | 19 (5.9%) |
| 25 to 34 Year Olds | 276 (90.5%) | 29 (9.5%) |
| 35 Years and over | 256 (89.2%) | 31 (10.8%) |
| Total | 4,234 (94.0%) | 270 (6.0%) |
Educational Attainment by Field of Study in Clifton
Business (313 | 18.5%), science & technology (224 | 13.3%), engineering (222 | 13.2%), psychology (158 | 9.4%), and literature & languages (144 | 8.5%) are the most common fields of study among 1,687 individuals in Clifton who have obtained a bachelor's degree or higher.
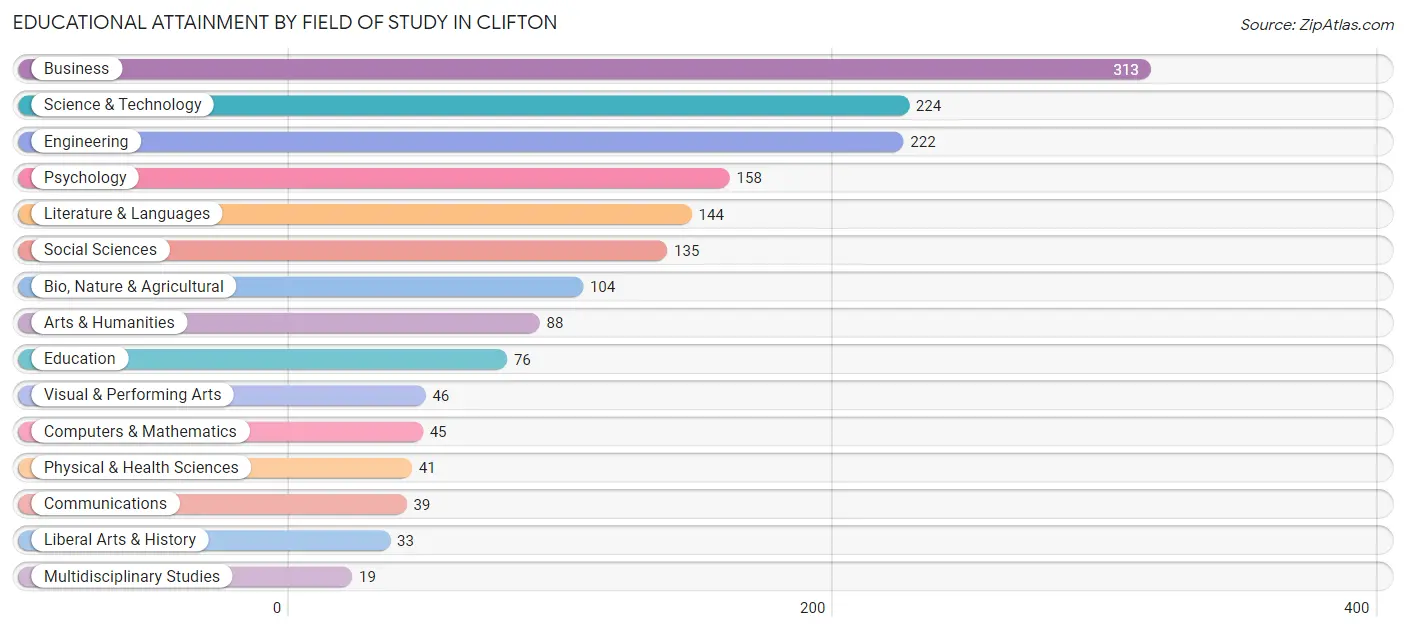
| Field of Study | # Graduates | % Graduates |
| Computers & Mathematics | 45 | 2.7% |
| Bio, Nature & Agricultural | 104 | 6.2% |
| Physical & Health Sciences | 41 | 2.4% |
| Psychology | 158 | 9.4% |
| Social Sciences | 135 | 8.0% |
| Engineering | 222 | 13.2% |
| Multidisciplinary Studies | 19 | 1.1% |
| Science & Technology | 224 | 13.3% |
| Business | 313 | 18.5% |
| Education | 76 | 4.5% |
| Literature & Languages | 144 | 8.5% |
| Liberal Arts & History | 33 | 2.0% |
| Visual & Performing Arts | 46 | 2.7% |
| Communications | 39 | 2.3% |
| Arts & Humanities | 88 | 5.2% |
| Total | 1,687 | 100.0% |
Transportation & Commute in Clifton
Vehicle Availability by Sex in Clifton
The most prevalent vehicle ownership categories in Clifton are males with 2 vehicles (1,870, accounting for 41.4%) and females with 2 vehicles (1,880, making up 48.2%).
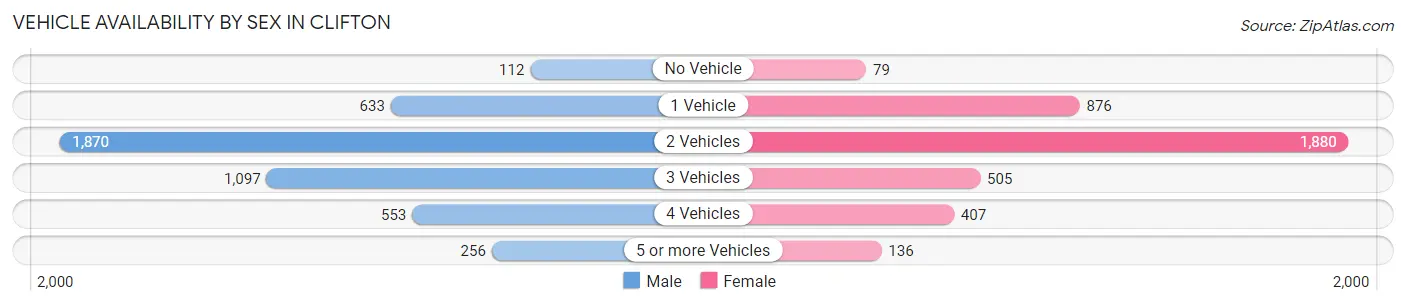
| Vehicles Available | Male | Female |
| No Vehicle | 112 (2.5%) | 79 (2.0%) |
| 1 Vehicle | 633 (14.0%) | 876 (22.6%) |
| 2 Vehicles | 1,870 (41.4%) | 1,880 (48.4%) |
| 3 Vehicles | 1,097 (24.3%) | 505 (13.0%) |
| 4 Vehicles | 553 (12.2%) | 407 (10.5%) |
| 5 or more Vehicles | 256 (5.7%) | 136 (3.5%) |
| Total | 4,521 (100.0%) | 3,883 (100.0%) |
Commute Time in Clifton
The most frequently occuring commute durations in Clifton are 15 to 19 minutes (2,161 commuters, 29.0%), 20 to 24 minutes (1,806 commuters, 24.3%), and 10 to 14 minutes (1,723 commuters, 23.2%).
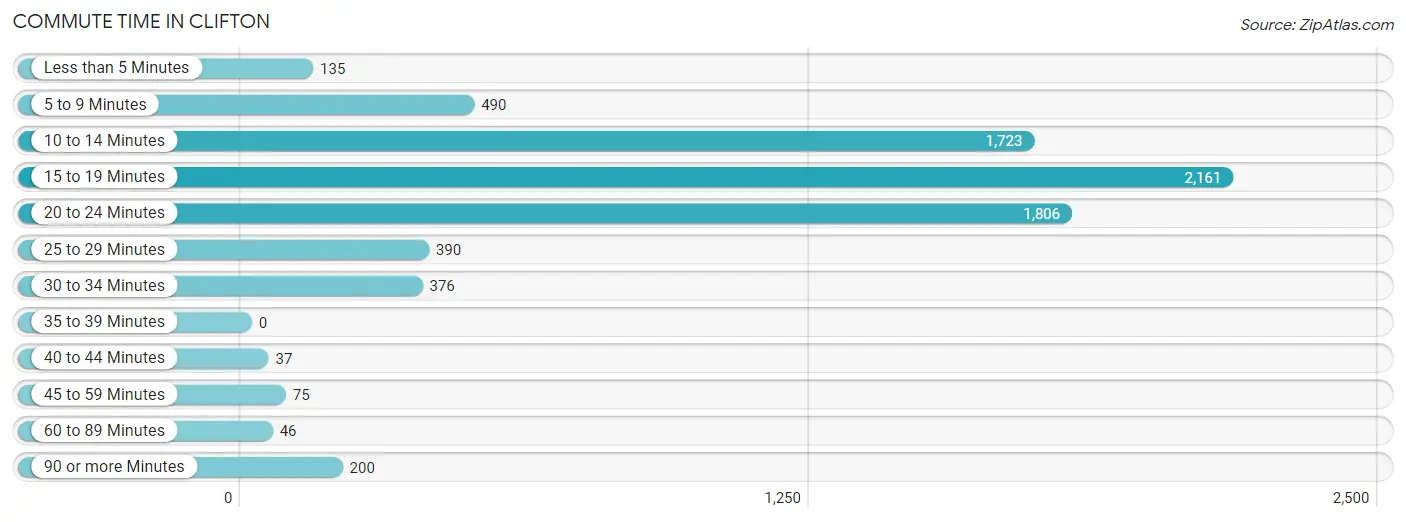
| Commute Time | # Commuters | % Commuters |
| Less than 5 Minutes | 135 | 1.8% |
| 5 to 9 Minutes | 490 | 6.6% |
| 10 to 14 Minutes | 1,723 | 23.2% |
| 15 to 19 Minutes | 2,161 | 29.0% |
| 20 to 24 Minutes | 1,806 | 24.3% |
| 25 to 29 Minutes | 390 | 5.2% |
| 30 to 34 Minutes | 376 | 5.1% |
| 35 to 39 Minutes | 0 | 0.0% |
| 40 to 44 Minutes | 37 | 0.5% |
| 45 to 59 Minutes | 75 | 1.0% |
| 60 to 89 Minutes | 46 | 0.6% |
| 90 or more Minutes | 200 | 2.7% |
Commute Time by Sex in Clifton
The most common commute times in Clifton are 15 to 19 minutes (1,165 commuters, 29.9%) for males and 15 to 19 minutes (996 commuters, 28.1%) for females.
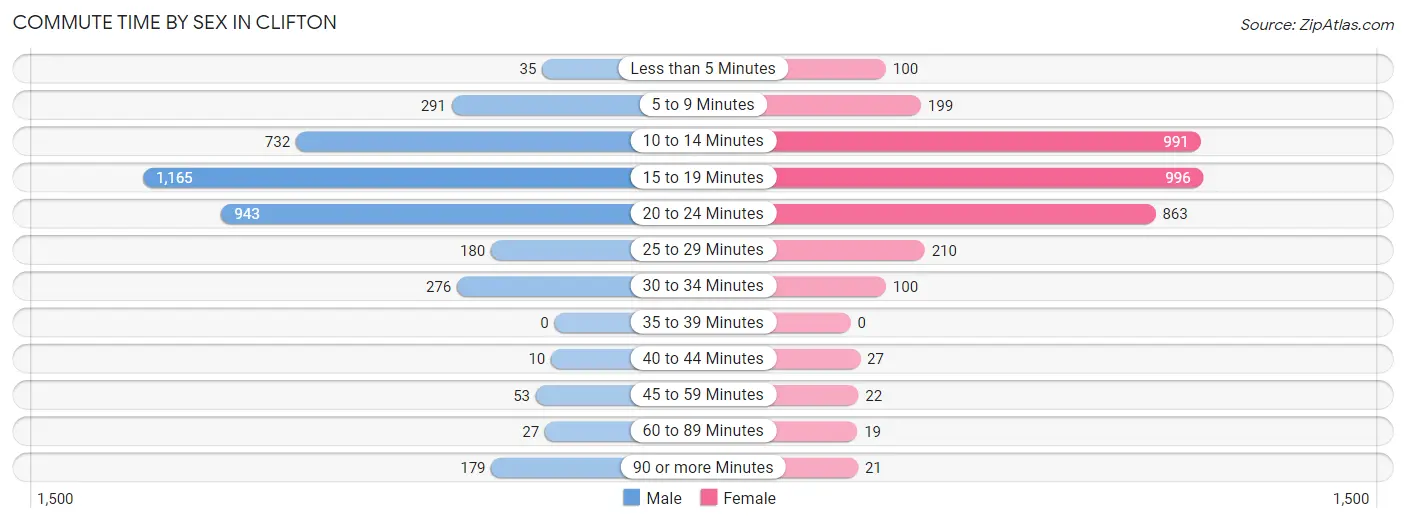
| Commute Time | Male | Female |
| Less than 5 Minutes | 35 (0.9%) | 100 (2.8%) |
| 5 to 9 Minutes | 291 (7.5%) | 199 (5.6%) |
| 10 to 14 Minutes | 732 (18.8%) | 991 (27.9%) |
| 15 to 19 Minutes | 1,165 (29.9%) | 996 (28.1%) |
| 20 to 24 Minutes | 943 (24.2%) | 863 (24.3%) |
| 25 to 29 Minutes | 180 (4.6%) | 210 (5.9%) |
| 30 to 34 Minutes | 276 (7.1%) | 100 (2.8%) |
| 35 to 39 Minutes | 0 (0.0%) | 0 (0.0%) |
| 40 to 44 Minutes | 10 (0.3%) | 27 (0.8%) |
| 45 to 59 Minutes | 53 (1.4%) | 22 (0.6%) |
| 60 to 89 Minutes | 27 (0.7%) | 19 (0.5%) |
| 90 or more Minutes | 179 (4.6%) | 21 (0.6%) |
Time of Departure to Work by Sex in Clifton
The most frequent times of departure to work in Clifton are 6:30 AM to 6:59 AM (653, 16.8%) for males and 7:30 AM to 7:59 AM (527, 14.8%) for females.
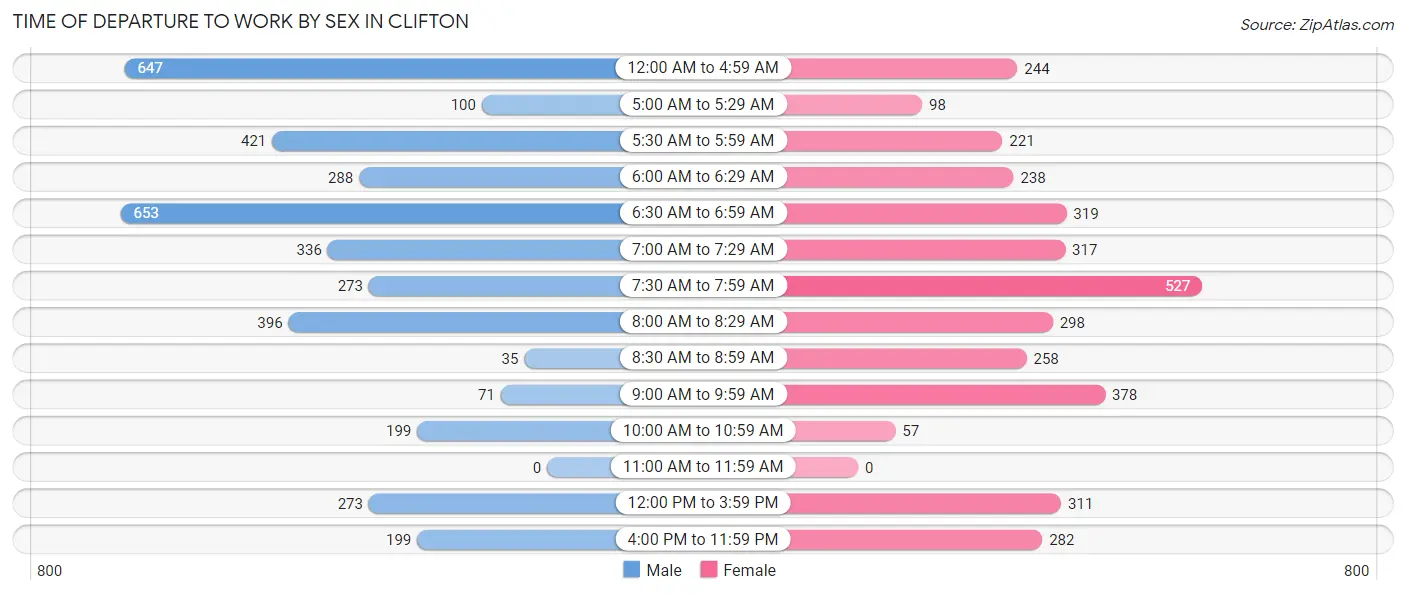
| Time of Departure | Male | Female |
| 12:00 AM to 4:59 AM | 647 (16.6%) | 244 (6.9%) |
| 5:00 AM to 5:29 AM | 100 (2.6%) | 98 (2.8%) |
| 5:30 AM to 5:59 AM | 421 (10.8%) | 221 (6.2%) |
| 6:00 AM to 6:29 AM | 288 (7.4%) | 238 (6.7%) |
| 6:30 AM to 6:59 AM | 653 (16.8%) | 319 (9.0%) |
| 7:00 AM to 7:29 AM | 336 (8.6%) | 317 (8.9%) |
| 7:30 AM to 7:59 AM | 273 (7.0%) | 527 (14.8%) |
| 8:00 AM to 8:29 AM | 396 (10.2%) | 298 (8.4%) |
| 8:30 AM to 8:59 AM | 35 (0.9%) | 258 (7.3%) |
| 9:00 AM to 9:59 AM | 71 (1.8%) | 378 (10.6%) |
| 10:00 AM to 10:59 AM | 199 (5.1%) | 57 (1.6%) |
| 11:00 AM to 11:59 AM | 0 (0.0%) | 0 (0.0%) |
| 12:00 PM to 3:59 PM | 273 (7.0%) | 311 (8.8%) |
| 4:00 PM to 11:59 PM | 199 (5.1%) | 282 (8.0%) |
| Total | 3,891 (100.0%) | 3,548 (100.0%) |
Housing Occupancy in Clifton
Occupancy by Ownership in Clifton
Of the total 7,589 dwellings in Clifton, owner-occupied units account for 5,448 (71.8%), while renter-occupied units make up 2,141 (28.2%).
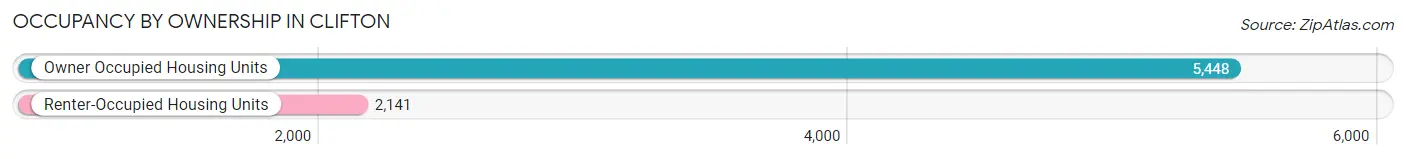
| Occupancy | # Housing Units | % Housing Units |
| Owner Occupied Housing Units | 5,448 | 71.8% |
| Renter-Occupied Housing Units | 2,141 | 28.2% |
| Total Occupied Housing Units | 7,589 | 100.0% |
Occupancy by Household Size in Clifton
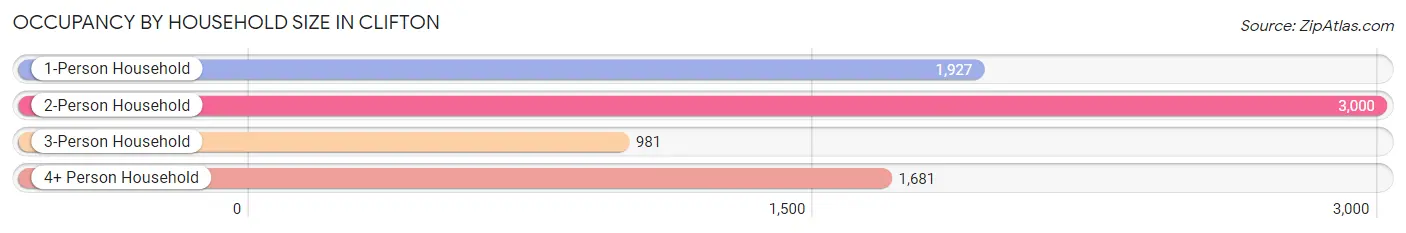
| Household Size | # Housing Units | % Housing Units |
| 1-Person Household | 1,927 | 25.4% |
| 2-Person Household | 3,000 | 39.5% |
| 3-Person Household | 981 | 12.9% |
| 4+ Person Household | 1,681 | 22.2% |
| Total Housing Units | 7,589 | 100.0% |
Occupancy by Ownership by Household Size in Clifton
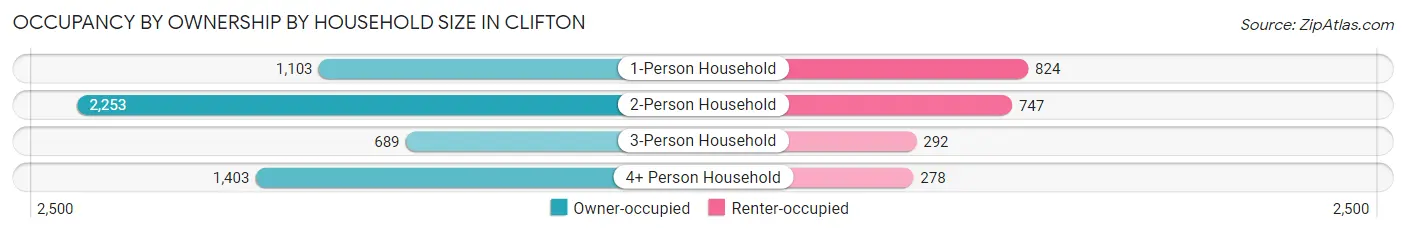
| Household Size | Owner-occupied | Renter-occupied |
| 1-Person Household | 1,103 (57.2%) | 824 (42.8%) |
| 2-Person Household | 2,253 (75.1%) | 747 (24.9%) |
| 3-Person Household | 689 (70.2%) | 292 (29.8%) |
| 4+ Person Household | 1,403 (83.5%) | 278 (16.5%) |
| Total Housing Units | 5,448 (71.8%) | 2,141 (28.2%) |
Occupancy by Educational Attainment in Clifton
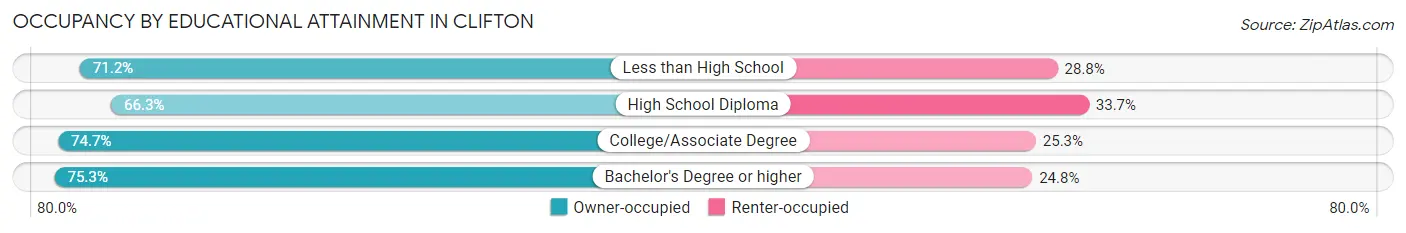
| Household Size | Owner-occupied | Renter-occupied |
| Less than High School | 537 (71.2%) | 217 (28.8%) |
| High School Diploma | 1,568 (66.3%) | 798 (33.7%) |
| College/Associate Degree | 2,580 (74.7%) | 875 (25.3%) |
| Bachelor's Degree or higher | 763 (75.2%) | 251 (24.7%) |
Occupancy by Age of Householder in Clifton
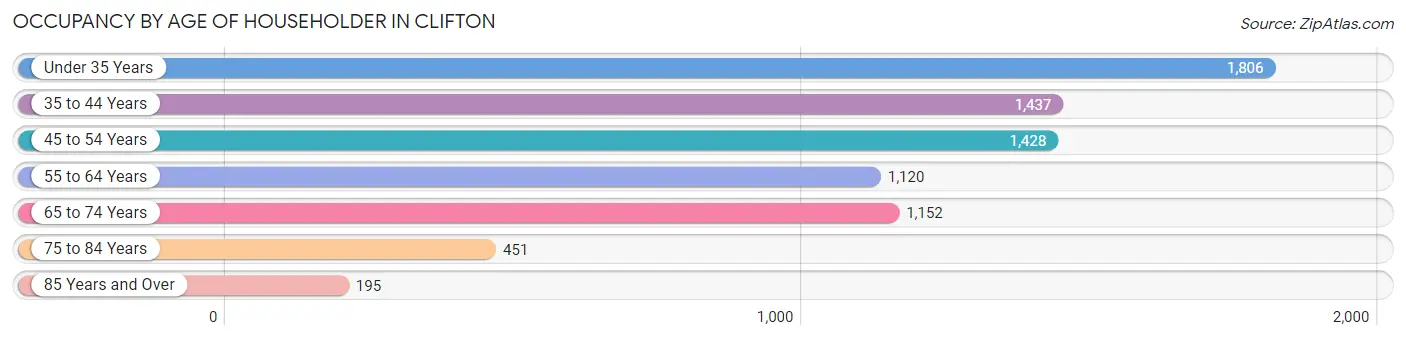
| Age Bracket | # Households | % Households |
| Under 35 Years | 1,806 | 23.8% |
| 35 to 44 Years | 1,437 | 18.9% |
| 45 to 54 Years | 1,428 | 18.8% |
| 55 to 64 Years | 1,120 | 14.8% |
| 65 to 74 Years | 1,152 | 15.2% |
| 75 to 84 Years | 451 | 5.9% |
| 85 Years and Over | 195 | 2.6% |
| Total | 7,589 | 100.0% |
Housing Finances in Clifton
Median Income by Occupancy in Clifton
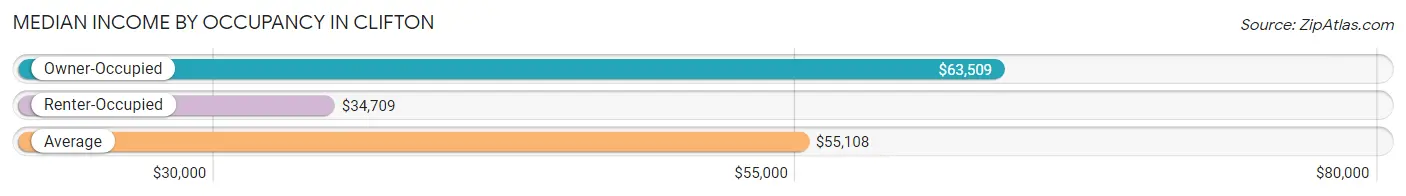
| Occupancy Type | # Households | Median Income |
| Owner-Occupied | 5,448 (71.8%) | $63,509 |
| Renter-Occupied | 2,141 (28.2%) | $34,709 |
| Average | 7,589 (100.0%) | $55,108 |
Occupancy by Householder Income Bracket in Clifton
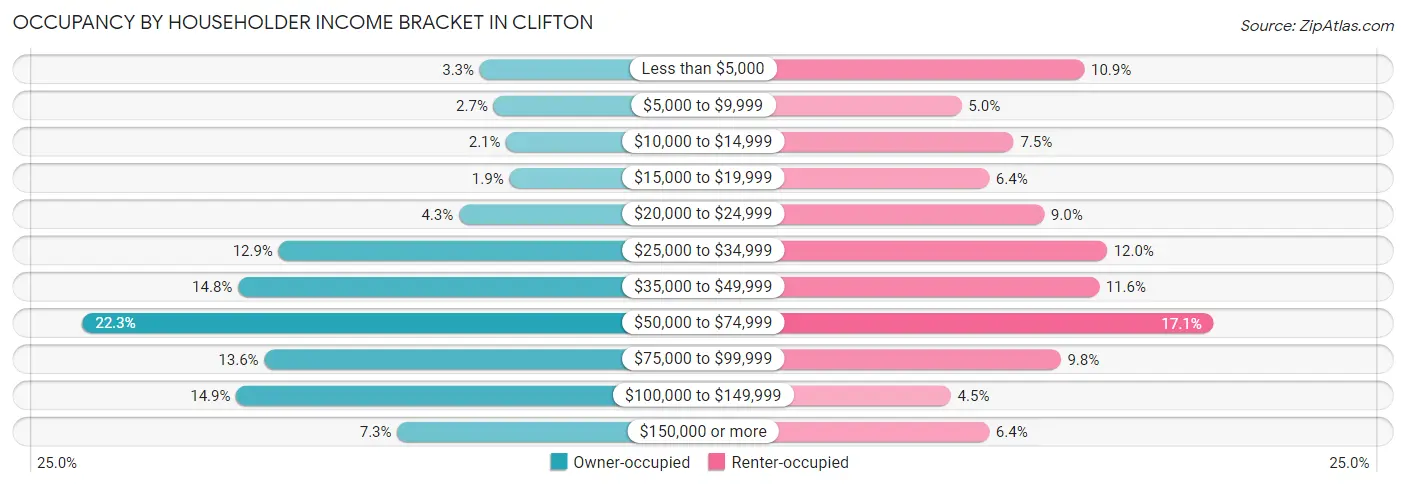
| Income Bracket | Owner-occupied | Renter-occupied |
| Less than $5,000 | 181 (3.3%) | 233 (10.9%) |
| $5,000 to $9,999 | 145 (2.7%) | 108 (5.0%) |
| $10,000 to $14,999 | 112 (2.1%) | 161 (7.5%) |
| $15,000 to $19,999 | 104 (1.9%) | 136 (6.4%) |
| $20,000 to $24,999 | 235 (4.3%) | 192 (9.0%) |
| $25,000 to $34,999 | 703 (12.9%) | 256 (12.0%) |
| $35,000 to $49,999 | 808 (14.8%) | 248 (11.6%) |
| $50,000 to $74,999 | 1,212 (22.3%) | 365 (17.1%) |
| $75,000 to $99,999 | 740 (13.6%) | 209 (9.8%) |
| $100,000 to $149,999 | 813 (14.9%) | 97 (4.5%) |
| $150,000 or more | 395 (7.2%) | 136 (6.4%) |
| Total | 5,448 (100.0%) | 2,141 (100.0%) |
Monthly Housing Cost Tiers in Clifton
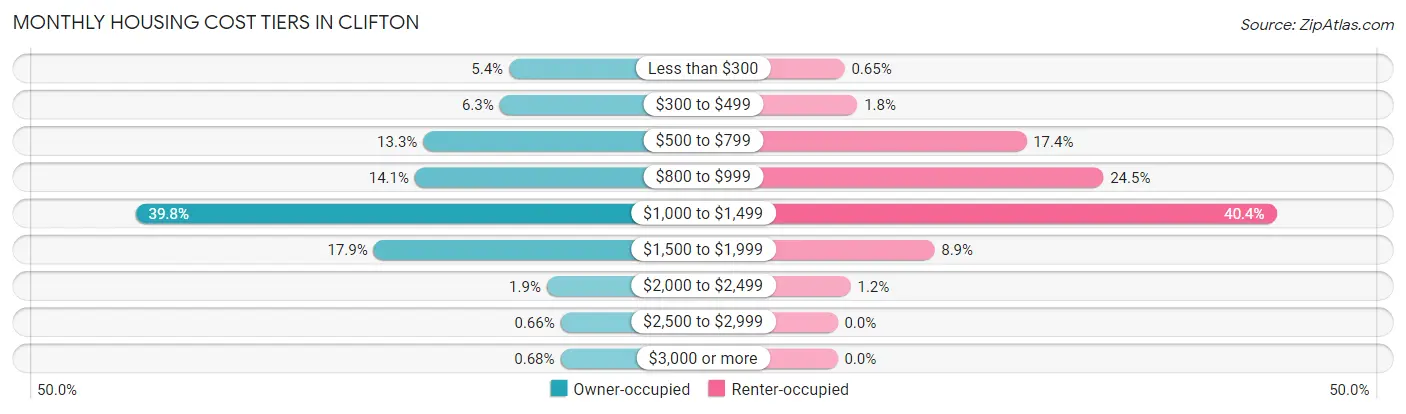
| Monthly Cost | Owner-occupied | Renter-occupied |
| Less than $300 | 295 (5.4%) | 14 (0.6%) |
| $300 to $499 | 342 (6.3%) | 39 (1.8%) |
| $500 to $799 | 725 (13.3%) | 372 (17.4%) |
| $800 to $999 | 767 (14.1%) | 524 (24.5%) |
| $1,000 to $1,499 | 2,167 (39.8%) | 865 (40.4%) |
| $1,500 to $1,999 | 974 (17.9%) | 191 (8.9%) |
| $2,000 to $2,499 | 105 (1.9%) | 26 (1.2%) |
| $2,500 to $2,999 | 36 (0.7%) | 0 (0.0%) |
| $3,000 or more | 37 (0.7%) | 0 (0.0%) |
| Total | 5,448 (100.0%) | 2,141 (100.0%) |
Physical Housing Characteristics in Clifton
Housing Structures in Clifton
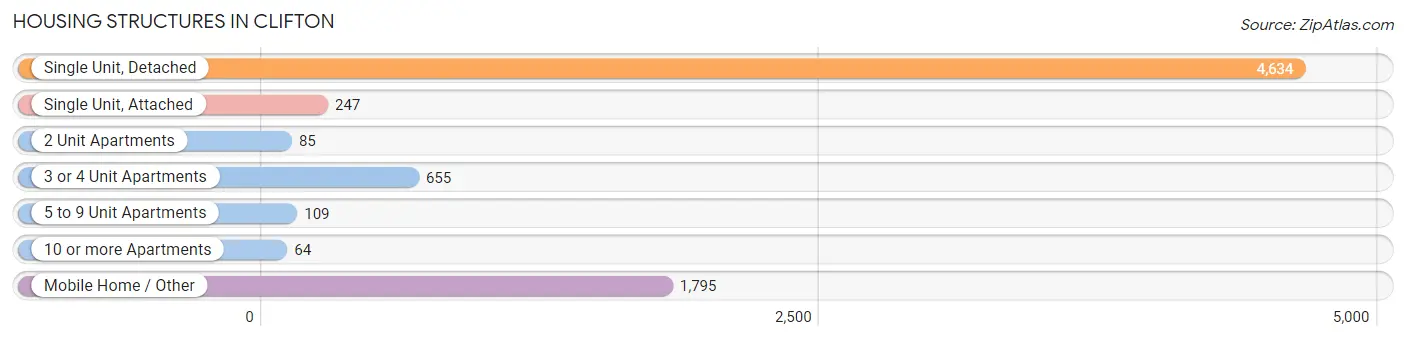
| Structure Type | # Housing Units | % Housing Units |
| Single Unit, Detached | 4,634 | 61.1% |
| Single Unit, Attached | 247 | 3.3% |
| 2 Unit Apartments | 85 | 1.1% |
| 3 or 4 Unit Apartments | 655 | 8.6% |
| 5 to 9 Unit Apartments | 109 | 1.4% |
| 10 or more Apartments | 64 | 0.8% |
| Mobile Home / Other | 1,795 | 23.6% |
| Total | 7,589 | 100.0% |
Housing Structures by Occupancy in Clifton
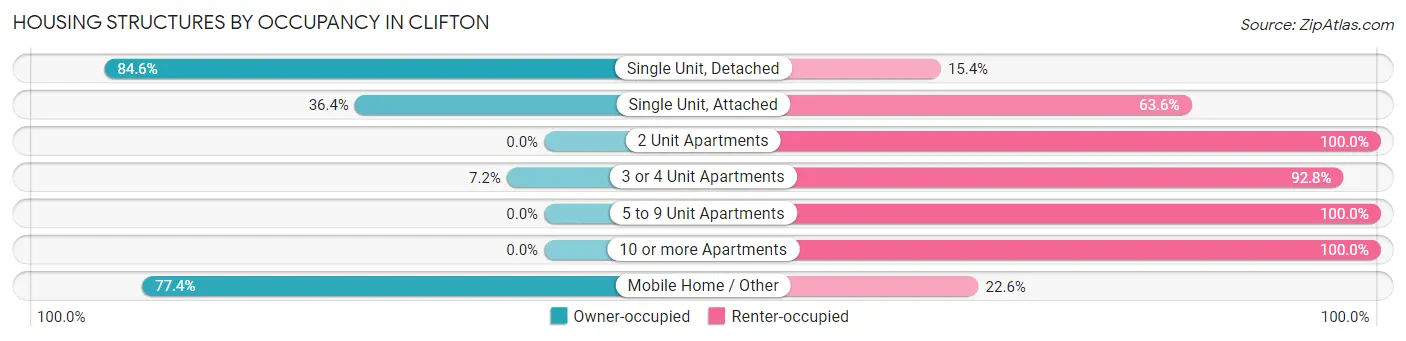
| Structure Type | Owner-occupied | Renter-occupied |
| Single Unit, Detached | 3,922 (84.6%) | 712 (15.4%) |
| Single Unit, Attached | 90 (36.4%) | 157 (63.6%) |
| 2 Unit Apartments | 0 (0.0%) | 85 (100.0%) |
| 3 or 4 Unit Apartments | 47 (7.2%) | 608 (92.8%) |
| 5 to 9 Unit Apartments | 0 (0.0%) | 109 (100.0%) |
| 10 or more Apartments | 0 (0.0%) | 64 (100.0%) |
| Mobile Home / Other | 1,389 (77.4%) | 406 (22.6%) |
| Total | 5,448 (71.8%) | 2,141 (28.2%) |
Housing Structures by Number of Rooms in Clifton
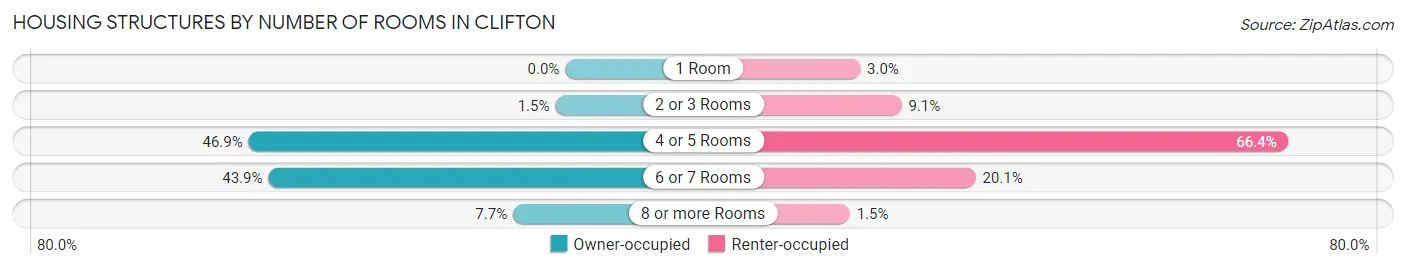
| Number of Rooms | Owner-occupied | Renter-occupied |
| 1 Room | 0 (0.0%) | 64 (3.0%) |
| 2 or 3 Rooms | 80 (1.5%) | 195 (9.1%) |
| 4 or 5 Rooms | 2,553 (46.9%) | 1,421 (66.4%) |
| 6 or 7 Rooms | 2,394 (43.9%) | 430 (20.1%) |
| 8 or more Rooms | 421 (7.7%) | 31 (1.5%) |
| Total | 5,448 (100.0%) | 2,141 (100.0%) |
Housing Structure by Heating Type in Clifton
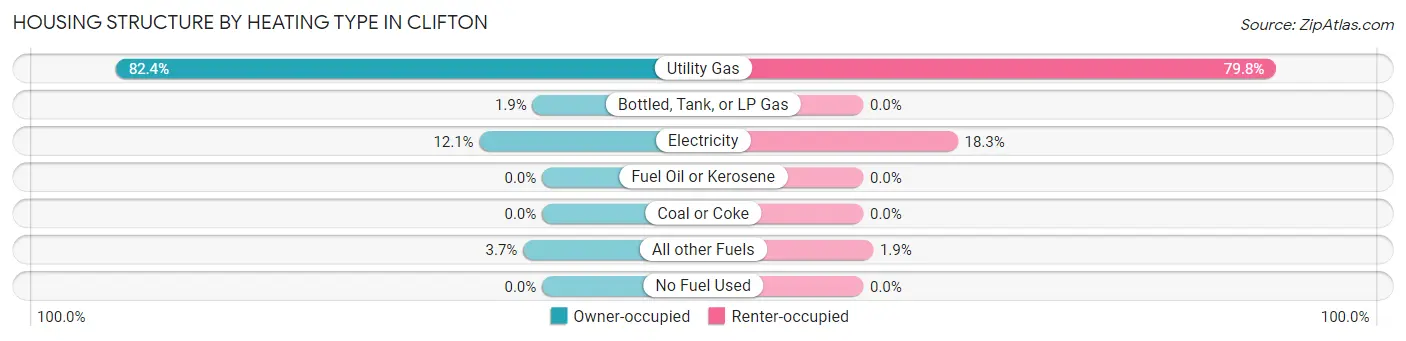
| Heating Type | Owner-occupied | Renter-occupied |
| Utility Gas | 4,488 (82.4%) | 1,709 (79.8%) |
| Bottled, Tank, or LP Gas | 101 (1.8%) | 0 (0.0%) |
| Electricity | 660 (12.1%) | 391 (18.3%) |
| Fuel Oil or Kerosene | 0 (0.0%) | 0 (0.0%) |
| Coal or Coke | 0 (0.0%) | 0 (0.0%) |
| All other Fuels | 199 (3.6%) | 41 (1.9%) |
| No Fuel Used | 0 (0.0%) | 0 (0.0%) |
| Total | 5,448 (100.0%) | 2,141 (100.0%) |
Household Vehicle Usage in Clifton
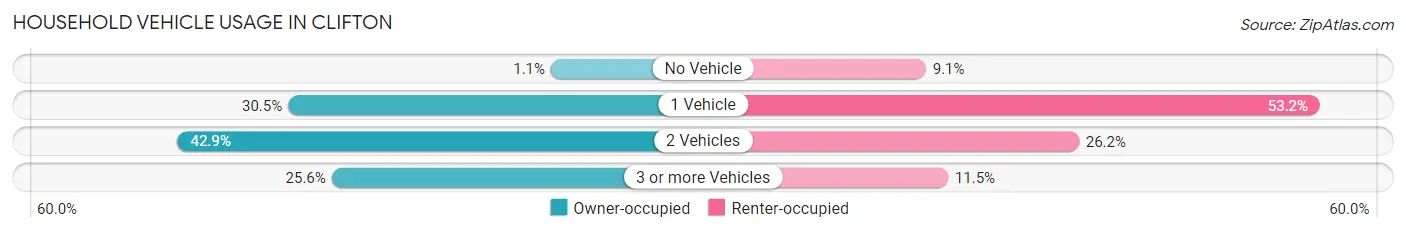
| Vehicles per Household | Owner-occupied | Renter-occupied |
| No Vehicle | 57 (1.1%) | 194 (9.1%) |
| 1 Vehicle | 1,661 (30.5%) | 1,139 (53.2%) |
| 2 Vehicles | 2,335 (42.9%) | 561 (26.2%) |
| 3 or more Vehicles | 1,395 (25.6%) | 247 (11.5%) |
| Total | 5,448 (100.0%) | 2,141 (100.0%) |
Real Estate & Mortgages in Clifton
Real Estate and Mortgage Overview in Clifton
| Characteristic | Without Mortgage | With Mortgage |
| Housing Units | 1,305 | 4,143 |
| Median Property Value | $119,000 | $220,100 |
| Median Household Income | $38,965 | $294 |
| Monthly Housing Costs | $534 | $37 |
| Real Estate Taxes | $443 | $136 |
Property Value by Mortgage Status in Clifton
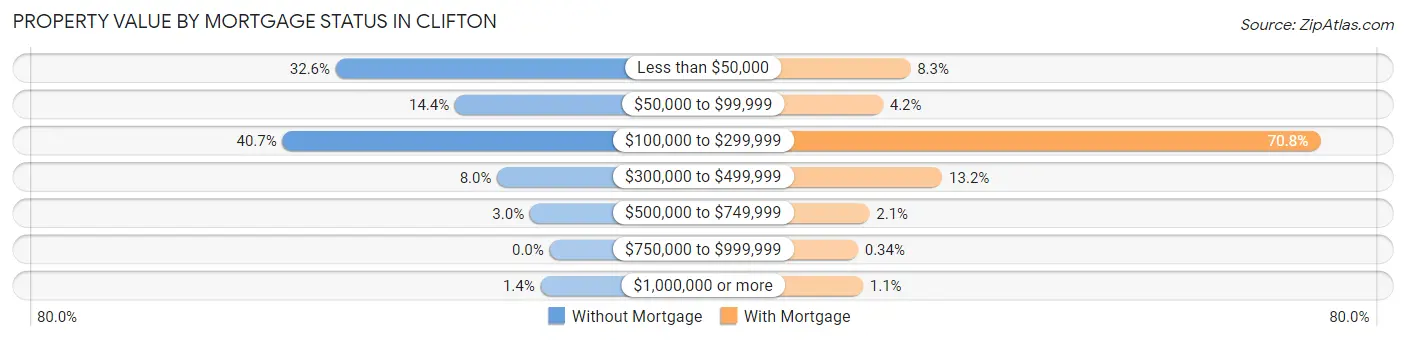
| Property Value | Without Mortgage | With Mortgage |
| Less than $50,000 | 425 (32.6%) | 345 (8.3%) |
| $50,000 to $99,999 | 188 (14.4%) | 172 (4.2%) |
| $100,000 to $299,999 | 531 (40.7%) | 2,932 (70.8%) |
| $300,000 to $499,999 | 104 (8.0%) | 547 (13.2%) |
| $500,000 to $749,999 | 39 (3.0%) | 87 (2.1%) |
| $750,000 to $999,999 | 0 (0.0%) | 14 (0.3%) |
| $1,000,000 or more | 18 (1.4%) | 46 (1.1%) |
| Total | 1,305 (100.0%) | 4,143 (100.0%) |
Household Income by Mortgage Status in Clifton
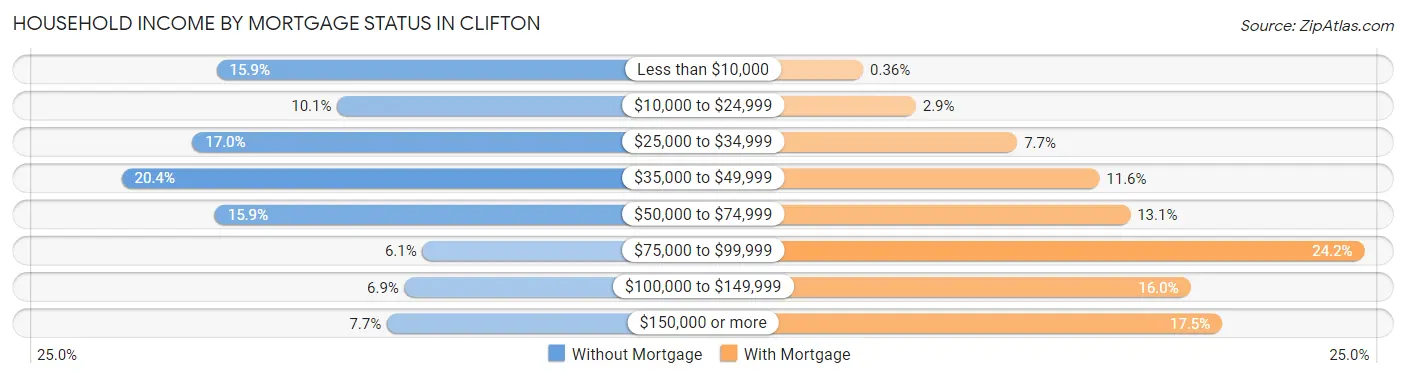
| Household Income | Without Mortgage | With Mortgage |
| Less than $10,000 | 207 (15.9%) | 15 (0.4%) |
| $10,000 to $24,999 | 132 (10.1%) | 119 (2.9%) |
| $25,000 to $34,999 | 222 (17.0%) | 319 (7.7%) |
| $35,000 to $49,999 | 266 (20.4%) | 481 (11.6%) |
| $50,000 to $74,999 | 208 (15.9%) | 542 (13.1%) |
| $75,000 to $99,999 | 79 (6.0%) | 1,004 (24.2%) |
| $100,000 to $149,999 | 90 (6.9%) | 661 (16.0%) |
| $150,000 or more | 101 (7.7%) | 723 (17.4%) |
| Total | 1,305 (100.0%) | 4,143 (100.0%) |
Property Value to Household Income Ratio in Clifton
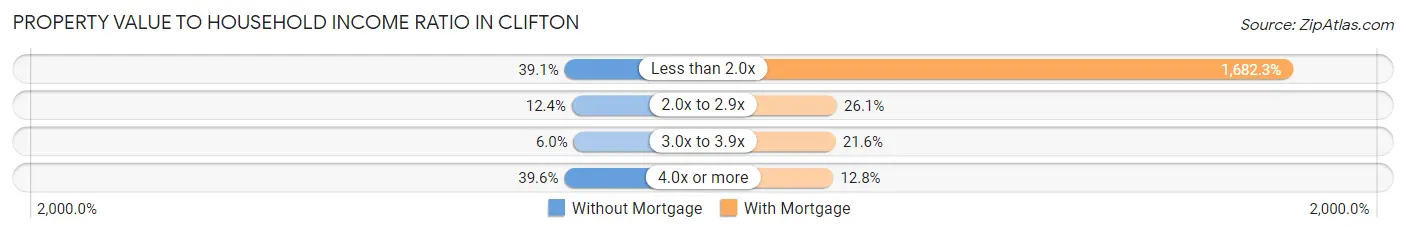
| Value-to-Income Ratio | Without Mortgage | With Mortgage |
| Less than 2.0x | 510 (39.1%) | 69,698 (1,682.3%) |
| 2.0x to 2.9x | 162 (12.4%) | 1,082 (26.1%) |
| 3.0x to 3.9x | 78 (6.0%) | 894 (21.6%) |
| 4.0x or more | 517 (39.6%) | 531 (12.8%) |
| Total | 1,305 (100.0%) | 4,143 (100.0%) |
Real Estate Taxes by Mortgage Status in Clifton
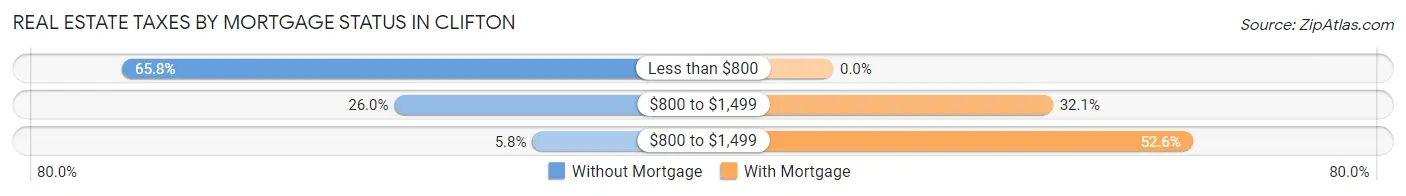
| Property Taxes | Without Mortgage | With Mortgage |
| Less than $800 | 858 (65.7%) | 0 (0.0%) |
| $800 to $1,499 | 339 (26.0%) | 1,330 (32.1%) |
| $800 to $1,499 | 76 (5.8%) | 2,177 (52.5%) |
| Total | 1,305 (100.0%) | 4,143 (100.0%) |
Health & Disability in Clifton
Health Insurance Coverage by Age in Clifton
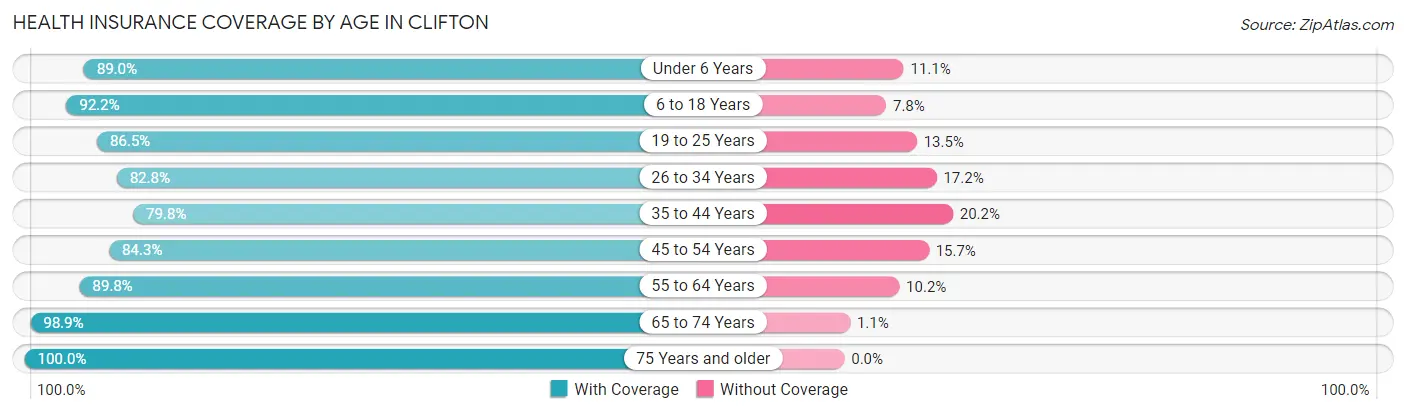
| Age Bracket | With Coverage | Without Coverage |
| Under 6 Years | 1,457 (88.9%) | 181 (11.1%) |
| 6 to 18 Years | 3,166 (92.2%) | 267 (7.8%) |
| 19 to 25 Years | 1,570 (86.5%) | 245 (13.5%) |
| 26 to 34 Years | 2,279 (82.8%) | 473 (17.2%) |
| 35 to 44 Years | 2,051 (79.8%) | 520 (20.2%) |
| 45 to 54 Years | 1,895 (84.3%) | 354 (15.7%) |
| 55 to 64 Years | 1,896 (89.8%) | 216 (10.2%) |
| 65 to 74 Years | 1,872 (98.9%) | 20 (1.1%) |
| 75 Years and older | 980 (100.0%) | 0 (0.0%) |
| Total | 17,166 (88.3%) | 2,276 (11.7%) |
Health Insurance Coverage by Citizenship Status in Clifton
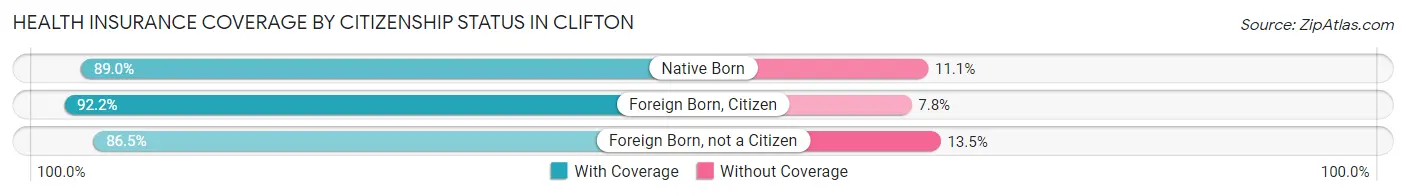
| Citizenship Status | With Coverage | Without Coverage |
| Native Born | 1,457 (88.9%) | 181 (11.1%) |
| Foreign Born, Citizen | 3,166 (92.2%) | 267 (7.8%) |
| Foreign Born, not a Citizen | 1,570 (86.5%) | 245 (13.5%) |
Health Insurance Coverage by Household Income in Clifton
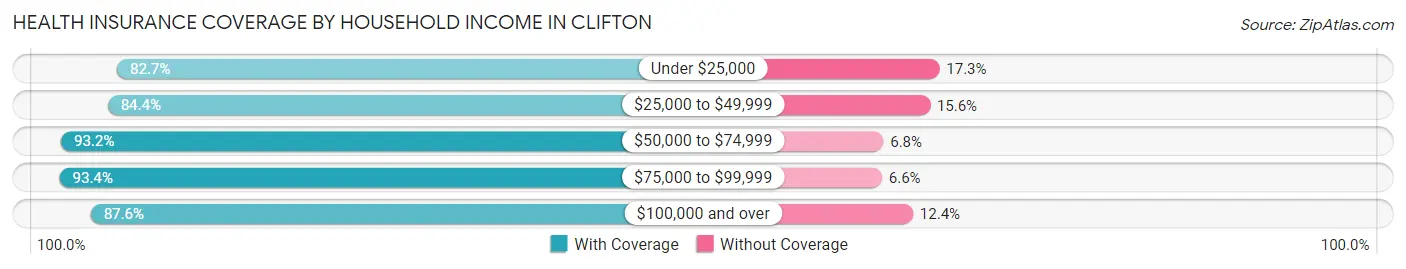
| Household Income | With Coverage | Without Coverage |
| Under $25,000 | 2,575 (82.7%) | 540 (17.3%) |
| $25,000 to $49,999 | 3,467 (84.4%) | 640 (15.6%) |
| $50,000 to $74,999 | 4,016 (93.2%) | 295 (6.8%) |
| $75,000 to $99,999 | 2,801 (93.4%) | 197 (6.6%) |
| $100,000 and over | 4,270 (87.6%) | 604 (12.4%) |
Public vs Private Health Insurance Coverage by Age in Clifton
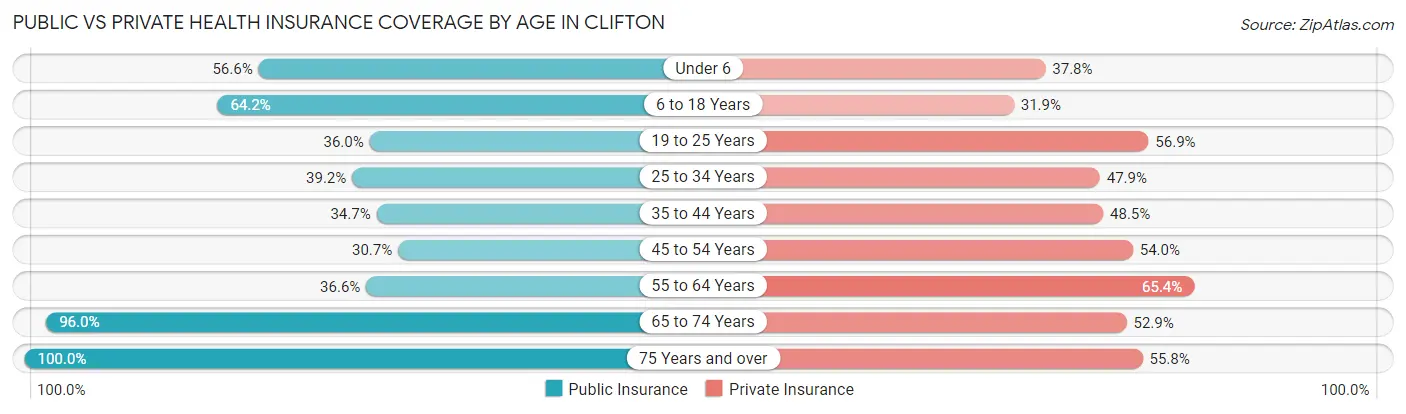
| Age Bracket | Public Insurance | Private Insurance |
| Under 6 | 927 (56.6%) | 619 (37.8%) |
| 6 to 18 Years | 2,204 (64.2%) | 1,096 (31.9%) |
| 19 to 25 Years | 653 (36.0%) | 1,033 (56.9%) |
| 25 to 34 Years | 1,079 (39.2%) | 1,318 (47.9%) |
| 35 to 44 Years | 892 (34.7%) | 1,247 (48.5%) |
| 45 to 54 Years | 690 (30.7%) | 1,215 (54.0%) |
| 55 to 64 Years | 773 (36.6%) | 1,381 (65.4%) |
| 65 to 74 Years | 1,816 (96.0%) | 1,000 (52.8%) |
| 75 Years and over | 980 (100.0%) | 547 (55.8%) |
| Total | 10,014 (51.5%) | 9,456 (48.6%) |
Disability Status by Sex by Age in Clifton
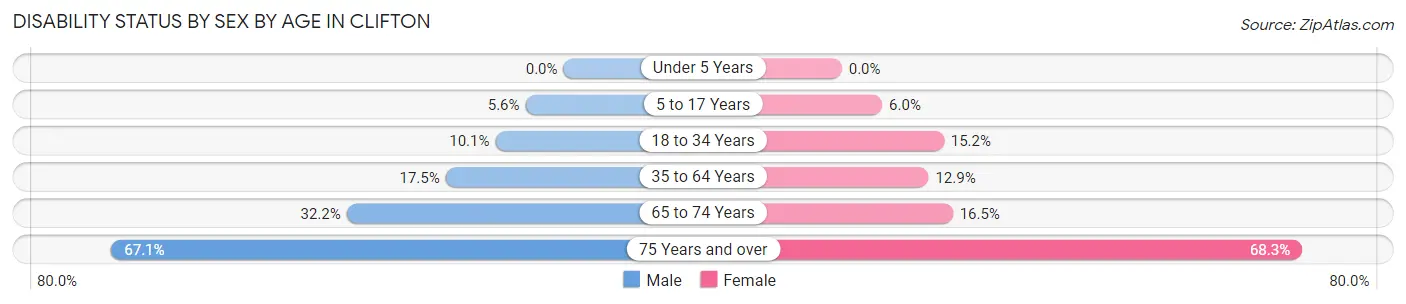
| Age Bracket | Male | Female |
| Under 5 Years | 0 (0.0%) | 0 (0.0%) |
| 5 to 17 Years | 103 (5.6%) | 98 (6.0%) |
| 18 to 34 Years | 244 (10.1%) | 377 (15.1%) |
| 35 to 64 Years | 563 (17.5%) | 478 (12.9%) |
| 65 to 74 Years | 310 (32.2%) | 153 (16.5%) |
| 75 Years and over | 253 (67.1%) | 412 (68.3%) |
Disability Class by Sex by Age in Clifton
Disability Class: Hearing Difficulty
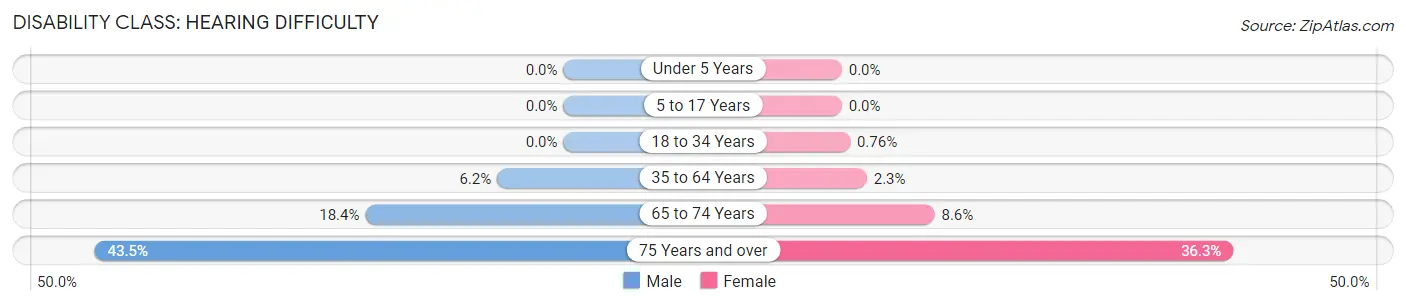
| Age Bracket | Male | Female |
| Under 5 Years | 0 (0.0%) | 0 (0.0%) |
| 5 to 17 Years | 0 (0.0%) | 0 (0.0%) |
| 18 to 34 Years | 0 (0.0%) | 19 (0.8%) |
| 35 to 64 Years | 198 (6.1%) | 86 (2.3%) |
| 65 to 74 Years | 177 (18.4%) | 80 (8.6%) |
| 75 Years and over | 164 (43.5%) | 219 (36.3%) |
Disability Class: Vision Difficulty
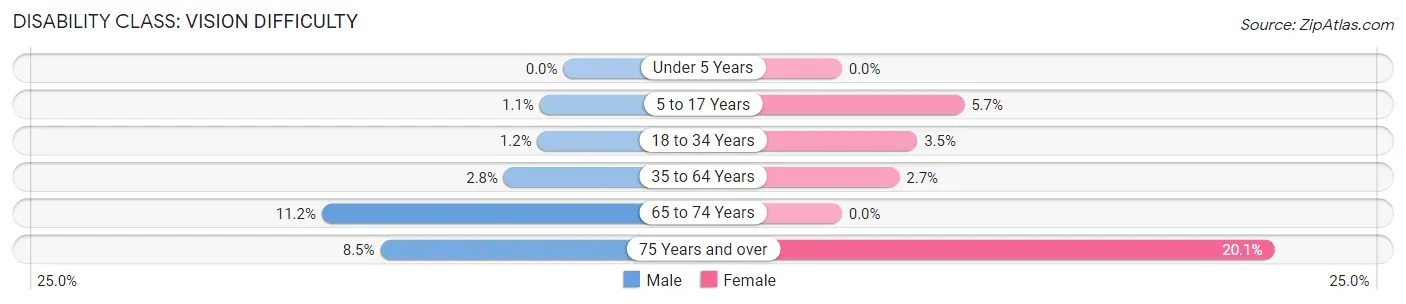
| Age Bracket | Male | Female |
| Under 5 Years | 0 (0.0%) | 0 (0.0%) |
| 5 to 17 Years | 20 (1.1%) | 93 (5.7%) |
| 18 to 34 Years | 29 (1.2%) | 87 (3.5%) |
| 35 to 64 Years | 89 (2.8%) | 99 (2.7%) |
| 65 to 74 Years | 108 (11.2%) | 0 (0.0%) |
| 75 Years and over | 32 (8.5%) | 121 (20.1%) |
Disability Class: Cognitive Difficulty
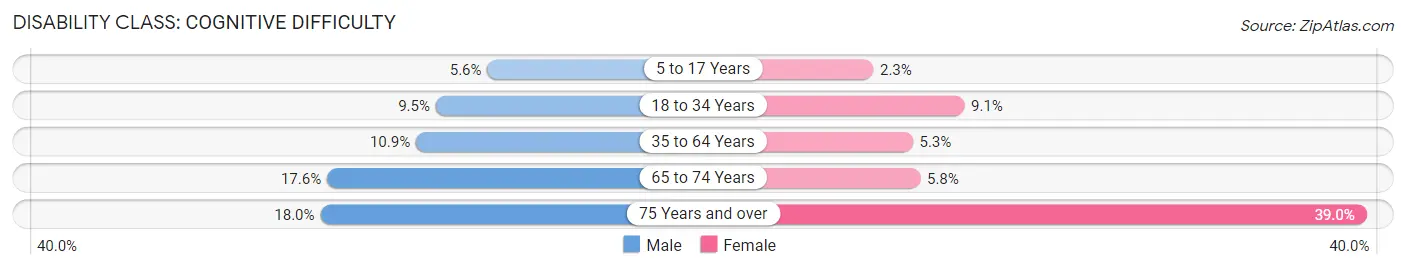
| Age Bracket | Male | Female |
| 5 to 17 Years | 103 (5.6%) | 38 (2.3%) |
| 18 to 34 Years | 229 (9.5%) | 226 (9.1%) |
| 35 to 64 Years | 352 (10.9%) | 195 (5.2%) |
| 65 to 74 Years | 169 (17.5%) | 54 (5.8%) |
| 75 Years and over | 68 (18.0%) | 235 (39.0%) |
Disability Class: Ambulatory Difficulty
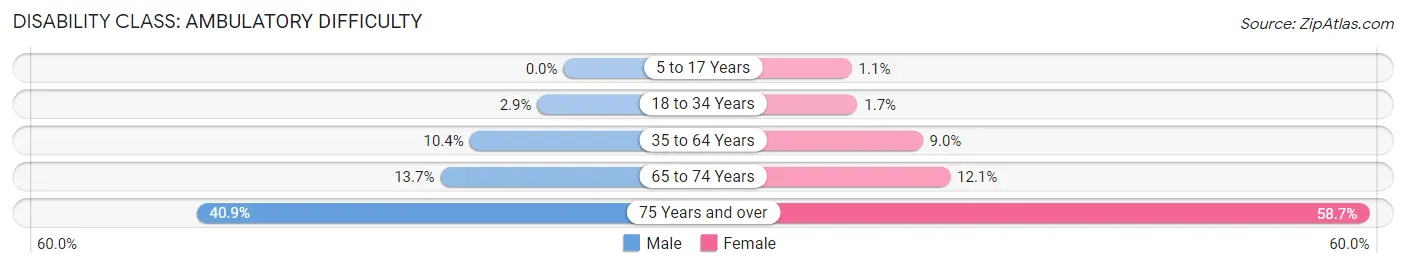
| Age Bracket | Male | Female |
| 5 to 17 Years | 0 (0.0%) | 18 (1.1%) |
| 18 to 34 Years | 70 (2.9%) | 43 (1.7%) |
| 35 to 64 Years | 336 (10.4%) | 334 (9.0%) |
| 65 to 74 Years | 132 (13.7%) | 112 (12.1%) |
| 75 Years and over | 154 (40.8%) | 354 (58.7%) |
Disability Class: Self-Care Difficulty
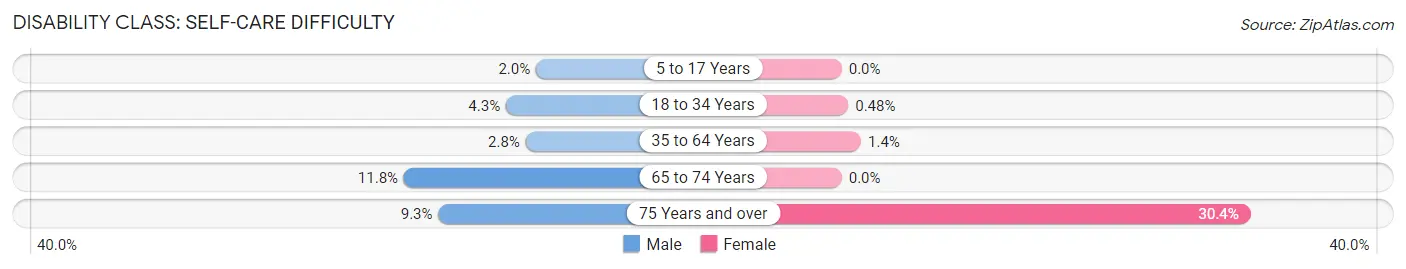
| Age Bracket | Male | Female |
| 5 to 17 Years | 37 (2.0%) | 0 (0.0%) |
| 18 to 34 Years | 103 (4.3%) | 12 (0.5%) |
| 35 to 64 Years | 90 (2.8%) | 53 (1.4%) |
| 65 to 74 Years | 114 (11.8%) | 0 (0.0%) |
| 75 Years and over | 35 (9.3%) | 183 (30.3%) |
Technology Access in Clifton
Computing Device Access in Clifton
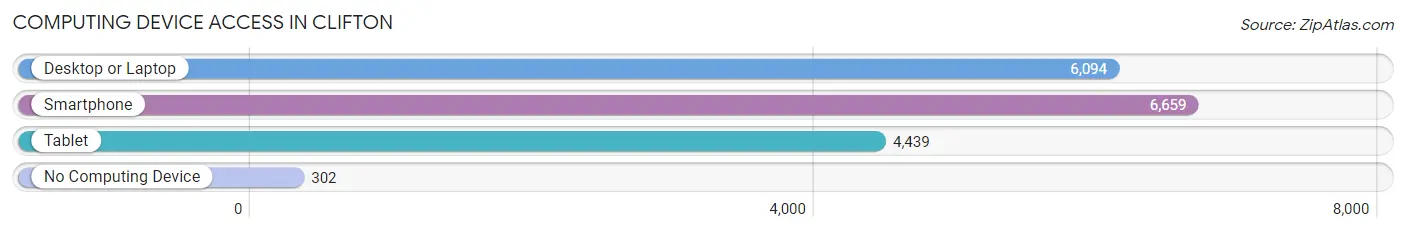
| Device Type | # Households | % Households |
| Desktop or Laptop | 6,094 | 80.3% |
| Smartphone | 6,659 | 87.7% |
| Tablet | 4,439 | 58.5% |
| No Computing Device | 302 | 4.0% |
| Total | 7,589 | 100.0% |
Internet Access in Clifton
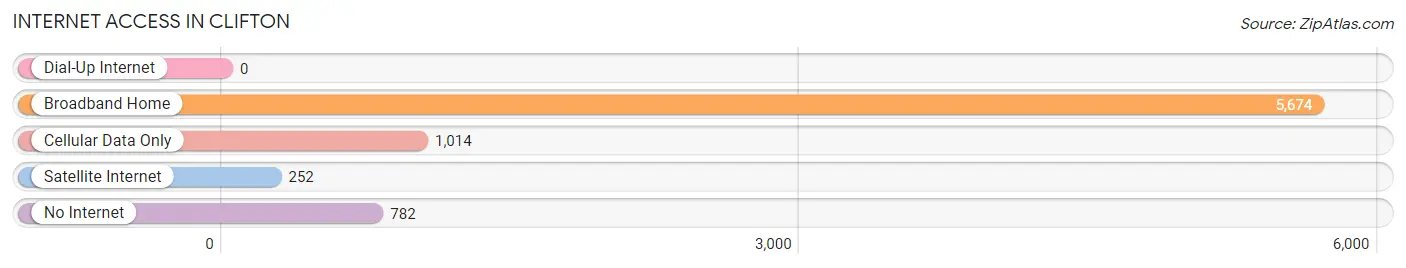
| Internet Type | # Households | % Households |
| Dial-Up Internet | 0 | 0.0% |
| Broadband Home | 5,674 | 74.8% |
| Cellular Data Only | 1,014 | 13.4% |
| Satellite Internet | 252 | 3.3% |
| No Internet | 782 | 10.3% |
| Total | 7,589 | 100.0% |
Clifton Summary
Clifton, Colorado is a small town located in Mesa County, in the western part of the state. It is situated on the banks of the Colorado River, just south of Grand Junction. The town was founded in 1882 and has a population of approximately 2,000 people.
History
Clifton was founded in 1882 by a group of settlers from the Midwest. The town was named after the nearby Clifton Gorge, which was named after a local rancher, William Clifton. The town was originally a farming community, but it soon became a center for mining and ranching. In the early 1900s, the town was home to several large coal mines, which provided employment for many of the town's residents.
In the 1920s, the town began to experience a decline in population as the coal mines closed and the local economy shifted to ranching and farming. The town was also affected by the Great Depression, and many of the town's residents moved away in search of work.
In the 1950s, the town began to experience a resurgence in population as the local economy shifted to tourism and recreation. The town is now home to several tourist attractions, including the Clifton Gorge State Park, the Colorado National Monument, and the Grand Mesa National Forest.
Geography
Clifton is located in western Colorado, in Mesa County. It is situated on the banks of the Colorado River, just south of Grand Junction. The town is surrounded by the Grand Mesa National Forest, the Colorado National Monument, and the Clifton Gorge State Park. The town is located at an elevation of 4,890 feet above sea level.
Economy
The economy of Clifton is largely based on tourism and recreation. The town is home to several tourist attractions, including the Clifton Gorge State Park, the Colorado National Monument, and the Grand Mesa National Forest. The town is also home to several wineries, breweries, and distilleries, as well as several restaurants and shops.
The town is also home to several businesses, including a lumber yard, a hardware store, and a grocery store. The town is also home to several small manufacturing companies, including a furniture manufacturer and a metal fabrication company.
Demographics
As of the 2010 census, the population of Clifton was 2,000. The racial makeup of the town was 95.2% White, 0.7% African American, 0.3% Native American, 0.3% Asian, 0.1% Pacific Islander, 1.2% from other races, and 2.5% from two or more races. Hispanic or Latino of any race were 4.2% of the population.
The median income for a household in Clifton was $41,250, and the median income for a family was $50,000. The per capita income for the town was $20,945. About 11.2% of families and 14.2% of the population were below the poverty line, including 18.2% of those under age 18 and 8.3% of those age 65 or over.
Common Questions
What is Per Capita Income in Clifton?
Per Capita income in Clifton is $26,116.
What is the Median Family Income in Clifton?
Median Family Income in Clifton is $60,203.
What is the Median Household income in Clifton?
Median Household Income in Clifton is $55,108.
What is Income or Wage Gap in Clifton?
Income or Wage Gap in Clifton is 20.9%.
Women in Clifton earn 79.1 cents for every dollar earned by a man.
What is Inequality or Gini Index in Clifton?
Inequality or Gini Index in Clifton is 0.42.
What is the Total Population of Clifton?
Total Population of Clifton is 19,443.
What is the Total Male Population of Clifton?
Total Male Population of Clifton is 9,461.
What is the Total Female Population of Clifton?
Total Female Population of Clifton is 9,982.
What is the Ratio of Males per 100 Females in Clifton?
There are 94.78 Males per 100 Females in Clifton.
What is the Ratio of Females per 100 Males in Clifton?
There are 105.51 Females per 100 Males in Clifton.
What is the Median Population Age in Clifton?
Median Population Age in Clifton is 35.3 Years.
What is the Average Family Size in Clifton
Average Family Size in Clifton is 3.1 People.
What is the Average Household Size in Clifton
Average Household Size in Clifton is 2.6 People.
How Large is the Labor Force in Clifton?
There are 9,509 People in the Labor Forcein in Clifton.
What is the Percentage of People in the Labor Force in Clifton?
62.1% of People are in the Labor Force in Clifton.
What is the Unemployment Rate in Clifton?
Unemployment Rate in Clifton is 9.1%.