Lakeville, MN Map & Demographics
Lakeville Map
Lakeville Overview
$52,634
PER CAPITA INCOME
$145,344
AVG FAMILY INCOME
$129,069
AVG HOUSEHOLD INCOME
36.3%
WAGE / INCOME GAP [ % ]
63.7¢/ $1
WAGE / INCOME GAP [ $ ]
$9,178
FAMILY INCOME DEFICIT
0.38
INEQUALITY / GINI INDEX
70,696
TOTAL POPULATION
36,070
MALE POPULATION
34,626
FEMALE POPULATION
104.17
MALES / 100 FEMALES
96.00
FEMALES / 100 MALES
36.5
MEDIAN AGE
3.3
AVG FAMILY SIZE
2.9
AVG HOUSEHOLD SIZE
39,817
LABOR FORCE [ PEOPLE ]
75.1%
PERCENT IN LABOR FORCE
2.5%
UNEMPLOYMENT RATE
Lakeville Zip Codes
Lakeville Area Codes
Income in Lakeville
Income Overview in Lakeville
Per Capita Income in Lakeville is $52,634, while median incomes of families and households are $145,344 and $129,069 respectively.
| Characteristic | Number | Measure |
| Per Capita Income | 70,696 | $52,634 |
| Median Family Income | 19,142 | $145,344 |
| Mean Family Income | 19,142 | $168,682 |
| Median Household Income | 24,252 | $129,069 |
| Mean Household Income | 24,252 | $150,638 |
| Income Deficit | 19,142 | $9,178 |
| Wage / Income Gap (%) | 70,696 | 36.34% |
| Wage / Income Gap ($) | 70,696 | 63.66¢ per $1 |
| Gini / Inequality Index | 70,696 | 0.38 |
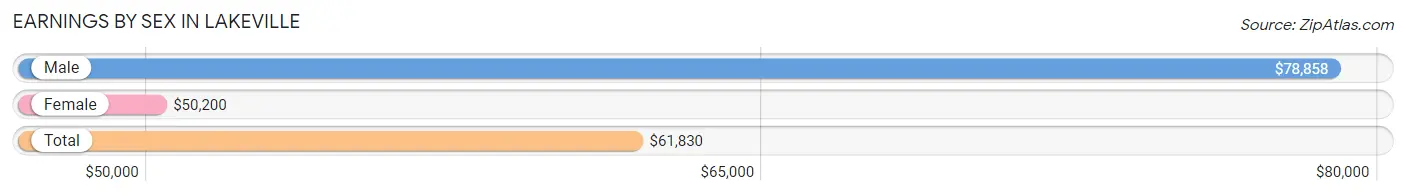
Earnings by Sex in Lakeville
Average Earnings in Lakeville are $61,830, $78,858 for men and $50,200 for women, a difference of 36.3%.
| Sex | Number | Average Earnings |
| Male | 21,983 (53.0%) | $78,858 |
| Female | 19,514 (47.0%) | $50,200 |
| Total | 41,497 (100.0%) | $61,830 |
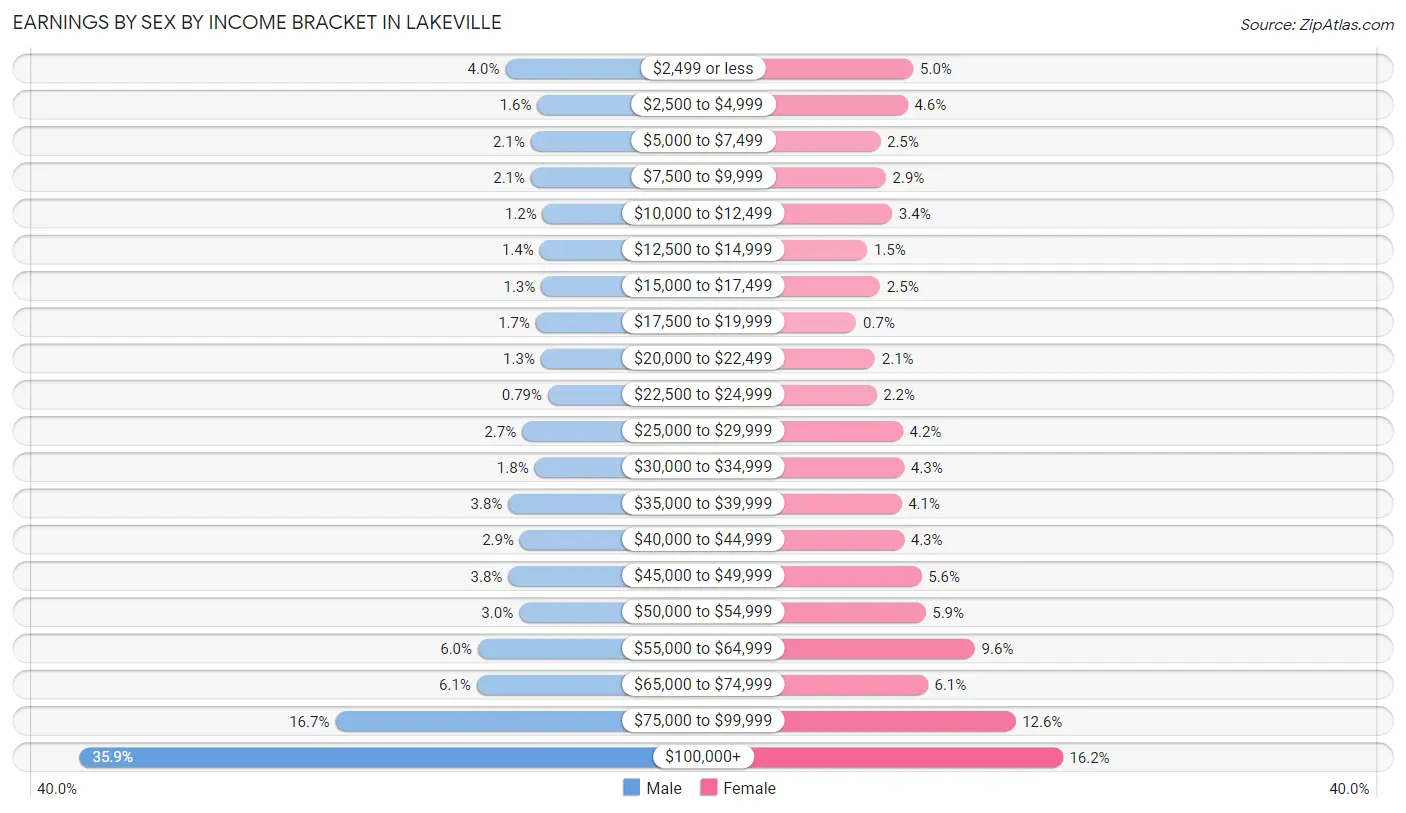
Earnings by Sex by Income Bracket in Lakeville
The most common earnings brackets in Lakeville are $100,000+ for men (7,887 | 35.9%) and $100,000+ for women (3,154 | 16.2%).
| Income | Male | Female |
| $2,499 or less | 874 (4.0%) | 969 (5.0%) |
| $2,500 to $4,999 | 348 (1.6%) | 888 (4.5%) |
| $5,000 to $7,499 | 458 (2.1%) | 485 (2.5%) |
| $7,500 to $9,999 | 453 (2.1%) | 568 (2.9%) |
| $10,000 to $12,499 | 259 (1.2%) | 660 (3.4%) |
| $12,500 to $14,999 | 309 (1.4%) | 295 (1.5%) |
| $15,000 to $17,499 | 284 (1.3%) | 484 (2.5%) |
| $17,500 to $19,999 | 371 (1.7%) | 137 (0.7%) |
| $20,000 to $22,499 | 291 (1.3%) | 410 (2.1%) |
| $22,500 to $24,999 | 173 (0.8%) | 432 (2.2%) |
| $25,000 to $29,999 | 598 (2.7%) | 815 (4.2%) |
| $30,000 to $34,999 | 394 (1.8%) | 836 (4.3%) |
| $35,000 to $39,999 | 827 (3.8%) | 797 (4.1%) |
| $40,000 to $44,999 | 636 (2.9%) | 834 (4.3%) |
| $45,000 to $49,999 | 827 (3.8%) | 1,089 (5.6%) |
| $50,000 to $54,999 | 648 (2.9%) | 1,147 (5.9%) |
| $55,000 to $64,999 | 1,325 (6.0%) | 1,870 (9.6%) |
| $65,000 to $74,999 | 1,345 (6.1%) | 1,181 (6.0%) |
| $75,000 to $99,999 | 3,676 (16.7%) | 2,463 (12.6%) |
| $100,000+ | 7,887 (35.9%) | 3,154 (16.2%) |
| Total | 21,983 (100.0%) | 19,514 (100.0%) |
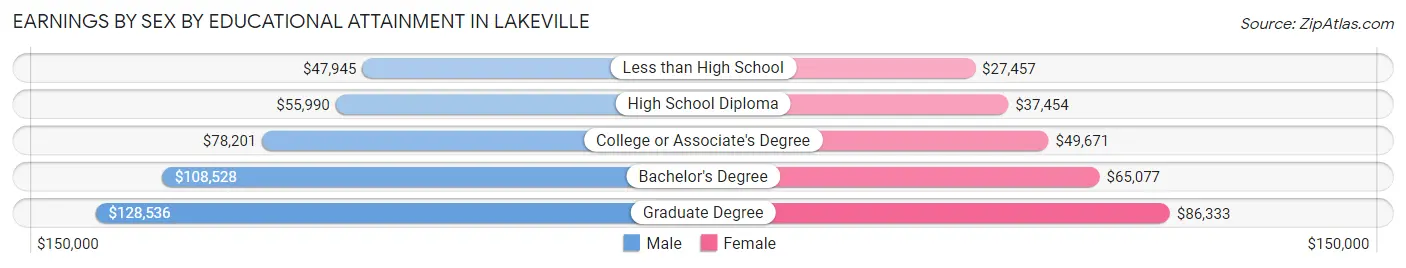
Earnings by Sex by Educational Attainment in Lakeville
Average earnings in Lakeville are $89,429 for men and $56,180 for women, a difference of 37.2%. Men with an educational attainment of graduate degree enjoy the highest average annual earnings of $128,536, while those with less than high school education earn the least with $47,945. Women with an educational attainment of graduate degree earn the most with the average annual earnings of $86,333, while those with less than high school education have the smallest earnings of $27,457.
| Educational Attainment | Male Income | Female Income |
| Less than High School | $47,945 | $27,457 |
| High School Diploma | $55,990 | $37,454 |
| College or Associate's Degree | $78,201 | $49,671 |
| Bachelor's Degree | $108,528 | $65,077 |
| Graduate Degree | $128,536 | $86,333 |
| Total | $89,429 | $56,180 |
Family Income in Lakeville
Family Income Brackets in Lakeville
According to the Lakeville family income data, there are 5,398 families falling into the $200,000+ income range, which is the most common income bracket and makes up 28.2% of all families. Conversely, the $10,000 to $14,999 income bracket is the least frequent group with only 115 families (0.6%) belonging to this category.
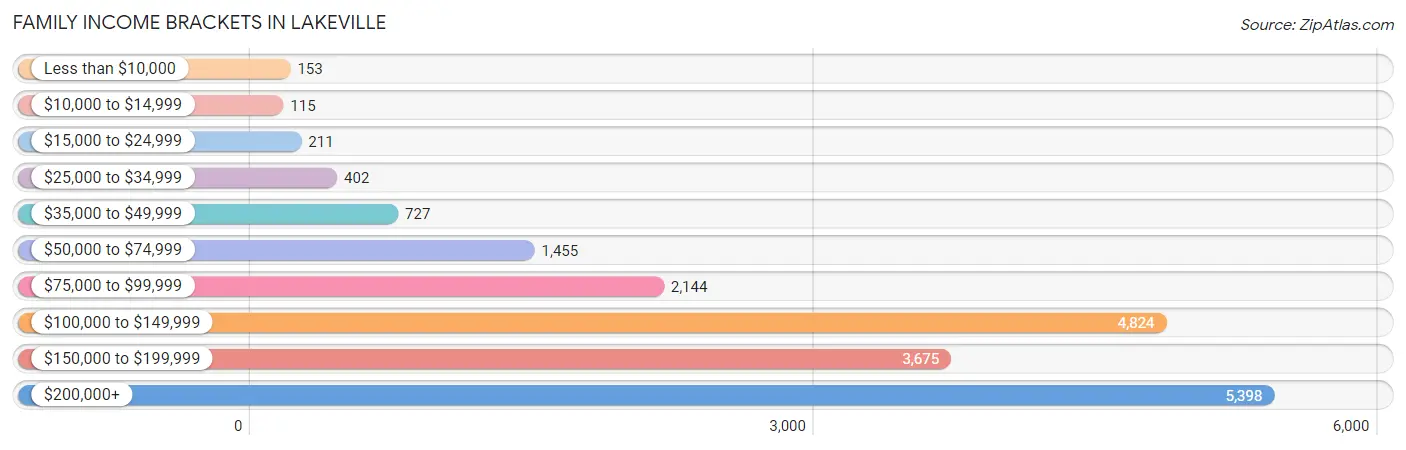
| Income Bracket | # Families | % Families |
| Less than $10,000 | 153 | 0.8% |
| $10,000 to $14,999 | 115 | 0.6% |
| $15,000 to $24,999 | 211 | 1.1% |
| $25,000 to $34,999 | 402 | 2.1% |
| $35,000 to $49,999 | 727 | 3.8% |
| $50,000 to $74,999 | 1,455 | 7.6% |
| $75,000 to $99,999 | 2,144 | 11.2% |
| $100,000 to $149,999 | 4,824 | 25.2% |
| $150,000 to $199,999 | 3,675 | 19.2% |
| $200,000+ | 5,398 | 28.2% |
Family Income by Famaliy Size in Lakeville
7+ person families (145 | 0.8%) account for the highest median family income in Lakeville with $250,001 per family, while 2-person families (6,971 | 36.4%) have the highest median income of $60,162 per family member.
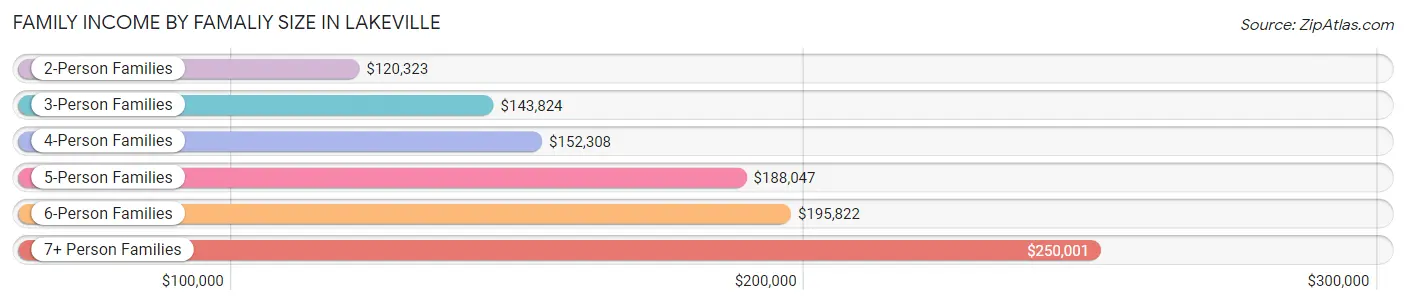
| Income Bracket | # Families | Median Income |
| 2-Person Families | 6,971 (36.4%) | $120,323 |
| 3-Person Families | 4,328 (22.6%) | $143,824 |
| 4-Person Families | 4,843 (25.3%) | $152,308 |
| 5-Person Families | 2,240 (11.7%) | $188,047 |
| 6-Person Families | 615 (3.2%) | $195,822 |
| 7+ Person Families | 145 (0.8%) | $250,001 |
| Total | 19,142 (100.0%) | $145,344 |
Family Income by Number of Earners in Lakeville
The median family income in Lakeville is $145,344, with families comprising 3+ earners (3,497) having the highest median family income of $195,176, while families with no earners (1,613) have the lowest median family income of $77,138, accounting for 18.3% and 8.4% of families, respectively.
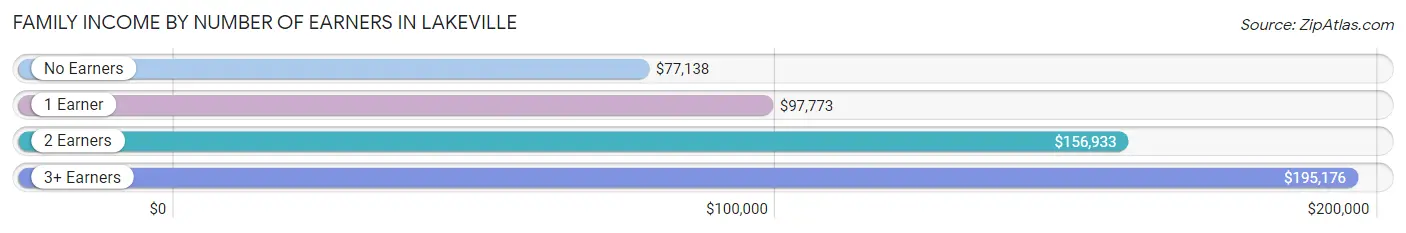
| Number of Earners | # Families | Median Income |
| No Earners | 1,613 (8.4%) | $77,138 |
| 1 Earner | 4,177 (21.8%) | $97,773 |
| 2 Earners | 9,855 (51.5%) | $156,933 |
| 3+ Earners | 3,497 (18.3%) | $195,176 |
| Total | 19,142 (100.0%) | $145,344 |
Household Income in Lakeville
Household Income Brackets in Lakeville
With 5,675 households falling in the category, the $200,000+ income range is the most frequent in Lakeville, accounting for 23.4% of all households. In contrast, only 170 households (0.7%) fall into the $10,000 to $14,999 income bracket, making it the least populous group.
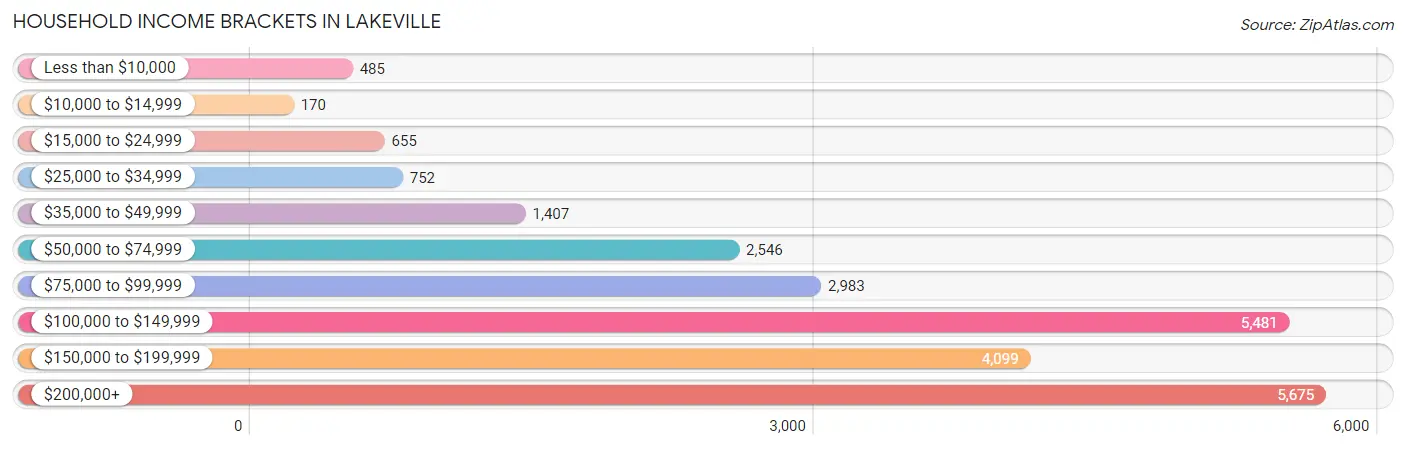
| Income Bracket | # Households | % Households |
| Less than $10,000 | 485 | 2.0% |
| $10,000 to $14,999 | 170 | 0.7% |
| $15,000 to $24,999 | 655 | 2.7% |
| $25,000 to $34,999 | 752 | 3.1% |
| $35,000 to $49,999 | 1,407 | 5.8% |
| $50,000 to $74,999 | 2,546 | 10.5% |
| $75,000 to $99,999 | 2,983 | 12.3% |
| $100,000 to $149,999 | 5,481 | 22.6% |
| $150,000 to $199,999 | 4,099 | 16.9% |
| $200,000+ | 5,675 | 23.4% |
Household Income by Householder Age in Lakeville
The median household income in Lakeville is $129,069, with the highest median household income of $148,456 found in the 45 to 64 years age bracket for the primary householder. A total of 10,725 households (44.2%) fall into this category. Meanwhile, the 65+ years age bracket for the primary householder has the lowest median household income of $66,088, with 4,287 households (17.7%) in this group.
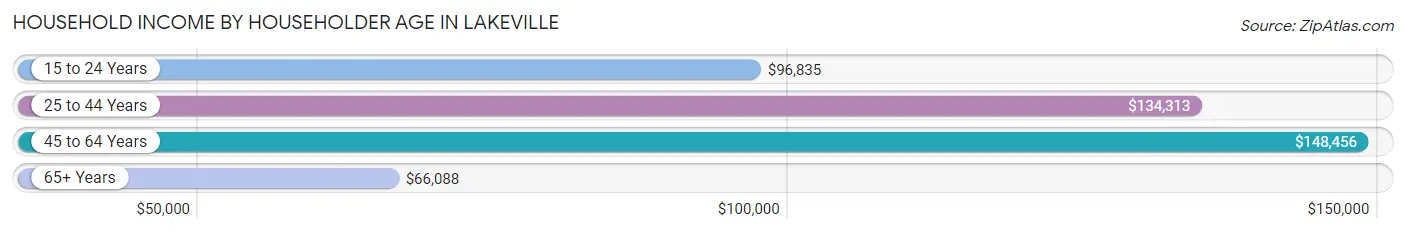
| Income Bracket | # Households | Median Income |
| 15 to 24 Years | 285 (1.2%) | $96,835 |
| 25 to 44 Years | 8,955 (36.9%) | $134,313 |
| 45 to 64 Years | 10,725 (44.2%) | $148,456 |
| 65+ Years | 4,287 (17.7%) | $66,088 |
| Total | 24,252 (100.0%) | $129,069 |
Poverty in Lakeville
Income Below Poverty by Sex and Age in Lakeville
With 3.5% poverty level for males and 4.2% for females among the residents of Lakeville, 5 year old males and 75 year old and over females are the most vulnerable to poverty, with 48 males (8.9%) and 156 females (10.1%) in their respective age groups living below the poverty level.
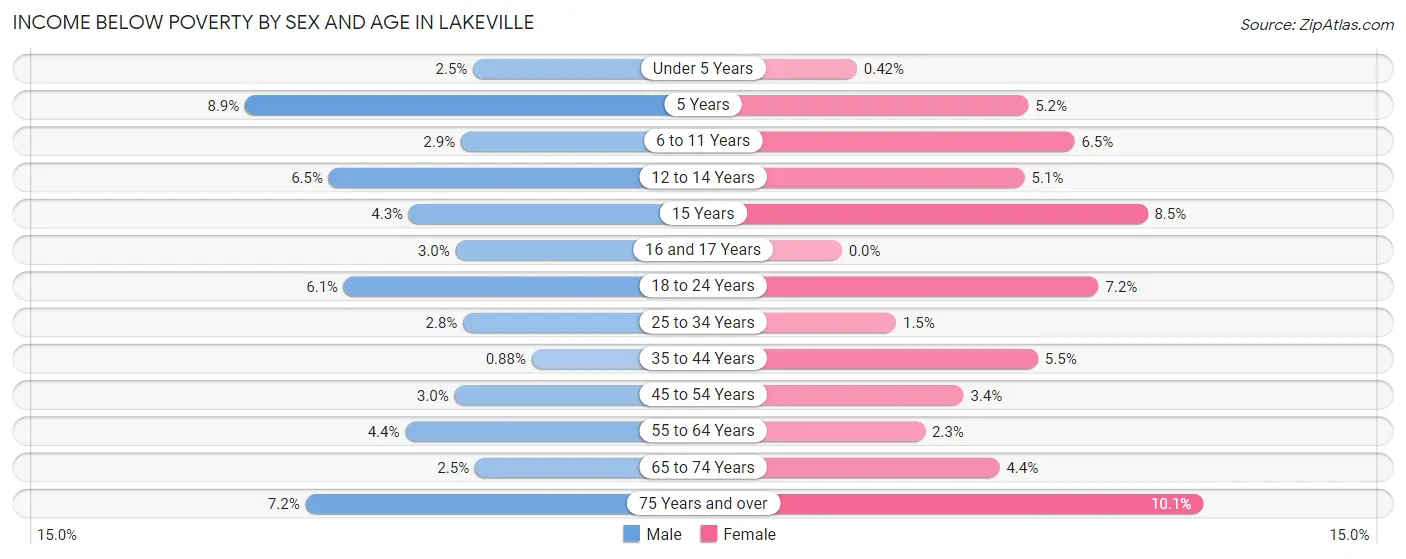
| Age Bracket | Male | Female |
| Under 5 Years | 61 (2.5%) | 10 (0.4%) |
| 5 Years | 48 (8.9%) | 19 (5.2%) |
| 6 to 11 Years | 104 (2.9%) | 196 (6.5%) |
| 12 to 14 Years | 122 (6.5%) | 95 (5.1%) |
| 15 Years | 30 (4.3%) | 40 (8.5%) |
| 16 and 17 Years | 29 (3.0%) | 0 (0.0%) |
| 18 to 24 Years | 187 (6.1%) | 196 (7.1%) |
| 25 to 34 Years | 120 (2.8%) | 59 (1.5%) |
| 35 to 44 Years | 47 (0.9%) | 292 (5.5%) |
| 45 to 54 Years | 156 (3.0%) | 177 (3.4%) |
| 55 to 64 Years | 198 (4.4%) | 106 (2.3%) |
| 65 to 74 Years | 49 (2.5%) | 97 (4.4%) |
| 75 Years and over | 83 (7.2%) | 156 (10.1%) |
| Total | 1,234 (3.5%) | 1,443 (4.2%) |
Income Above Poverty by Sex and Age in Lakeville
According to the poverty statistics in Lakeville, males aged 35 to 44 years and females aged 16 and 17 years are the age groups that are most secure financially, with 99.1% of males and 100.0% of females in these age groups living above the poverty line.
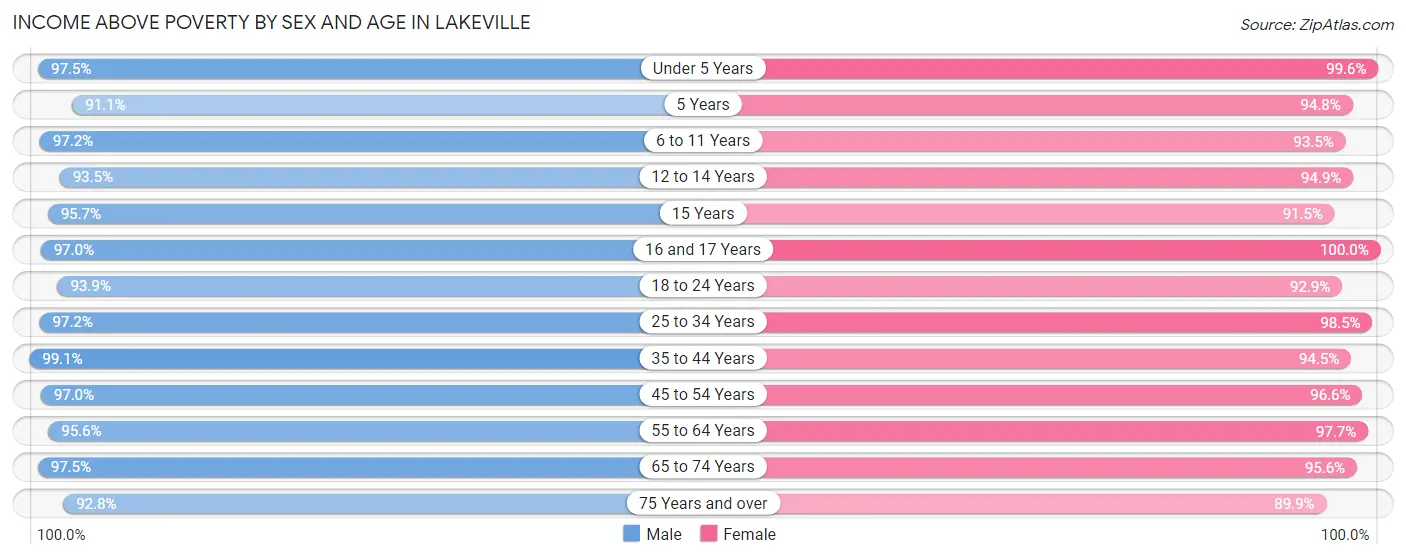
| Age Bracket | Male | Female |
| Under 5 Years | 2,371 (97.5%) | 2,381 (99.6%) |
| 5 Years | 494 (91.1%) | 347 (94.8%) |
| 6 to 11 Years | 3,547 (97.2%) | 2,830 (93.5%) |
| 12 to 14 Years | 1,746 (93.5%) | 1,770 (94.9%) |
| 15 Years | 668 (95.7%) | 430 (91.5%) |
| 16 and 17 Years | 939 (97.0%) | 814 (100.0%) |
| 18 to 24 Years | 2,876 (93.9%) | 2,544 (92.8%) |
| 25 to 34 Years | 4,181 (97.2%) | 3,836 (98.5%) |
| 35 to 44 Years | 5,314 (99.1%) | 5,057 (94.5%) |
| 45 to 54 Years | 4,991 (97.0%) | 5,037 (96.6%) |
| 55 to 64 Years | 4,299 (95.6%) | 4,469 (97.7%) |
| 65 to 74 Years | 1,946 (97.5%) | 2,113 (95.6%) |
| 75 Years and over | 1,073 (92.8%) | 1,394 (89.9%) |
| Total | 34,445 (96.5%) | 33,022 (95.8%) |
Income Below Poverty Among Married-Couple Families in Lakeville
The poverty statistics for married-couple families in Lakeville show that 1.5% or 243 of the total 16,195 families live below the poverty line. Families with 3 or 4 children have the highest poverty rate of 3.0%, comprising of 58 families. On the other hand, families with 5 or more children have the lowest poverty rate of 0.0%, which includes 0 families.
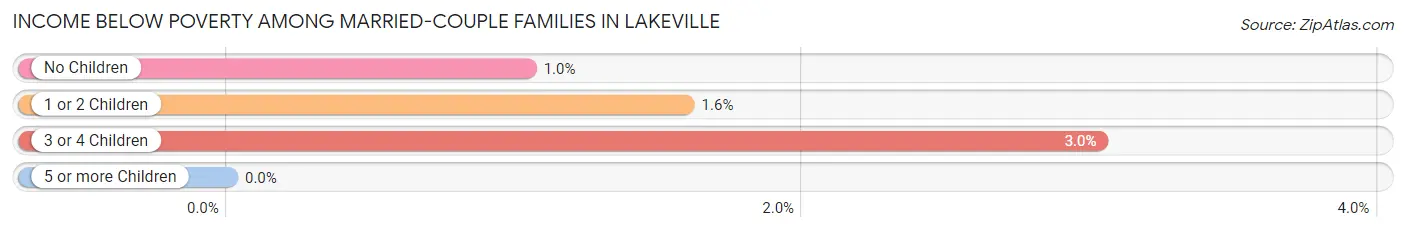
| Children | Above Poverty | Below Poverty |
| No Children | 7,492 (99.0%) | 79 (1.0%) |
| 1 or 2 Children | 6,578 (98.4%) | 106 (1.6%) |
| 3 or 4 Children | 1,859 (97.0%) | 58 (3.0%) |
| 5 or more Children | 23 (100.0%) | 0 (0.0%) |
| Total | 15,952 (98.5%) | 243 (1.5%) |
Income Below Poverty Among Single-Parent Households in Lakeville
According to the poverty data in Lakeville, 9.1% or 73 single-father households and 9.5% or 204 single-mother households are living below the poverty line. Among single-father households, those with no children have the highest poverty rate, with 43 households (15.3%) experiencing poverty. Likewise, among single-mother households, those with 1 or 2 children have the highest poverty rate, with 162 households (12.5%) falling below the poverty line.
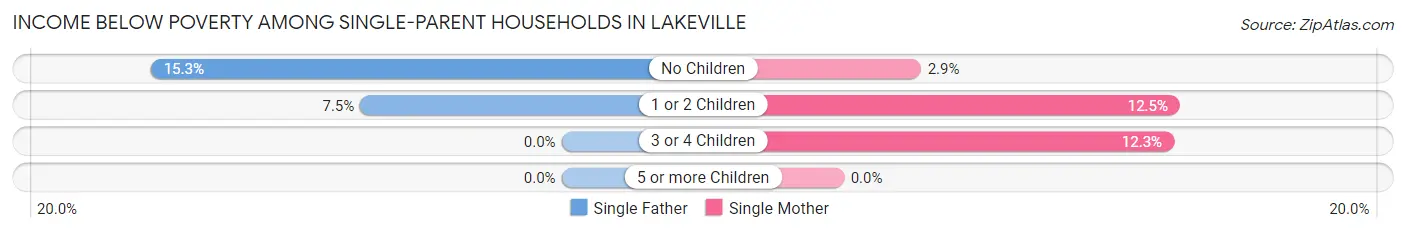
| Children | Single Father | Single Mother |
| No Children | 43 (15.3%) | 19 (2.9%) |
| 1 or 2 Children | 30 (7.5%) | 162 (12.5%) |
| 3 or 4 Children | 0 (0.0%) | 23 (12.3%) |
| 5 or more Children | 0 (0.0%) | 0 (0.0%) |
| Total | 73 (9.1%) | 204 (9.5%) |
Income Below Poverty Among Married-Couple vs Single-Parent Households in Lakeville
The poverty data for Lakeville shows that 243 of the married-couple family households (1.5%) and 277 of the single-parent households (9.4%) are living below the poverty level. Within the married-couple family households, those with 3 or 4 children have the highest poverty rate, with 58 households (3.0%) falling below the poverty line. Among the single-parent households, those with 1 or 2 children have the highest poverty rate, with 192 household (11.3%) living below poverty.
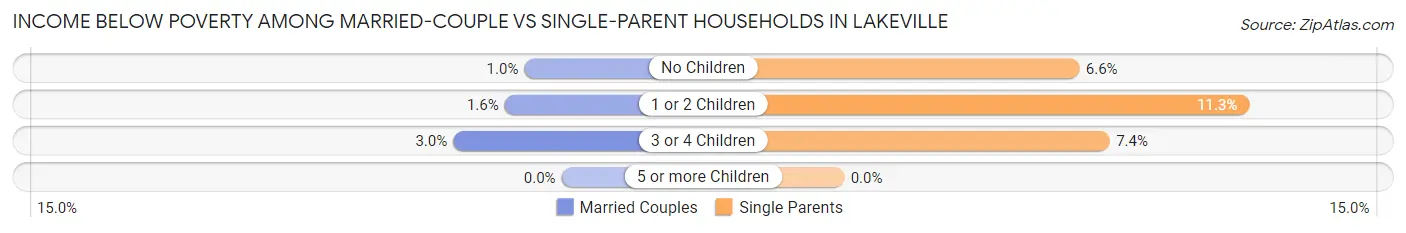
| Children | Married-Couple Families | Single-Parent Households |
| No Children | 79 (1.0%) | 62 (6.6%) |
| 1 or 2 Children | 106 (1.6%) | 192 (11.3%) |
| 3 or 4 Children | 58 (3.0%) | 23 (7.4%) |
| 5 or more Children | 0 (0.0%) | 0 (0.0%) |
| Total | 243 (1.5%) | 277 (9.4%) |
Race in Lakeville
The most populous races in Lakeville are White / Caucasian (57,775 | 81.7%), Asian (4,215 | 6.0%), and Hispanic or Latino (3,776 | 5.3%).
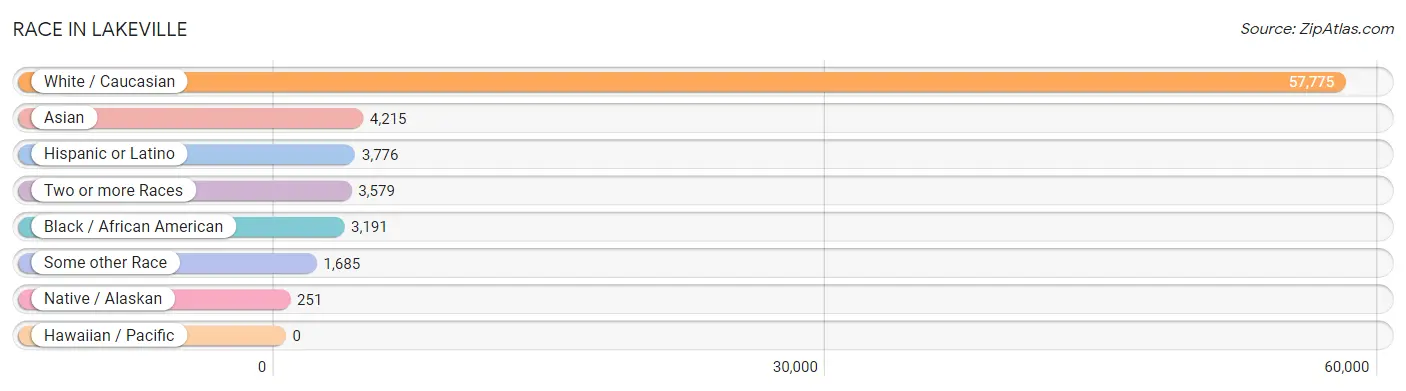
| Race | # Population | % Population |
| Asian | 4,215 | 6.0% |
| Black / African American | 3,191 | 4.5% |
| Hawaiian / Pacific | 0 | 0.0% |
| Hispanic or Latino | 3,776 | 5.3% |
| Native / Alaskan | 251 | 0.4% |
| White / Caucasian | 57,775 | 81.7% |
| Two or more Races | 3,579 | 5.1% |
| Some other Race | 1,685 | 2.4% |
| Total | 70,696 | 100.0% |
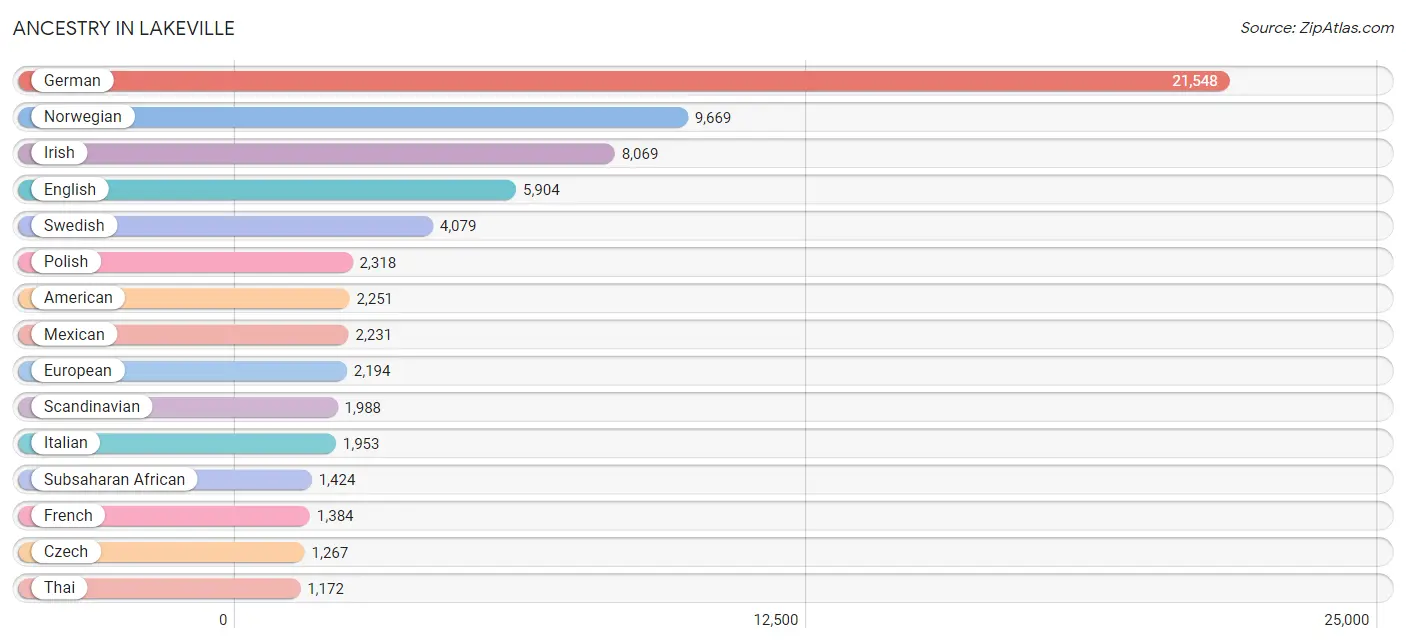
Ancestry in Lakeville
The most populous ancestries reported in Lakeville are German (21,548 | 30.5%), Norwegian (9,669 | 13.7%), Irish (8,069 | 11.4%), English (5,904 | 8.4%), and Swedish (4,079 | 5.8%), together accounting for 69.7% of all Lakeville residents.
| Ancestry | # Population | % Population |
| Afghan | 67 | 0.1% |
| African | 507 | 0.7% |
| American | 2,251 | 3.2% |
| Arab | 283 | 0.4% |
| Austrian | 196 | 0.3% |
| Bangladeshi | 280 | 0.4% |
| Belgian | 169 | 0.2% |
| Bhutanese | 226 | 0.3% |
| Blackfeet | 43 | 0.1% |
| Brazilian | 25 | 0.0% |
| British | 252 | 0.4% |
| Bulgarian | 35 | 0.1% |
| Burmese | 636 | 0.9% |
| Cajun | 13 | 0.0% |
| Canadian | 108 | 0.2% |
| Celtic | 8 | 0.0% |
| Central American | 580 | 0.8% |
| Central American Indian | 55 | 0.1% |
| Cherokee | 112 | 0.2% |
| Chippewa | 116 | 0.2% |
| Choctaw | 3 | 0.0% |
| Croatian | 84 | 0.1% |
| Cuban | 86 | 0.1% |
| Czech | 1,267 | 1.8% |
| Czechoslovakian | 427 | 0.6% |
| Danish | 936 | 1.3% |
| Dutch | 1,125 | 1.6% |
| Eastern European | 375 | 0.5% |
| Ecuadorian | 85 | 0.1% |
| Egyptian | 26 | 0.0% |
| English | 5,904 | 8.4% |
| Ethiopian | 247 | 0.4% |
| European | 2,194 | 3.1% |
| Filipino | 26 | 0.0% |
| Finnish | 743 | 1.1% |
| French | 1,384 | 2.0% |
| French American Indian | 23 | 0.0% |
| French Canadian | 322 | 0.5% |
| German | 21,548 | 30.5% |
| Ghanaian | 5 | 0.0% |
| Greek | 155 | 0.2% |
| Guatemalan | 151 | 0.2% |
| Guyanese | 85 | 0.1% |
| Haitian | 72 | 0.1% |
| Honduran | 12 | 0.0% |
| Hungarian | 85 | 0.1% |
| Icelander | 10 | 0.0% |
| Indian (Asian) | 552 | 0.8% |
| Iranian | 49 | 0.1% |
| Irish | 8,069 | 11.4% |
| Italian | 1,953 | 2.8% |
| Japanese | 554 | 0.8% |
| Kenyan | 331 | 0.5% |
| Korean | 444 | 0.6% |
| Lebanese | 139 | 0.2% |
| Liberian | 64 | 0.1% |
| Lithuanian | 48 | 0.1% |
| Luxembourger | 12 | 0.0% |
| Malaysian | 459 | 0.6% |
| Mexican | 2,231 | 3.2% |
| Mexican American Indian | 21 | 0.0% |
| Mongolian | 34 | 0.1% |
| New Zealander | 20 | 0.0% |
| Nigerian | 24 | 0.0% |
| Northern European | 176 | 0.3% |
| Norwegian | 9,669 | 13.7% |
| Pakistani | 40 | 0.1% |
| Palestinian | 10 | 0.0% |
| Panamanian | 18 | 0.0% |
| Pennsylvania German | 11 | 0.0% |
| Peruvian | 25 | 0.0% |
| Polish | 2,318 | 3.3% |
| Potawatomi | 28 | 0.0% |
| Puerto Rican | 445 | 0.6% |
| Romanian | 128 | 0.2% |
| Russian | 384 | 0.5% |
| Salvadoran | 399 | 0.6% |
| Scandinavian | 1,988 | 2.8% |
| Scotch-Irish | 597 | 0.8% |
| Scottish | 767 | 1.1% |
| Serbian | 6 | 0.0% |
| Sierra Leonean | 23 | 0.0% |
| Sioux | 116 | 0.2% |
| Slavic | 76 | 0.1% |
| Slovak | 271 | 0.4% |
| Slovene | 36 | 0.1% |
| Somali | 312 | 0.4% |
| South American | 110 | 0.2% |
| South American Indian | 10 | 0.0% |
| Spaniard | 43 | 0.1% |
| Spanish | 96 | 0.1% |
| Sri Lankan | 719 | 1.0% |
| Subsaharan African | 1,424 | 2.0% |
| Sudanese | 17 | 0.0% |
| Swedish | 4,079 | 5.8% |
| Swiss | 112 | 0.2% |
| Thai | 1,172 | 1.7% |
| Tongan | 34 | 0.1% |
| Turkish | 14 | 0.0% |
| Ukrainian | 231 | 0.3% |
| Welsh | 288 | 0.4% |
| West Indian | 76 | 0.1% | View All 102 Rows |
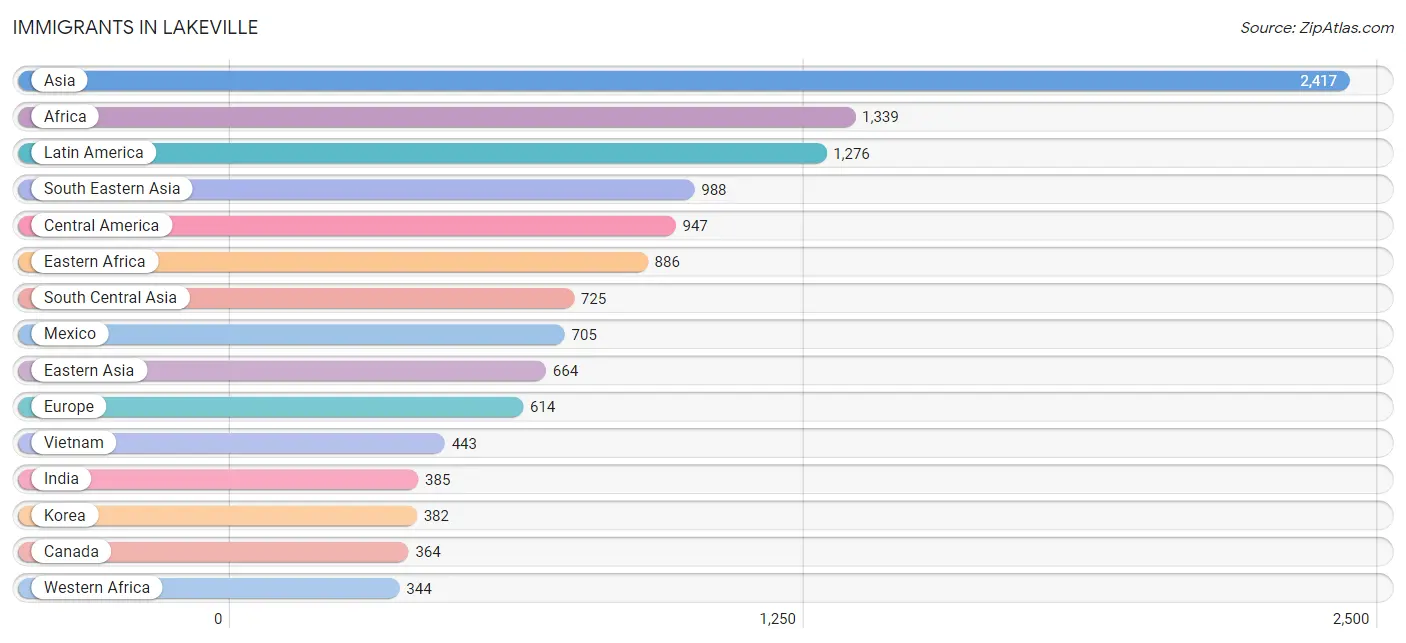
Immigrants in Lakeville
The most numerous immigrant groups reported in Lakeville came from Asia (2,417 | 3.4%), Africa (1,339 | 1.9%), Latin America (1,276 | 1.8%), South Eastern Asia (988 | 1.4%), and Central America (947 | 1.3%), together accounting for 9.8% of all Lakeville residents.
| Immigration Origin | # Population | % Population |
| Afghanistan | 33 | 0.1% |
| Africa | 1,339 | 1.9% |
| Asia | 2,417 | 3.4% |
| Bangladesh | 46 | 0.1% |
| Bosnia and Herzegovina | 56 | 0.1% |
| Brazil | 25 | 0.0% |
| Cambodia | 174 | 0.3% |
| Cameroon | 80 | 0.1% |
| Canada | 364 | 0.5% |
| Caribbean | 72 | 0.1% |
| Central America | 947 | 1.3% |
| China | 198 | 0.3% |
| Colombia | 11 | 0.0% |
| Eastern Africa | 886 | 1.3% |
| Eastern Asia | 664 | 0.9% |
| Eastern Europe | 252 | 0.4% |
| Ecuador | 65 | 0.1% |
| Egypt | 12 | 0.0% |
| El Salvador | 115 | 0.2% |
| England | 23 | 0.0% |
| Ethiopia | 318 | 0.4% |
| Europe | 614 | 0.9% |
| Germany | 189 | 0.3% |
| Ghana | 5 | 0.0% |
| Greece | 6 | 0.0% |
| Guatemala | 89 | 0.1% |
| Guyana | 139 | 0.2% |
| Haiti | 72 | 0.1% |
| Hong Kong | 18 | 0.0% |
| India | 385 | 0.5% |
| Italy | 42 | 0.1% |
| Japan | 84 | 0.1% |
| Kazakhstan | 19 | 0.0% |
| Kenya | 327 | 0.5% |
| Korea | 382 | 0.5% |
| Laos | 236 | 0.3% |
| Latin America | 1,276 | 1.8% |
| Lebanon | 40 | 0.1% |
| Liberia | 90 | 0.1% |
| Malaysia | 34 | 0.1% |
| Mexico | 705 | 1.0% |
| Middle Africa | 80 | 0.1% |
| Moldova | 14 | 0.0% |
| Nepal | 34 | 0.1% |
| Nigeria | 99 | 0.1% |
| Northern Africa | 12 | 0.0% |
| Northern Europe | 125 | 0.2% |
| Oceania | 20 | 0.0% |
| Pakistan | 208 | 0.3% |
| Panama | 38 | 0.1% |
| Peru | 17 | 0.0% |
| Philippines | 53 | 0.1% |
| Poland | 13 | 0.0% |
| Romania | 53 | 0.1% |
| Russia | 67 | 0.1% |
| Sierra Leone | 23 | 0.0% |
| Somalia | 197 | 0.3% |
| South Africa | 17 | 0.0% |
| South America | 257 | 0.4% |
| South Central Asia | 725 | 1.0% |
| South Eastern Asia | 988 | 1.4% |
| Southern Europe | 48 | 0.1% |
| Sweden | 14 | 0.0% |
| Taiwan | 25 | 0.0% |
| Thailand | 48 | 0.1% |
| Ukraine | 49 | 0.1% |
| Vietnam | 443 | 0.6% |
| Western Africa | 344 | 0.5% |
| Western Asia | 40 | 0.1% |
| Western Europe | 189 | 0.3% |
| Zimbabwe | 38 | 0.1% | View All 71 Rows |
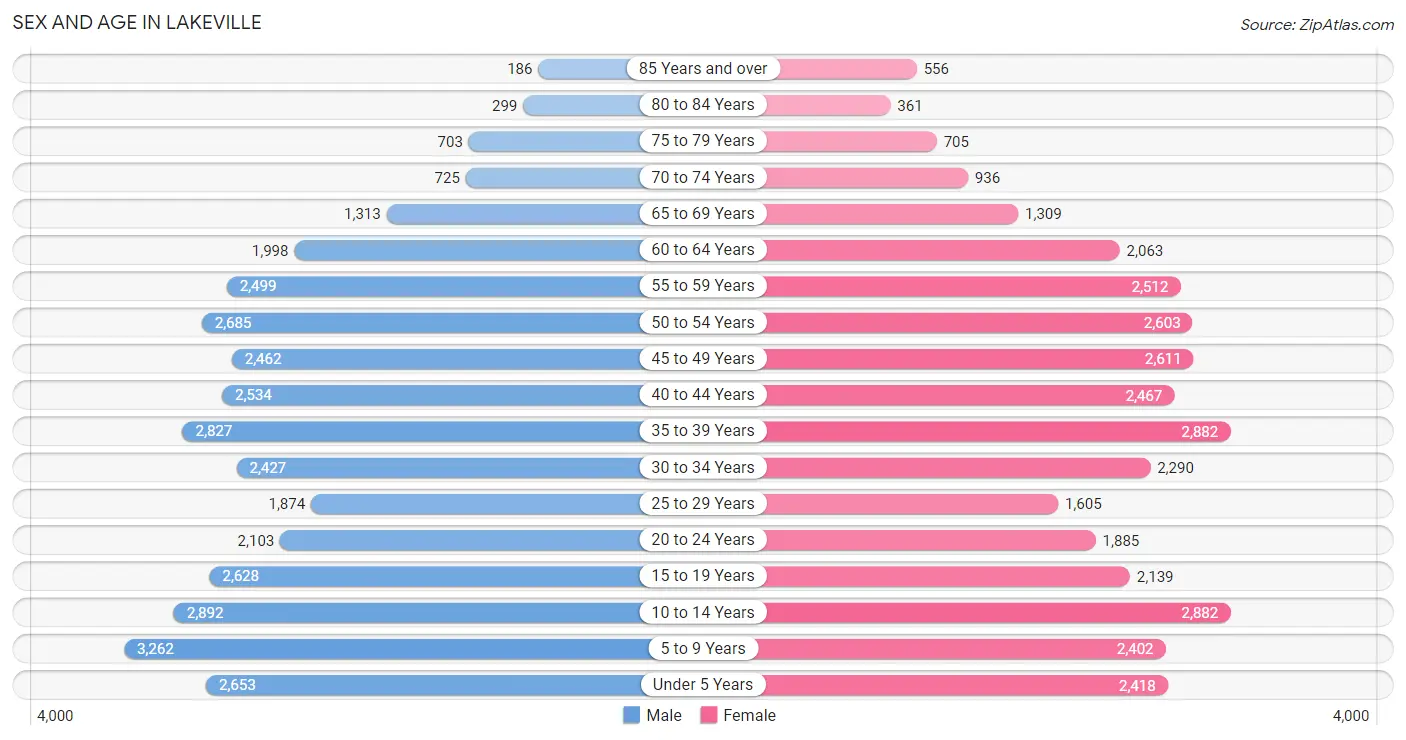
Sex and Age in Lakeville
Sex and Age in Lakeville
The most populous age groups in Lakeville are 5 to 9 Years (3,262 | 9.0%) for men and 10 to 14 Years (2,882 | 8.3%) for women.
| Age Bracket | Male | Female |
| Under 5 Years | 2,653 (7.4%) | 2,418 (7.0%) |
| 5 to 9 Years | 3,262 (9.0%) | 2,402 (6.9%) |
| 10 to 14 Years | 2,892 (8.0%) | 2,882 (8.3%) |
| 15 to 19 Years | 2,628 (7.3%) | 2,139 (6.2%) |
| 20 to 24 Years | 2,103 (5.8%) | 1,885 (5.4%) |
| 25 to 29 Years | 1,874 (5.2%) | 1,605 (4.6%) |
| 30 to 34 Years | 2,427 (6.7%) | 2,290 (6.6%) |
| 35 to 39 Years | 2,827 (7.8%) | 2,882 (8.3%) |
| 40 to 44 Years | 2,534 (7.0%) | 2,467 (7.1%) |
| 45 to 49 Years | 2,462 (6.8%) | 2,611 (7.5%) |
| 50 to 54 Years | 2,685 (7.4%) | 2,603 (7.5%) |
| 55 to 59 Years | 2,499 (6.9%) | 2,512 (7.2%) |
| 60 to 64 Years | 1,998 (5.5%) | 2,063 (6.0%) |
| 65 to 69 Years | 1,313 (3.6%) | 1,309 (3.8%) |
| 70 to 74 Years | 725 (2.0%) | 936 (2.7%) |
| 75 to 79 Years | 703 (1.9%) | 705 (2.0%) |
| 80 to 84 Years | 299 (0.8%) | 361 (1.0%) |
| 85 Years and over | 186 (0.5%) | 556 (1.6%) |
| Total | 36,070 (100.0%) | 34,626 (100.0%) |
Families and Households in Lakeville
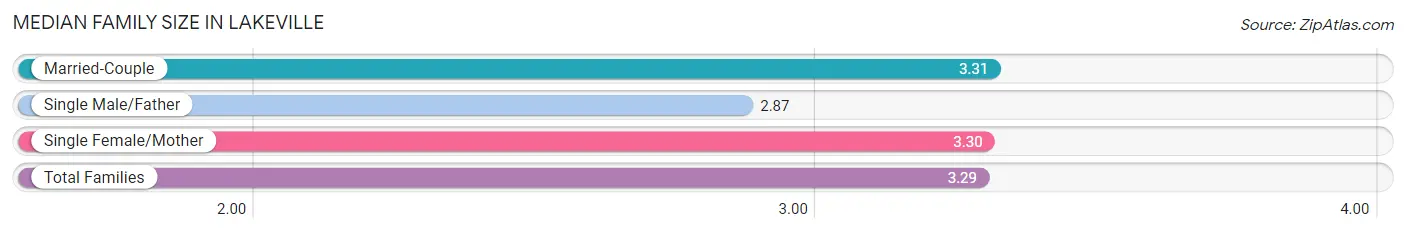
Median Family Size in Lakeville
The median family size in Lakeville is 3.29 persons per family, with married-couple families (16,195 | 84.6%) accounting for the largest median family size of 3.31 persons per family. On the other hand, single male/father families (804 | 4.2%) represent the smallest median family size with 2.87 persons per family.
| Family Type | # Families | Family Size |
| Married-Couple | 16,195 (84.6%) | 3.31 |
| Single Male/Father | 804 (4.2%) | 2.87 |
| Single Female/Mother | 2,143 (11.2%) | 3.30 |
| Total Families | 19,142 (100.0%) | 3.29 |
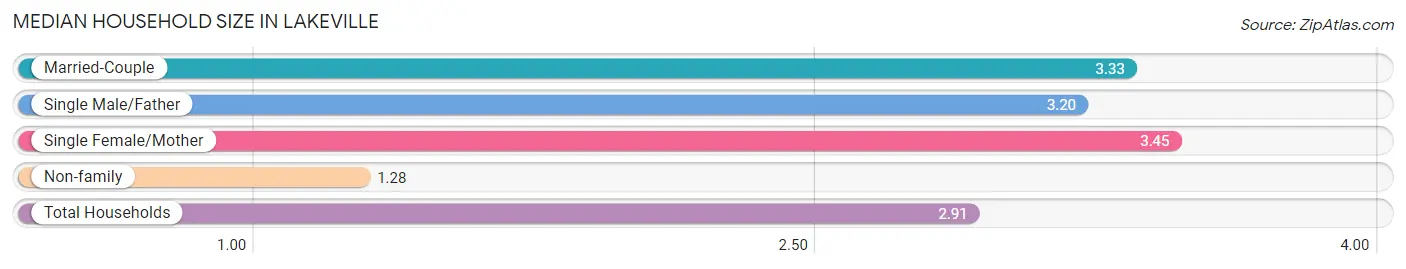
Median Household Size in Lakeville
The median household size in Lakeville is 2.91 persons per household, with single female/mother households (2,143 | 8.8%) accounting for the largest median household size of 3.45 persons per household. non-family households (5,110 | 21.1%) represent the smallest median household size with 1.28 persons per household.
| Household Type | # Households | Household Size |
| Married-Couple | 16,195 (66.8%) | 3.33 |
| Single Male/Father | 804 (3.3%) | 3.20 |
| Single Female/Mother | 2,143 (8.8%) | 3.45 |
| Non-family | 5,110 (21.1%) | 1.28 |
| Total Households | 24,252 (100.0%) | 2.91 |
Household Size by Marriage Status in Lakeville
Out of a total of 24,252 households in Lakeville, 19,142 (78.9%) are family households, while 5,110 (21.1%) are nonfamily households. The most numerous type of family households are 2-person households, comprising 6,635, and the most common type of nonfamily households are 1-person households, comprising 4,017.
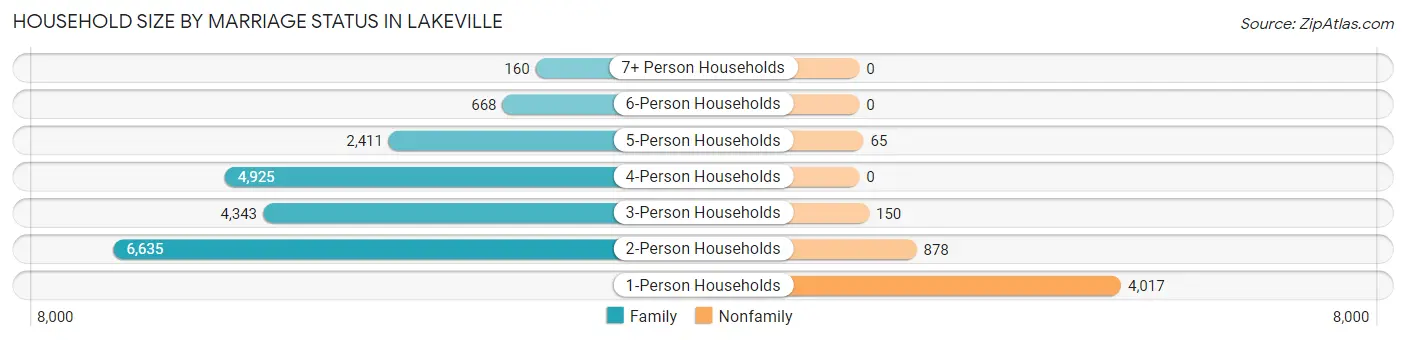
| Household Size | Family Households | Nonfamily Households |
| 1-Person Households | - | 4,017 (16.6%) |
| 2-Person Households | 6,635 (27.4%) | 878 (3.6%) |
| 3-Person Households | 4,343 (17.9%) | 150 (0.6%) |
| 4-Person Households | 4,925 (20.3%) | 0 (0.0%) |
| 5-Person Households | 2,411 (9.9%) | 65 (0.3%) |
| 6-Person Households | 668 (2.8%) | 0 (0.0%) |
| 7+ Person Households | 160 (0.7%) | 0 (0.0%) |
| Total | 19,142 (78.9%) | 5,110 (21.1%) |
Female Fertility in Lakeville
Fertility by Age in Lakeville
Average fertility rate in Lakeville is 65.0 births per 1,000 women. Women in the age bracket of 20 to 34 years have the highest fertility rate with 153.0 births per 1,000 women. Women in the age bracket of 20 to 34 years acount for 83.4% of all women with births.
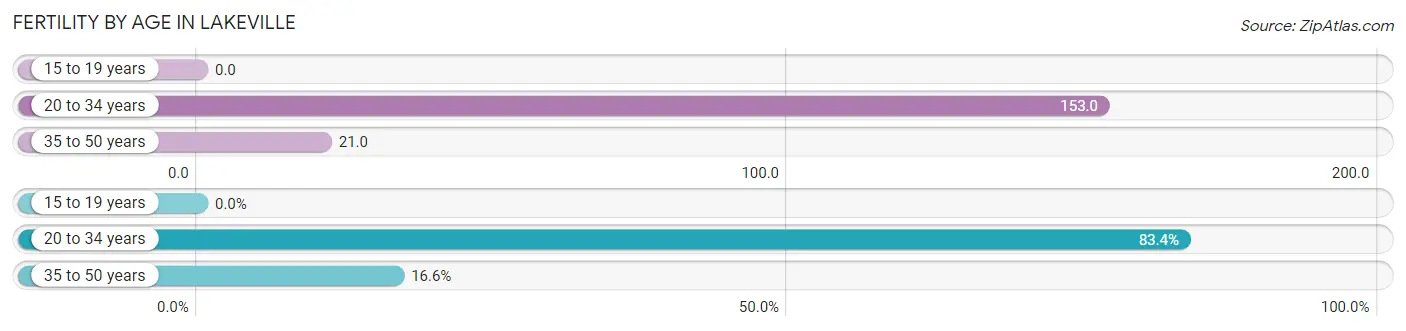
| Age Bracket | Women with Births | Births / 1,000 Women |
| 15 to 19 years | 0 (0.0%) | 0.0 |
| 20 to 34 years | 882 (83.4%) | 153.0 |
| 35 to 50 years | 176 (16.6%) | 21.0 |
| Total | 1,058 (100.0%) | 65.0 |
Fertility by Age by Marriage Status in Lakeville
90.2% of women with births (1,058) in Lakeville are married. The highest percentage of unmarried women with births falls into 20 to 34 years age bracket with 11.8% of them unmarried at the time of birth, while the lowest percentage of unmarried women with births belong to 35 to 50 years age bracket with 0.0% of them unmarried.
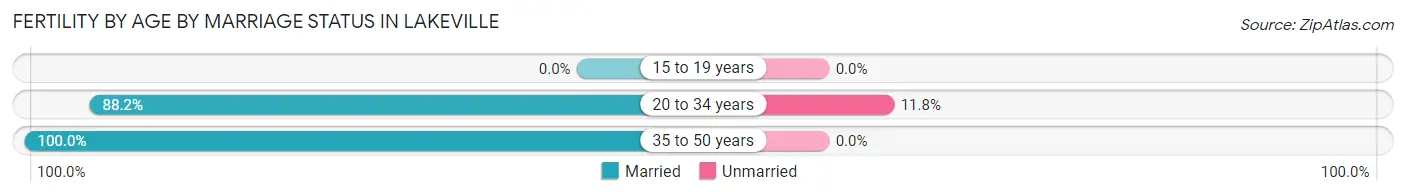
| Age Bracket | Married | Unmarried |
| 15 to 19 years | 0 (0.0%) | 0 (0.0%) |
| 20 to 34 years | 778 (88.2%) | 104 (11.8%) |
| 35 to 50 years | 176 (100.0%) | 0 (0.0%) |
| Total | 954 (90.2%) | 104 (9.8%) |
Fertility by Education in Lakeville
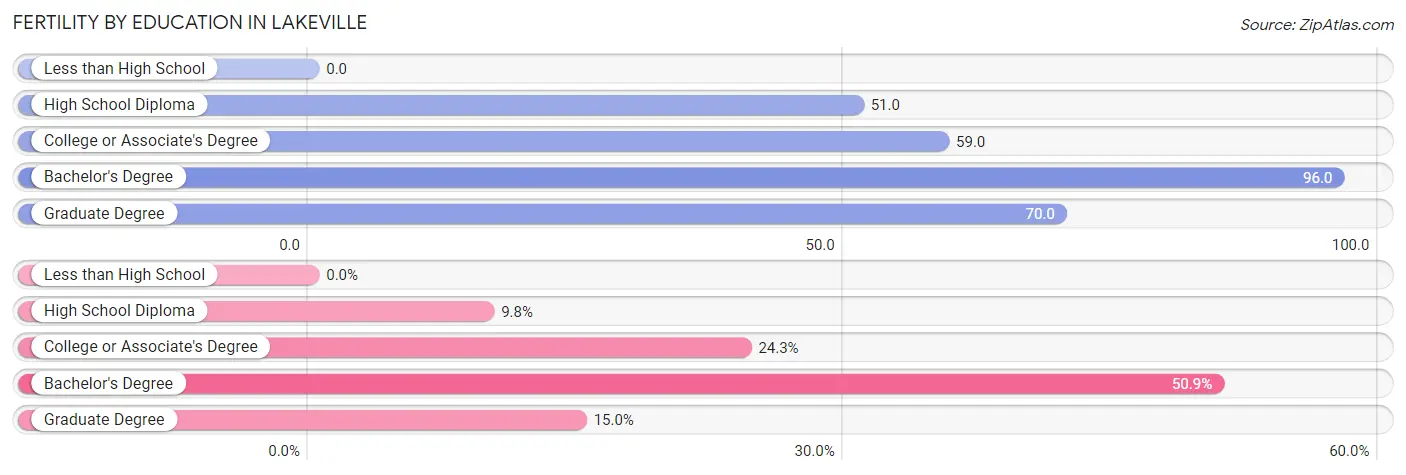
| Educational Attainment | Women with Births | Births / 1,000 Women |
| Less than High School | 0 (0.0%) | 0.0 |
| High School Diploma | 104 (9.8%) | 51.0 |
| College or Associate's Degree | 257 (24.3%) | 59.0 |
| Bachelor's Degree | 538 (50.8%) | 96.0 |
| Graduate Degree | 159 (15.0%) | 70.0 |
| Total | 1,058 (100.0%) | 65.0 |
Fertility by Education by Marriage Status in Lakeville
9.8% of women with births in Lakeville are unmarried. Women with the educational attainment of graduate degree are most likely to be married with 100.0% of them married at childbirth, while women with the educational attainment of high school diploma are least likely to be married with 40.4% of them unmarried at childbirth.
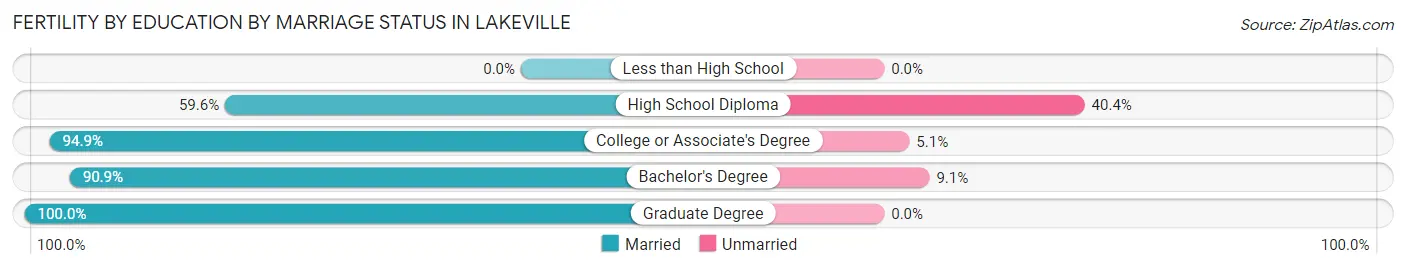
| Educational Attainment | Married | Unmarried |
| Less than High School | 0 (0.0%) | 0 (0.0%) |
| High School Diploma | 62 (59.6%) | 42 (40.4%) |
| College or Associate's Degree | 244 (94.9%) | 13 (5.1%) |
| Bachelor's Degree | 489 (90.9%) | 49 (9.1%) |
| Graduate Degree | 159 (100.0%) | 0 (0.0%) |
| Total | 954 (90.2%) | 104 (9.8%) |
Employment Characteristics in Lakeville
Employment by Class of Employer in Lakeville
Among the 38,149 employed individuals in Lakeville, private company employees (26,782 | 70.2%), not-for-profit organizations (3,594 | 9.4%), and local government employees (2,822 | 7.4%) make up the most common classes of employment.
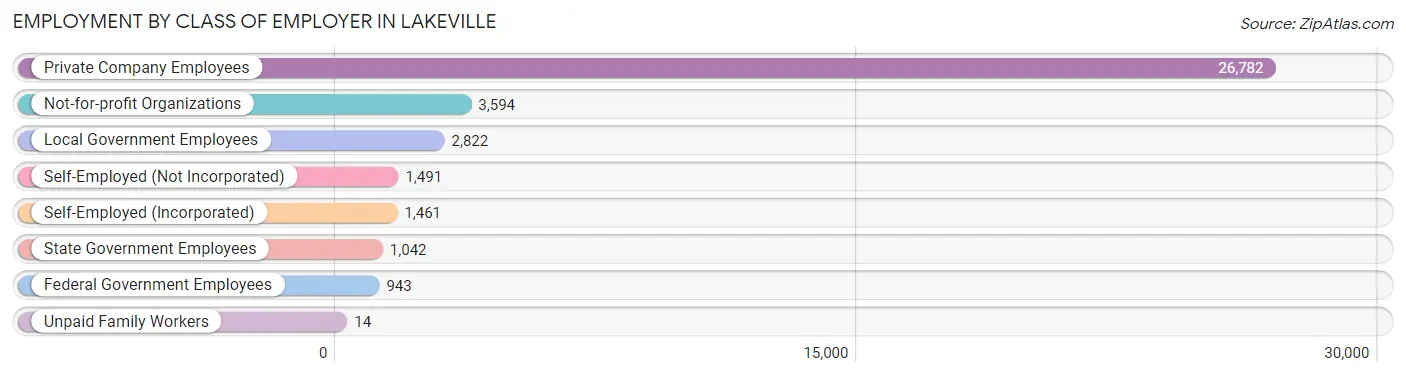
| Employer Class | # Employees | % Employees |
| Private Company Employees | 26,782 | 70.2% |
| Self-Employed (Incorporated) | 1,461 | 3.8% |
| Self-Employed (Not Incorporated) | 1,491 | 3.9% |
| Not-for-profit Organizations | 3,594 | 9.4% |
| Local Government Employees | 2,822 | 7.4% |
| State Government Employees | 1,042 | 2.7% |
| Federal Government Employees | 943 | 2.5% |
| Unpaid Family Workers | 14 | 0.0% |
| Total | 38,149 | 100.0% |
Employment Status by Age in Lakeville
According to the labor force statistics for Lakeville, out of the total population over 16 years of age (53,019), 75.1% or 39,817 individuals are in the labor force, with 2.5% or 995 of them unemployed. The age group with the highest labor force participation rate is 25 to 29 years, with 91.2% or 3,173 individuals in the labor force. Within the labor force, the 16 to 19 years age range has the highest percentage of unemployed individuals, with 8.1% or 162 of them being unemployed.
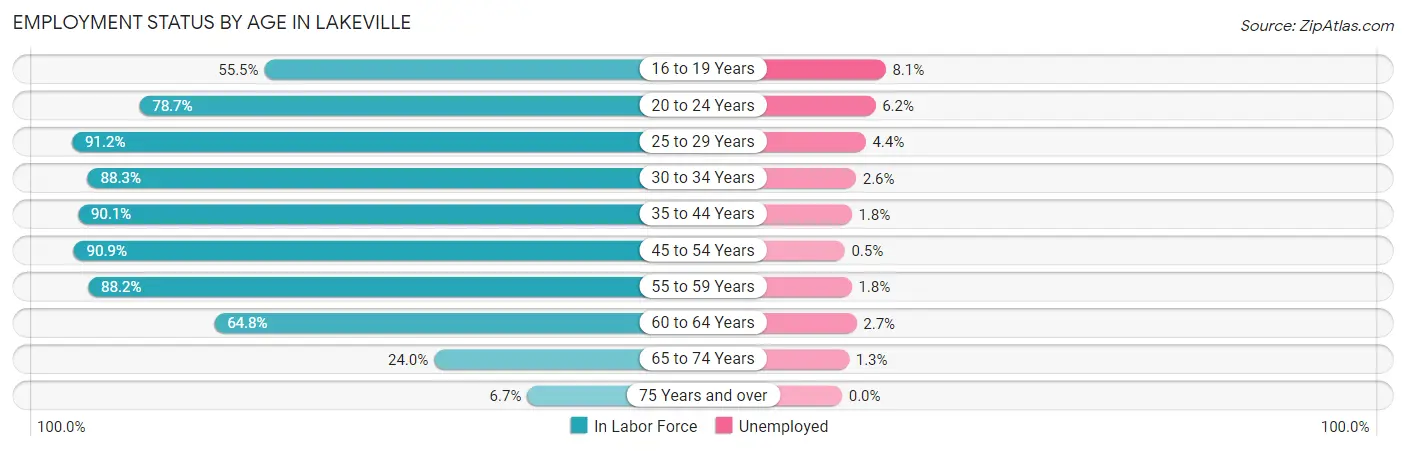
| Age Bracket | In Labor Force | Unemployed |
| 16 to 19 Years | 1,997 (55.5%) | 162 (8.1%) |
| 20 to 24 Years | 3,139 (78.7%) | 195 (6.2%) |
| 25 to 29 Years | 3,173 (91.2%) | 140 (4.4%) |
| 30 to 34 Years | 4,165 (88.3%) | 108 (2.6%) |
| 35 to 44 Years | 9,650 (90.1%) | 174 (1.8%) |
| 45 to 54 Years | 9,418 (90.9%) | 47 (0.5%) |
| 55 to 59 Years | 4,420 (88.2%) | 80 (1.8%) |
| 60 to 64 Years | 2,632 (64.8%) | 71 (2.7%) |
| 65 to 74 Years | 1,028 (24.0%) | 13 (1.3%) |
| 75 Years and over | 188 (6.7%) | 0 (0.0%) |
| Total | 39,817 (75.1%) | 995 (2.5%) |
Employment Status by Educational Attainment in Lakeville
According to labor force statistics for Lakeville, 87.3% of individuals (33,470) out of the total population between 25 and 64 years of age (38,339) are in the labor force, with 1.9% or 636 of them being unemployed. The group with the highest labor force participation rate are those with the educational attainment of bachelor's degree or higher, with 90.4% or 18,449 individuals in the labor force. Within the labor force, individuals with less than high school education have the highest percentage of unemployment, with 7.0% or 58 of them being unemployed.
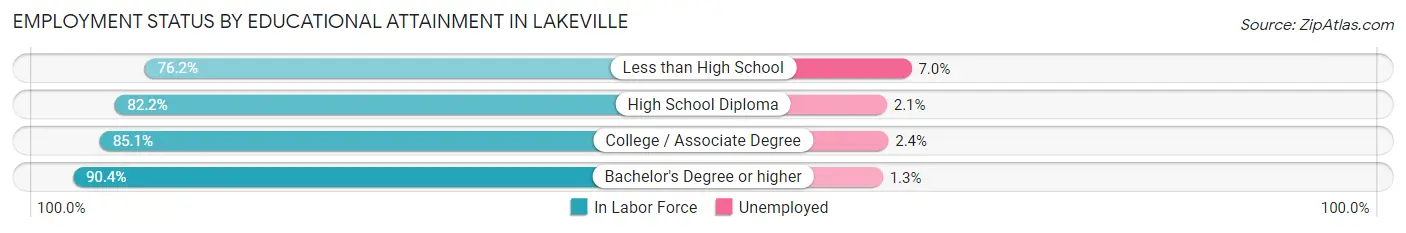
| Educational Attainment | In Labor Force | Unemployed |
| Less than High School | 834 (76.2%) | 77 (7.0%) |
| High School Diploma | 4,602 (82.2%) | 118 (2.1%) |
| College / Associate Degree | 9,564 (85.1%) | 270 (2.4%) |
| Bachelor's Degree or higher | 18,449 (90.4%) | 265 (1.3%) |
| Total | 33,470 (87.3%) | 728 (1.9%) |
Employment Occupations by Sex in Lakeville
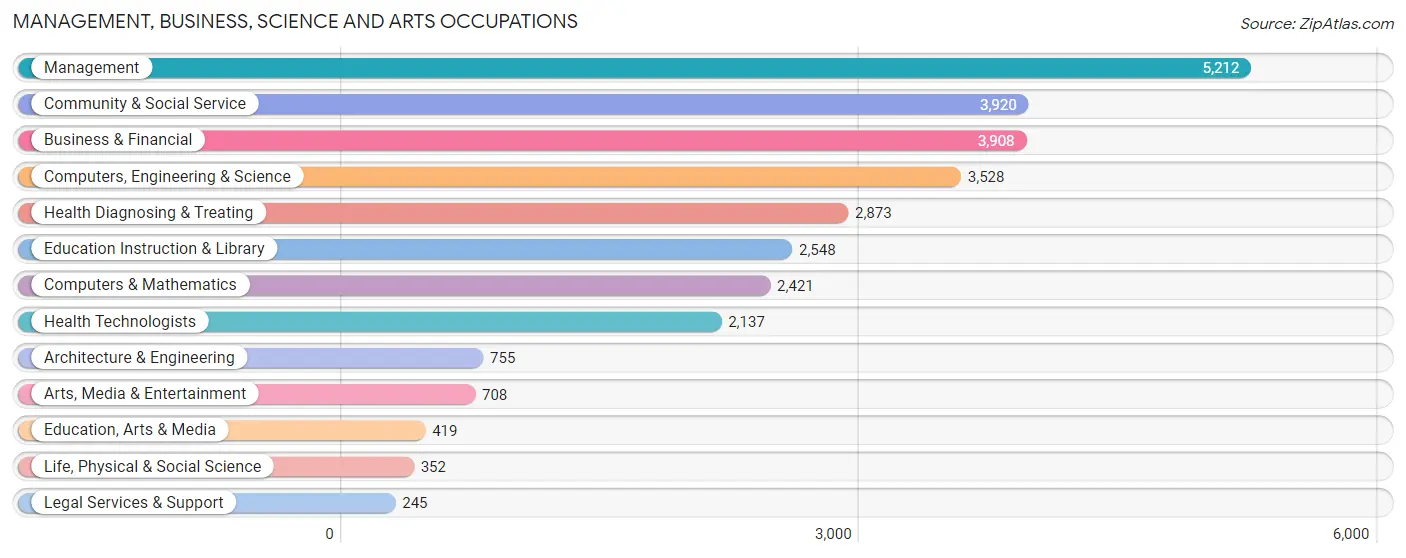
Management, Business, Science and Arts Occupations
The most common Management, Business, Science and Arts occupations in Lakeville are Management (5,212 | 13.5%), Community & Social Service (3,920 | 10.1%), Business & Financial (3,908 | 10.1%), Computers, Engineering & Science (3,528 | 9.1%), and Health Diagnosing & Treating (2,873 | 7.4%).
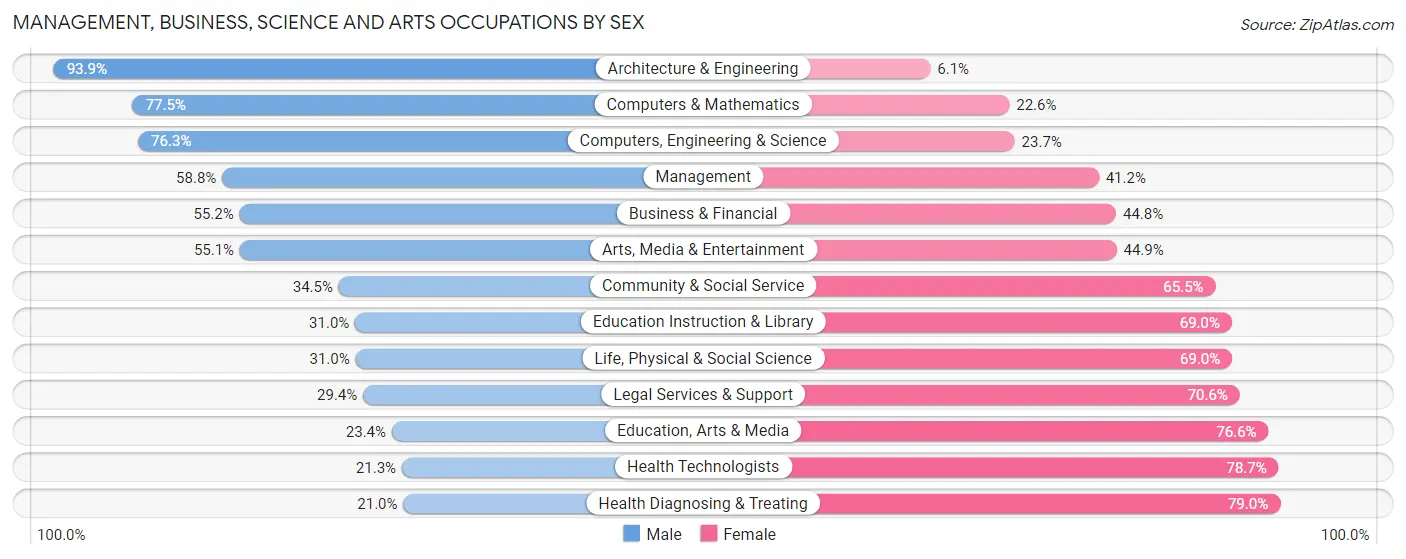
Management, Business, Science and Arts Occupations by Sex
Within the Management, Business, Science and Arts occupations in Lakeville, the most male-oriented occupations are Architecture & Engineering (93.9%), Computers & Mathematics (77.4%), and Computers, Engineering & Science (76.3%), while the most female-oriented occupations are Health Diagnosing & Treating (79.0%), Health Technologists (78.7%), and Education, Arts & Media (76.6%).
| Occupation | Male | Female |
| Management | 3,064 (58.8%) | 2,148 (41.2%) |
| Business & Financial | 2,156 (55.2%) | 1,752 (44.8%) |
| Computers, Engineering & Science | 2,693 (76.3%) | 835 (23.7%) |
| Computers & Mathematics | 1,875 (77.4%) | 546 (22.6%) |
| Architecture & Engineering | 709 (93.9%) | 46 (6.1%) |
| Life, Physical & Social Science | 109 (31.0%) | 243 (69.0%) |
| Community & Social Service | 1,351 (34.5%) | 2,569 (65.5%) |
| Education, Arts & Media | 98 (23.4%) | 321 (76.6%) |
| Legal Services & Support | 72 (29.4%) | 173 (70.6%) |
| Education Instruction & Library | 791 (31.0%) | 1,757 (69.0%) |
| Arts, Media & Entertainment | 390 (55.1%) | 318 (44.9%) |
| Health Diagnosing & Treating | 603 (21.0%) | 2,270 (79.0%) |
| Health Technologists | 455 (21.3%) | 1,682 (78.7%) |
| Total (Category) | 9,867 (50.7%) | 9,574 (49.2%) |
| Total (Overall) | 20,347 (52.6%) | 18,350 (47.4%) |
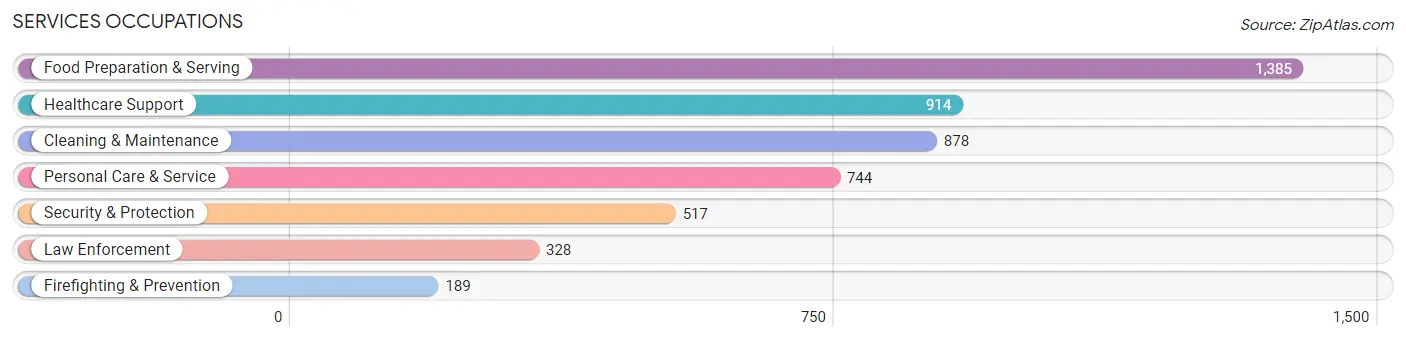
Services Occupations
The most common Services occupations in Lakeville are Food Preparation & Serving (1,385 | 3.6%), Healthcare Support (914 | 2.4%), Cleaning & Maintenance (878 | 2.3%), Personal Care & Service (744 | 1.9%), and Security & Protection (517 | 1.3%).
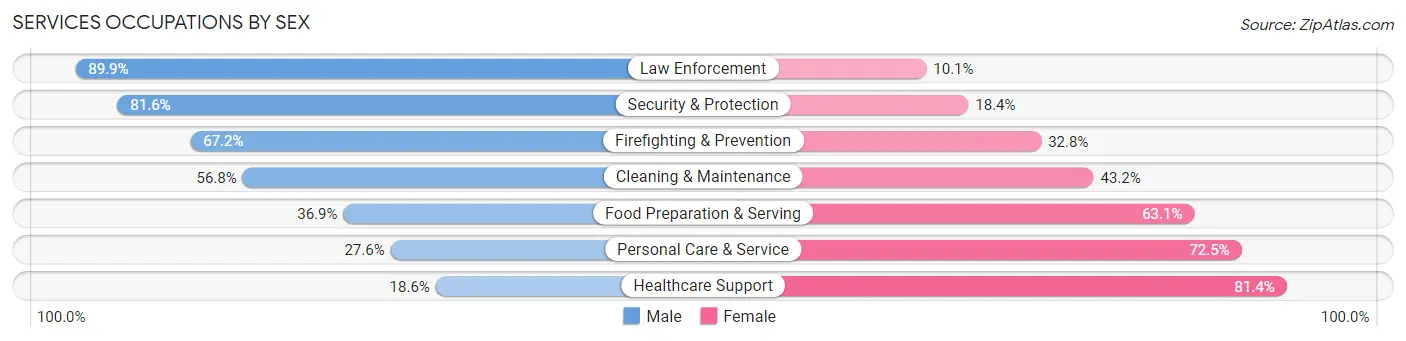
Services Occupations by Sex
Within the Services occupations in Lakeville, the most male-oriented occupations are Law Enforcement (89.9%), Security & Protection (81.6%), and Firefighting & Prevention (67.2%), while the most female-oriented occupations are Healthcare Support (81.4%), Personal Care & Service (72.5%), and Food Preparation & Serving (63.1%).
| Occupation | Male | Female |
| Healthcare Support | 170 (18.6%) | 744 (81.4%) |
| Security & Protection | 422 (81.6%) | 95 (18.4%) |
| Firefighting & Prevention | 127 (67.2%) | 62 (32.8%) |
| Law Enforcement | 295 (89.9%) | 33 (10.1%) |
| Food Preparation & Serving | 511 (36.9%) | 874 (63.1%) |
| Cleaning & Maintenance | 499 (56.8%) | 379 (43.2%) |
| Personal Care & Service | 205 (27.6%) | 539 (72.5%) |
| Total (Category) | 1,807 (40.7%) | 2,631 (59.3%) |
| Total (Overall) | 20,347 (52.6%) | 18,350 (47.4%) |
Sales and Office Occupations
The most common Sales and Office occupations in Lakeville are Sales & Related (4,620 | 11.9%), and Office & Administration (4,119 | 10.6%).

Sales and Office Occupations by Sex
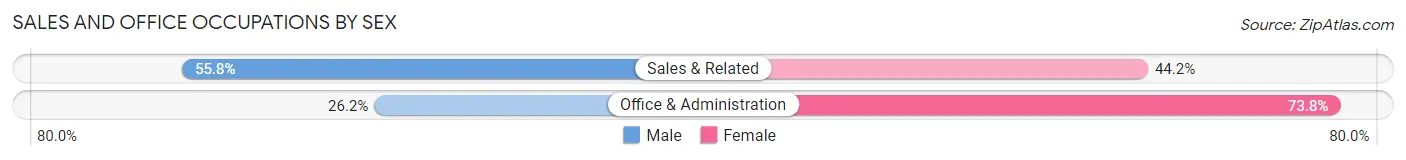
| Occupation | Male | Female |
| Sales & Related | 2,577 (55.8%) | 2,043 (44.2%) |
| Office & Administration | 1,080 (26.2%) | 3,039 (73.8%) |
| Total (Category) | 3,657 (41.8%) | 5,082 (58.2%) |
| Total (Overall) | 20,347 (52.6%) | 18,350 (47.4%) |
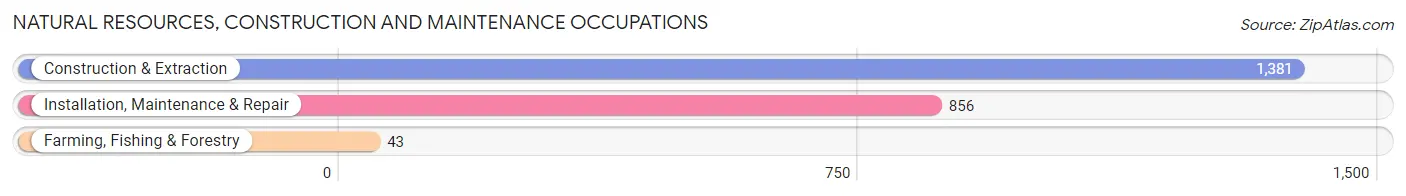
Natural Resources, Construction and Maintenance Occupations
The most common Natural Resources, Construction and Maintenance occupations in Lakeville are Construction & Extraction (1,381 | 3.6%), Installation, Maintenance & Repair (856 | 2.2%), and Farming, Fishing & Forestry (43 | 0.1%).
Natural Resources, Construction and Maintenance Occupations by Sex

| Occupation | Male | Female |
| Farming, Fishing & Forestry | 43 (100.0%) | 0 (0.0%) |
| Construction & Extraction | 1,381 (100.0%) | 0 (0.0%) |
| Installation, Maintenance & Repair | 835 (97.6%) | 21 (2.5%) |
| Total (Category) | 2,259 (99.1%) | 21 (0.9%) |
| Total (Overall) | 20,347 (52.6%) | 18,350 (47.4%) |
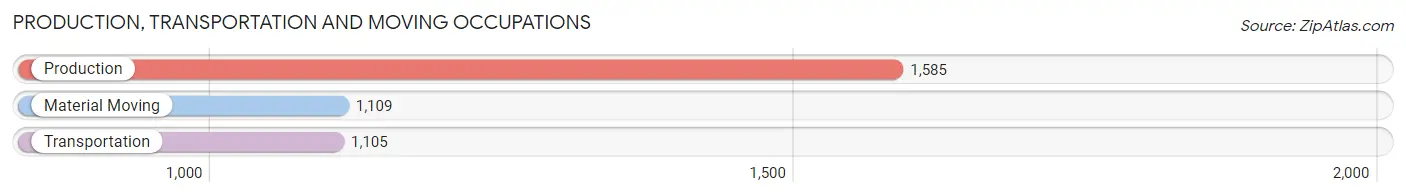
Production, Transportation and Moving Occupations
The most common Production, Transportation and Moving occupations in Lakeville are Production (1,585 | 4.1%), Material Moving (1,109 | 2.9%), and Transportation (1,105 | 2.9%).
Production, Transportation and Moving Occupations by Sex
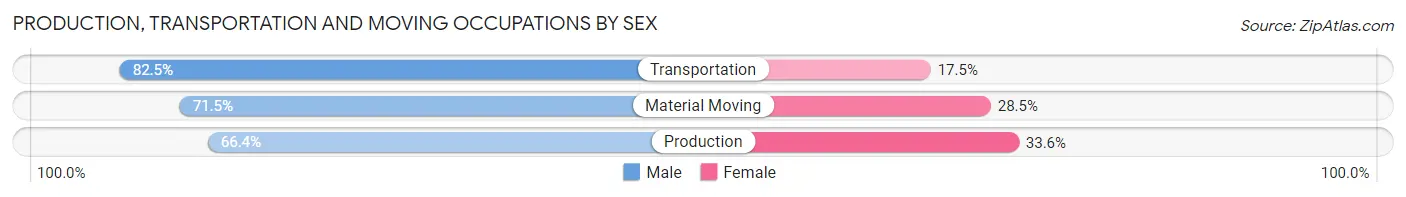
| Occupation | Male | Female |
| Production | 1,052 (66.4%) | 533 (33.6%) |
| Transportation | 912 (82.5%) | 193 (17.5%) |
| Material Moving | 793 (71.5%) | 316 (28.5%) |
| Total (Category) | 2,757 (72.6%) | 1,042 (27.4%) |
| Total (Overall) | 20,347 (52.6%) | 18,350 (47.4%) |
Employment Industries by Sex in Lakeville
Employment Industries in Lakeville
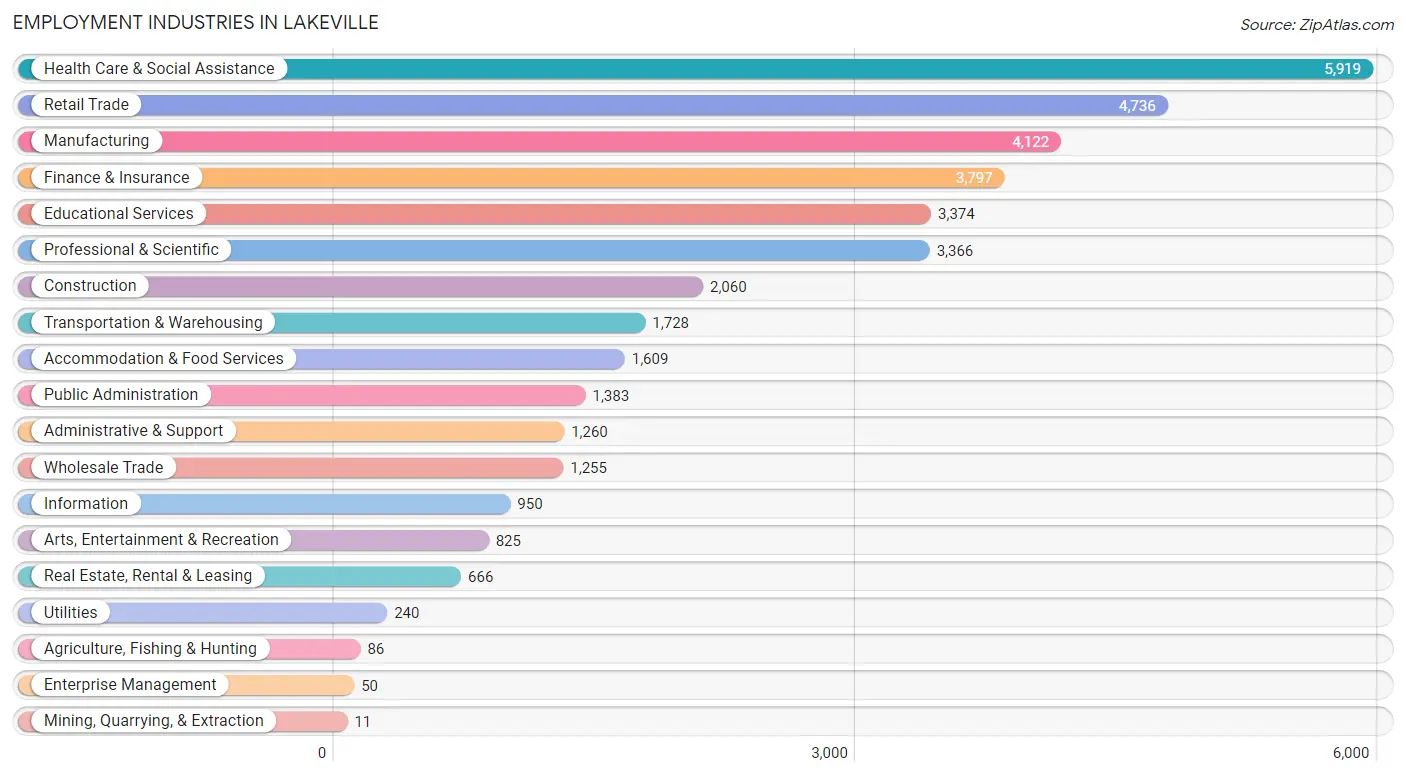
The major employment industries in Lakeville include Health Care & Social Assistance (5,919 | 15.3%), Retail Trade (4,736 | 12.2%), Manufacturing (4,122 | 10.6%), Finance & Insurance (3,797 | 9.8%), and Educational Services (3,374 | 8.7%).
Employment Industries by Sex in Lakeville
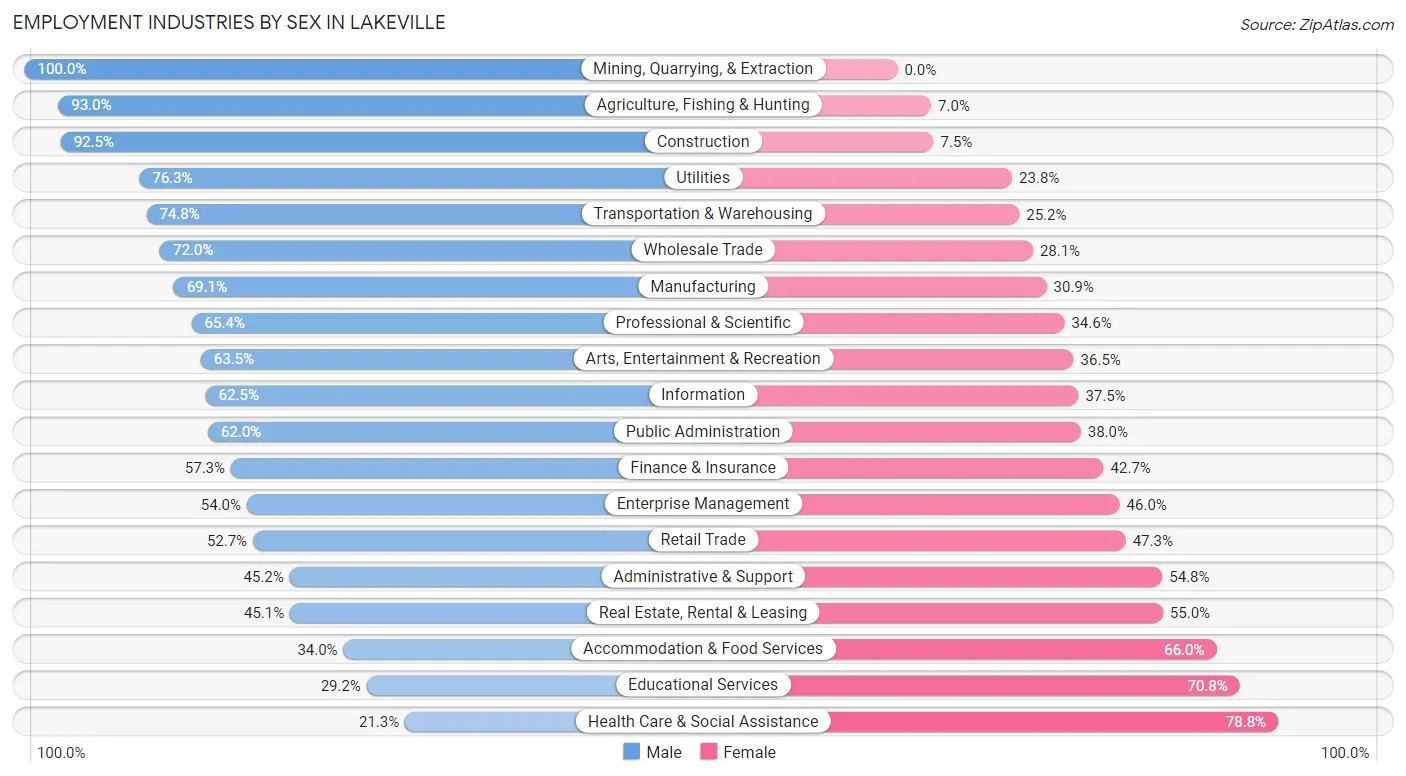
The Lakeville industries that see more men than women are Mining, Quarrying, & Extraction (100.0%), Agriculture, Fishing & Hunting (93.0%), and Construction (92.5%), whereas the industries that tend to have a higher number of women are Health Care & Social Assistance (78.7%), Educational Services (70.8%), and Accommodation & Food Services (66.0%).
| Industry | Male | Female |
| Agriculture, Fishing & Hunting | 80 (93.0%) | 6 (7.0%) |
| Mining, Quarrying, & Extraction | 11 (100.0%) | 0 (0.0%) |
| Construction | 1,906 (92.5%) | 154 (7.5%) |
| Manufacturing | 2,849 (69.1%) | 1,273 (30.9%) |
| Wholesale Trade | 903 (72.0%) | 352 (28.1%) |
| Retail Trade | 2,498 (52.7%) | 2,238 (47.3%) |
| Transportation & Warehousing | 1,292 (74.8%) | 436 (25.2%) |
| Utilities | 183 (76.2%) | 57 (23.7%) |
| Information | 594 (62.5%) | 356 (37.5%) |
| Finance & Insurance | 2,176 (57.3%) | 1,621 (42.7%) |
| Real Estate, Rental & Leasing | 300 (45.1%) | 366 (54.9%) |
| Professional & Scientific | 2,202 (65.4%) | 1,164 (34.6%) |
| Enterprise Management | 27 (54.0%) | 23 (46.0%) |
| Administrative & Support | 569 (45.2%) | 691 (54.8%) |
| Educational Services | 985 (29.2%) | 2,389 (70.8%) |
| Health Care & Social Assistance | 1,258 (21.2%) | 4,661 (78.7%) |
| Arts, Entertainment & Recreation | 524 (63.5%) | 301 (36.5%) |
| Accommodation & Food Services | 547 (34.0%) | 1,062 (66.0%) |
| Public Administration | 858 (62.0%) | 525 (38.0%) |
| Total | 20,347 (52.6%) | 18,350 (47.4%) |
Education in Lakeville
School Enrollment in Lakeville
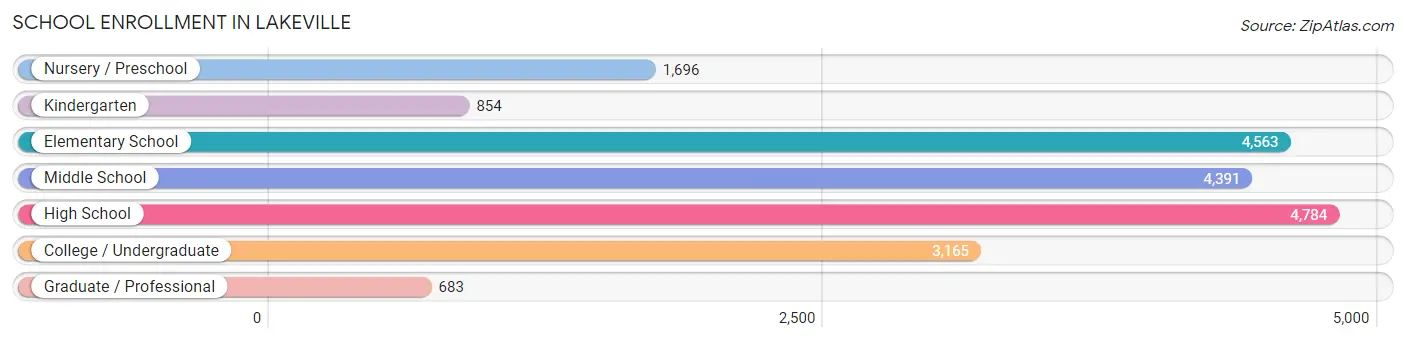
The most common levels of schooling among the 20,136 students in Lakeville are high school (4,784 | 23.8%), elementary school (4,563 | 22.7%), and middle school (4,391 | 21.8%).
| School Level | # Students | % Students |
| Nursery / Preschool | 1,696 | 8.4% |
| Kindergarten | 854 | 4.2% |
| Elementary School | 4,563 | 22.7% |
| Middle School | 4,391 | 21.8% |
| High School | 4,784 | 23.8% |
| College / Undergraduate | 3,165 | 15.7% |
| Graduate / Professional | 683 | 3.4% |
| Total | 20,136 | 100.0% |
School Enrollment by Age by Funding Source in Lakeville
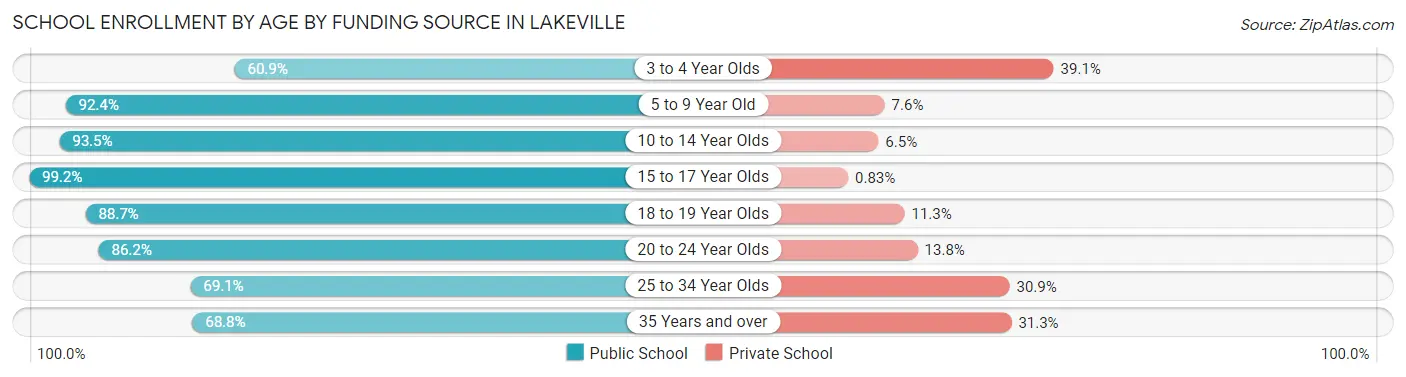
Out of a total of 20,136 students who are enrolled in schools in Lakeville, 2,195 (10.9%) attend a private institution, while the remaining 17,941 (89.1%) are enrolled in public schools. The age group of 3 to 4 year olds has the highest likelihood of being enrolled in private schools, with 490 (39.1% in the age bracket) enrolled. Conversely, the age group of 15 to 17 year olds has the lowest likelihood of being enrolled in a private school, with 2,870 (99.2% in the age bracket) attending a public institution.
| Age Bracket | Public School | Private School |
| 3 to 4 Year Olds | 763 (60.9%) | 490 (39.1%) |
| 5 to 9 Year Old | 4,997 (92.4%) | 413 (7.6%) |
| 10 to 14 Year Olds | 5,233 (93.5%) | 362 (6.5%) |
| 15 to 17 Year Olds | 2,870 (99.2%) | 24 (0.8%) |
| 18 to 19 Year Olds | 1,391 (88.7%) | 178 (11.3%) |
| 20 to 24 Year Olds | 1,671 (86.2%) | 267 (13.8%) |
| 25 to 34 Year Olds | 490 (69.1%) | 219 (30.9%) |
| 35 Years and over | 528 (68.8%) | 240 (31.2%) |
| Total | 17,941 (89.1%) | 2,195 (10.9%) |
Educational Attainment by Field of Study in Lakeville
Business (6,814 | 27.6%), education (2,995 | 12.1%), science & technology (2,391 | 9.7%), engineering (1,731 | 7.0%), and arts & humanities (1,641 | 6.7%) are the most common fields of study among 24,660 individuals in Lakeville who have obtained a bachelor's degree or higher.
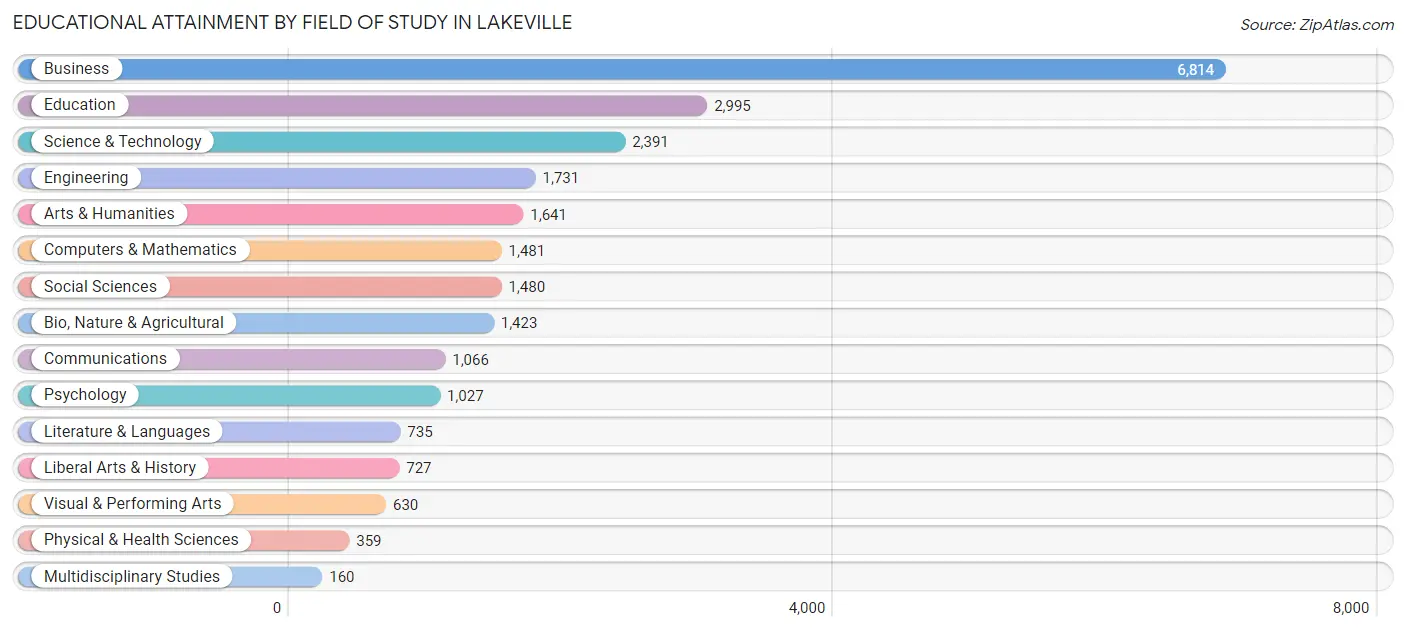
| Field of Study | # Graduates | % Graduates |
| Computers & Mathematics | 1,481 | 6.0% |
| Bio, Nature & Agricultural | 1,423 | 5.8% |
| Physical & Health Sciences | 359 | 1.5% |
| Psychology | 1,027 | 4.2% |
| Social Sciences | 1,480 | 6.0% |
| Engineering | 1,731 | 7.0% |
| Multidisciplinary Studies | 160 | 0.6% |
| Science & Technology | 2,391 | 9.7% |
| Business | 6,814 | 27.6% |
| Education | 2,995 | 12.1% |
| Literature & Languages | 735 | 3.0% |
| Liberal Arts & History | 727 | 2.9% |
| Visual & Performing Arts | 630 | 2.5% |
| Communications | 1,066 | 4.3% |
| Arts & Humanities | 1,641 | 6.7% |
| Total | 24,660 | 100.0% |
Transportation & Commute in Lakeville
Vehicle Availability by Sex in Lakeville
The most prevalent vehicle ownership categories in Lakeville are males with 2 vehicles (9,290, accounting for 46.2%) and females with 2 vehicles (8,093, making up 51.6%).
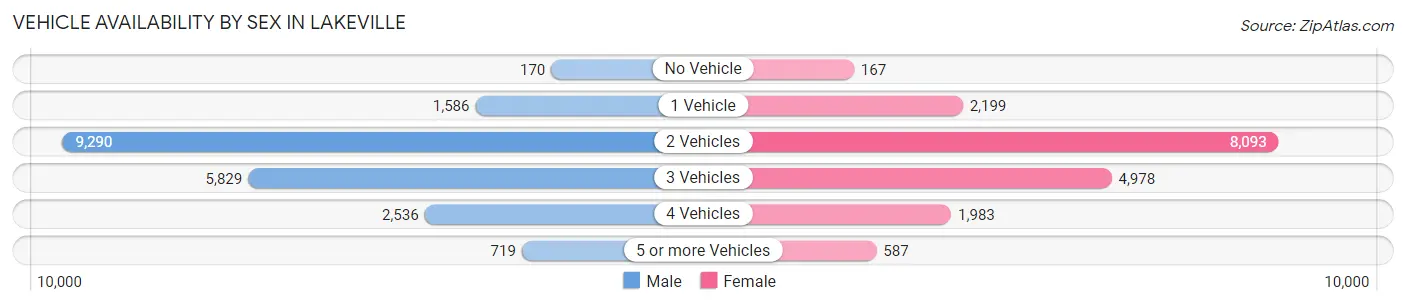
| Vehicles Available | Male | Female |
| No Vehicle | 170 (0.8%) | 167 (0.9%) |
| 1 Vehicle | 1,586 (7.9%) | 2,199 (12.2%) |
| 2 Vehicles | 9,290 (46.2%) | 8,093 (44.9%) |
| 3 Vehicles | 5,829 (29.0%) | 4,978 (27.6%) |
| 4 Vehicles | 2,536 (12.6%) | 1,983 (11.0%) |
| 5 or more Vehicles | 719 (3.6%) | 587 (3.3%) |
| Total | 20,130 (100.0%) | 18,007 (100.0%) |
Commute Time in Lakeville
The most frequently occuring commute durations in Lakeville are 30 to 34 minutes (5,295 commuters, 16.8%), 15 to 19 minutes (4,343 commuters, 13.8%), and 20 to 24 minutes (4,071 commuters, 12.9%).
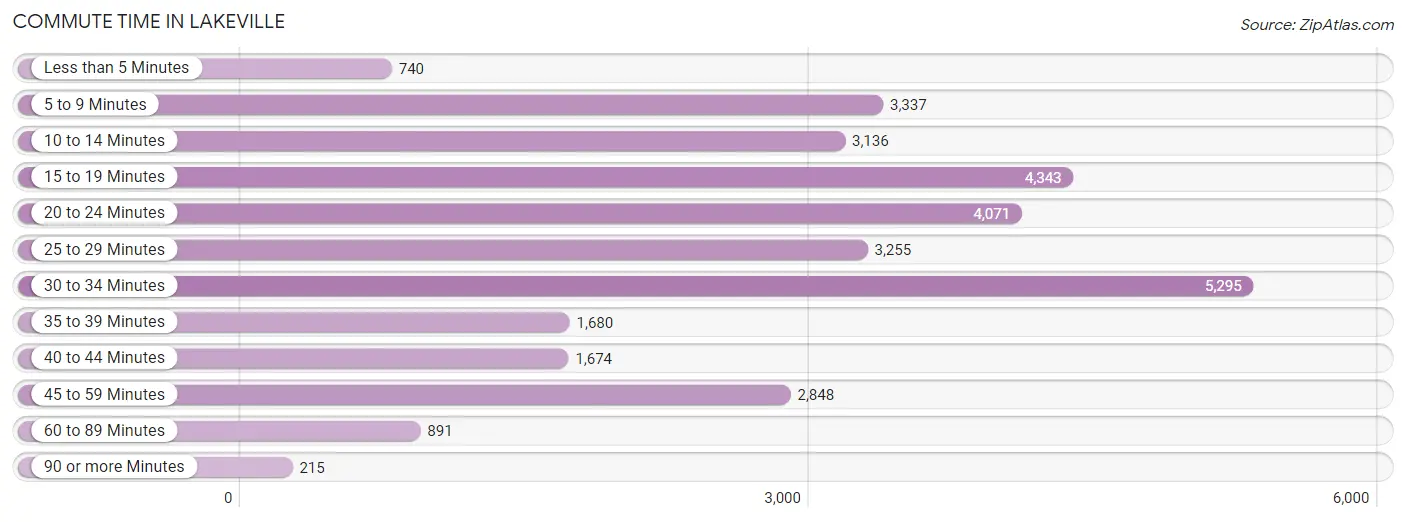
| Commute Time | # Commuters | % Commuters |
| Less than 5 Minutes | 740 | 2.4% |
| 5 to 9 Minutes | 3,337 | 10.6% |
| 10 to 14 Minutes | 3,136 | 10.0% |
| 15 to 19 Minutes | 4,343 | 13.8% |
| 20 to 24 Minutes | 4,071 | 12.9% |
| 25 to 29 Minutes | 3,255 | 10.3% |
| 30 to 34 Minutes | 5,295 | 16.8% |
| 35 to 39 Minutes | 1,680 | 5.3% |
| 40 to 44 Minutes | 1,674 | 5.3% |
| 45 to 59 Minutes | 2,848 | 9.0% |
| 60 to 89 Minutes | 891 | 2.8% |
| 90 or more Minutes | 215 | 0.7% |
Commute Time by Sex in Lakeville
The most common commute times in Lakeville are 30 to 34 minutes (3,002 commuters, 17.8%) for males and 30 to 34 minutes (2,293 commuters, 15.6%) for females.
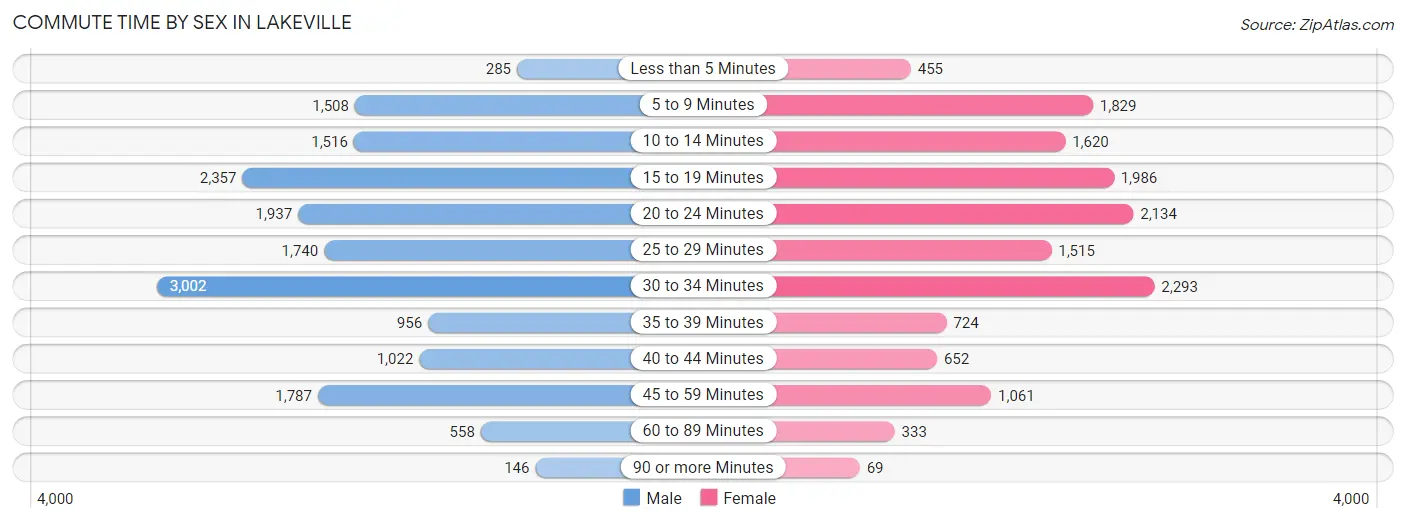
| Commute Time | Male | Female |
| Less than 5 Minutes | 285 (1.7%) | 455 (3.1%) |
| 5 to 9 Minutes | 1,508 (9.0%) | 1,829 (12.5%) |
| 10 to 14 Minutes | 1,516 (9.0%) | 1,620 (11.0%) |
| 15 to 19 Minutes | 2,357 (14.0%) | 1,986 (13.5%) |
| 20 to 24 Minutes | 1,937 (11.5%) | 2,134 (14.5%) |
| 25 to 29 Minutes | 1,740 (10.3%) | 1,515 (10.3%) |
| 30 to 34 Minutes | 3,002 (17.8%) | 2,293 (15.6%) |
| 35 to 39 Minutes | 956 (5.7%) | 724 (4.9%) |
| 40 to 44 Minutes | 1,022 (6.1%) | 652 (4.4%) |
| 45 to 59 Minutes | 1,787 (10.6%) | 1,061 (7.2%) |
| 60 to 89 Minutes | 558 (3.3%) | 333 (2.3%) |
| 90 or more Minutes | 146 (0.9%) | 69 (0.5%) |
Time of Departure to Work by Sex in Lakeville
The most frequent times of departure to work in Lakeville are 7:00 AM to 7:29 AM (3,064, 18.2%) for males and 7:00 AM to 7:29 AM (2,266, 15.4%) for females.
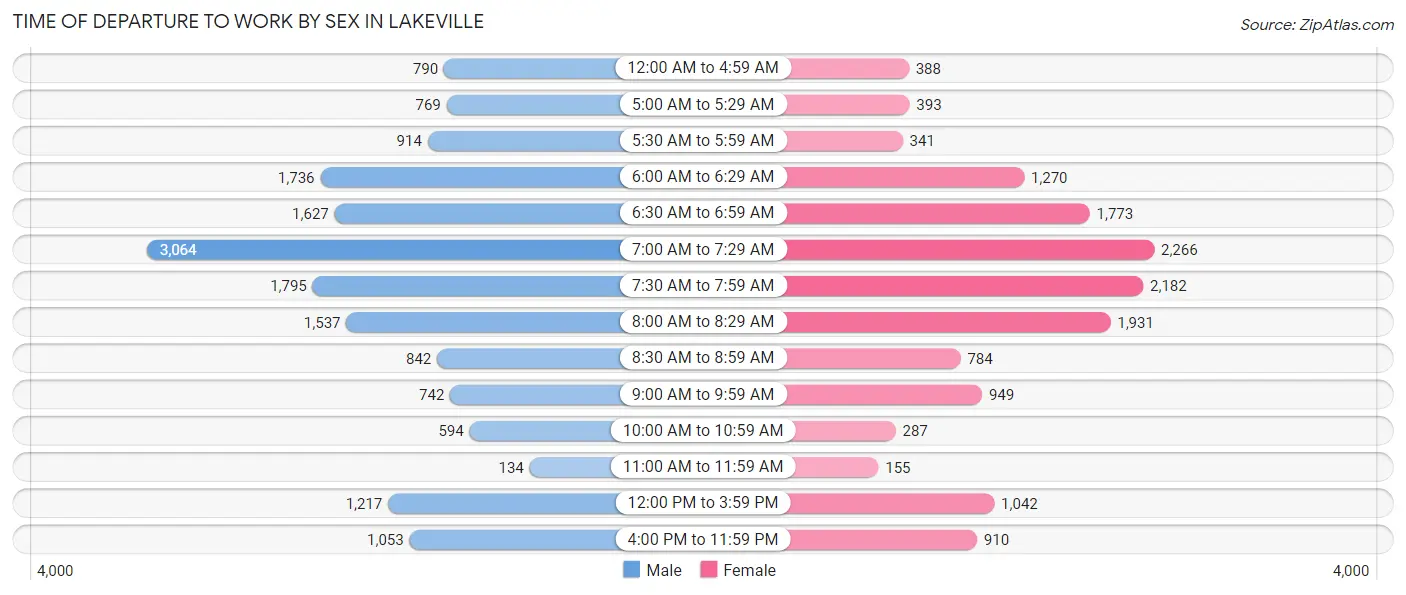
| Time of Departure | Male | Female |
| 12:00 AM to 4:59 AM | 790 (4.7%) | 388 (2.6%) |
| 5:00 AM to 5:29 AM | 769 (4.6%) | 393 (2.7%) |
| 5:30 AM to 5:59 AM | 914 (5.4%) | 341 (2.3%) |
| 6:00 AM to 6:29 AM | 1,736 (10.3%) | 1,270 (8.7%) |
| 6:30 AM to 6:59 AM | 1,627 (9.7%) | 1,773 (12.1%) |
| 7:00 AM to 7:29 AM | 3,064 (18.2%) | 2,266 (15.4%) |
| 7:30 AM to 7:59 AM | 1,795 (10.7%) | 2,182 (14.9%) |
| 8:00 AM to 8:29 AM | 1,537 (9.1%) | 1,931 (13.2%) |
| 8:30 AM to 8:59 AM | 842 (5.0%) | 784 (5.3%) |
| 9:00 AM to 9:59 AM | 742 (4.4%) | 949 (6.5%) |
| 10:00 AM to 10:59 AM | 594 (3.5%) | 287 (2.0%) |
| 11:00 AM to 11:59 AM | 134 (0.8%) | 155 (1.1%) |
| 12:00 PM to 3:59 PM | 1,217 (7.2%) | 1,042 (7.1%) |
| 4:00 PM to 11:59 PM | 1,053 (6.3%) | 910 (6.2%) |
| Total | 16,814 (100.0%) | 14,671 (100.0%) |
Housing Occupancy in Lakeville
Occupancy by Ownership in Lakeville
Of the total 24,252 dwellings in Lakeville, owner-occupied units account for 21,186 (87.4%), while renter-occupied units make up 3,066 (12.6%).
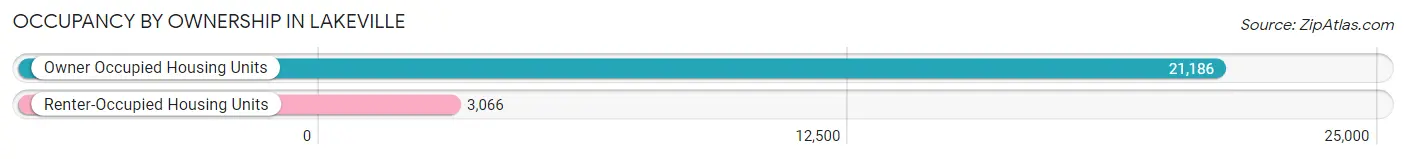
| Occupancy | # Housing Units | % Housing Units |
| Owner Occupied Housing Units | 21,186 | 87.4% |
| Renter-Occupied Housing Units | 3,066 | 12.6% |
| Total Occupied Housing Units | 24,252 | 100.0% |
Occupancy by Household Size in Lakeville
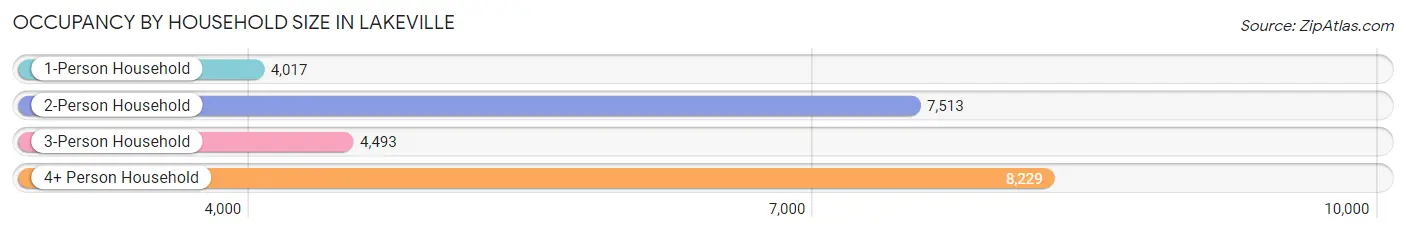
| Household Size | # Housing Units | % Housing Units |
| 1-Person Household | 4,017 | 16.6% |
| 2-Person Household | 7,513 | 31.0% |
| 3-Person Household | 4,493 | 18.5% |
| 4+ Person Household | 8,229 | 33.9% |
| Total Housing Units | 24,252 | 100.0% |
Occupancy by Ownership by Household Size in Lakeville
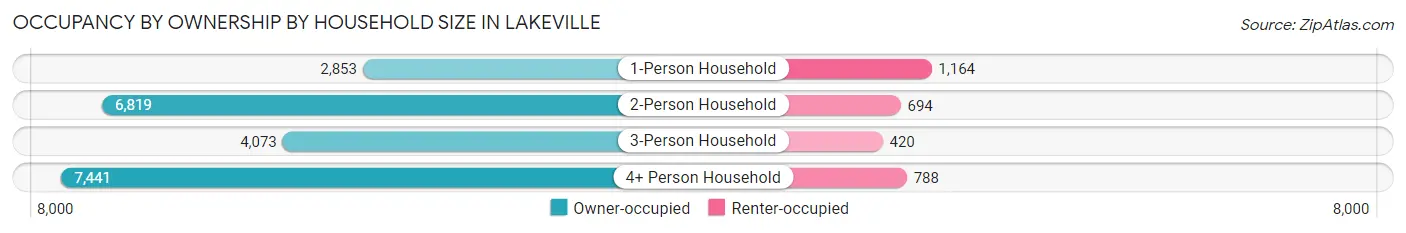
| Household Size | Owner-occupied | Renter-occupied |
| 1-Person Household | 2,853 (71.0%) | 1,164 (29.0%) |
| 2-Person Household | 6,819 (90.8%) | 694 (9.2%) |
| 3-Person Household | 4,073 (90.6%) | 420 (9.3%) |
| 4+ Person Household | 7,441 (90.4%) | 788 (9.6%) |
| Total Housing Units | 21,186 (87.4%) | 3,066 (12.6%) |
Occupancy by Educational Attainment in Lakeville
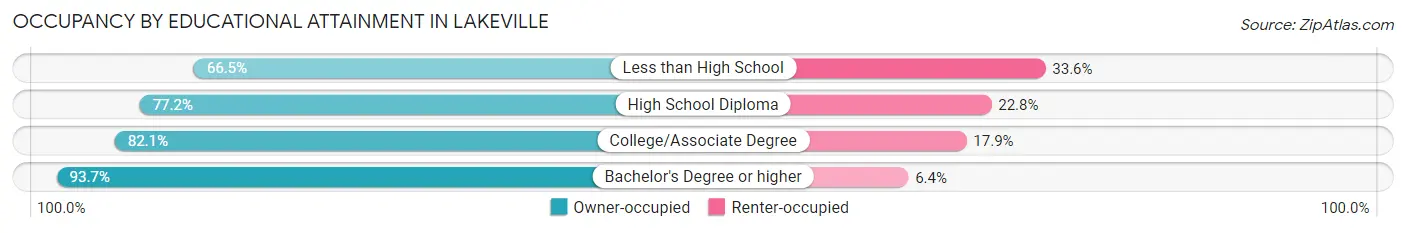
| Household Size | Owner-occupied | Renter-occupied |
| Less than High School | 301 (66.4%) | 152 (33.6%) |
| High School Diploma | 2,502 (77.2%) | 740 (22.8%) |
| College/Associate Degree | 6,177 (82.1%) | 1,346 (17.9%) |
| Bachelor's Degree or higher | 12,206 (93.6%) | 828 (6.4%) |
Occupancy by Age of Householder in Lakeville
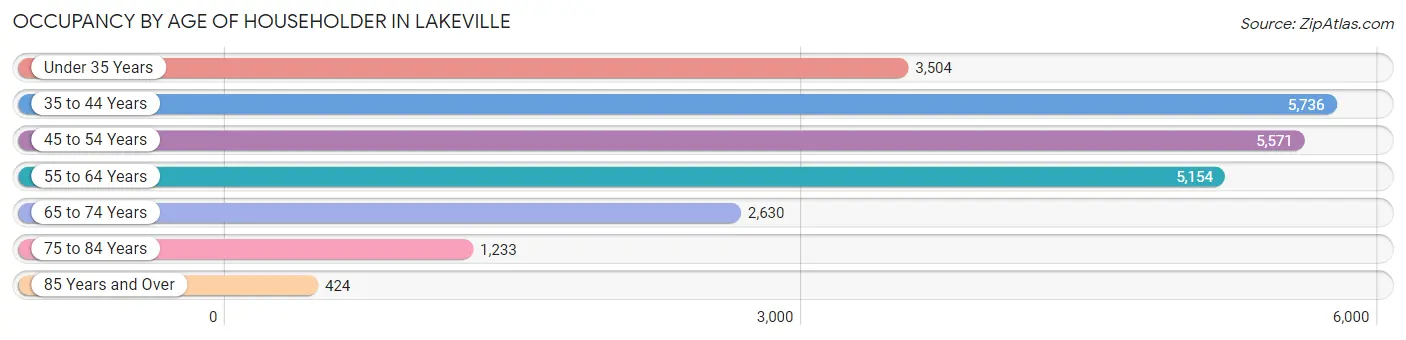
| Age Bracket | # Households | % Households |
| Under 35 Years | 3,504 | 14.4% |
| 35 to 44 Years | 5,736 | 23.6% |
| 45 to 54 Years | 5,571 | 23.0% |
| 55 to 64 Years | 5,154 | 21.2% |
| 65 to 74 Years | 2,630 | 10.8% |
| 75 to 84 Years | 1,233 | 5.1% |
| 85 Years and Over | 424 | 1.8% |
| Total | 24,252 | 100.0% |
Housing Finances in Lakeville
Median Income by Occupancy in Lakeville
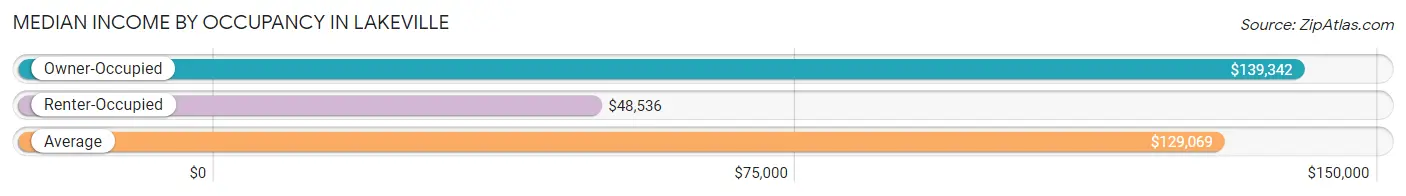
| Occupancy Type | # Households | Median Income |
| Owner-Occupied | 21,186 (87.4%) | $139,342 |
| Renter-Occupied | 3,066 (12.6%) | $48,536 |
| Average | 24,252 (100.0%) | $129,069 |
Occupancy by Householder Income Bracket in Lakeville
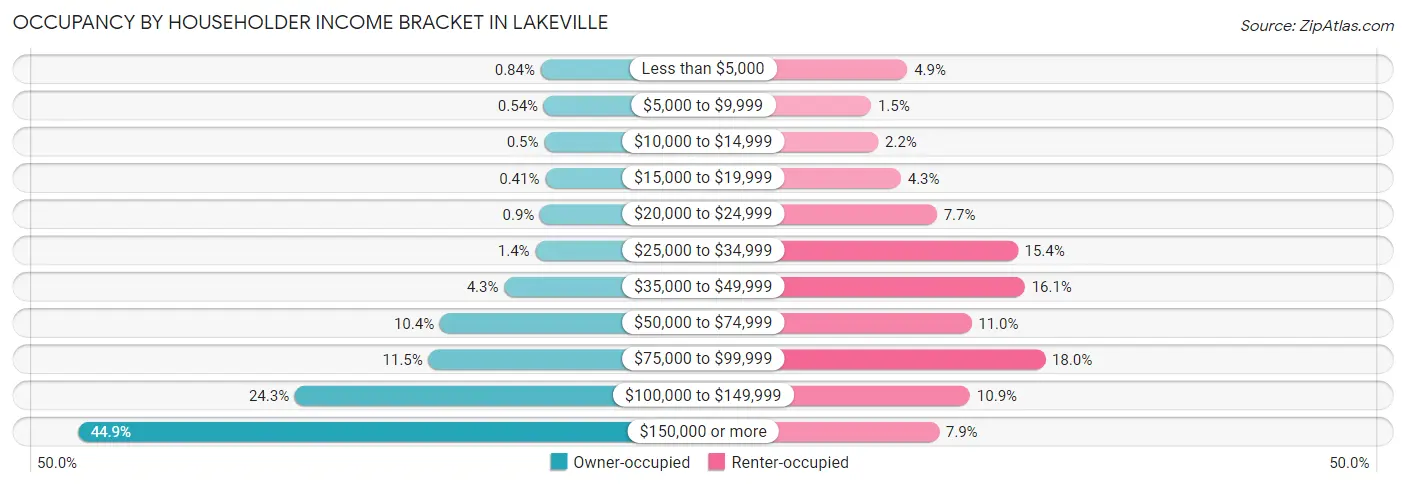
| Income Bracket | Owner-occupied | Renter-occupied |
| Less than $5,000 | 179 (0.8%) | 151 (4.9%) |
| $5,000 to $9,999 | 115 (0.5%) | 45 (1.5%) |
| $10,000 to $14,999 | 105 (0.5%) | 66 (2.1%) |
| $15,000 to $19,999 | 87 (0.4%) | 132 (4.3%) |
| $20,000 to $24,999 | 191 (0.9%) | 237 (7.7%) |
| $25,000 to $34,999 | 285 (1.3%) | 473 (15.4%) |
| $35,000 to $49,999 | 913 (4.3%) | 494 (16.1%) |
| $50,000 to $74,999 | 2,211 (10.4%) | 338 (11.0%) |
| $75,000 to $99,999 | 2,440 (11.5%) | 553 (18.0%) |
| $100,000 to $149,999 | 5,138 (24.2%) | 334 (10.9%) |
| $150,000 or more | 9,522 (44.9%) | 243 (7.9%) |
| Total | 21,186 (100.0%) | 3,066 (100.0%) |
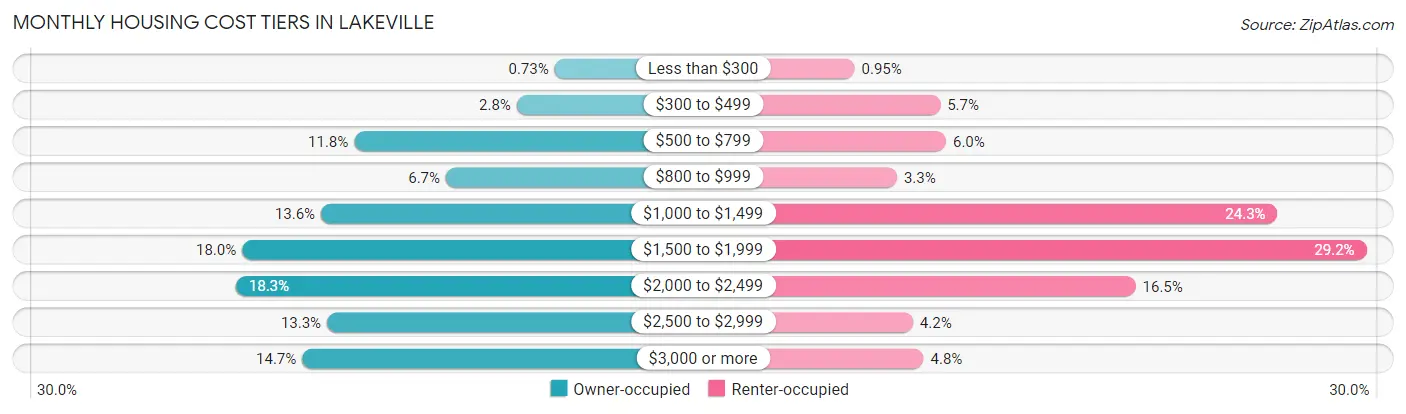
Monthly Housing Cost Tiers in Lakeville
| Monthly Cost | Owner-occupied | Renter-occupied |
| Less than $300 | 154 (0.7%) | 29 (0.9%) |
| $300 to $499 | 597 (2.8%) | 174 (5.7%) |
| $500 to $799 | 2,501 (11.8%) | 184 (6.0%) |
| $800 to $999 | 1,426 (6.7%) | 101 (3.3%) |
| $1,000 to $1,499 | 2,887 (13.6%) | 745 (24.3%) |
| $1,500 to $1,999 | 3,812 (18.0%) | 896 (29.2%) |
| $2,000 to $2,499 | 3,883 (18.3%) | 505 (16.5%) |
| $2,500 to $2,999 | 2,818 (13.3%) | 128 (4.2%) |
| $3,000 or more | 3,108 (14.7%) | 146 (4.8%) |
| Total | 21,186 (100.0%) | 3,066 (100.0%) |
Physical Housing Characteristics in Lakeville
Housing Structures in Lakeville
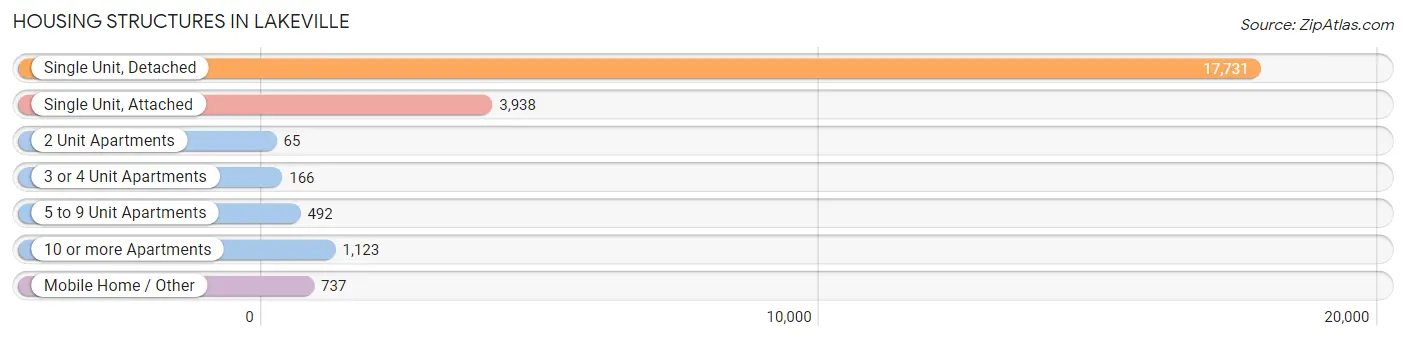
| Structure Type | # Housing Units | % Housing Units |
| Single Unit, Detached | 17,731 | 73.1% |
| Single Unit, Attached | 3,938 | 16.2% |
| 2 Unit Apartments | 65 | 0.3% |
| 3 or 4 Unit Apartments | 166 | 0.7% |
| 5 to 9 Unit Apartments | 492 | 2.0% |
| 10 or more Apartments | 1,123 | 4.6% |
| Mobile Home / Other | 737 | 3.0% |
| Total | 24,252 | 100.0% |
Housing Structures by Occupancy in Lakeville
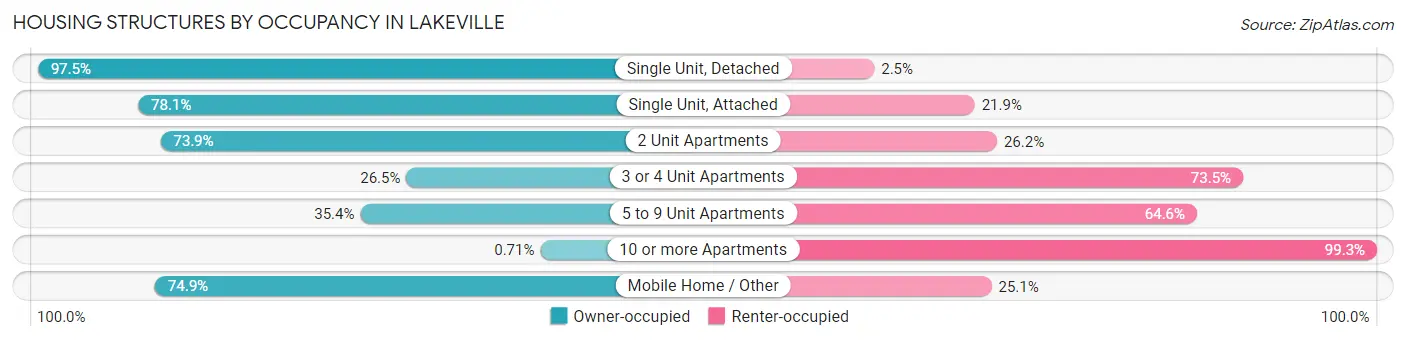
| Structure Type | Owner-occupied | Renter-occupied |
| Single Unit, Detached | 17,283 (97.5%) | 448 (2.5%) |
| Single Unit, Attached | 3,077 (78.1%) | 861 (21.9%) |
| 2 Unit Apartments | 48 (73.9%) | 17 (26.2%) |
| 3 or 4 Unit Apartments | 44 (26.5%) | 122 (73.5%) |
| 5 to 9 Unit Apartments | 174 (35.4%) | 318 (64.6%) |
| 10 or more Apartments | 8 (0.7%) | 1,115 (99.3%) |
| Mobile Home / Other | 552 (74.9%) | 185 (25.1%) |
| Total | 21,186 (87.4%) | 3,066 (12.6%) |
Housing Structures by Number of Rooms in Lakeville
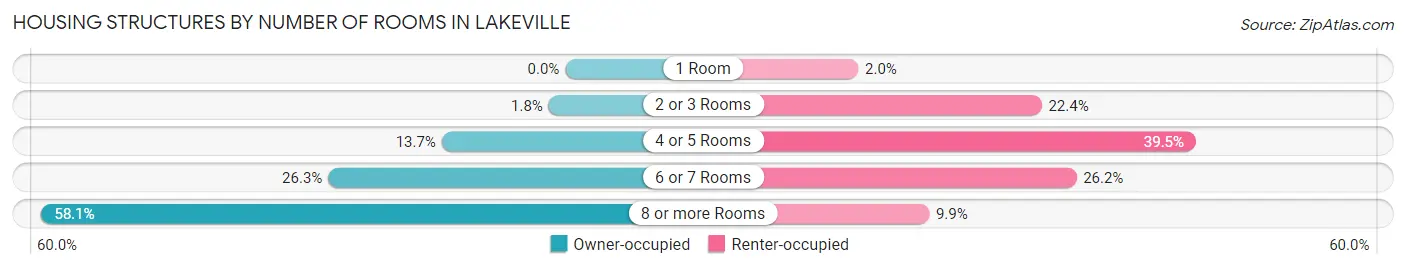
| Number of Rooms | Owner-occupied | Renter-occupied |
| 1 Room | 0 (0.0%) | 62 (2.0%) |
| 2 or 3 Rooms | 389 (1.8%) | 686 (22.4%) |
| 4 or 5 Rooms | 2,905 (13.7%) | 1,211 (39.5%) |
| 6 or 7 Rooms | 5,575 (26.3%) | 804 (26.2%) |
| 8 or more Rooms | 12,317 (58.1%) | 303 (9.9%) |
| Total | 21,186 (100.0%) | 3,066 (100.0%) |
Housing Structure by Heating Type in Lakeville
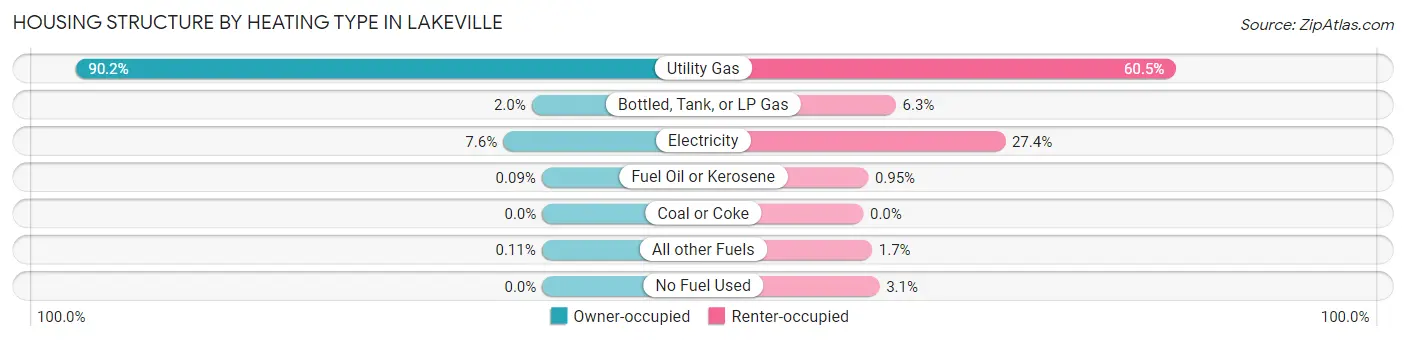
| Heating Type | Owner-occupied | Renter-occupied |
| Utility Gas | 19,109 (90.2%) | 1,855 (60.5%) |
| Bottled, Tank, or LP Gas | 433 (2.0%) | 193 (6.3%) |
| Electricity | 1,602 (7.6%) | 841 (27.4%) |
| Fuel Oil or Kerosene | 19 (0.1%) | 29 (0.9%) |
| Coal or Coke | 0 (0.0%) | 0 (0.0%) |
| All other Fuels | 23 (0.1%) | 52 (1.7%) |
| No Fuel Used | 0 (0.0%) | 96 (3.1%) |
| Total | 21,186 (100.0%) | 3,066 (100.0%) |
Household Vehicle Usage in Lakeville
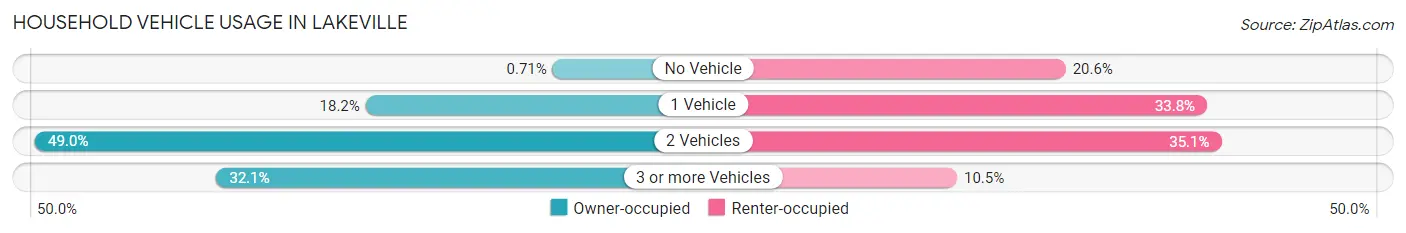
| Vehicles per Household | Owner-occupied | Renter-occupied |
| No Vehicle | 150 (0.7%) | 632 (20.6%) |
| 1 Vehicle | 3,850 (18.2%) | 1,036 (33.8%) |
| 2 Vehicles | 10,385 (49.0%) | 1,077 (35.1%) |
| 3 or more Vehicles | 6,801 (32.1%) | 321 (10.5%) |
| Total | 21,186 (100.0%) | 3,066 (100.0%) |
Real Estate & Mortgages in Lakeville
Real Estate and Mortgage Overview in Lakeville
| Characteristic | Without Mortgage | With Mortgage |
| Housing Units | 5,146 | 16,040 |
| Median Property Value | $380,600 | $401,200 |
| Median Household Income | $93,913 | $7,940 |
| Monthly Housing Costs | $746 | $3,108 |
| Real Estate Taxes | $4,029 | $180 |
Property Value by Mortgage Status in Lakeville
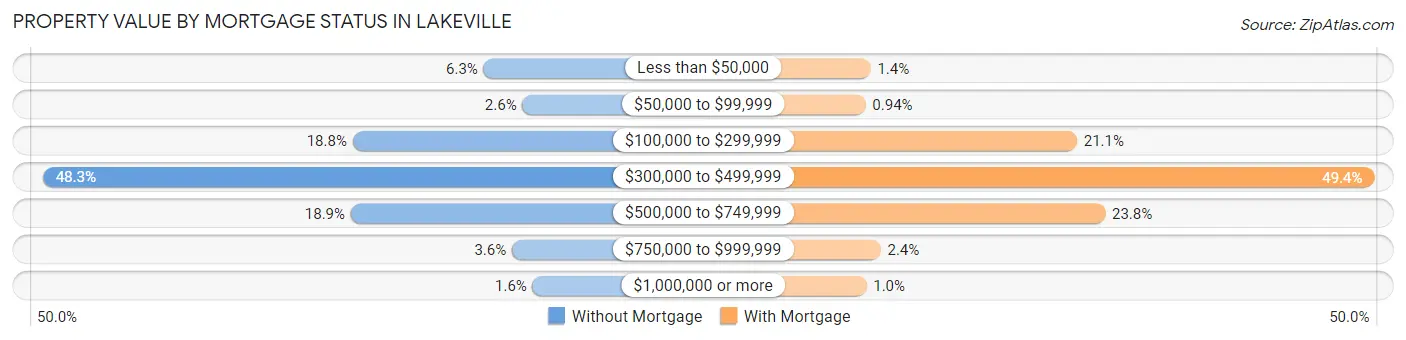
| Property Value | Without Mortgage | With Mortgage |
| Less than $50,000 | 323 (6.3%) | 228 (1.4%) |
| $50,000 to $99,999 | 133 (2.6%) | 151 (0.9%) |
| $100,000 to $299,999 | 965 (18.8%) | 3,379 (21.1%) |
| $300,000 to $499,999 | 2,484 (48.3%) | 7,925 (49.4%) |
| $500,000 to $749,999 | 974 (18.9%) | 3,811 (23.8%) |
| $750,000 to $999,999 | 184 (3.6%) | 382 (2.4%) |
| $1,000,000 or more | 83 (1.6%) | 164 (1.0%) |
| Total | 5,146 (100.0%) | 16,040 (100.0%) |
Household Income by Mortgage Status in Lakeville
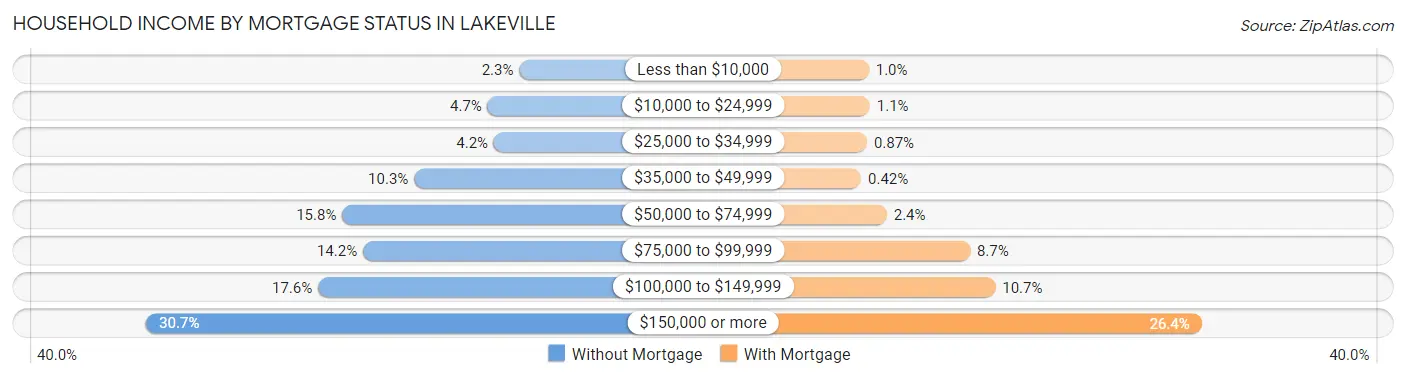
| Household Income | Without Mortgage | With Mortgage |
| Less than $10,000 | 119 (2.3%) | 162 (1.0%) |
| $10,000 to $24,999 | 243 (4.7%) | 175 (1.1%) |
| $25,000 to $34,999 | 218 (4.2%) | 140 (0.9%) |
| $35,000 to $49,999 | 531 (10.3%) | 67 (0.4%) |
| $50,000 to $74,999 | 813 (15.8%) | 382 (2.4%) |
| $75,000 to $99,999 | 732 (14.2%) | 1,398 (8.7%) |
| $100,000 to $149,999 | 908 (17.6%) | 1,708 (10.6%) |
| $150,000 or more | 1,582 (30.7%) | 4,230 (26.4%) |
| Total | 5,146 (100.0%) | 16,040 (100.0%) |
Property Value to Household Income Ratio in Lakeville
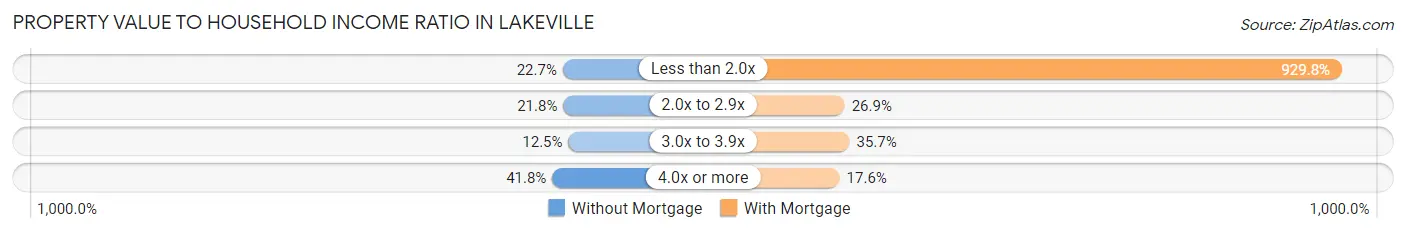
| Value-to-Income Ratio | Without Mortgage | With Mortgage |
| Less than 2.0x | 1,168 (22.7%) | 149,138 (929.8%) |
| 2.0x to 2.9x | 1,122 (21.8%) | 4,318 (26.9%) |
| 3.0x to 3.9x | 644 (12.5%) | 5,726 (35.7%) |
| 4.0x or more | 2,153 (41.8%) | 2,828 (17.6%) |
| Total | 5,146 (100.0%) | 16,040 (100.0%) |
Real Estate Taxes by Mortgage Status in Lakeville

| Property Taxes | Without Mortgage | With Mortgage |
| Less than $800 | 392 (7.6%) | 72 (0.4%) |
| $800 to $1,499 | 77 (1.5%) | 352 (2.2%) |
| $800 to $1,499 | 4,537 (88.2%) | 776 (4.8%) |
| Total | 5,146 (100.0%) | 16,040 (100.0%) |
Health & Disability in Lakeville
Health Insurance Coverage by Age in Lakeville
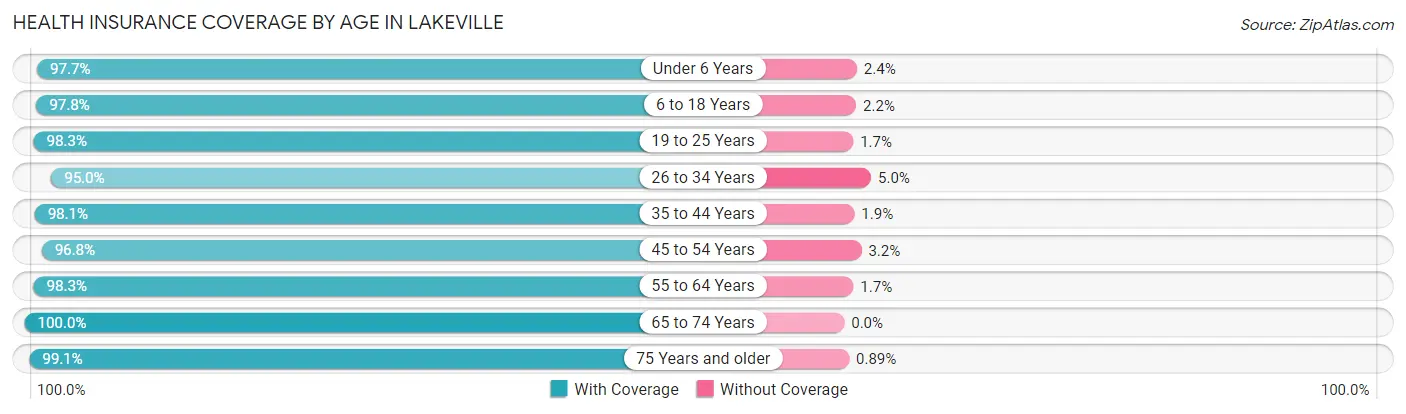
| Age Bracket | With Coverage | Without Coverage |
| Under 6 Years | 5,891 (97.7%) | 142 (2.4%) |
| 6 to 18 Years | 14,388 (97.8%) | 325 (2.2%) |
| 19 to 25 Years | 4,997 (98.3%) | 85 (1.7%) |
| 26 to 34 Years | 7,180 (95.0%) | 377 (5.0%) |
| 35 to 44 Years | 10,460 (98.1%) | 201 (1.9%) |
| 45 to 54 Years | 10,029 (96.8%) | 332 (3.2%) |
| 55 to 64 Years | 8,918 (98.3%) | 154 (1.7%) |
| 65 to 74 Years | 4,205 (100.0%) | 0 (0.0%) |
| 75 Years and older | 2,682 (99.1%) | 24 (0.9%) |
| Total | 68,750 (97.7%) | 1,640 (2.3%) |
Health Insurance Coverage by Citizenship Status in Lakeville

| Citizenship Status | With Coverage | Without Coverage |
| Native Born | 5,891 (97.7%) | 142 (2.4%) |
| Foreign Born, Citizen | 14,388 (97.8%) | 325 (2.2%) |
| Foreign Born, not a Citizen | 4,997 (98.3%) | 85 (1.7%) |
Health Insurance Coverage by Household Income in Lakeville
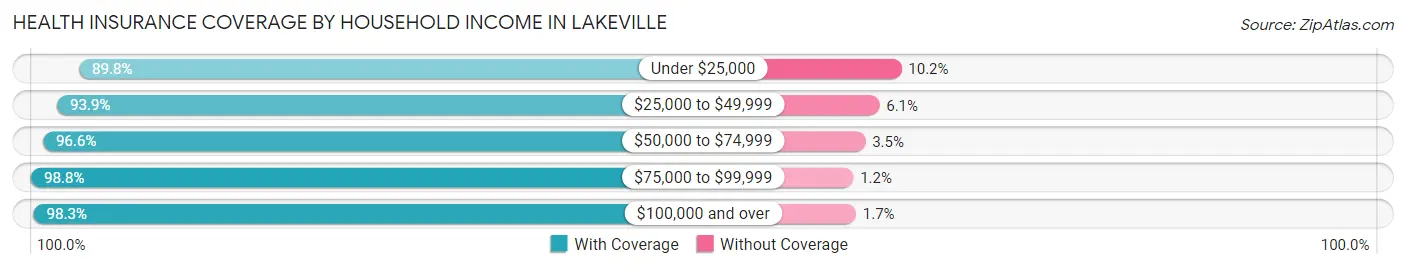
| Household Income | With Coverage | Without Coverage |
| Under $25,000 | 1,915 (89.8%) | 218 (10.2%) |
| $25,000 to $49,999 | 4,350 (93.9%) | 282 (6.1%) |
| $50,000 to $74,999 | 5,255 (96.6%) | 188 (3.5%) |
| $75,000 to $99,999 | 7,192 (98.8%) | 88 (1.2%) |
| $100,000 and over | 49,996 (98.3%) | 864 (1.7%) |
Public vs Private Health Insurance Coverage by Age in Lakeville
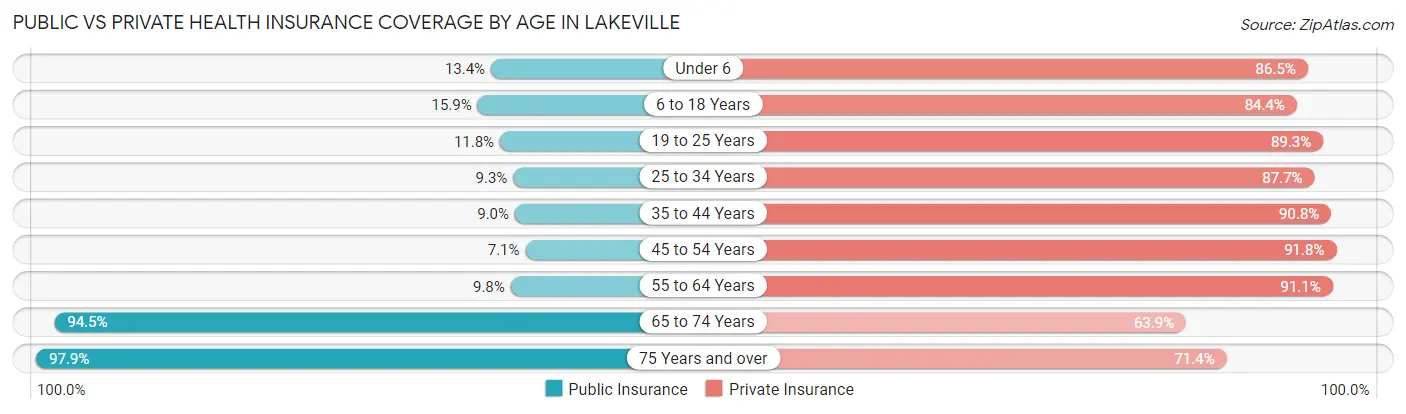
| Age Bracket | Public Insurance | Private Insurance |
| Under 6 | 811 (13.4%) | 5,216 (86.5%) |
| 6 to 18 Years | 2,343 (15.9%) | 12,422 (84.4%) |
| 19 to 25 Years | 598 (11.8%) | 4,540 (89.3%) |
| 25 to 34 Years | 704 (9.3%) | 6,629 (87.7%) |
| 35 to 44 Years | 960 (9.0%) | 9,683 (90.8%) |
| 45 to 54 Years | 730 (7.0%) | 9,508 (91.8%) |
| 55 to 64 Years | 888 (9.8%) | 8,264 (91.1%) |
| 65 to 74 Years | 3,973 (94.5%) | 2,686 (63.9%) |
| 75 Years and over | 2,648 (97.9%) | 1,932 (71.4%) |
| Total | 13,655 (19.4%) | 60,880 (86.5%) |
Disability Status by Sex by Age in Lakeville
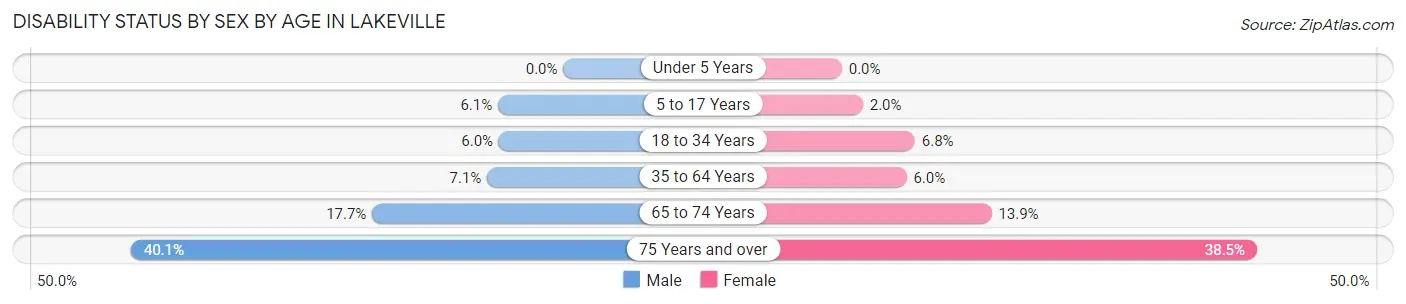
| Age Bracket | Male | Female |
| Under 5 Years | 0 (0.0%) | 0 (0.0%) |
| 5 to 17 Years | 474 (6.1%) | 128 (1.9%) |
| 18 to 34 Years | 436 (6.0%) | 450 (6.8%) |
| 35 to 64 Years | 1,059 (7.1%) | 907 (6.0%) |
| 65 to 74 Years | 354 (17.7%) | 307 (13.9%) |
| 75 Years and over | 464 (40.1%) | 597 (38.5%) |
Disability Class by Sex by Age in Lakeville
Disability Class: Hearing Difficulty
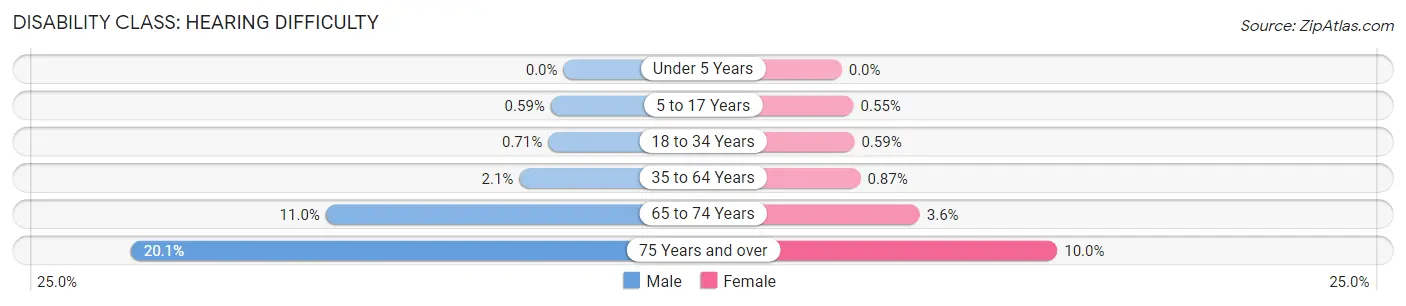
| Age Bracket | Male | Female |
| Under 5 Years | 0 (0.0%) | 0 (0.0%) |
| 5 to 17 Years | 46 (0.6%) | 36 (0.5%) |
| 18 to 34 Years | 52 (0.7%) | 39 (0.6%) |
| 35 to 64 Years | 307 (2.1%) | 132 (0.9%) |
| 65 to 74 Years | 220 (11.0%) | 80 (3.6%) |
| 75 Years and over | 232 (20.1%) | 155 (10.0%) |
Disability Class: Vision Difficulty
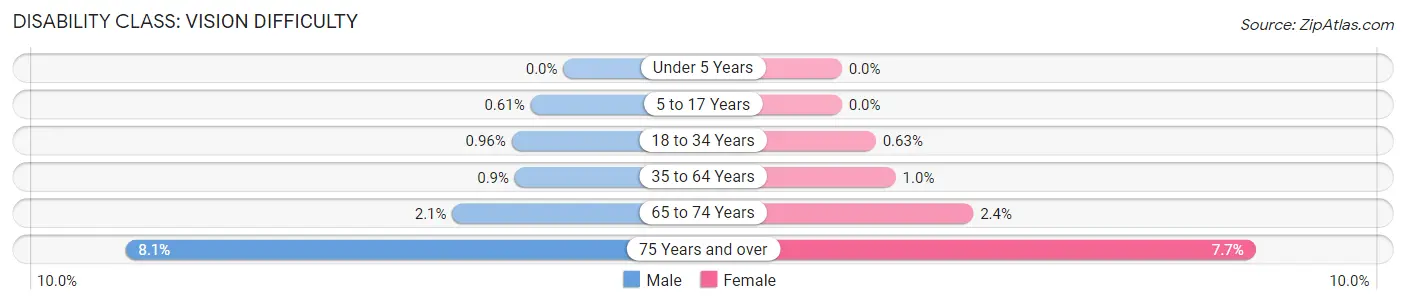
| Age Bracket | Male | Female |
| Under 5 Years | 0 (0.0%) | 0 (0.0%) |
| 5 to 17 Years | 48 (0.6%) | 0 (0.0%) |
| 18 to 34 Years | 70 (1.0%) | 42 (0.6%) |
| 35 to 64 Years | 135 (0.9%) | 151 (1.0%) |
| 65 to 74 Years | 41 (2.1%) | 54 (2.4%) |
| 75 Years and over | 94 (8.1%) | 119 (7.7%) |
Disability Class: Cognitive Difficulty
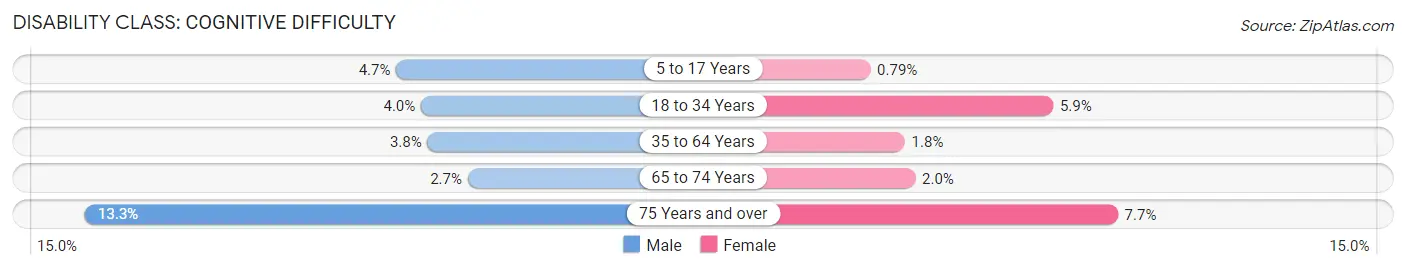
| Age Bracket | Male | Female |
| 5 to 17 Years | 364 (4.6%) | 52 (0.8%) |
| 18 to 34 Years | 289 (4.0%) | 390 (5.9%) |
| 35 to 64 Years | 566 (3.8%) | 265 (1.8%) |
| 65 to 74 Years | 53 (2.7%) | 45 (2.0%) |
| 75 Years and over | 154 (13.3%) | 119 (7.7%) |
Disability Class: Ambulatory Difficulty
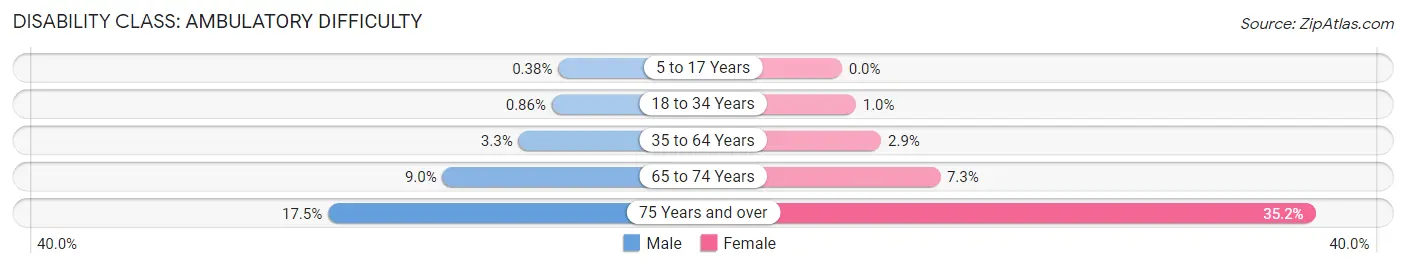
| Age Bracket | Male | Female |
| 5 to 17 Years | 30 (0.4%) | 0 (0.0%) |
| 18 to 34 Years | 63 (0.9%) | 69 (1.0%) |
| 35 to 64 Years | 498 (3.3%) | 442 (2.9%) |
| 65 to 74 Years | 179 (9.0%) | 161 (7.3%) |
| 75 Years and over | 202 (17.5%) | 545 (35.2%) |
Disability Class: Self-Care Difficulty
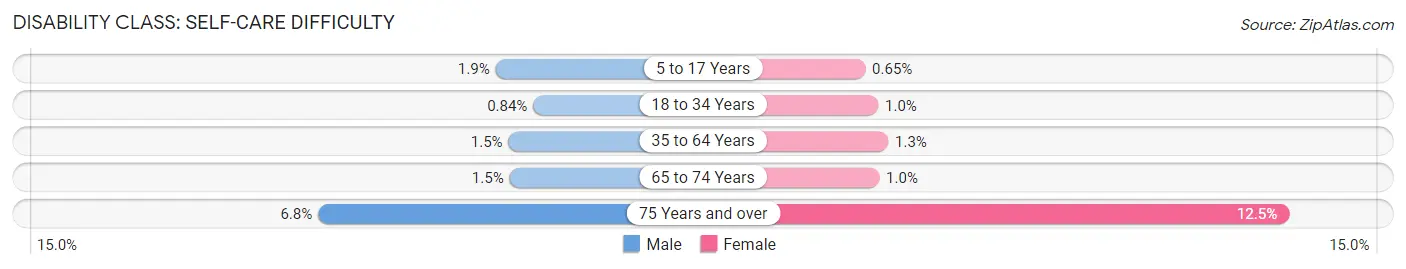
| Age Bracket | Male | Female |
| 5 to 17 Years | 148 (1.9%) | 43 (0.6%) |
| 18 to 34 Years | 61 (0.8%) | 67 (1.0%) |
| 35 to 64 Years | 229 (1.5%) | 195 (1.3%) |
| 65 to 74 Years | 30 (1.5%) | 23 (1.0%) |
| 75 Years and over | 79 (6.8%) | 193 (12.4%) |
Technology Access in Lakeville
Computing Device Access in Lakeville
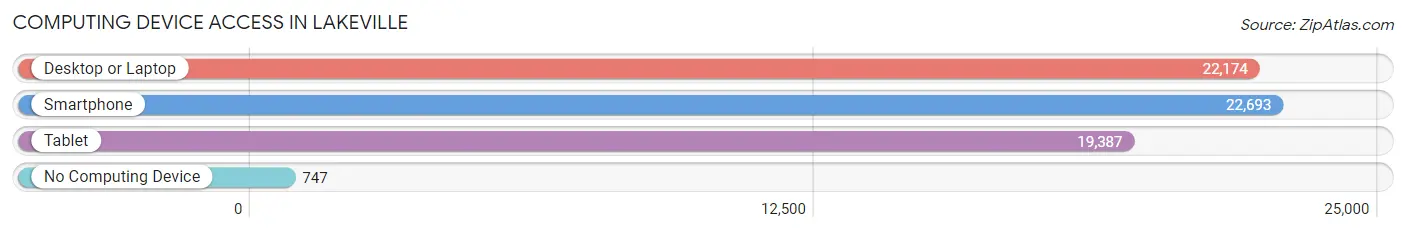
| Device Type | # Households | % Households |
| Desktop or Laptop | 22,174 | 91.4% |
| Smartphone | 22,693 | 93.6% |
| Tablet | 19,387 | 79.9% |
| No Computing Device | 747 | 3.1% |
| Total | 24,252 | 100.0% |
Internet Access in Lakeville
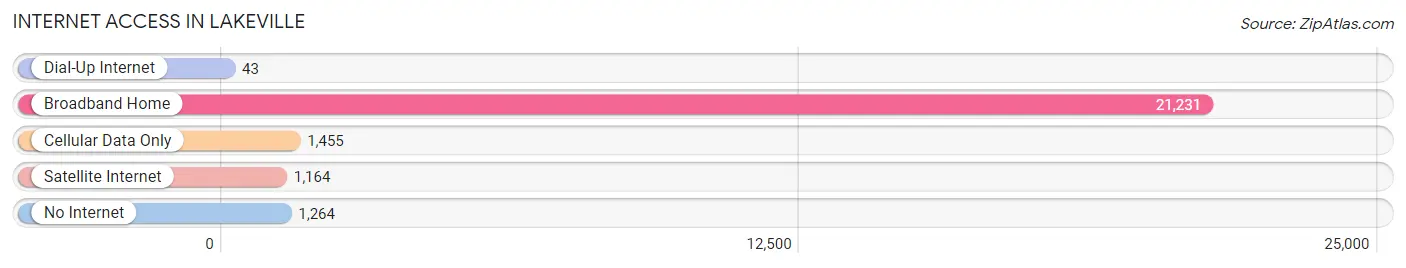
| Internet Type | # Households | % Households |
| Dial-Up Internet | 43 | 0.2% |
| Broadband Home | 21,231 | 87.5% |
| Cellular Data Only | 1,455 | 6.0% |
| Satellite Internet | 1,164 | 4.8% |
| No Internet | 1,264 | 5.2% |
| Total | 24,252 | 100.0% |
Lakeville Summary
Lakeville, Minnesota is a city located in Dakota County, Minnesota, United States. The city is located 20 miles south of Minneapolis and is part of the Twin Cities metropolitan area. As of the 2010 census, the city had a population of 55,954, making it the third largest city in the state.
History
The area that is now Lakeville was first settled in 1853 by a group of settlers from New York. The settlers named the area Lakeville after the many lakes in the area. The city was officially incorporated in 1967.
Geography
Lakeville is located in the southern part of Dakota County, Minnesota. It is bordered by the cities of Apple Valley to the north, Burnsville to the east, Farmington to the south, and Rosemount to the west. The city is located on the Minnesota River and is home to several lakes, including Lake Marion, Lake McCarrons, and Lake Rebecca.
The city has a total area of 33.2 square miles, of which 32.7 square miles is land and 0.5 square miles is water.
Economy
Lakeville is home to several major employers, including the Lakeville Area Public Schools, the Lakeville Area Chamber of Commerce, and the Lakeville Area Convention and Visitors Bureau. The city is also home to several large companies, including 3M, Cargill, and Andersen Windows.
Demographics
As of the 2010 census, the city had a population of 55,954. The racial makeup of the city was 87.2% White, 4.3% African American, 0.4% Native American, 3.7% Asian, 0.1% Pacific Islander, 1.7% from other races, and 2.6% from two or more races. Hispanic or Latino of any race were 4.7% of the population.
The median income for a household in the city was $76,845, and the median income for a family was $90,945. The per capita income for the city was $35,945. About 3.2% of families and 4.7% of the population were below the poverty line, including 5.3% of those under age 18 and 4.2% of those age 65 or over.
Lakeville is served by the Lakeville Area Public Schools, which includes seven elementary schools, two middle schools, and two high schools. The city is also home to several private schools, including St. John the Baptist Catholic School and Lakeville Christian Academy.
Common Questions
What is Per Capita Income in Lakeville?
Per Capita income in Lakeville is $52,634.
What is the Median Family Income in Lakeville?
Median Family Income in Lakeville is $145,344.
What is the Median Household income in Lakeville?
Median Household Income in Lakeville is $129,069.
What is Income or Wage Gap in Lakeville?
Income or Wage Gap in Lakeville is 36.3%.
Women in Lakeville earn 63.7 cents for every dollar earned by a man.
What is Family Income Deficit in Lakeville?
Family Income Deficit in Lakeville is $9,178.
Families that are below poverty line in Lakeville earn $9,178 less on average than the poverty threshold level.
What is Inequality or Gini Index in Lakeville?
Inequality or Gini Index in Lakeville is 0.38.
What is the Total Population of Lakeville?
Total Population of Lakeville is 70,696.
What is the Total Male Population of Lakeville?
Total Male Population of Lakeville is 36,070.
What is the Total Female Population of Lakeville?
Total Female Population of Lakeville is 34,626.
What is the Ratio of Males per 100 Females in Lakeville?
There are 104.17 Males per 100 Females in Lakeville.
What is the Ratio of Females per 100 Males in Lakeville?
There are 96.00 Females per 100 Males in Lakeville.
What is the Median Population Age in Lakeville?
Median Population Age in Lakeville is 36.5 Years.
What is the Average Family Size in Lakeville
Average Family Size in Lakeville is 3.3 People.
What is the Average Household Size in Lakeville
Average Household Size in Lakeville is 2.9 People.
How Large is the Labor Force in Lakeville?
There are 39,817 People in the Labor Forcein in Lakeville.
What is the Percentage of People in the Labor Force in Lakeville?
75.1% of People are in the Labor Force in Lakeville.
What is the Unemployment Rate in Lakeville?
Unemployment Rate in Lakeville is 2.5%.