Inver Grove Heights, MN Map & Demographics
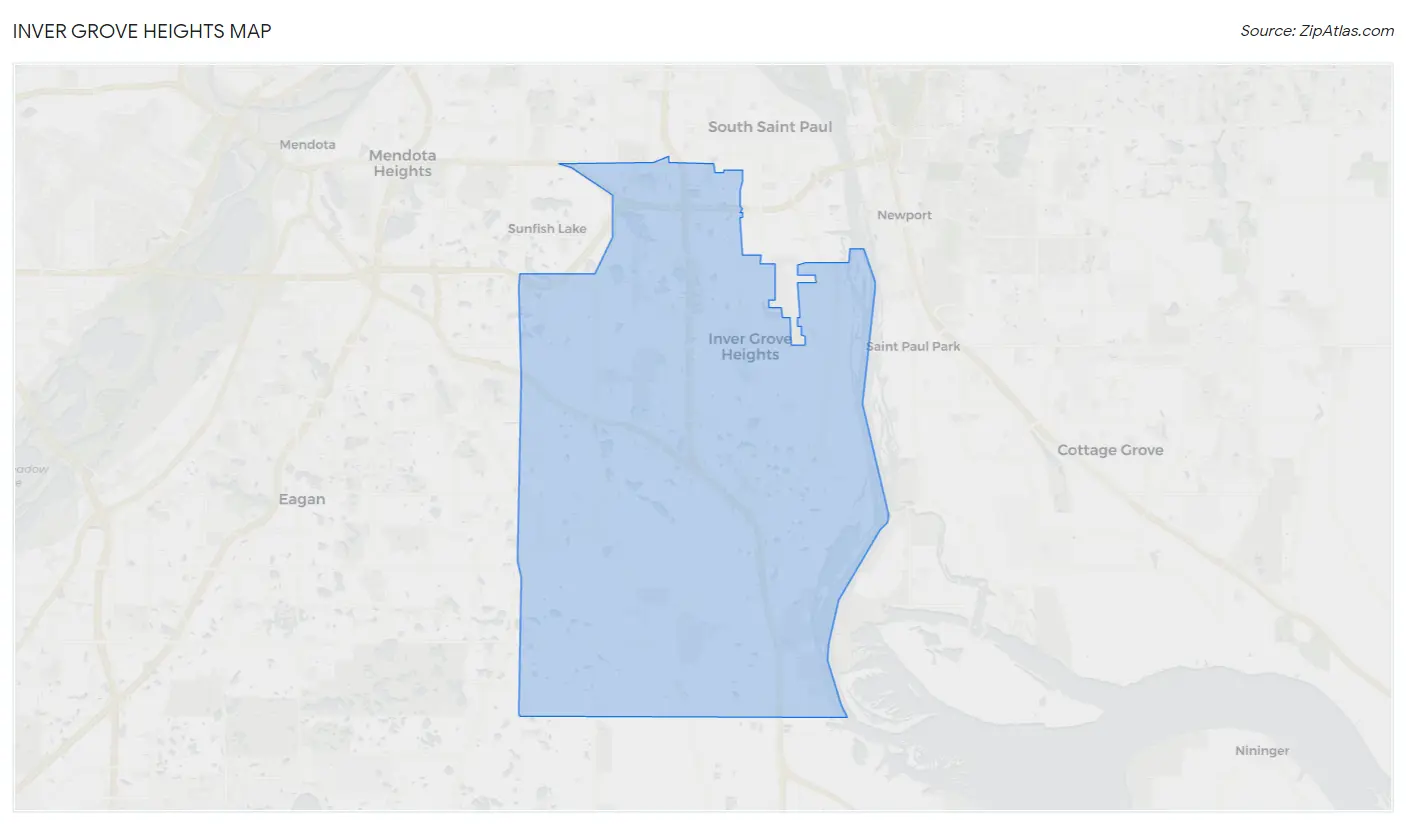
Inver Grove Heights Map
Inver Grove Heights Overview
$51,175
PER CAPITA INCOME
$119,116
AVG FAMILY INCOME
$98,719
AVG HOUSEHOLD INCOME
25.7%
WAGE / INCOME GAP [ % ]
74.3¢/ $1
WAGE / INCOME GAP [ $ ]
0.43
INEQUALITY / GINI INDEX
35,673
TOTAL POPULATION
17,441
MALE POPULATION
18,232
FEMALE POPULATION
95.66
MALES / 100 FEMALES
104.54
FEMALES / 100 MALES
41.4
MEDIAN AGE
2.9
AVG FAMILY SIZE
2.4
AVG HOUSEHOLD SIZE
20,354
LABOR FORCE [ PEOPLE ]
70.3%
PERCENT IN LABOR FORCE
3.2%
UNEMPLOYMENT RATE
Inver Grove Heights Area Codes
Income in Inver Grove Heights
Income Overview in Inver Grove Heights
Per Capita Income in Inver Grove Heights is $51,175, while median incomes of families and households are $119,116 and $98,719 respectively.
| Characteristic | Number | Measure |
| Per Capita Income | 35,673 | $51,175 |
| Median Family Income | 9,884 | $119,116 |
| Mean Family Income | 9,884 | $145,993 |
| Median Household Income | 14,723 | $98,719 |
| Mean Household Income | 14,723 | $122,343 |
| Income Deficit | 9,884 | $0 |
| Wage / Income Gap (%) | 35,673 | 25.67% |
| Wage / Income Gap ($) | 35,673 | 74.33¢ per $1 |
| Gini / Inequality Index | 35,673 | 0.43 |
Earnings by Sex in Inver Grove Heights
Average Earnings in Inver Grove Heights are $55,214, $63,810 for men and $47,430 for women, a difference of 25.7%.
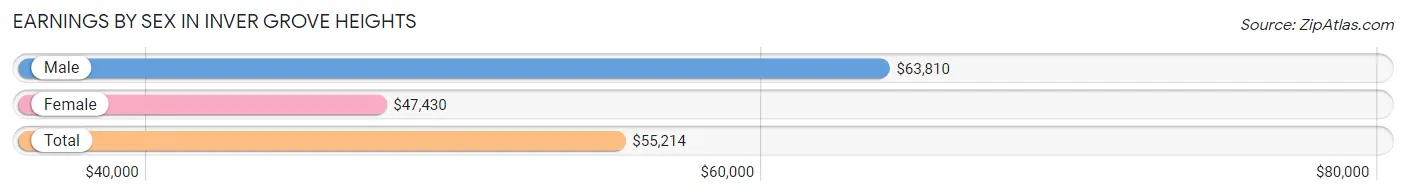
| Sex | Number | Average Earnings |
| Male | 11,067 (52.4%) | $63,810 |
| Female | 10,060 (47.6%) | $47,430 |
| Total | 21,127 (100.0%) | $55,214 |
Earnings by Sex by Income Bracket in Inver Grove Heights
The most common earnings brackets in Inver Grove Heights are $100,000+ for men (2,883 | 26.1%) and $100,000+ for women (1,527 | 15.2%).
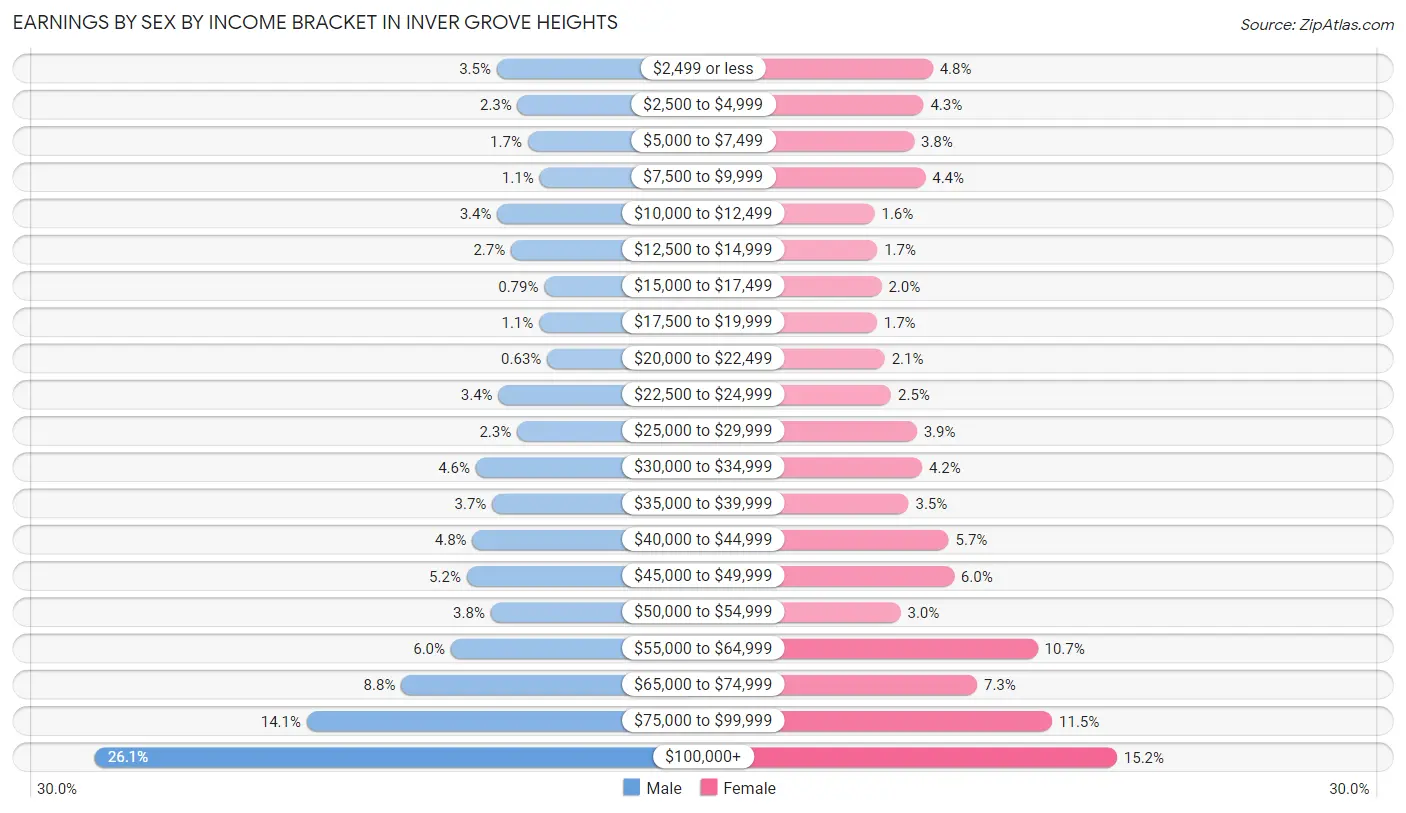
| Income | Male | Female |
| $2,499 or less | 383 (3.5%) | 486 (4.8%) |
| $2,500 to $4,999 | 253 (2.3%) | 434 (4.3%) |
| $5,000 to $7,499 | 190 (1.7%) | 380 (3.8%) |
| $7,500 to $9,999 | 117 (1.1%) | 444 (4.4%) |
| $10,000 to $12,499 | 380 (3.4%) | 157 (1.6%) |
| $12,500 to $14,999 | 294 (2.7%) | 172 (1.7%) |
| $15,000 to $17,499 | 87 (0.8%) | 196 (1.9%) |
| $17,500 to $19,999 | 119 (1.1%) | 170 (1.7%) |
| $20,000 to $22,499 | 70 (0.6%) | 214 (2.1%) |
| $22,500 to $24,999 | 373 (3.4%) | 250 (2.5%) |
| $25,000 to $29,999 | 257 (2.3%) | 395 (3.9%) |
| $30,000 to $34,999 | 513 (4.6%) | 426 (4.2%) |
| $35,000 to $39,999 | 412 (3.7%) | 349 (3.5%) |
| $40,000 to $44,999 | 535 (4.8%) | 575 (5.7%) |
| $45,000 to $49,999 | 570 (5.1%) | 606 (6.0%) |
| $50,000 to $54,999 | 421 (3.8%) | 304 (3.0%) |
| $55,000 to $64,999 | 668 (6.0%) | 1,078 (10.7%) |
| $65,000 to $74,999 | 977 (8.8%) | 736 (7.3%) |
| $75,000 to $99,999 | 1,565 (14.1%) | 1,161 (11.5%) |
| $100,000+ | 2,883 (26.1%) | 1,527 (15.2%) |
| Total | 11,067 (100.0%) | 10,060 (100.0%) |
Earnings by Sex by Educational Attainment in Inver Grove Heights
Average earnings in Inver Grove Heights are $70,607 for men and $55,151 for women, a difference of 21.9%. Men with an educational attainment of graduate degree enjoy the highest average annual earnings of $87,750, while those with less than high school education earn the least with $36,824. Women with an educational attainment of graduate degree earn the most with the average annual earnings of $83,512, while those with less than high school education have the smallest earnings of $27,663.
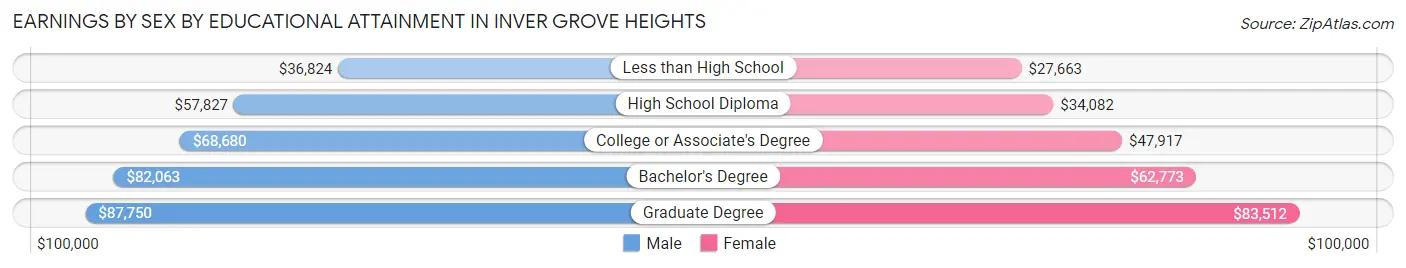
| Educational Attainment | Male Income | Female Income |
| Less than High School | $36,824 | $27,663 |
| High School Diploma | $57,827 | $34,082 |
| College or Associate's Degree | $68,680 | $47,917 |
| Bachelor's Degree | $82,063 | $62,773 |
| Graduate Degree | $87,750 | $83,512 |
| Total | $70,607 | $55,151 |
Family Income in Inver Grove Heights
Family Income Brackets in Inver Grove Heights
According to the Inver Grove Heights family income data, there are 2,936 families falling into the $100,000 to $149,999 income range, which is the most common income bracket and makes up 29.7% of all families. Conversely, the $10,000 to $14,999 income bracket is the least frequent group with only 30 families (0.3%) belonging to this category.
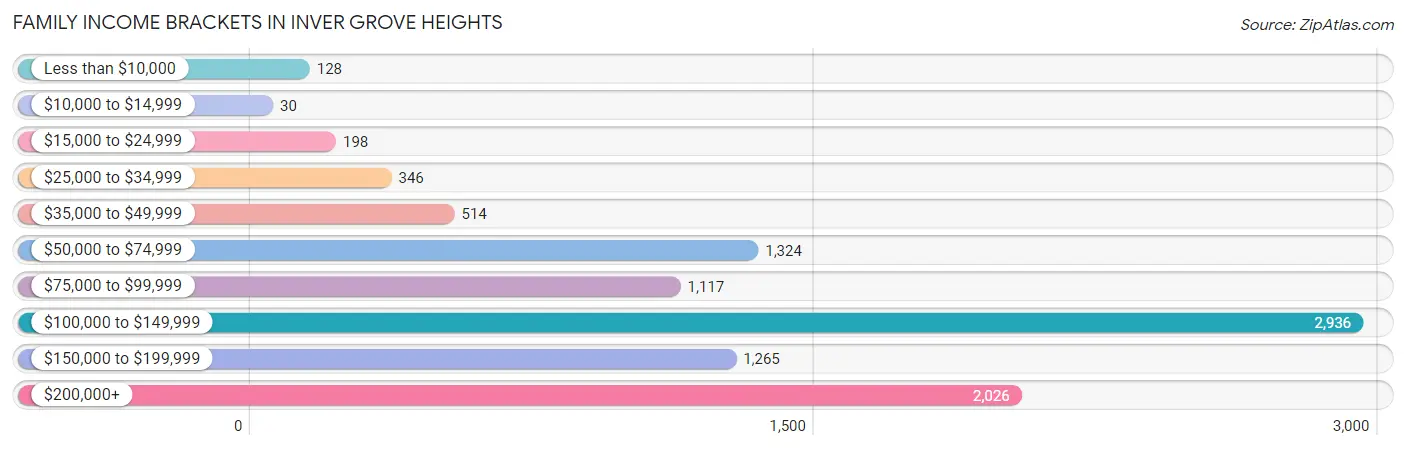
| Income Bracket | # Families | % Families |
| Less than $10,000 | 128 | 1.3% |
| $10,000 to $14,999 | 30 | 0.3% |
| $15,000 to $24,999 | 198 | 2.0% |
| $25,000 to $34,999 | 346 | 3.5% |
| $35,000 to $49,999 | 514 | 5.2% |
| $50,000 to $74,999 | 1,324 | 13.4% |
| $75,000 to $99,999 | 1,117 | 11.3% |
| $100,000 to $149,999 | 2,936 | 29.7% |
| $150,000 to $199,999 | 1,265 | 12.8% |
| $200,000+ | 2,026 | 20.5% |
Family Income by Famaliy Size in Inver Grove Heights
4-person families (1,942 | 19.7%) account for the highest median family income in Inver Grove Heights with $160,952 per family, while 2-person families (5,233 | 52.9%) have the highest median income of $56,004 per family member.
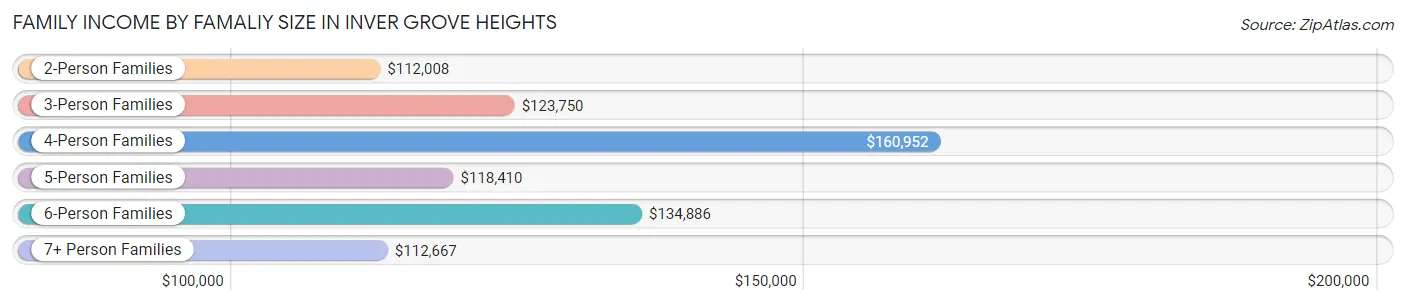
| Income Bracket | # Families | Median Income |
| 2-Person Families | 5,233 (52.9%) | $112,008 |
| 3-Person Families | 1,757 (17.8%) | $123,750 |
| 4-Person Families | 1,942 (19.7%) | $160,952 |
| 5-Person Families | 623 (6.3%) | $118,410 |
| 6-Person Families | 277 (2.8%) | $134,886 |
| 7+ Person Families | 52 (0.5%) | $112,667 |
| Total | 9,884 (100.0%) | $119,116 |
Family Income by Number of Earners in Inver Grove Heights
The median family income in Inver Grove Heights is $119,116, with families comprising 3+ earners (1,485) having the highest median family income of $162,130, while families with no earners (1,273) have the lowest median family income of $66,375, accounting for 15.0% and 12.9% of families, respectively.
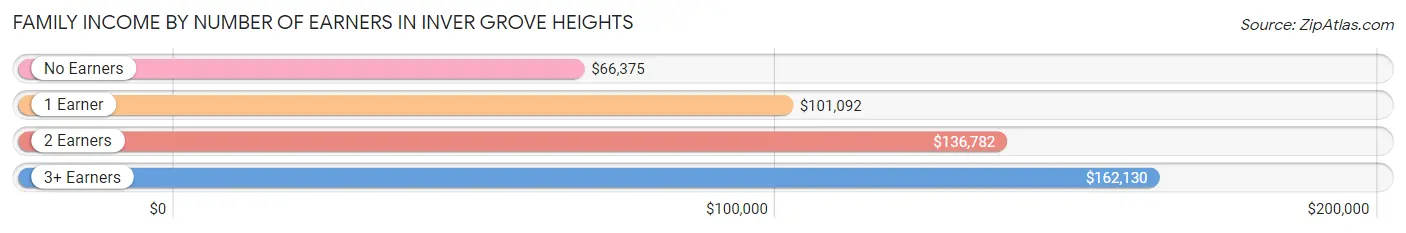
| Number of Earners | # Families | Median Income |
| No Earners | 1,273 (12.9%) | $66,375 |
| 1 Earner | 2,643 (26.7%) | $101,092 |
| 2 Earners | 4,483 (45.4%) | $136,782 |
| 3+ Earners | 1,485 (15.0%) | $162,130 |
| Total | 9,884 (100.0%) | $119,116 |
Household Income in Inver Grove Heights
Household Income Brackets in Inver Grove Heights
With 3,475 households falling in the category, the $100,000 to $149,999 income range is the most frequent in Inver Grove Heights, accounting for 23.6% of all households. In contrast, only 250 households (1.7%) fall into the $10,000 to $14,999 income bracket, making it the least populous group.
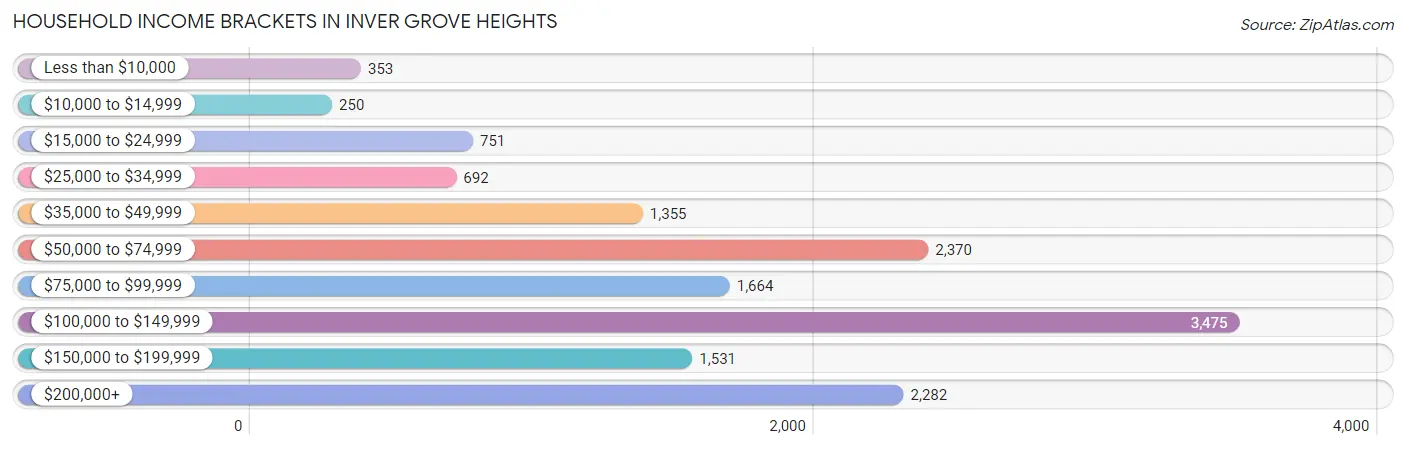
| Income Bracket | # Households | % Households |
| Less than $10,000 | 353 | 2.4% |
| $10,000 to $14,999 | 250 | 1.7% |
| $15,000 to $24,999 | 751 | 5.1% |
| $25,000 to $34,999 | 692 | 4.7% |
| $35,000 to $49,999 | 1,355 | 9.2% |
| $50,000 to $74,999 | 2,370 | 16.1% |
| $75,000 to $99,999 | 1,664 | 11.3% |
| $100,000 to $149,999 | 3,475 | 23.6% |
| $150,000 to $199,999 | 1,531 | 10.4% |
| $200,000+ | 2,282 | 15.5% |
Household Income by Householder Age in Inver Grove Heights
The median household income in Inver Grove Heights is $98,719, with the highest median household income of $116,071 found in the 45 to 64 years age bracket for the primary householder. A total of 6,234 households (42.3%) fall into this category. Meanwhile, the 15 to 24 years age bracket for the primary householder has the lowest median household income of $56,500, with 328 households (2.2%) in this group.
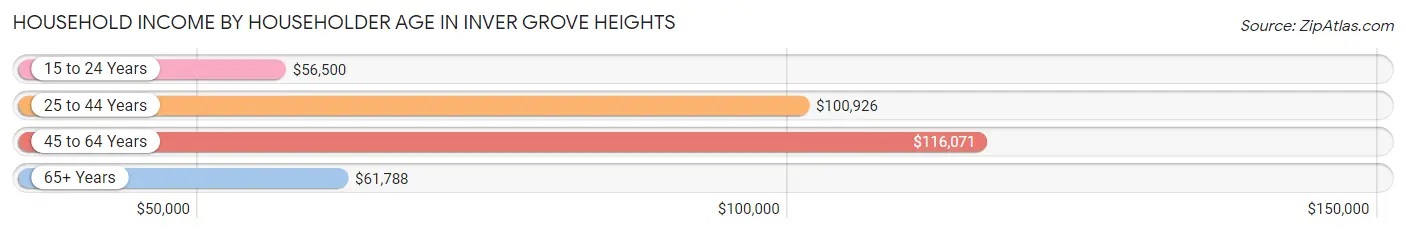
| Income Bracket | # Households | Median Income |
| 15 to 24 Years | 328 (2.2%) | $56,500 |
| 25 to 44 Years | 4,380 (29.7%) | $100,926 |
| 45 to 64 Years | 6,234 (42.3%) | $116,071 |
| 65+ Years | 3,781 (25.7%) | $61,788 |
| Total | 14,723 (100.0%) | $98,719 |
Poverty in Inver Grove Heights
Income Below Poverty by Sex and Age in Inver Grove Heights
With 4.8% poverty level for males and 6.7% for females among the residents of Inver Grove Heights, 16 and 17 year old males and 12 to 14 year old females are the most vulnerable to poverty, with 68 males (15.3%) and 108 females (15.8%) in their respective age groups living below the poverty level.
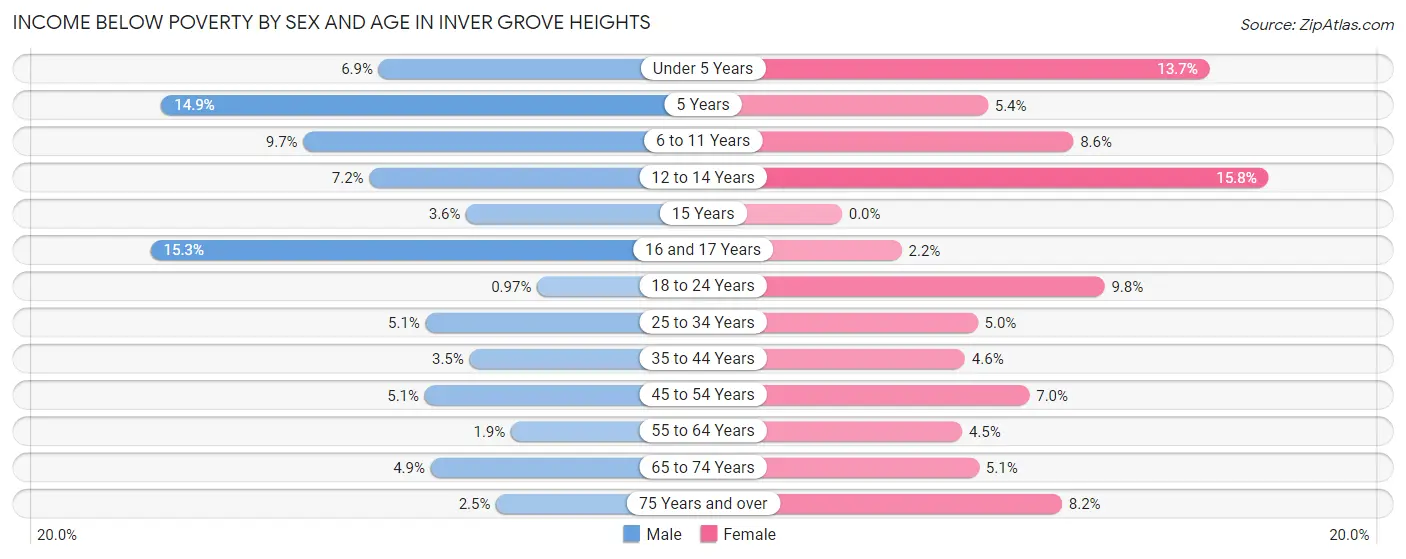
| Age Bracket | Male | Female |
| Under 5 Years | 58 (6.9%) | 114 (13.7%) |
| 5 Years | 27 (14.9%) | 9 (5.4%) |
| 6 to 11 Years | 125 (9.7%) | 114 (8.6%) |
| 12 to 14 Years | 51 (7.2%) | 108 (15.8%) |
| 15 Years | 12 (3.6%) | 0 (0.0%) |
| 16 and 17 Years | 68 (15.3%) | 10 (2.2%) |
| 18 to 24 Years | 12 (1.0%) | 132 (9.8%) |
| 25 to 34 Years | 106 (5.1%) | 105 (5.0%) |
| 35 to 44 Years | 84 (3.5%) | 111 (4.6%) |
| 45 to 54 Years | 118 (5.1%) | 183 (7.0%) |
| 55 to 64 Years | 56 (1.9%) | 117 (4.5%) |
| 65 to 74 Years | 88 (4.9%) | 99 (5.1%) |
| 75 Years and over | 22 (2.5%) | 102 (8.2%) |
| Total | 827 (4.8%) | 1,204 (6.7%) |
Income Above Poverty by Sex and Age in Inver Grove Heights
According to the poverty statistics in Inver Grove Heights, males aged 18 to 24 years and females aged 15 years are the age groups that are most secure financially, with 99.0% of males and 100.0% of females in these age groups living above the poverty line.
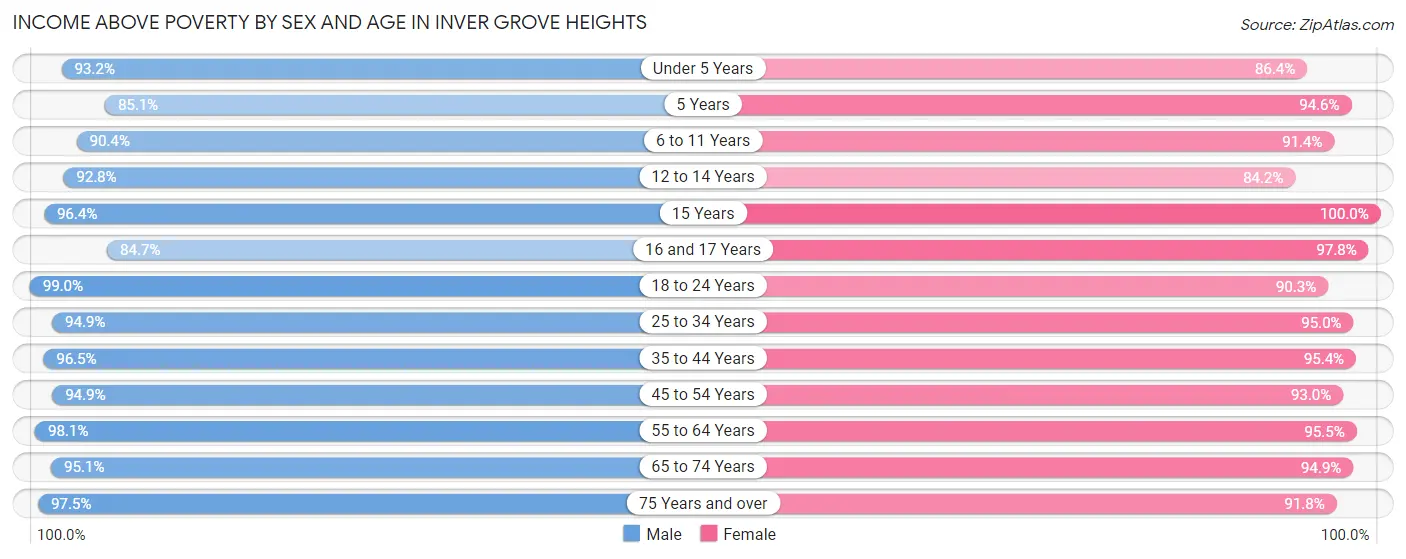
| Age Bracket | Male | Female |
| Under 5 Years | 789 (93.1%) | 721 (86.4%) |
| 5 Years | 154 (85.1%) | 157 (94.6%) |
| 6 to 11 Years | 1,171 (90.3%) | 1,213 (91.4%) |
| 12 to 14 Years | 657 (92.8%) | 574 (84.2%) |
| 15 Years | 321 (96.4%) | 299 (100.0%) |
| 16 and 17 Years | 376 (84.7%) | 441 (97.8%) |
| 18 to 24 Years | 1,230 (99.0%) | 1,222 (90.2%) |
| 25 to 34 Years | 1,970 (94.9%) | 1,979 (95.0%) |
| 35 to 44 Years | 2,330 (96.5%) | 2,317 (95.4%) |
| 45 to 54 Years | 2,177 (94.9%) | 2,445 (93.0%) |
| 55 to 64 Years | 2,831 (98.1%) | 2,509 (95.5%) |
| 65 to 74 Years | 1,699 (95.1%) | 1,847 (94.9%) |
| 75 Years and over | 860 (97.5%) | 1,147 (91.8%) |
| Total | 16,565 (95.2%) | 16,871 (93.3%) |
Income Below Poverty Among Married-Couple Families in Inver Grove Heights
The poverty statistics for married-couple families in Inver Grove Heights show that 1.0% or 80 of the total 7,800 families live below the poverty line. Families with 5 or more children have the highest poverty rate of 48.3%, comprising of 14 families. On the other hand, families with no children have the lowest poverty rate of 0.2%, which includes 11 families.
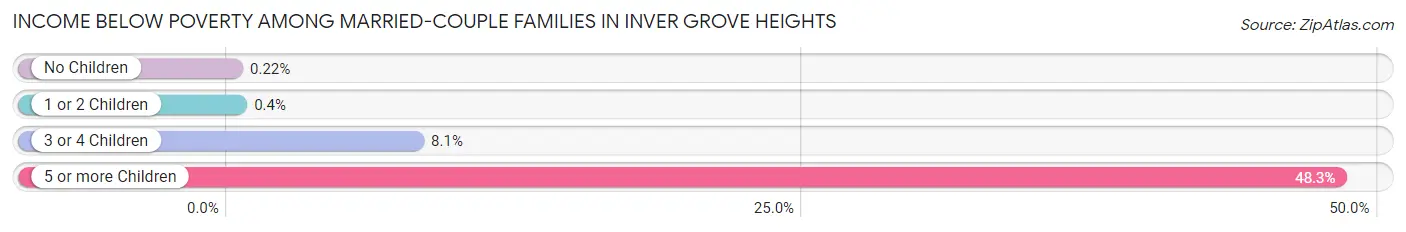
| Children | Above Poverty | Below Poverty |
| No Children | 4,915 (99.8%) | 11 (0.2%) |
| 1 or 2 Children | 2,268 (99.6%) | 9 (0.4%) |
| 3 or 4 Children | 522 (91.9%) | 46 (8.1%) |
| 5 or more Children | 15 (51.7%) | 14 (48.3%) |
| Total | 7,720 (99.0%) | 80 (1.0%) |
Income Below Poverty Among Single-Parent Households in Inver Grove Heights
According to the poverty data in Inver Grove Heights, 3.6% or 27 single-father households and 19.4% or 258 single-mother households are living below the poverty line. Among single-father households, those with no children have the highest poverty rate, with 27 households (9.0%) experiencing poverty. Likewise, among single-mother households, those with 3 or 4 children have the highest poverty rate, with 71 households (54.6%) falling below the poverty line.
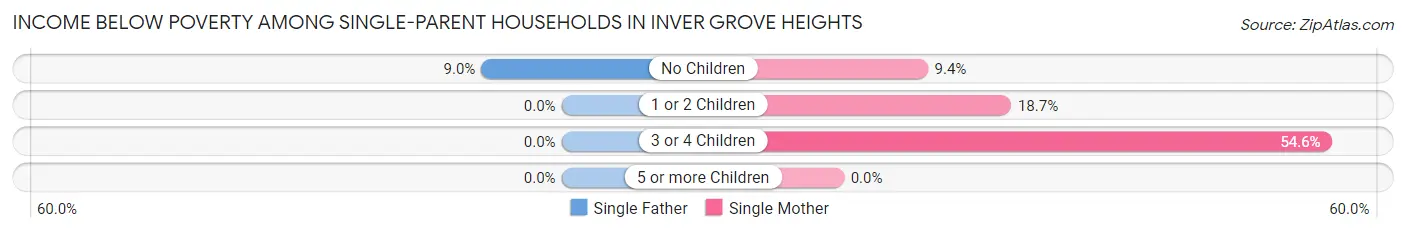
| Children | Single Father | Single Mother |
| No Children | 27 (9.0%) | 38 (9.4%) |
| 1 or 2 Children | 0 (0.0%) | 149 (18.7%) |
| 3 or 4 Children | 0 (0.0%) | 71 (54.6%) |
| 5 or more Children | 0 (0.0%) | 0 (0.0%) |
| Total | 27 (3.6%) | 258 (19.4%) |
Income Below Poverty Among Married-Couple vs Single-Parent Households in Inver Grove Heights
The poverty data for Inver Grove Heights shows that 80 of the married-couple family households (1.0%) and 285 of the single-parent households (13.7%) are living below the poverty level. Within the married-couple family households, those with 5 or more children have the highest poverty rate, with 14 households (48.3%) falling below the poverty line. Among the single-parent households, those with 3 or 4 children have the highest poverty rate, with 71 household (48.6%) living below poverty.
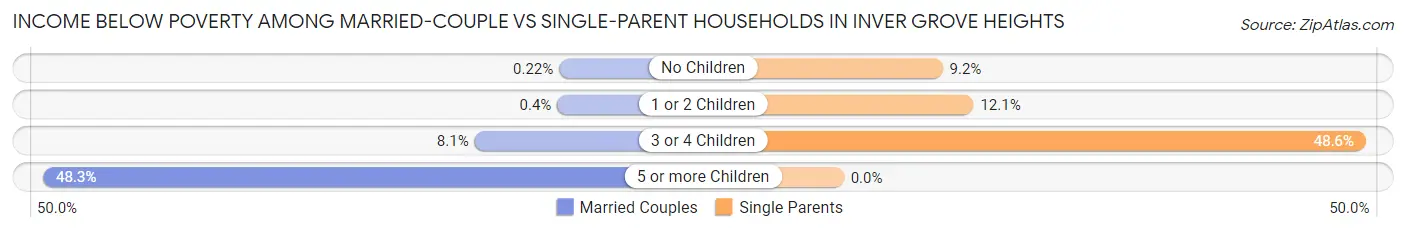
| Children | Married-Couple Families | Single-Parent Households |
| No Children | 11 (0.2%) | 65 (9.2%) |
| 1 or 2 Children | 9 (0.4%) | 149 (12.1%) |
| 3 or 4 Children | 46 (8.1%) | 71 (48.6%) |
| 5 or more Children | 14 (48.3%) | 0 (0.0%) |
| Total | 80 (1.0%) | 285 (13.7%) |
Race in Inver Grove Heights
The most populous races in Inver Grove Heights are White / Caucasian (28,131 | 78.9%), Hispanic or Latino (4,373 | 12.3%), and Some other Race (2,321 | 6.5%).
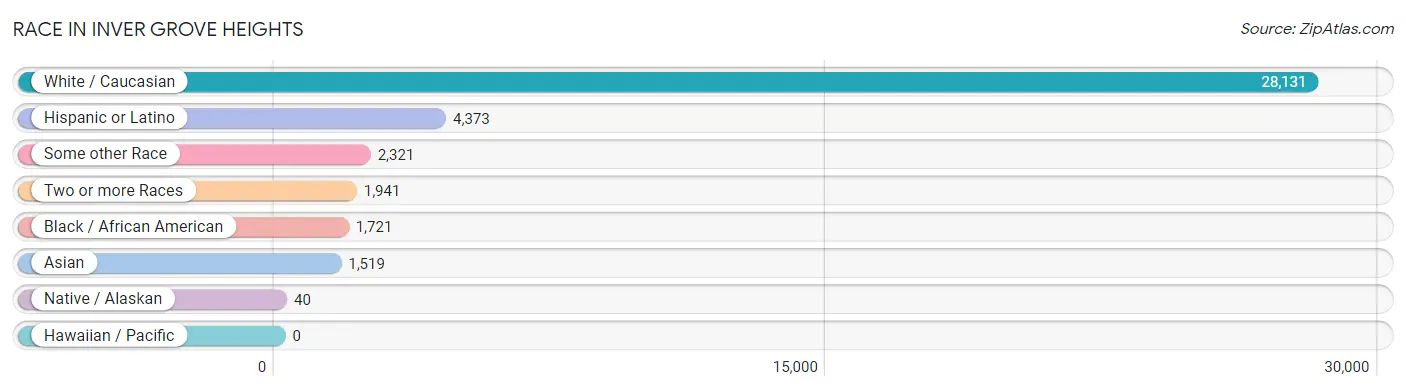
| Race | # Population | % Population |
| Asian | 1,519 | 4.3% |
| Black / African American | 1,721 | 4.8% |
| Hawaiian / Pacific | 0 | 0.0% |
| Hispanic or Latino | 4,373 | 12.3% |
| Native / Alaskan | 40 | 0.1% |
| White / Caucasian | 28,131 | 78.9% |
| Two or more Races | 1,941 | 5.4% |
| Some other Race | 2,321 | 6.5% |
| Total | 35,673 | 100.0% |
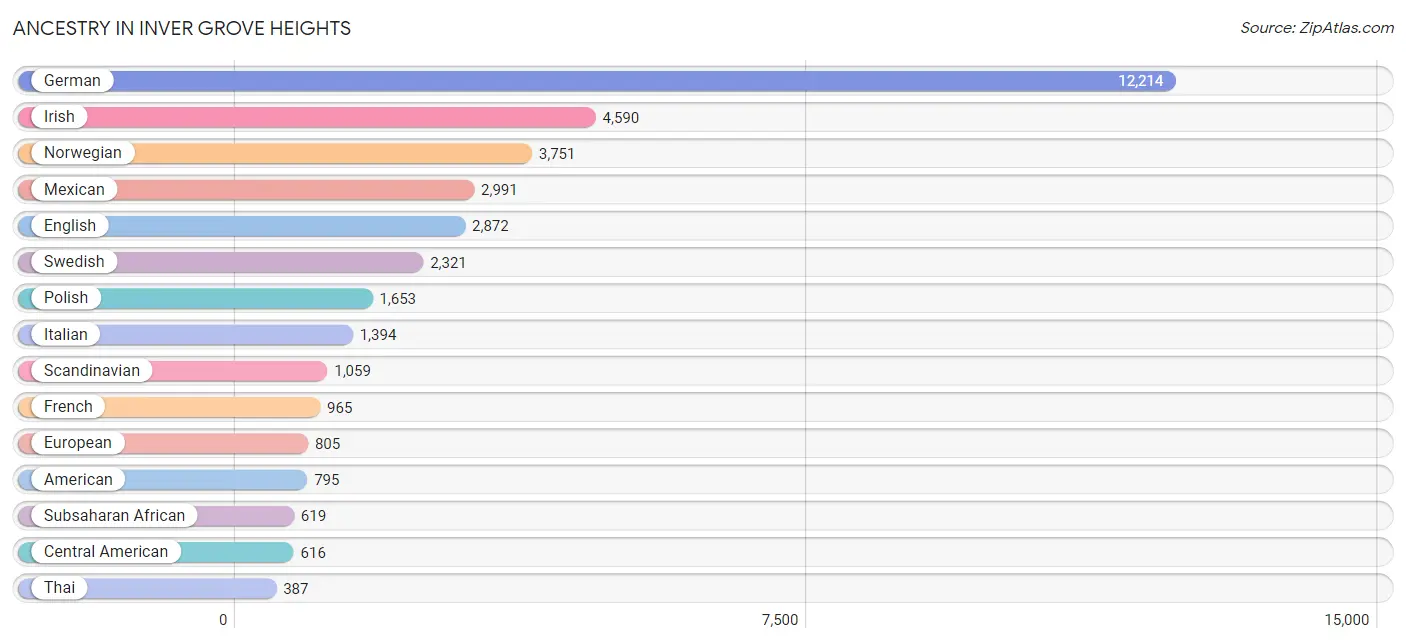
Ancestry in Inver Grove Heights
The most populous ancestries reported in Inver Grove Heights are German (12,214 | 34.2%), Irish (4,590 | 12.9%), Norwegian (3,751 | 10.5%), Mexican (2,991 | 8.4%), and English (2,872 | 8.1%), together accounting for 74.0% of all Inver Grove Heights residents.
| Ancestry | # Population | % Population |
| African | 248 | 0.7% |
| American | 795 | 2.2% |
| Arab | 240 | 0.7% |
| Australian | 58 | 0.2% |
| Austrian | 254 | 0.7% |
| Bangladeshi | 207 | 0.6% |
| Belgian | 19 | 0.1% |
| Bhutanese | 124 | 0.4% |
| Blackfeet | 3 | 0.0% |
| British | 168 | 0.5% |
| Burmese | 192 | 0.5% |
| Canadian | 62 | 0.2% |
| Central American | 616 | 1.7% |
| Cherokee | 5 | 0.0% |
| Chippewa | 80 | 0.2% |
| Colombian | 18 | 0.1% |
| Croatian | 66 | 0.2% |
| Cuban | 40 | 0.1% |
| Czech | 256 | 0.7% |
| Czechoslovakian | 31 | 0.1% |
| Danish | 385 | 1.1% |
| Dominican | 140 | 0.4% |
| Dutch | 310 | 0.9% |
| Eastern European | 56 | 0.2% |
| Egyptian | 69 | 0.2% |
| English | 2,872 | 8.1% |
| Ethiopian | 2 | 0.0% |
| European | 805 | 2.3% |
| Filipino | 43 | 0.1% |
| Finnish | 201 | 0.6% |
| French | 965 | 2.7% |
| French Canadian | 212 | 0.6% |
| German | 12,214 | 34.2% |
| Ghanaian | 24 | 0.1% |
| Greek | 27 | 0.1% |
| Guatemalan | 86 | 0.2% |
| Haitian | 118 | 0.3% |
| Honduran | 43 | 0.1% |
| Hungarian | 129 | 0.4% |
| Icelander | 17 | 0.1% |
| Indian (Asian) | 219 | 0.6% |
| Irish | 4,590 | 12.9% |
| Iroquois | 5 | 0.0% |
| Italian | 1,394 | 3.9% |
| Jamaican | 8 | 0.0% |
| Japanese | 238 | 0.7% |
| Kenyan | 42 | 0.1% |
| Korean | 270 | 0.8% |
| Lebanese | 128 | 0.4% |
| Liberian | 98 | 0.3% |
| Luxembourger | 17 | 0.1% |
| Malaysian | 67 | 0.2% |
| Mexican | 2,991 | 8.4% |
| Native Hawaiian | 52 | 0.2% |
| Navajo | 15 | 0.0% |
| Nicaraguan | 278 | 0.8% |
| Nigerian | 157 | 0.4% |
| Northern European | 54 | 0.2% |
| Norwegian | 3,751 | 10.5% |
| Pakistani | 84 | 0.2% |
| Peruvian | 14 | 0.0% |
| Polish | 1,653 | 4.6% |
| Puerto Rican | 384 | 1.1% |
| Romanian | 19 | 0.1% |
| Russian | 85 | 0.2% |
| Salvadoran | 209 | 0.6% |
| Scandinavian | 1,059 | 3.0% |
| Scotch-Irish | 108 | 0.3% |
| Scottish | 284 | 0.8% |
| Seminole | 4 | 0.0% |
| Serbian | 44 | 0.1% |
| Sioux | 25 | 0.1% |
| Slavic | 39 | 0.1% |
| Slovak | 9 | 0.0% |
| Slovene | 21 | 0.1% |
| Somali | 47 | 0.1% |
| South American | 32 | 0.1% |
| Spaniard | 76 | 0.2% |
| Spanish | 15 | 0.0% |
| Sri Lankan | 189 | 0.5% |
| Subsaharan African | 619 | 1.7% |
| Sudanese | 3 | 0.0% |
| Swedish | 2,321 | 6.5% |
| Swiss | 185 | 0.5% |
| Thai | 387 | 1.1% |
| Turkish | 62 | 0.2% |
| Ukrainian | 89 | 0.3% |
| Welsh | 106 | 0.3% | View All 88 Rows |
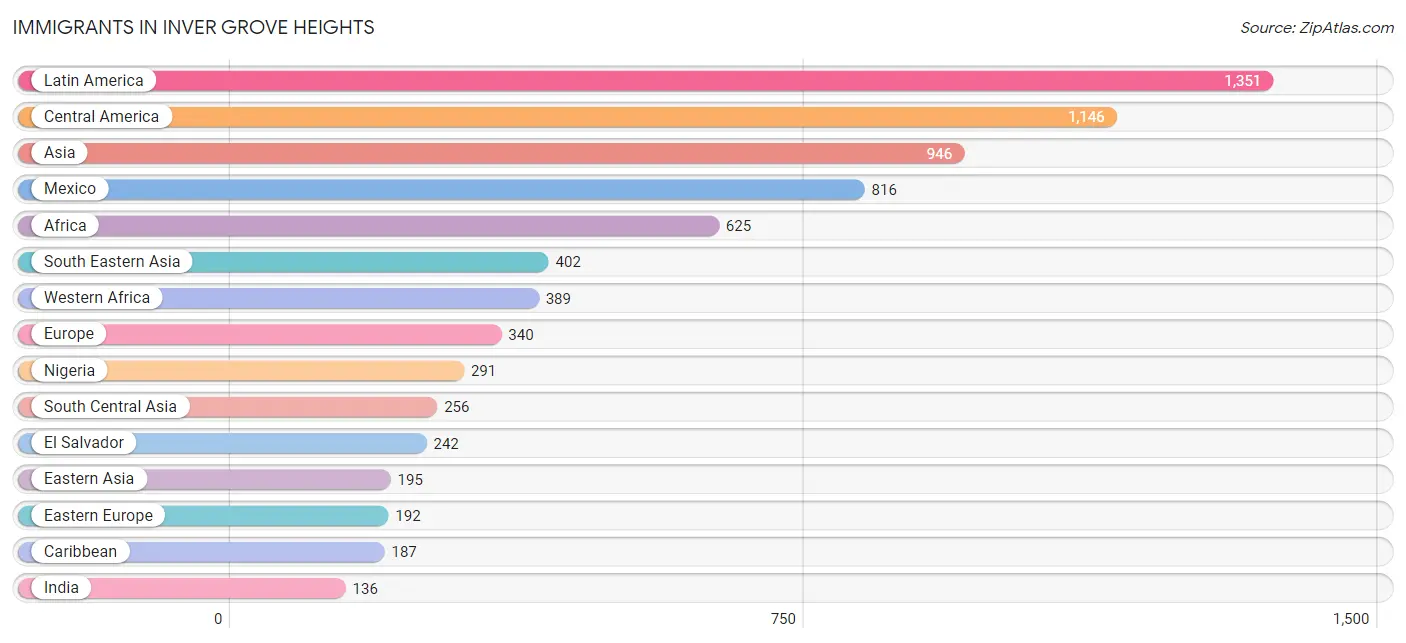
Immigrants in Inver Grove Heights
The most numerous immigrant groups reported in Inver Grove Heights came from Latin America (1,351 | 3.8%), Central America (1,146 | 3.2%), Asia (946 | 2.6%), Mexico (816 | 2.3%), and Africa (625 | 1.8%), together accounting for 13.7% of all Inver Grove Heights residents.
| Immigration Origin | # Population | % Population |
| Africa | 625 | 1.8% |
| Asia | 946 | 2.6% |
| Australia | 58 | 0.2% |
| Bangladesh | 71 | 0.2% |
| Belarus | 74 | 0.2% |
| Canada | 49 | 0.1% |
| Caribbean | 187 | 0.5% |
| Central America | 1,146 | 3.2% |
| China | 85 | 0.2% |
| Colombia | 4 | 0.0% |
| Cuba | 26 | 0.1% |
| Dominican Republic | 22 | 0.1% |
| Eastern Africa | 83 | 0.2% |
| Eastern Asia | 195 | 0.5% |
| Eastern Europe | 192 | 0.5% |
| Egypt | 63 | 0.2% |
| El Salvador | 242 | 0.7% |
| England | 10 | 0.0% |
| Ethiopia | 4 | 0.0% |
| Europe | 340 | 0.9% |
| France | 11 | 0.0% |
| Germany | 93 | 0.3% |
| Haiti | 118 | 0.3% |
| Honduras | 43 | 0.1% |
| Hungary | 9 | 0.0% |
| India | 136 | 0.4% |
| Indonesia | 32 | 0.1% |
| Iran | 8 | 0.0% |
| Iraq | 38 | 0.1% |
| Ireland | 19 | 0.1% |
| Jamaica | 21 | 0.1% |
| Japan | 32 | 0.1% |
| Kenya | 42 | 0.1% |
| Korea | 78 | 0.2% |
| Laos | 42 | 0.1% |
| Latin America | 1,351 | 3.8% |
| Lebanon | 11 | 0.0% |
| Liberia | 98 | 0.3% |
| Mexico | 816 | 2.3% |
| Nepal | 41 | 0.1% |
| Nicaragua | 45 | 0.1% |
| Nigeria | 291 | 0.8% |
| Northern Africa | 63 | 0.2% |
| Northern Europe | 44 | 0.1% |
| Oceania | 58 | 0.2% |
| Peru | 14 | 0.0% |
| Philippines | 93 | 0.3% |
| Russia | 25 | 0.1% |
| Somalia | 13 | 0.0% |
| South Africa | 22 | 0.1% |
| South America | 18 | 0.1% |
| South Central Asia | 256 | 0.7% |
| South Eastern Asia | 402 | 1.1% |
| Taiwan | 23 | 0.1% |
| Thailand | 127 | 0.4% |
| Turkey | 44 | 0.1% |
| Ukraine | 59 | 0.2% |
| Vietnam | 108 | 0.3% |
| Western Africa | 389 | 1.1% |
| Western Asia | 93 | 0.3% |
| Western Europe | 104 | 0.3% | View All 61 Rows |
Sex and Age in Inver Grove Heights
Sex and Age in Inver Grove Heights
The most populous age groups in Inver Grove Heights are 55 to 59 Years (1,549 | 8.9%) for men and 50 to 54 Years (1,530 | 8.4%) for women.
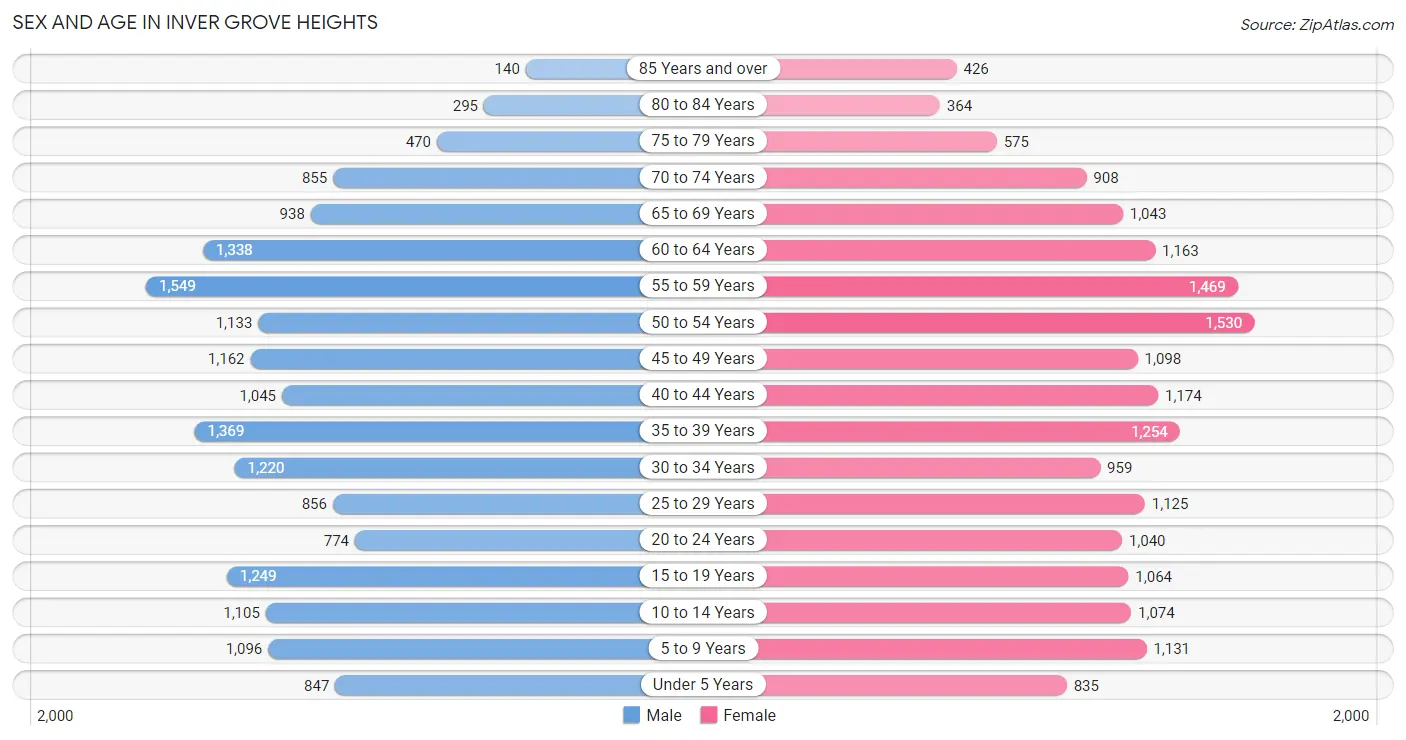
| Age Bracket | Male | Female |
| Under 5 Years | 847 (4.9%) | 835 (4.6%) |
| 5 to 9 Years | 1,096 (6.3%) | 1,131 (6.2%) |
| 10 to 14 Years | 1,105 (6.3%) | 1,074 (5.9%) |
| 15 to 19 Years | 1,249 (7.2%) | 1,064 (5.8%) |
| 20 to 24 Years | 774 (4.4%) | 1,040 (5.7%) |
| 25 to 29 Years | 856 (4.9%) | 1,125 (6.2%) |
| 30 to 34 Years | 1,220 (7.0%) | 959 (5.3%) |
| 35 to 39 Years | 1,369 (7.9%) | 1,254 (6.9%) |
| 40 to 44 Years | 1,045 (6.0%) | 1,174 (6.4%) |
| 45 to 49 Years | 1,162 (6.7%) | 1,098 (6.0%) |
| 50 to 54 Years | 1,133 (6.5%) | 1,530 (8.4%) |
| 55 to 59 Years | 1,549 (8.9%) | 1,469 (8.1%) |
| 60 to 64 Years | 1,338 (7.7%) | 1,163 (6.4%) |
| 65 to 69 Years | 938 (5.4%) | 1,043 (5.7%) |
| 70 to 74 Years | 855 (4.9%) | 908 (5.0%) |
| 75 to 79 Years | 470 (2.7%) | 575 (3.2%) |
| 80 to 84 Years | 295 (1.7%) | 364 (2.0%) |
| 85 Years and over | 140 (0.8%) | 426 (2.3%) |
| Total | 17,441 (100.0%) | 18,232 (100.0%) |
Families and Households in Inver Grove Heights
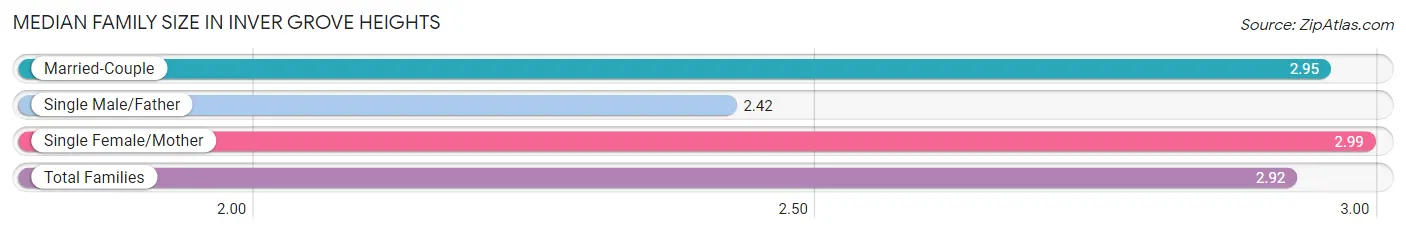
Median Family Size in Inver Grove Heights
The median family size in Inver Grove Heights is 2.92 persons per family, with single female/mother families (1,332 | 13.5%) accounting for the largest median family size of 2.99 persons per family. On the other hand, single male/father families (752 | 7.6%) represent the smallest median family size with 2.42 persons per family.
| Family Type | # Families | Family Size |
| Married-Couple | 7,800 (78.9%) | 2.95 |
| Single Male/Father | 752 (7.6%) | 2.42 |
| Single Female/Mother | 1,332 (13.5%) | 2.99 |
| Total Families | 9,884 (100.0%) | 2.92 |
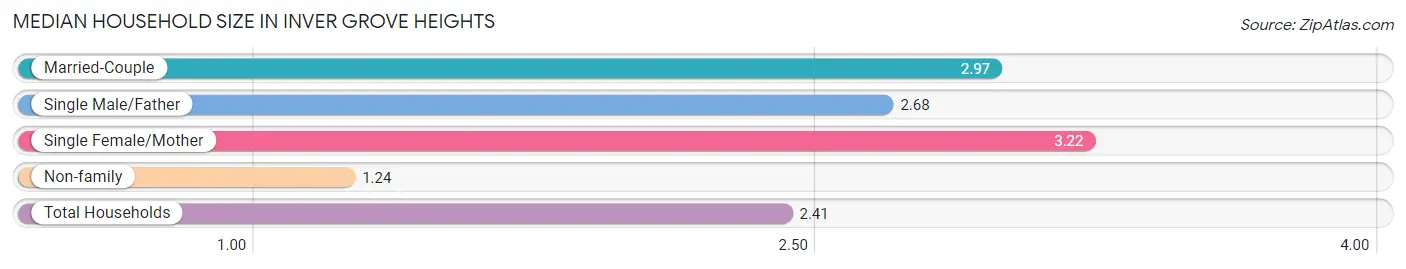
Median Household Size in Inver Grove Heights
The median household size in Inver Grove Heights is 2.41 persons per household, with single female/mother households (1,332 | 9.0%) accounting for the largest median household size of 3.22 persons per household. non-family households (4,839 | 32.9%) represent the smallest median household size with 1.24 persons per household.
| Household Type | # Households | Household Size |
| Married-Couple | 7,800 (53.0%) | 2.97 |
| Single Male/Father | 752 (5.1%) | 2.68 |
| Single Female/Mother | 1,332 (9.0%) | 3.22 |
| Non-family | 4,839 (32.9%) | 1.24 |
| Total Households | 14,723 (100.0%) | 2.41 |
Household Size by Marriage Status in Inver Grove Heights
Out of a total of 14,723 households in Inver Grove Heights, 9,884 (67.1%) are family households, while 4,839 (32.9%) are nonfamily households. The most numerous type of family households are 2-person households, comprising 4,989, and the most common type of nonfamily households are 1-person households, comprising 3,810.
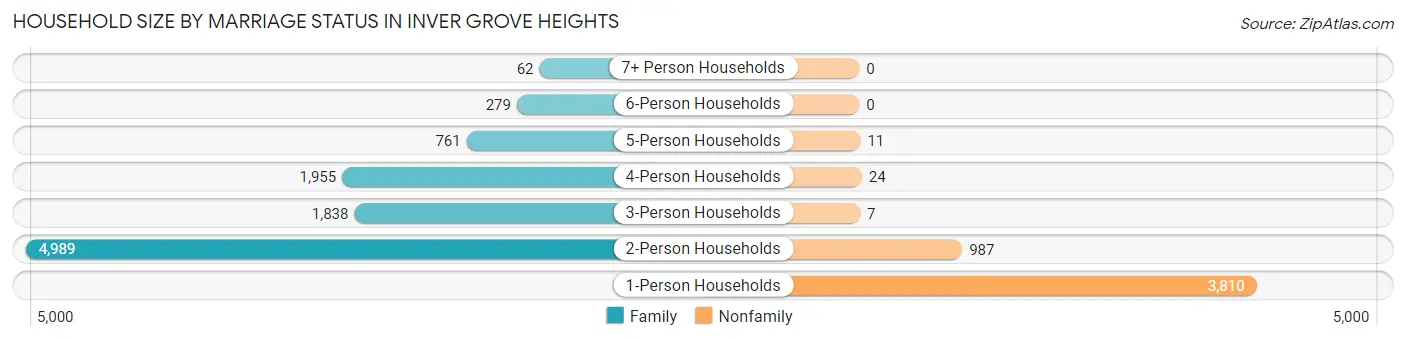
| Household Size | Family Households | Nonfamily Households |
| 1-Person Households | - | 3,810 (25.9%) |
| 2-Person Households | 4,989 (33.9%) | 987 (6.7%) |
| 3-Person Households | 1,838 (12.5%) | 7 (0.1%) |
| 4-Person Households | 1,955 (13.3%) | 24 (0.2%) |
| 5-Person Households | 761 (5.2%) | 11 (0.1%) |
| 6-Person Households | 279 (1.9%) | 0 (0.0%) |
| 7+ Person Households | 62 (0.4%) | 0 (0.0%) |
| Total | 9,884 (67.1%) | 4,839 (32.9%) |
Female Fertility in Inver Grove Heights
Fertility by Age in Inver Grove Heights
Average fertility rate in Inver Grove Heights is 46.0 births per 1,000 women. Women in the age bracket of 20 to 34 years have the highest fertility rate with 63.0 births per 1,000 women. Women in the age bracket of 20 to 34 years acount for 53.2% of all women with births.
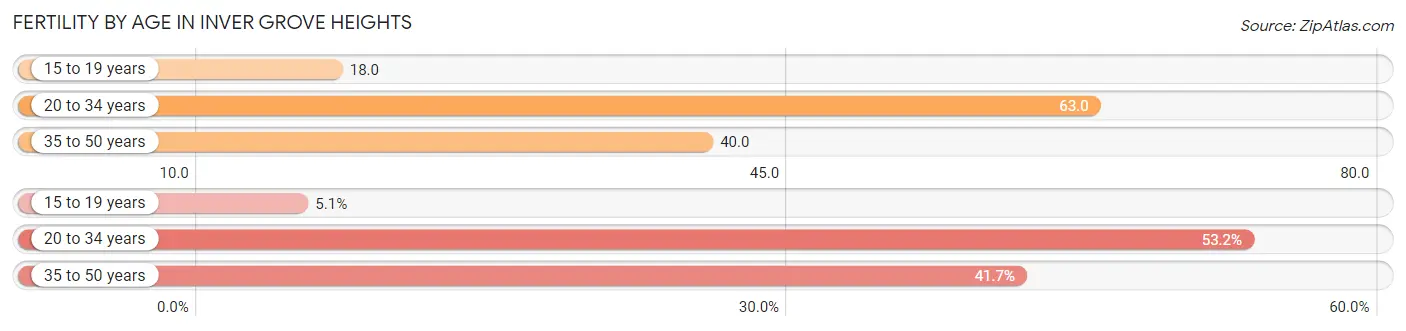
| Age Bracket | Women with Births | Births / 1,000 Women |
| 15 to 19 years | 19 (5.1%) | 18.0 |
| 20 to 34 years | 198 (53.2%) | 63.0 |
| 35 to 50 years | 155 (41.7%) | 40.0 |
| Total | 372 (100.0%) | 46.0 |
Fertility by Age by Marriage Status in Inver Grove Heights
71.0% of women with births (372) in Inver Grove Heights are married. The highest percentage of unmarried women with births falls into 15 to 19 years age bracket with 100.0% of them unmarried at the time of birth, while the lowest percentage of unmarried women with births belong to 35 to 50 years age bracket with 7.1% of them unmarried.
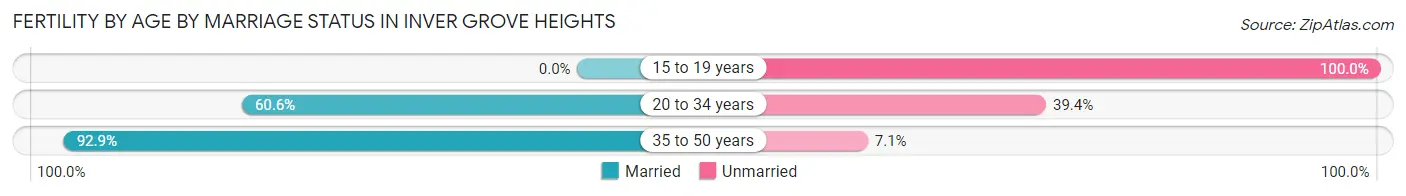
| Age Bracket | Married | Unmarried |
| 15 to 19 years | 0 (0.0%) | 19 (100.0%) |
| 20 to 34 years | 120 (60.6%) | 78 (39.4%) |
| 35 to 50 years | 144 (92.9%) | 11 (7.1%) |
| Total | 264 (71.0%) | 108 (29.0%) |
Fertility by Education in Inver Grove Heights
Average fertility rate in Inver Grove Heights is 46.0 births per 1,000 women. Women with the education attainment of less than high school have the highest fertility rate of 68.0 births per 1,000 women, while women with the education attainment of college or associate's degree have the lowest fertility at 32.0 births per 1,000 women. Women with the education attainment of bachelor's degree represent 33.9% of all women with births.
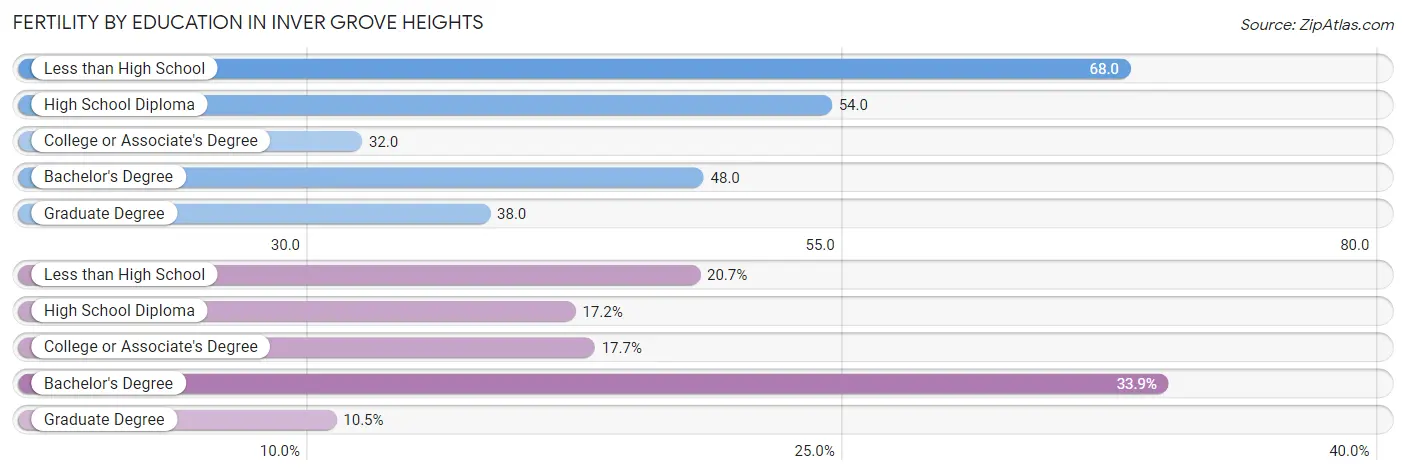
| Educational Attainment | Women with Births | Births / 1,000 Women |
| Less than High School | 77 (20.7%) | 68.0 |
| High School Diploma | 64 (17.2%) | 54.0 |
| College or Associate's Degree | 66 (17.7%) | 32.0 |
| Bachelor's Degree | 126 (33.9%) | 48.0 |
| Graduate Degree | 39 (10.5%) | 38.0 |
| Total | 372 (100.0%) | 46.0 |
Fertility by Education by Marriage Status in Inver Grove Heights
29.0% of women with births in Inver Grove Heights are unmarried. Women with the educational attainment of bachelor's degree are most likely to be married with 100.0% of them married at childbirth, while women with the educational attainment of less than high school are least likely to be married with 100.0% of them unmarried at childbirth.
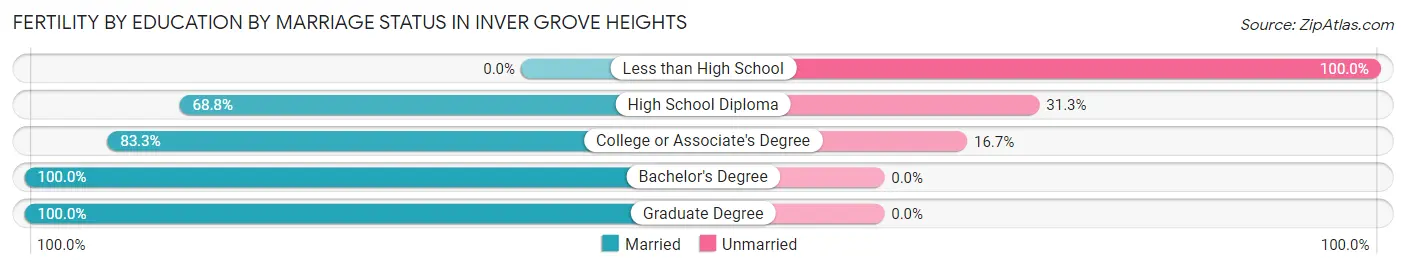
| Educational Attainment | Married | Unmarried |
| Less than High School | 0 (0.0%) | 77 (100.0%) |
| High School Diploma | 44 (68.8%) | 20 (31.2%) |
| College or Associate's Degree | 55 (83.3%) | 11 (16.7%) |
| Bachelor's Degree | 126 (100.0%) | 0 (0.0%) |
| Graduate Degree | 39 (100.0%) | 0 (0.0%) |
| Total | 264 (71.0%) | 108 (29.0%) |
Employment Characteristics in Inver Grove Heights
Employment by Class of Employer in Inver Grove Heights
Among the 19,298 employed individuals in Inver Grove Heights, private company employees (13,699 | 71.0%), not-for-profit organizations (1,773 | 9.2%), and local government employees (1,491 | 7.7%) make up the most common classes of employment.
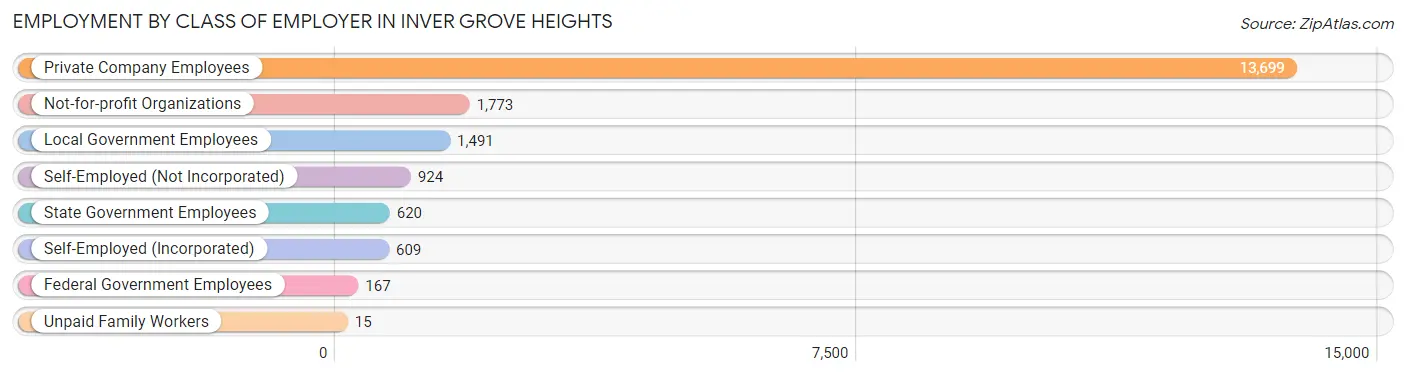
| Employer Class | # Employees | % Employees |
| Private Company Employees | 13,699 | 71.0% |
| Self-Employed (Incorporated) | 609 | 3.2% |
| Self-Employed (Not Incorporated) | 924 | 4.8% |
| Not-for-profit Organizations | 1,773 | 9.2% |
| Local Government Employees | 1,491 | 7.7% |
| State Government Employees | 620 | 3.2% |
| Federal Government Employees | 167 | 0.9% |
| Unpaid Family Workers | 15 | 0.1% |
| Total | 19,298 | 100.0% |
Employment Status by Age in Inver Grove Heights
According to the labor force statistics for Inver Grove Heights, out of the total population over 16 years of age (28,953), 70.3% or 20,354 individuals are in the labor force, with 3.2% or 651 of them unemployed. The age group with the highest labor force participation rate is 25 to 29 years, with 95.9% or 1,900 individuals in the labor force. Within the labor force, the 16 to 19 years age range has the highest percentage of unemployed individuals, with 6.8% or 68 of them being unemployed.
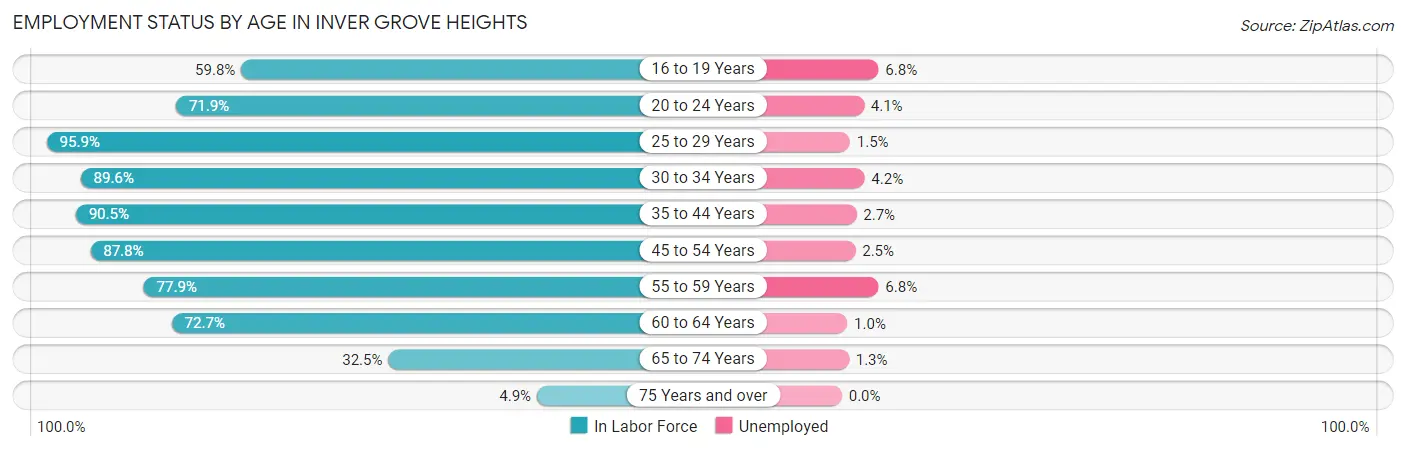
| Age Bracket | In Labor Force | Unemployed |
| 16 to 19 Years | 1,005 (59.8%) | 68 (6.8%) |
| 20 to 24 Years | 1,304 (71.9%) | 53 (4.1%) |
| 25 to 29 Years | 1,900 (95.9%) | 28 (1.5%) |
| 30 to 34 Years | 1,952 (89.6%) | 82 (4.2%) |
| 35 to 44 Years | 4,382 (90.5%) | 118 (2.7%) |
| 45 to 54 Years | 4,322 (87.8%) | 108 (2.5%) |
| 55 to 59 Years | 2,351 (77.9%) | 160 (6.8%) |
| 60 to 64 Years | 1,818 (72.7%) | 18 (1.0%) |
| 65 to 74 Years | 1,217 (32.5%) | 16 (1.3%) |
| 75 Years and over | 111 (4.9%) | 0 (0.0%) |
| Total | 20,354 (70.3%) | 651 (3.2%) |
Employment Status by Educational Attainment in Inver Grove Heights
According to labor force statistics for Inver Grove Heights, 86.0% of individuals (16,722) out of the total population between 25 and 64 years of age (19,444) are in the labor force, with 3.1% or 518 of them being unemployed. The group with the highest labor force participation rate are those with the educational attainment of bachelor's degree or higher, with 92.1% or 8,023 individuals in the labor force. Within the labor force, individuals with less than high school education have the highest percentage of unemployment, with 12.3% or 90 of them being unemployed.
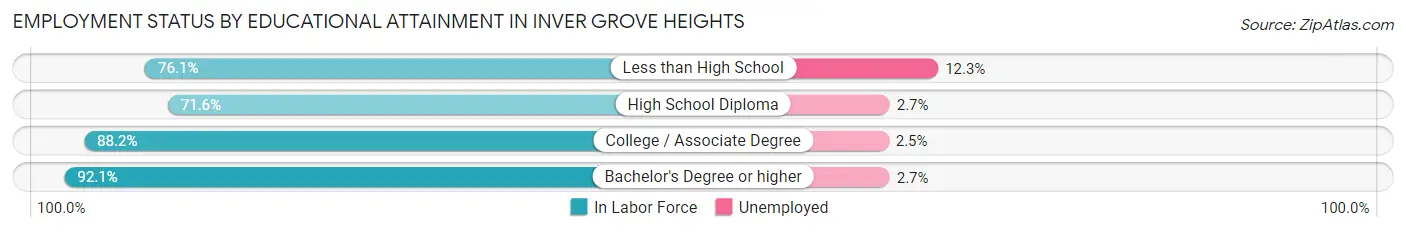
| Educational Attainment | In Labor Force | Unemployed |
| Less than High School | 729 (76.1%) | 118 (12.3%) |
| High School Diploma | 2,772 (71.6%) | 105 (2.7%) |
| College / Associate Degree | 5,206 (88.2%) | 148 (2.5%) |
| Bachelor's Degree or higher | 8,023 (92.1%) | 235 (2.7%) |
| Total | 16,722 (86.0%) | 603 (3.1%) |
Employment Occupations by Sex in Inver Grove Heights
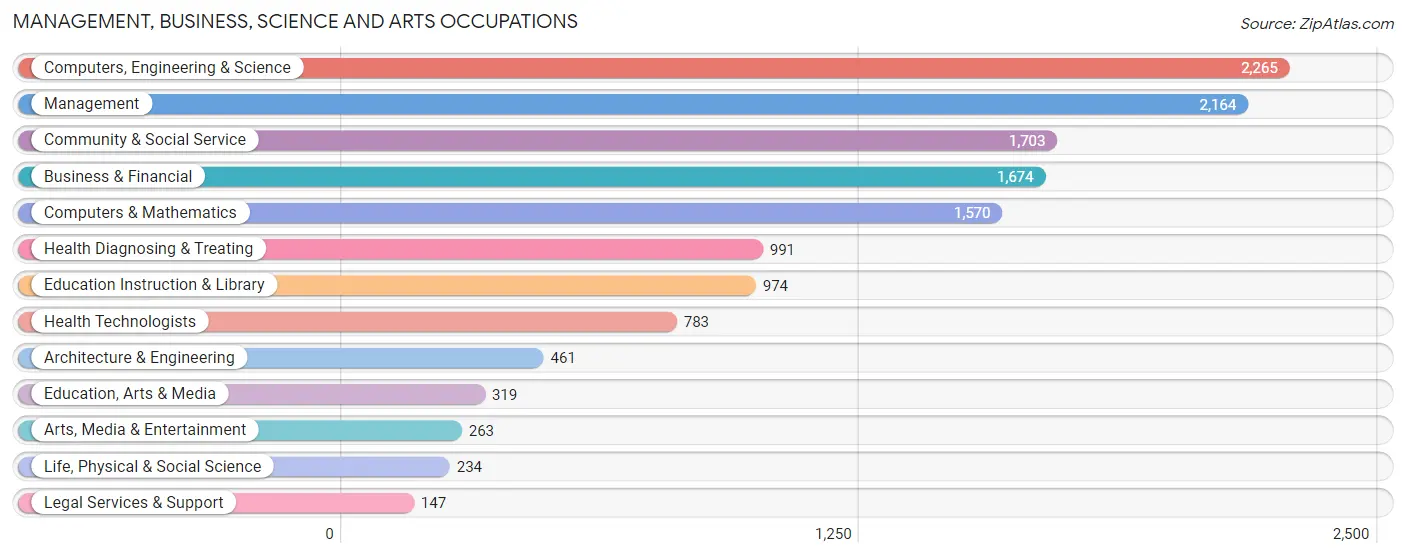
Management, Business, Science and Arts Occupations
The most common Management, Business, Science and Arts occupations in Inver Grove Heights are Computers, Engineering & Science (2,265 | 11.5%), Management (2,164 | 11.0%), Community & Social Service (1,703 | 8.6%), Business & Financial (1,674 | 8.5%), and Computers & Mathematics (1,570 | 8.0%).
Management, Business, Science and Arts Occupations by Sex
Within the Management, Business, Science and Arts occupations in Inver Grove Heights, the most male-oriented occupations are Architecture & Engineering (83.3%), Computers, Engineering & Science (69.9%), and Computers & Mathematics (66.9%), while the most female-oriented occupations are Health Diagnosing & Treating (91.2%), Health Technologists (90.4%), and Education Instruction & Library (80.4%).
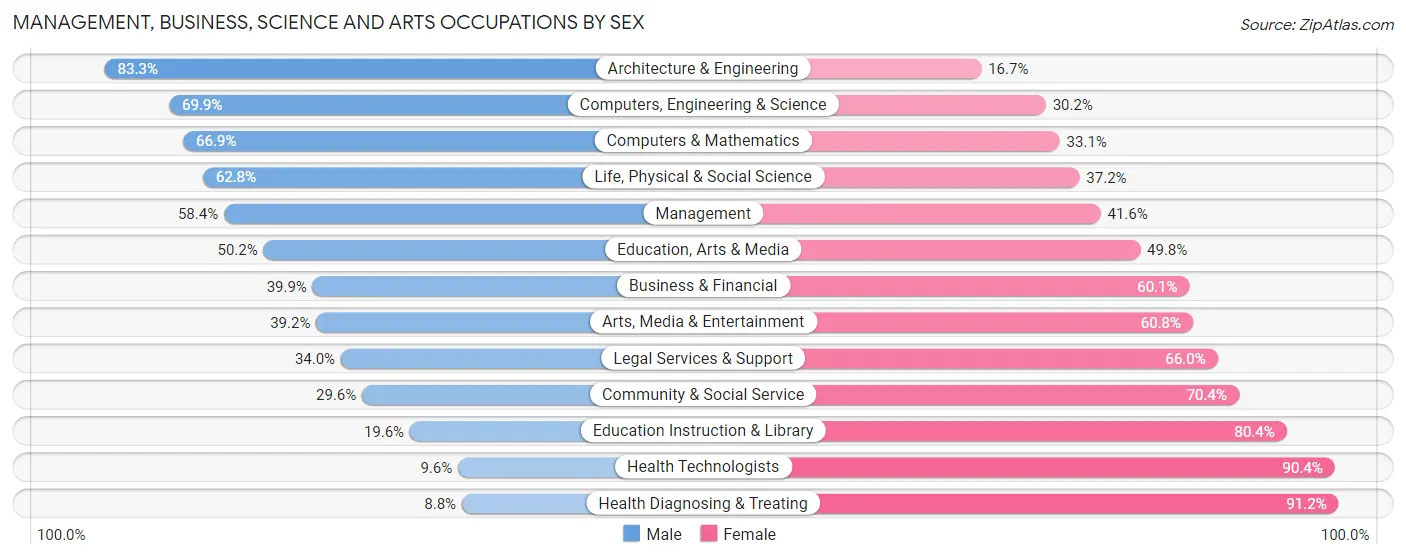
| Occupation | Male | Female |
| Management | 1,264 (58.4%) | 900 (41.6%) |
| Business & Financial | 668 (39.9%) | 1,006 (60.1%) |
| Computers, Engineering & Science | 1,582 (69.9%) | 683 (30.1%) |
| Computers & Mathematics | 1,051 (66.9%) | 519 (33.1%) |
| Architecture & Engineering | 384 (83.3%) | 77 (16.7%) |
| Life, Physical & Social Science | 147 (62.8%) | 87 (37.2%) |
| Community & Social Service | 504 (29.6%) | 1,199 (70.4%) |
| Education, Arts & Media | 160 (50.2%) | 159 (49.8%) |
| Legal Services & Support | 50 (34.0%) | 97 (66.0%) |
| Education Instruction & Library | 191 (19.6%) | 783 (80.4%) |
| Arts, Media & Entertainment | 103 (39.2%) | 160 (60.8%) |
| Health Diagnosing & Treating | 87 (8.8%) | 904 (91.2%) |
| Health Technologists | 75 (9.6%) | 708 (90.4%) |
| Total (Category) | 4,105 (46.7%) | 4,692 (53.3%) |
| Total (Overall) | 10,475 (53.1%) | 9,240 (46.9%) |
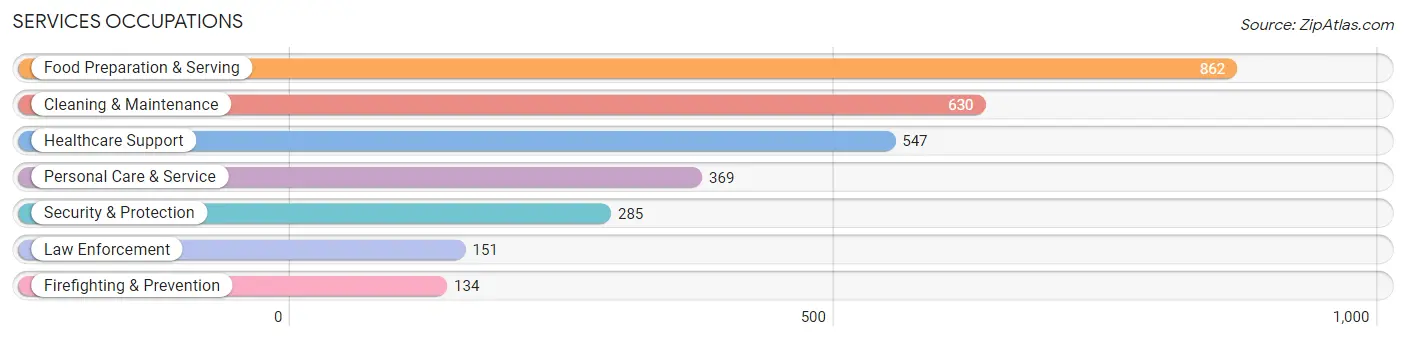
Services Occupations
The most common Services occupations in Inver Grove Heights are Food Preparation & Serving (862 | 4.4%), Cleaning & Maintenance (630 | 3.2%), Healthcare Support (547 | 2.8%), Personal Care & Service (369 | 1.9%), and Security & Protection (285 | 1.5%).
Services Occupations by Sex
Within the Services occupations in Inver Grove Heights, the most male-oriented occupations are Firefighting & Prevention (78.4%), Security & Protection (72.6%), and Law Enforcement (67.5%), while the most female-oriented occupations are Healthcare Support (94.2%), Personal Care & Service (89.7%), and Food Preparation & Serving (65.0%).
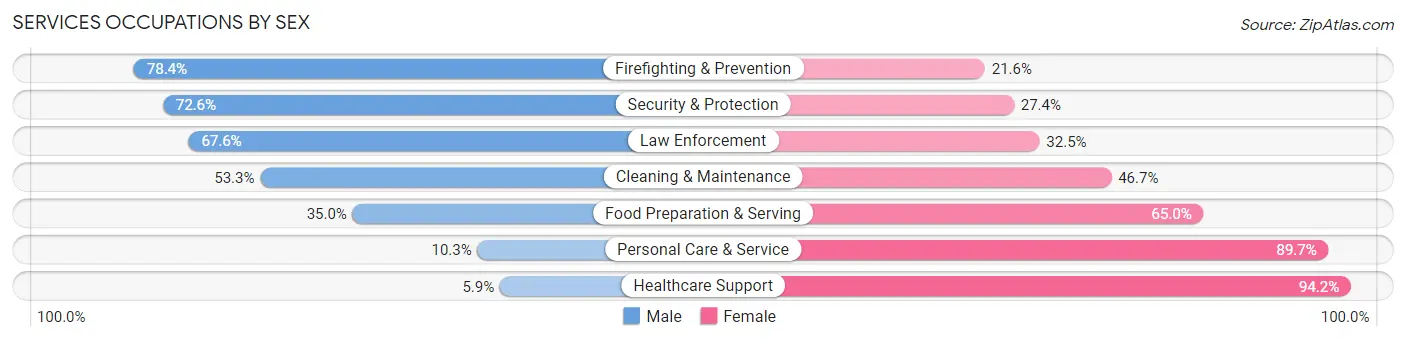
| Occupation | Male | Female |
| Healthcare Support | 32 (5.9%) | 515 (94.2%) |
| Security & Protection | 207 (72.6%) | 78 (27.4%) |
| Firefighting & Prevention | 105 (78.4%) | 29 (21.6%) |
| Law Enforcement | 102 (67.5%) | 49 (32.5%) |
| Food Preparation & Serving | 302 (35.0%) | 560 (65.0%) |
| Cleaning & Maintenance | 336 (53.3%) | 294 (46.7%) |
| Personal Care & Service | 38 (10.3%) | 331 (89.7%) |
| Total (Category) | 915 (34.0%) | 1,778 (66.0%) |
| Total (Overall) | 10,475 (53.1%) | 9,240 (46.9%) |
Sales and Office Occupations
The most common Sales and Office occupations in Inver Grove Heights are Office & Administration (2,490 | 12.6%), and Sales & Related (2,037 | 10.3%).
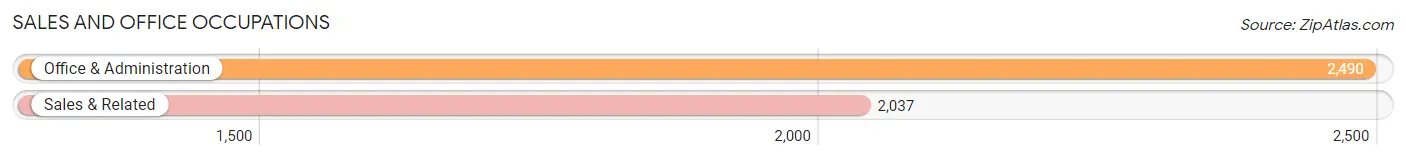
Sales and Office Occupations by Sex
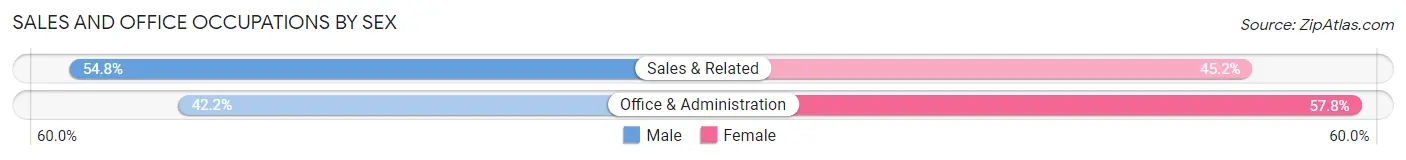
| Occupation | Male | Female |
| Sales & Related | 1,116 (54.8%) | 921 (45.2%) |
| Office & Administration | 1,051 (42.2%) | 1,439 (57.8%) |
| Total (Category) | 2,167 (47.9%) | 2,360 (52.1%) |
| Total (Overall) | 10,475 (53.1%) | 9,240 (46.9%) |
Natural Resources, Construction and Maintenance Occupations
The most common Natural Resources, Construction and Maintenance occupations in Inver Grove Heights are Construction & Extraction (727 | 3.7%), Installation, Maintenance & Repair (550 | 2.8%), and Farming, Fishing & Forestry (42 | 0.2%).
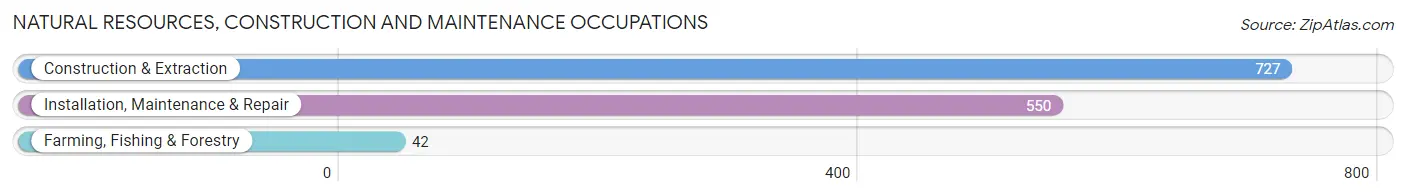
Natural Resources, Construction and Maintenance Occupations by Sex
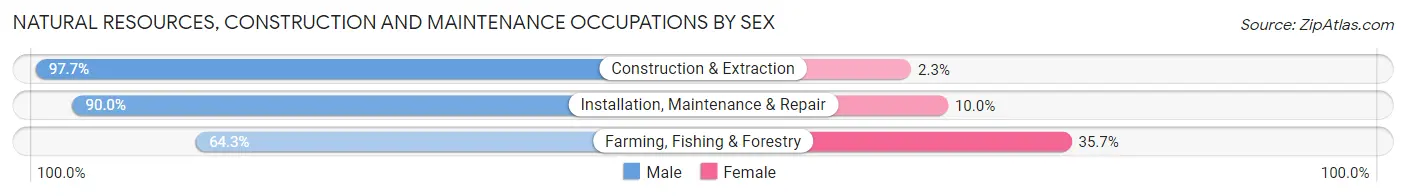
| Occupation | Male | Female |
| Farming, Fishing & Forestry | 27 (64.3%) | 15 (35.7%) |
| Construction & Extraction | 710 (97.7%) | 17 (2.3%) |
| Installation, Maintenance & Repair | 495 (90.0%) | 55 (10.0%) |
| Total (Category) | 1,232 (93.4%) | 87 (6.6%) |
| Total (Overall) | 10,475 (53.1%) | 9,240 (46.9%) |
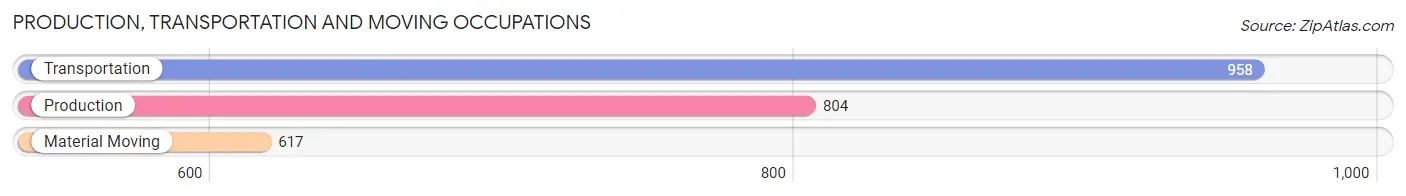
Production, Transportation and Moving Occupations
The most common Production, Transportation and Moving occupations in Inver Grove Heights are Transportation (958 | 4.9%), Production (804 | 4.1%), and Material Moving (617 | 3.1%).
Production, Transportation and Moving Occupations by Sex
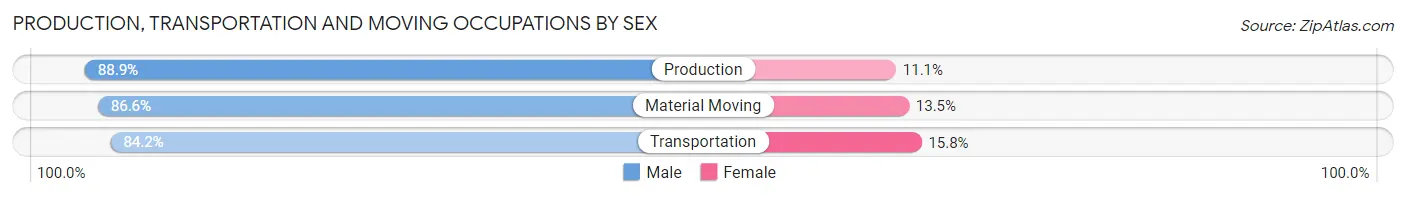
| Occupation | Male | Female |
| Production | 715 (88.9%) | 89 (11.1%) |
| Transportation | 807 (84.2%) | 151 (15.8%) |
| Material Moving | 534 (86.6%) | 83 (13.5%) |
| Total (Category) | 2,056 (86.4%) | 323 (13.6%) |
| Total (Overall) | 10,475 (53.1%) | 9,240 (46.9%) |
Employment Industries by Sex in Inver Grove Heights
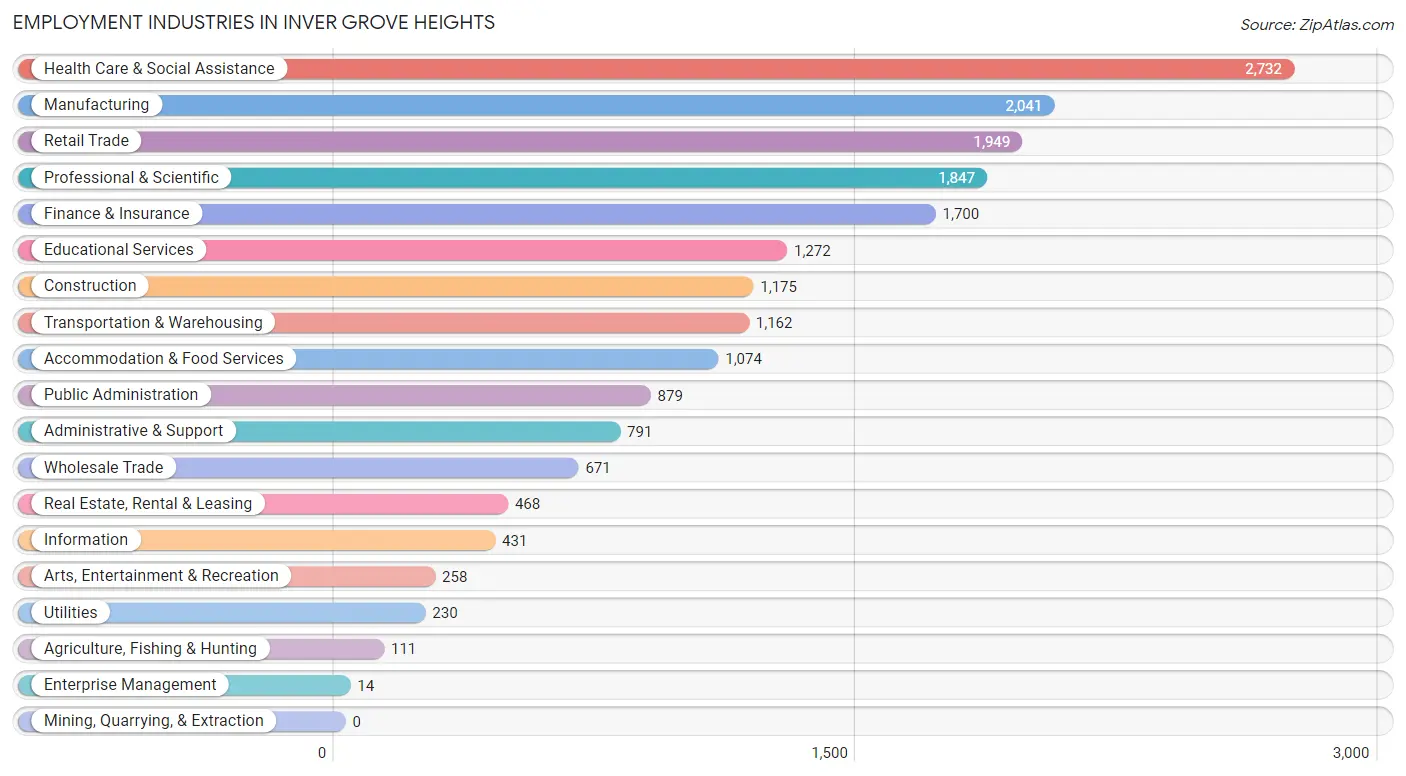
Employment Industries in Inver Grove Heights
The major employment industries in Inver Grove Heights include Health Care & Social Assistance (2,732 | 13.9%), Manufacturing (2,041 | 10.3%), Retail Trade (1,949 | 9.9%), Professional & Scientific (1,847 | 9.4%), and Finance & Insurance (1,700 | 8.6%).
Employment Industries by Sex in Inver Grove Heights
The Inver Grove Heights industries that see more men than women are Construction (97.1%), Utilities (95.2%), and Transportation & Warehousing (85.3%), whereas the industries that tend to have a higher number of women are Enterprise Management (100.0%), Health Care & Social Assistance (79.2%), and Educational Services (74.2%).
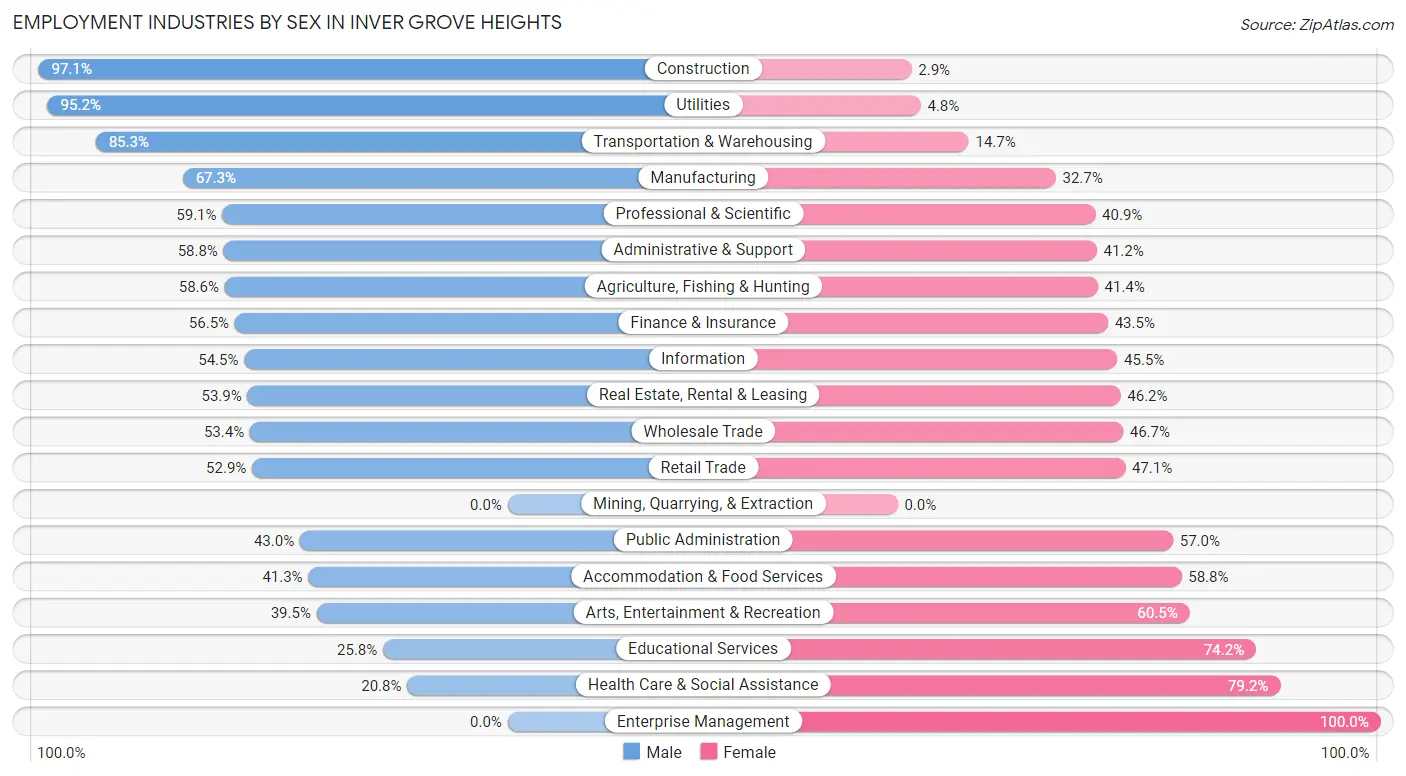
| Industry | Male | Female |
| Agriculture, Fishing & Hunting | 65 (58.6%) | 46 (41.4%) |
| Mining, Quarrying, & Extraction | 0 (0.0%) | 0 (0.0%) |
| Construction | 1,141 (97.1%) | 34 (2.9%) |
| Manufacturing | 1,373 (67.3%) | 668 (32.7%) |
| Wholesale Trade | 358 (53.3%) | 313 (46.7%) |
| Retail Trade | 1,031 (52.9%) | 918 (47.1%) |
| Transportation & Warehousing | 991 (85.3%) | 171 (14.7%) |
| Utilities | 219 (95.2%) | 11 (4.8%) |
| Information | 235 (54.5%) | 196 (45.5%) |
| Finance & Insurance | 960 (56.5%) | 740 (43.5%) |
| Real Estate, Rental & Leasing | 252 (53.8%) | 216 (46.2%) |
| Professional & Scientific | 1,091 (59.1%) | 756 (40.9%) |
| Enterprise Management | 0 (0.0%) | 14 (100.0%) |
| Administrative & Support | 465 (58.8%) | 326 (41.2%) |
| Educational Services | 328 (25.8%) | 944 (74.2%) |
| Health Care & Social Assistance | 568 (20.8%) | 2,164 (79.2%) |
| Arts, Entertainment & Recreation | 102 (39.5%) | 156 (60.5%) |
| Accommodation & Food Services | 443 (41.2%) | 631 (58.8%) |
| Public Administration | 378 (43.0%) | 501 (57.0%) |
| Total | 10,475 (53.1%) | 9,240 (46.9%) |
Education in Inver Grove Heights
School Enrollment in Inver Grove Heights
The most common levels of schooling among the 8,280 students in Inver Grove Heights are high school (2,048 | 24.7%), middle school (1,782 | 21.5%), and elementary school (1,734 | 20.9%).
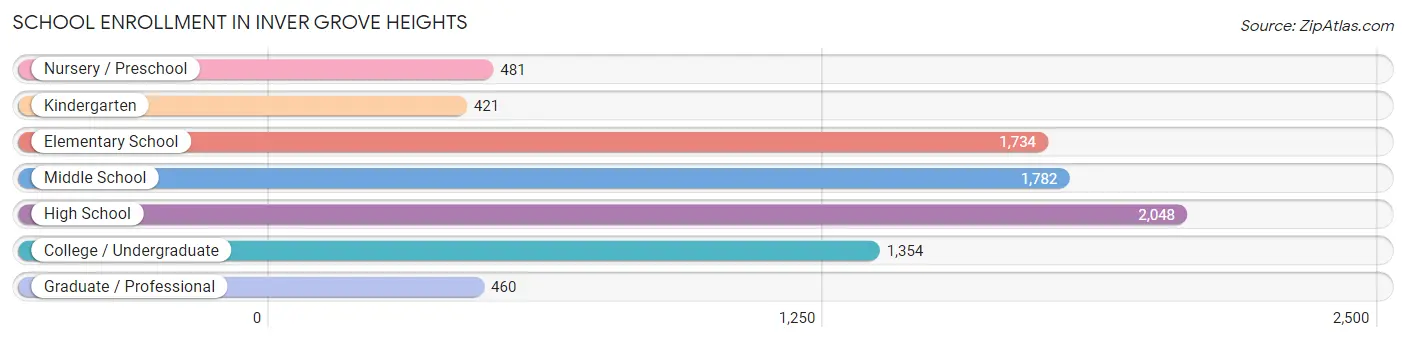
| School Level | # Students | % Students |
| Nursery / Preschool | 481 | 5.8% |
| Kindergarten | 421 | 5.1% |
| Elementary School | 1,734 | 20.9% |
| Middle School | 1,782 | 21.5% |
| High School | 2,048 | 24.7% |
| College / Undergraduate | 1,354 | 16.4% |
| Graduate / Professional | 460 | 5.6% |
| Total | 8,280 | 100.0% |
School Enrollment by Age by Funding Source in Inver Grove Heights
Out of a total of 8,280 students who are enrolled in schools in Inver Grove Heights, 1,399 (16.9%) attend a private institution, while the remaining 6,881 (83.1%) are enrolled in public schools. The age group of 3 to 4 year olds has the highest likelihood of being enrolled in private schools, with 173 (48.6% in the age bracket) enrolled. Conversely, the age group of 25 to 34 year olds has the lowest likelihood of being enrolled in a private school, with 366 (90.8% in the age bracket) attending a public institution.
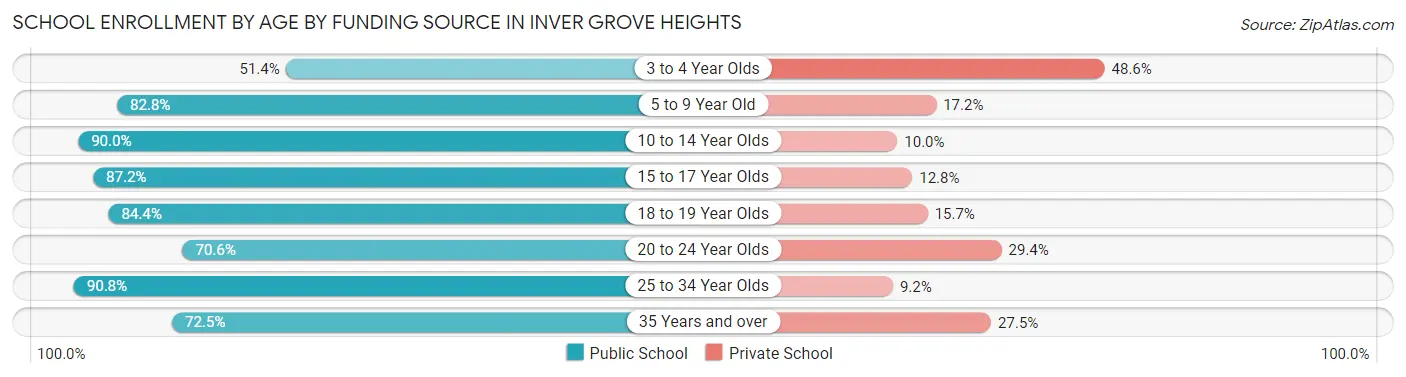
| Age Bracket | Public School | Private School |
| 3 to 4 Year Olds | 183 (51.4%) | 173 (48.6%) |
| 5 to 9 Year Old | 1,743 (82.8%) | 363 (17.2%) |
| 10 to 14 Year Olds | 1,961 (90.0%) | 218 (10.0%) |
| 15 to 17 Year Olds | 1,317 (87.2%) | 193 (12.8%) |
| 18 to 19 Year Olds | 528 (84.4%) | 98 (15.7%) |
| 20 to 24 Year Olds | 427 (70.6%) | 178 (29.4%) |
| 25 to 34 Year Olds | 366 (90.8%) | 37 (9.2%) |
| 35 Years and over | 359 (72.5%) | 136 (27.5%) |
| Total | 6,881 (83.1%) | 1,399 (16.9%) |
Educational Attainment by Field of Study in Inver Grove Heights
Business (3,117 | 26.1%), science & technology (1,301 | 10.9%), education (965 | 8.1%), bio, nature & agricultural (952 | 8.0%), and arts & humanities (738 | 6.2%) are the most common fields of study among 11,930 individuals in Inver Grove Heights who have obtained a bachelor's degree or higher.
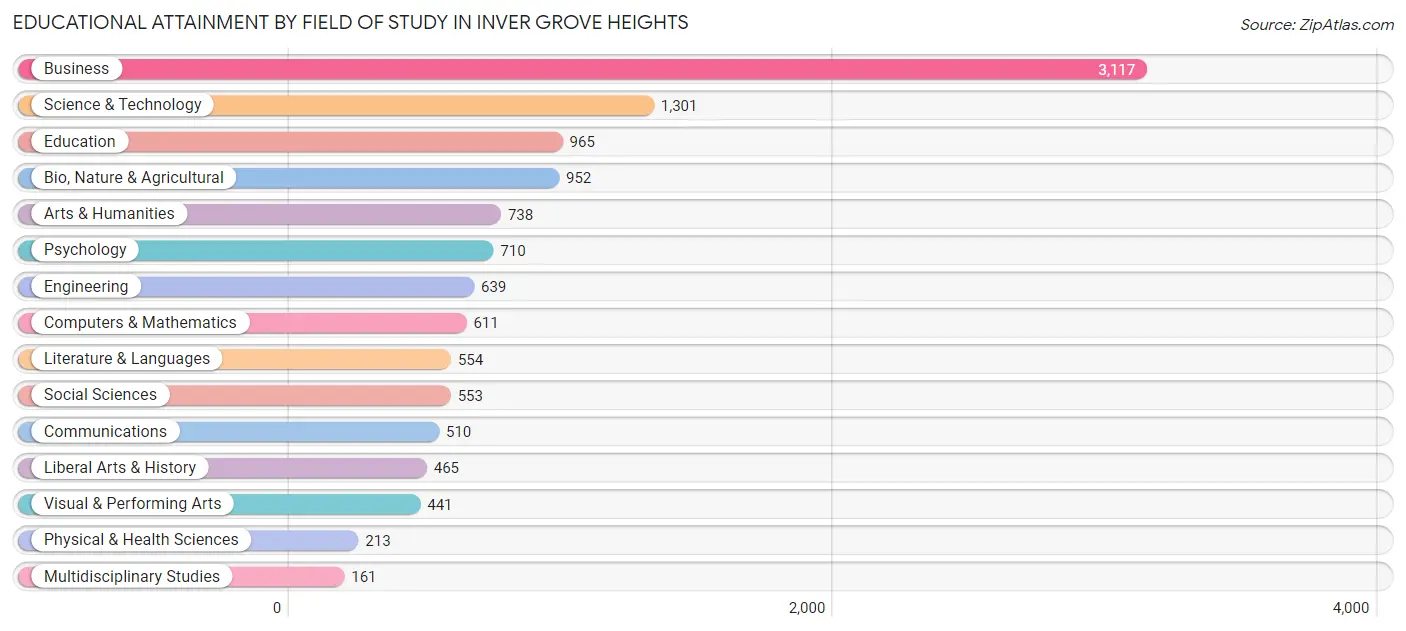
| Field of Study | # Graduates | % Graduates |
| Computers & Mathematics | 611 | 5.1% |
| Bio, Nature & Agricultural | 952 | 8.0% |
| Physical & Health Sciences | 213 | 1.8% |
| Psychology | 710 | 5.9% |
| Social Sciences | 553 | 4.6% |
| Engineering | 639 | 5.4% |
| Multidisciplinary Studies | 161 | 1.3% |
| Science & Technology | 1,301 | 10.9% |
| Business | 3,117 | 26.1% |
| Education | 965 | 8.1% |
| Literature & Languages | 554 | 4.6% |
| Liberal Arts & History | 465 | 3.9% |
| Visual & Performing Arts | 441 | 3.7% |
| Communications | 510 | 4.3% |
| Arts & Humanities | 738 | 6.2% |
| Total | 11,930 | 100.0% |
Transportation & Commute in Inver Grove Heights
Vehicle Availability by Sex in Inver Grove Heights
The most prevalent vehicle ownership categories in Inver Grove Heights are males with 2 vehicles (4,930, accounting for 47.7%) and females with 2 vehicles (4,041, making up 55.1%).
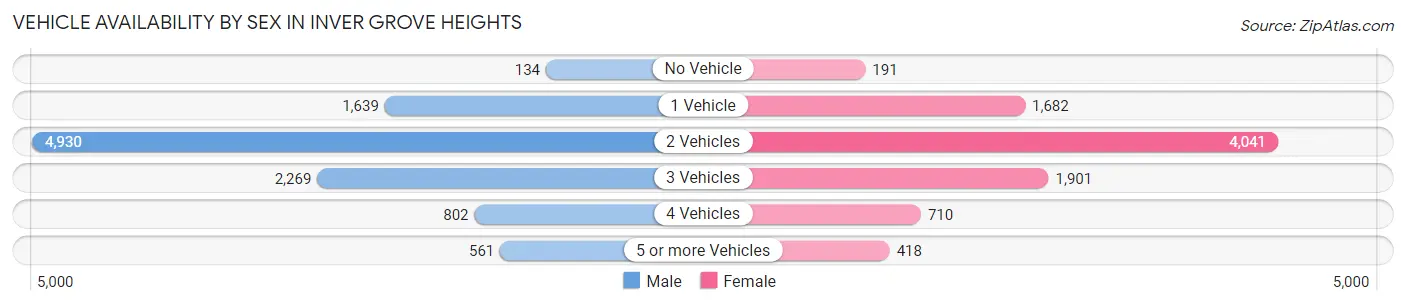
| Vehicles Available | Male | Female |
| No Vehicle | 134 (1.3%) | 191 (2.1%) |
| 1 Vehicle | 1,639 (15.9%) | 1,682 (18.8%) |
| 2 Vehicles | 4,930 (47.7%) | 4,041 (45.2%) |
| 3 Vehicles | 2,269 (22.0%) | 1,901 (21.3%) |
| 4 Vehicles | 802 (7.8%) | 710 (7.9%) |
| 5 or more Vehicles | 561 (5.4%) | 418 (4.7%) |
| Total | 10,335 (100.0%) | 8,943 (100.0%) |
Commute Time in Inver Grove Heights
The most frequently occuring commute durations in Inver Grove Heights are 30 to 34 minutes (2,502 commuters, 16.0%), 15 to 19 minutes (2,428 commuters, 15.5%), and 20 to 24 minutes (2,423 commuters, 15.5%).
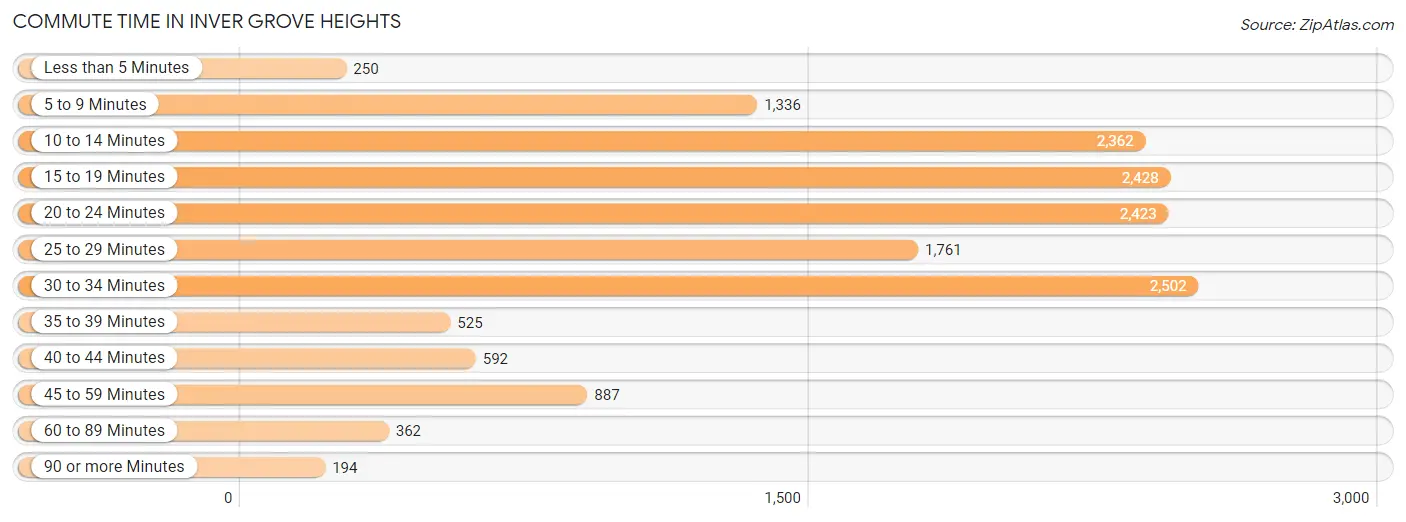
| Commute Time | # Commuters | % Commuters |
| Less than 5 Minutes | 250 | 1.6% |
| 5 to 9 Minutes | 1,336 | 8.6% |
| 10 to 14 Minutes | 2,362 | 15.1% |
| 15 to 19 Minutes | 2,428 | 15.5% |
| 20 to 24 Minutes | 2,423 | 15.5% |
| 25 to 29 Minutes | 1,761 | 11.3% |
| 30 to 34 Minutes | 2,502 | 16.0% |
| 35 to 39 Minutes | 525 | 3.4% |
| 40 to 44 Minutes | 592 | 3.8% |
| 45 to 59 Minutes | 887 | 5.7% |
| 60 to 89 Minutes | 362 | 2.3% |
| 90 or more Minutes | 194 | 1.2% |
Commute Time by Sex in Inver Grove Heights
The most common commute times in Inver Grove Heights are 30 to 34 minutes (1,457 commuters, 16.7%) for males and 15 to 19 minutes (1,179 commuters, 17.1%) for females.
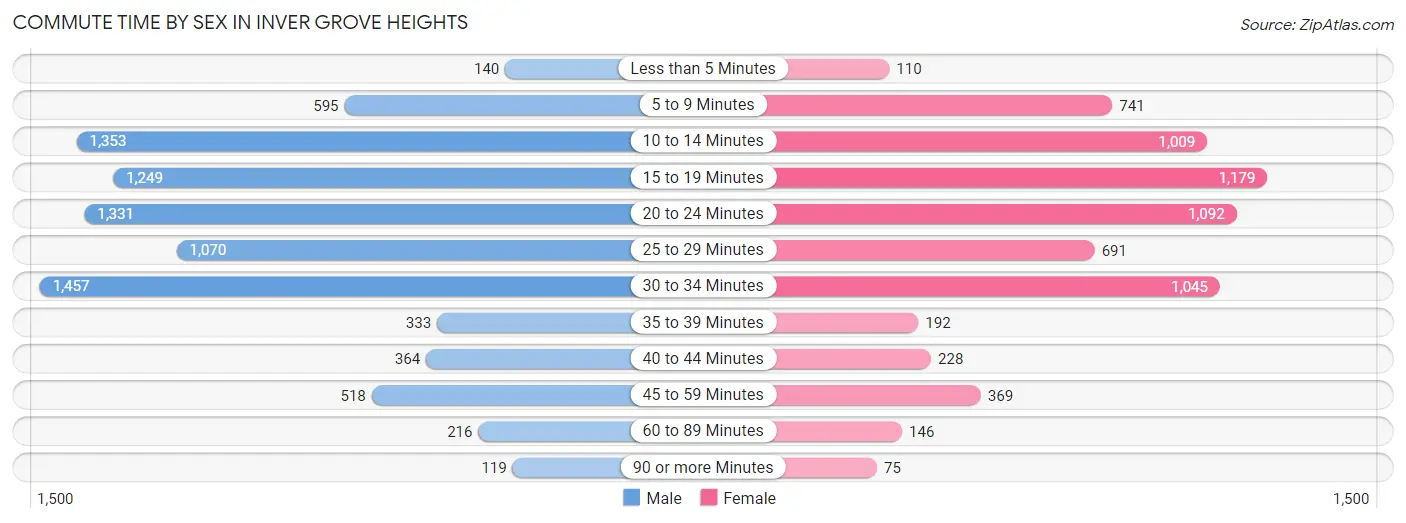
| Commute Time | Male | Female |
| Less than 5 Minutes | 140 (1.6%) | 110 (1.6%) |
| 5 to 9 Minutes | 595 (6.8%) | 741 (10.8%) |
| 10 to 14 Minutes | 1,353 (15.5%) | 1,009 (14.7%) |
| 15 to 19 Minutes | 1,249 (14.3%) | 1,179 (17.1%) |
| 20 to 24 Minutes | 1,331 (15.2%) | 1,092 (15.9%) |
| 25 to 29 Minutes | 1,070 (12.2%) | 691 (10.1%) |
| 30 to 34 Minutes | 1,457 (16.7%) | 1,045 (15.2%) |
| 35 to 39 Minutes | 333 (3.8%) | 192 (2.8%) |
| 40 to 44 Minutes | 364 (4.2%) | 228 (3.3%) |
| 45 to 59 Minutes | 518 (5.9%) | 369 (5.4%) |
| 60 to 89 Minutes | 216 (2.5%) | 146 (2.1%) |
| 90 or more Minutes | 119 (1.4%) | 75 (1.1%) |
Time of Departure to Work by Sex in Inver Grove Heights
The most frequent times of departure to work in Inver Grove Heights are 7:30 AM to 7:59 AM (1,318, 15.1%) for males and 7:00 AM to 7:29 AM (1,474, 21.4%) for females.
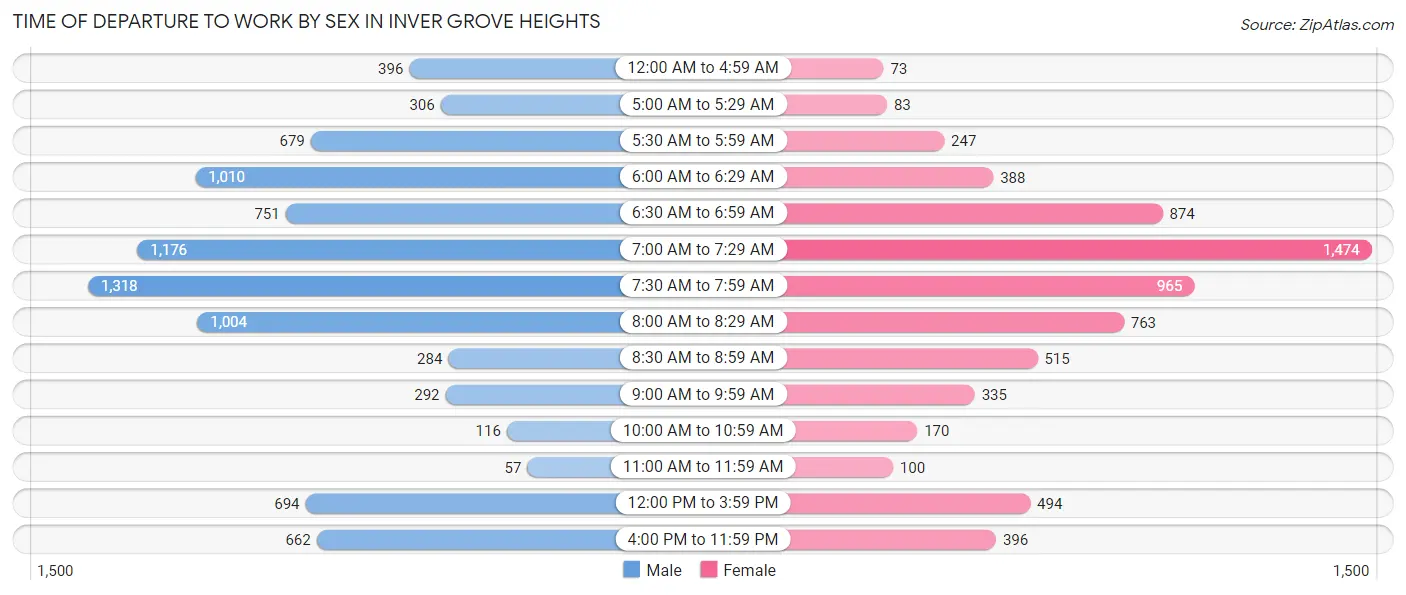
| Time of Departure | Male | Female |
| 12:00 AM to 4:59 AM | 396 (4.5%) | 73 (1.1%) |
| 5:00 AM to 5:29 AM | 306 (3.5%) | 83 (1.2%) |
| 5:30 AM to 5:59 AM | 679 (7.8%) | 247 (3.6%) |
| 6:00 AM to 6:29 AM | 1,010 (11.6%) | 388 (5.6%) |
| 6:30 AM to 6:59 AM | 751 (8.6%) | 874 (12.7%) |
| 7:00 AM to 7:29 AM | 1,176 (13.5%) | 1,474 (21.4%) |
| 7:30 AM to 7:59 AM | 1,318 (15.1%) | 965 (14.0%) |
| 8:00 AM to 8:29 AM | 1,004 (11.5%) | 763 (11.1%) |
| 8:30 AM to 8:59 AM | 284 (3.3%) | 515 (7.5%) |
| 9:00 AM to 9:59 AM | 292 (3.3%) | 335 (4.9%) |
| 10:00 AM to 10:59 AM | 116 (1.3%) | 170 (2.5%) |
| 11:00 AM to 11:59 AM | 57 (0.6%) | 100 (1.5%) |
| 12:00 PM to 3:59 PM | 694 (7.9%) | 494 (7.2%) |
| 4:00 PM to 11:59 PM | 662 (7.6%) | 396 (5.8%) |
| Total | 8,745 (100.0%) | 6,877 (100.0%) |
Housing Occupancy in Inver Grove Heights
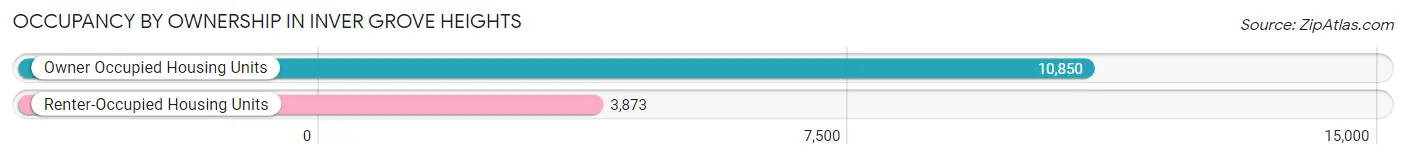
Occupancy by Ownership in Inver Grove Heights
Of the total 14,723 dwellings in Inver Grove Heights, owner-occupied units account for 10,850 (73.7%), while renter-occupied units make up 3,873 (26.3%).
| Occupancy | # Housing Units | % Housing Units |
| Owner Occupied Housing Units | 10,850 | 73.7% |
| Renter-Occupied Housing Units | 3,873 | 26.3% |
| Total Occupied Housing Units | 14,723 | 100.0% |
Occupancy by Household Size in Inver Grove Heights
| Household Size | # Housing Units | % Housing Units |
| 1-Person Household | 3,810 | 25.9% |
| 2-Person Household | 5,976 | 40.6% |
| 3-Person Household | 1,845 | 12.5% |
| 4+ Person Household | 3,092 | 21.0% |
| Total Housing Units | 14,723 | 100.0% |
Occupancy by Ownership by Household Size in Inver Grove Heights
| Household Size | Owner-occupied | Renter-occupied |
| 1-Person Household | 1,970 (51.7%) | 1,840 (48.3%) |
| 2-Person Household | 4,905 (82.1%) | 1,071 (17.9%) |
| 3-Person Household | 1,519 (82.3%) | 326 (17.7%) |
| 4+ Person Household | 2,456 (79.4%) | 636 (20.6%) |
| Total Housing Units | 10,850 (73.7%) | 3,873 (26.3%) |
Occupancy by Educational Attainment in Inver Grove Heights
| Household Size | Owner-occupied | Renter-occupied |
| Less than High School | 336 (50.4%) | 331 (49.6%) |
| High School Diploma | 2,228 (65.0%) | 1,201 (35.0%) |
| College/Associate Degree | 2,998 (74.3%) | 1,036 (25.7%) |
| Bachelor's Degree or higher | 5,288 (80.2%) | 1,305 (19.8%) |
Occupancy by Age of Householder in Inver Grove Heights
| Age Bracket | # Households | % Households |
| Under 35 Years | 2,048 | 13.9% |
| 35 to 44 Years | 2,660 | 18.1% |
| 45 to 54 Years | 3,045 | 20.7% |
| 55 to 64 Years | 3,189 | 21.7% |
| 65 to 74 Years | 2,330 | 15.8% |
| 75 to 84 Years | 1,068 | 7.2% |
| 85 Years and Over | 383 | 2.6% |
| Total | 14,723 | 100.0% |
Housing Finances in Inver Grove Heights
Median Income by Occupancy in Inver Grove Heights
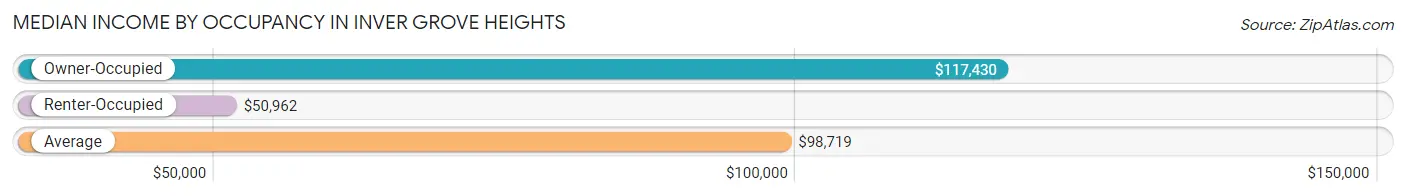
| Occupancy Type | # Households | Median Income |
| Owner-Occupied | 10,850 (73.7%) | $117,430 |
| Renter-Occupied | 3,873 (26.3%) | $50,962 |
| Average | 14,723 (100.0%) | $98,719 |
Occupancy by Householder Income Bracket in Inver Grove Heights
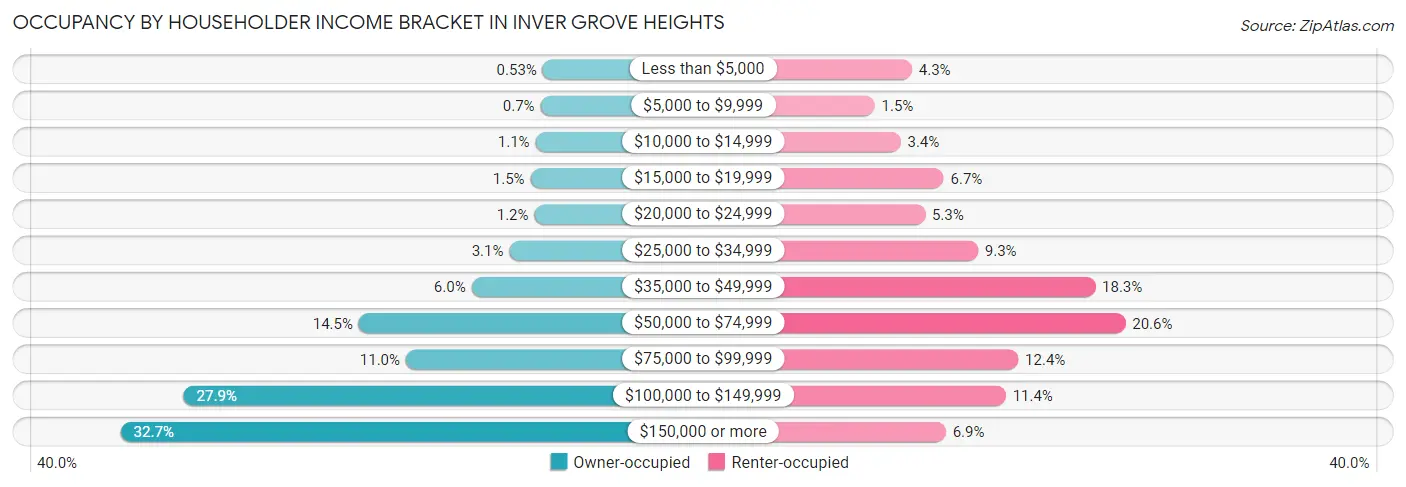
| Income Bracket | Owner-occupied | Renter-occupied |
| Less than $5,000 | 57 (0.5%) | 166 (4.3%) |
| $5,000 to $9,999 | 76 (0.7%) | 56 (1.5%) |
| $10,000 to $14,999 | 117 (1.1%) | 133 (3.4%) |
| $15,000 to $19,999 | 158 (1.5%) | 260 (6.7%) |
| $20,000 to $24,999 | 126 (1.2%) | 205 (5.3%) |
| $25,000 to $34,999 | 333 (3.1%) | 361 (9.3%) |
| $35,000 to $49,999 | 646 (5.9%) | 707 (18.2%) |
| $50,000 to $74,999 | 1,578 (14.5%) | 796 (20.5%) |
| $75,000 to $99,999 | 1,188 (11.0%) | 480 (12.4%) |
| $100,000 to $149,999 | 3,025 (27.9%) | 443 (11.4%) |
| $150,000 or more | 3,546 (32.7%) | 266 (6.9%) |
| Total | 10,850 (100.0%) | 3,873 (100.0%) |
Monthly Housing Cost Tiers in Inver Grove Heights
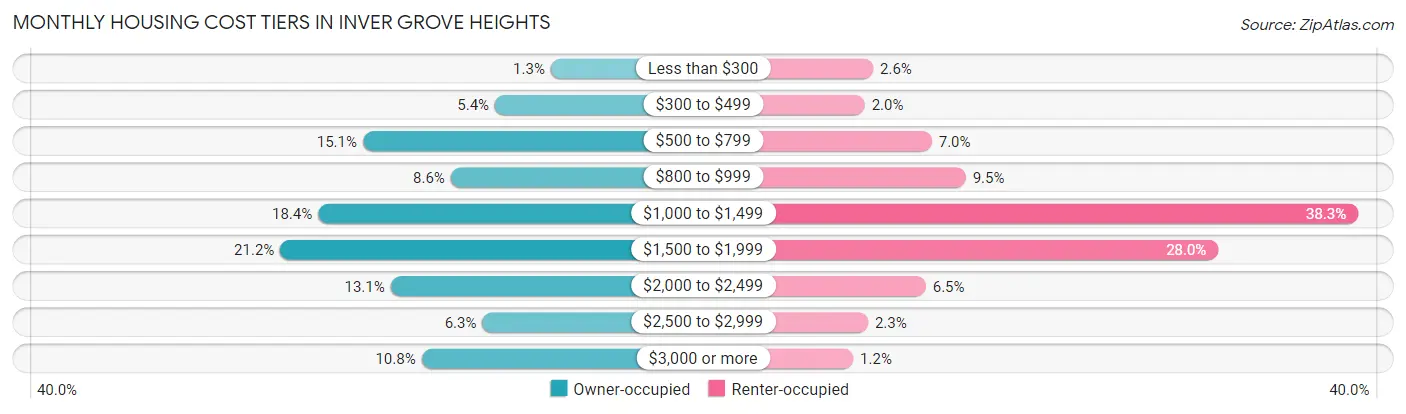
| Monthly Cost | Owner-occupied | Renter-occupied |
| Less than $300 | 136 (1.3%) | 102 (2.6%) |
| $300 to $499 | 582 (5.4%) | 78 (2.0%) |
| $500 to $799 | 1,637 (15.1%) | 269 (7.0%) |
| $800 to $999 | 935 (8.6%) | 366 (9.5%) |
| $1,000 to $1,499 | 1,995 (18.4%) | 1,485 (38.3%) |
| $1,500 to $1,999 | 2,298 (21.2%) | 1,086 (28.0%) |
| $2,000 to $2,499 | 1,416 (13.1%) | 252 (6.5%) |
| $2,500 to $2,999 | 682 (6.3%) | 87 (2.2%) |
| $3,000 or more | 1,169 (10.8%) | 45 (1.2%) |
| Total | 10,850 (100.0%) | 3,873 (100.0%) |
Physical Housing Characteristics in Inver Grove Heights
Housing Structures in Inver Grove Heights
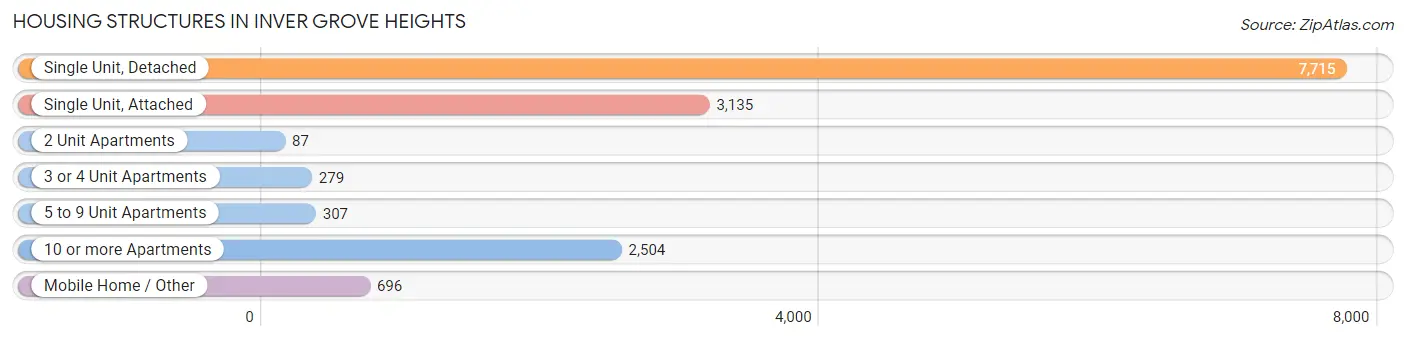
| Structure Type | # Housing Units | % Housing Units |
| Single Unit, Detached | 7,715 | 52.4% |
| Single Unit, Attached | 3,135 | 21.3% |
| 2 Unit Apartments | 87 | 0.6% |
| 3 or 4 Unit Apartments | 279 | 1.9% |
| 5 to 9 Unit Apartments | 307 | 2.1% |
| 10 or more Apartments | 2,504 | 17.0% |
| Mobile Home / Other | 696 | 4.7% |
| Total | 14,723 | 100.0% |
Housing Structures by Occupancy in Inver Grove Heights
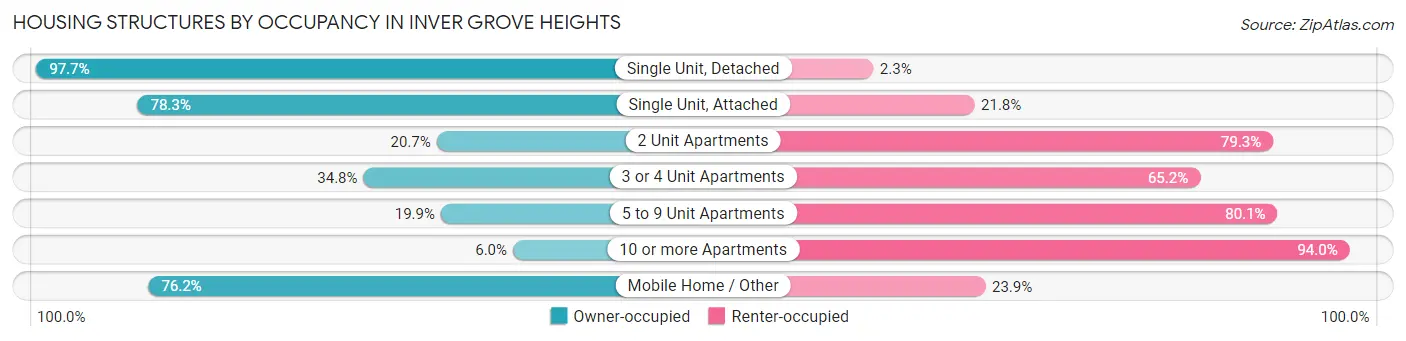
| Structure Type | Owner-occupied | Renter-occupied |
| Single Unit, Detached | 7,541 (97.7%) | 174 (2.3%) |
| Single Unit, Attached | 2,453 (78.2%) | 682 (21.7%) |
| 2 Unit Apartments | 18 (20.7%) | 69 (79.3%) |
| 3 or 4 Unit Apartments | 97 (34.8%) | 182 (65.2%) |
| 5 to 9 Unit Apartments | 61 (19.9%) | 246 (80.1%) |
| 10 or more Apartments | 150 (6.0%) | 2,354 (94.0%) |
| Mobile Home / Other | 530 (76.1%) | 166 (23.8%) |
| Total | 10,850 (73.7%) | 3,873 (26.3%) |
Housing Structures by Number of Rooms in Inver Grove Heights
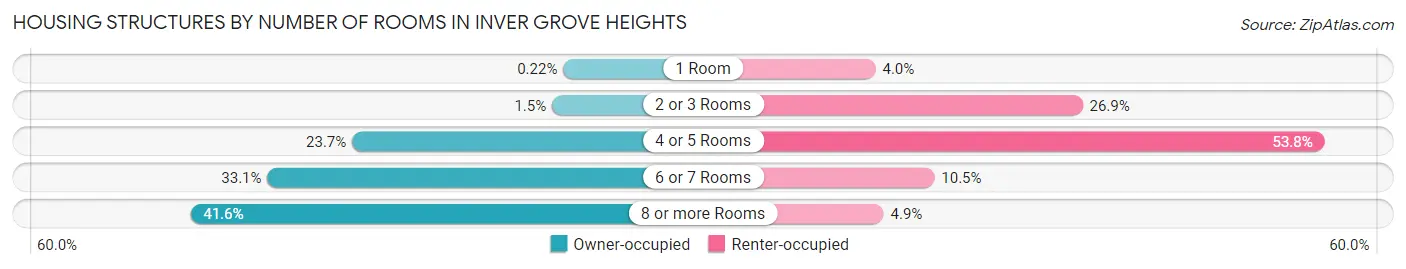
| Number of Rooms | Owner-occupied | Renter-occupied |
| 1 Room | 24 (0.2%) | 153 (4.0%) |
| 2 or 3 Rooms | 158 (1.5%) | 1,043 (26.9%) |
| 4 or 5 Rooms | 2,566 (23.6%) | 2,083 (53.8%) |
| 6 or 7 Rooms | 3,587 (33.1%) | 406 (10.5%) |
| 8 or more Rooms | 4,515 (41.6%) | 188 (4.9%) |
| Total | 10,850 (100.0%) | 3,873 (100.0%) |
Housing Structure by Heating Type in Inver Grove Heights
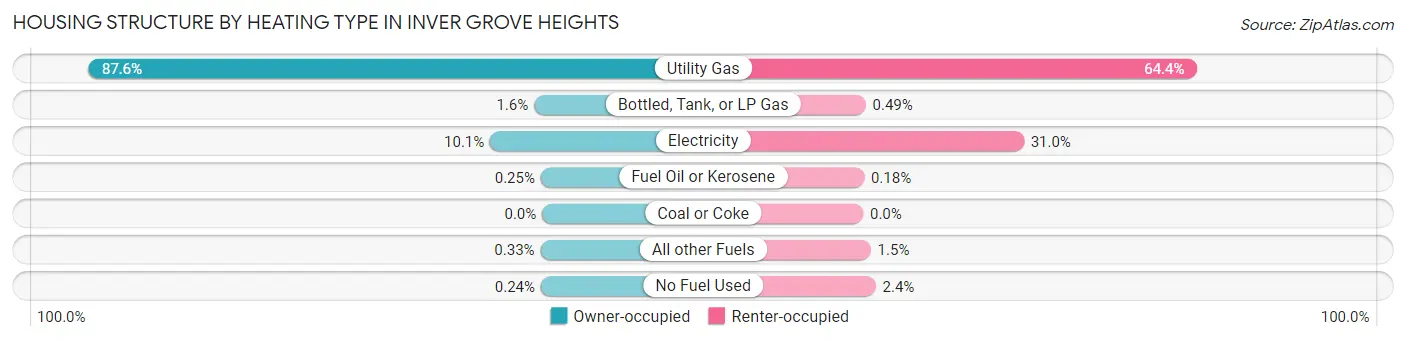
| Heating Type | Owner-occupied | Renter-occupied |
| Utility Gas | 9,502 (87.6%) | 2,494 (64.4%) |
| Bottled, Tank, or LP Gas | 169 (1.6%) | 19 (0.5%) |
| Electricity | 1,090 (10.1%) | 1,202 (31.0%) |
| Fuel Oil or Kerosene | 27 (0.3%) | 7 (0.2%) |
| Coal or Coke | 0 (0.0%) | 0 (0.0%) |
| All other Fuels | 36 (0.3%) | 57 (1.5%) |
| No Fuel Used | 26 (0.2%) | 94 (2.4%) |
| Total | 10,850 (100.0%) | 3,873 (100.0%) |
Household Vehicle Usage in Inver Grove Heights
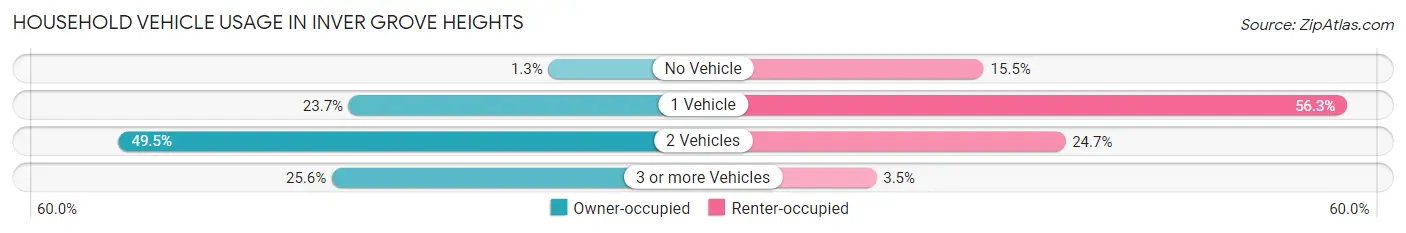
| Vehicles per Household | Owner-occupied | Renter-occupied |
| No Vehicle | 142 (1.3%) | 602 (15.5%) |
| 1 Vehicle | 2,568 (23.7%) | 2,179 (56.3%) |
| 2 Vehicles | 5,368 (49.5%) | 956 (24.7%) |
| 3 or more Vehicles | 2,772 (25.6%) | 136 (3.5%) |
| Total | 10,850 (100.0%) | 3,873 (100.0%) |
Real Estate & Mortgages in Inver Grove Heights
Real Estate and Mortgage Overview in Inver Grove Heights
| Characteristic | Without Mortgage | With Mortgage |
| Housing Units | 3,506 | 7,344 |
| Median Property Value | $323,600 | $342,500 |
| Median Household Income | $100,917 | $2,673 |
| Monthly Housing Costs | $698 | $1,131 |
| Real Estate Taxes | $3,209 | $118 |
Property Value by Mortgage Status in Inver Grove Heights
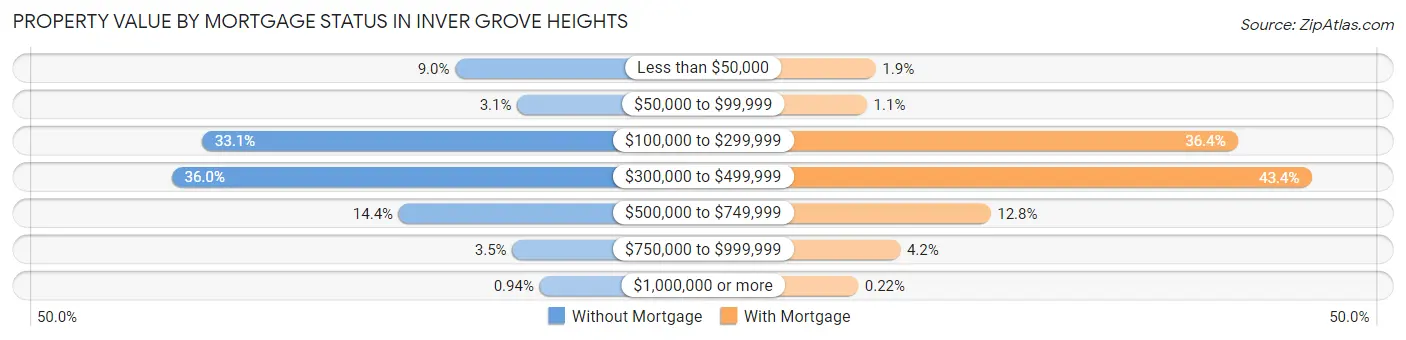
| Property Value | Without Mortgage | With Mortgage |
| Less than $50,000 | 315 (9.0%) | 139 (1.9%) |
| $50,000 to $99,999 | 108 (3.1%) | 78 (1.1%) |
| $100,000 to $299,999 | 1,161 (33.1%) | 2,671 (36.4%) |
| $300,000 to $499,999 | 1,262 (36.0%) | 3,187 (43.4%) |
| $500,000 to $749,999 | 503 (14.3%) | 942 (12.8%) |
| $750,000 to $999,999 | 124 (3.5%) | 311 (4.2%) |
| $1,000,000 or more | 33 (0.9%) | 16 (0.2%) |
| Total | 3,506 (100.0%) | 7,344 (100.0%) |
Household Income by Mortgage Status in Inver Grove Heights
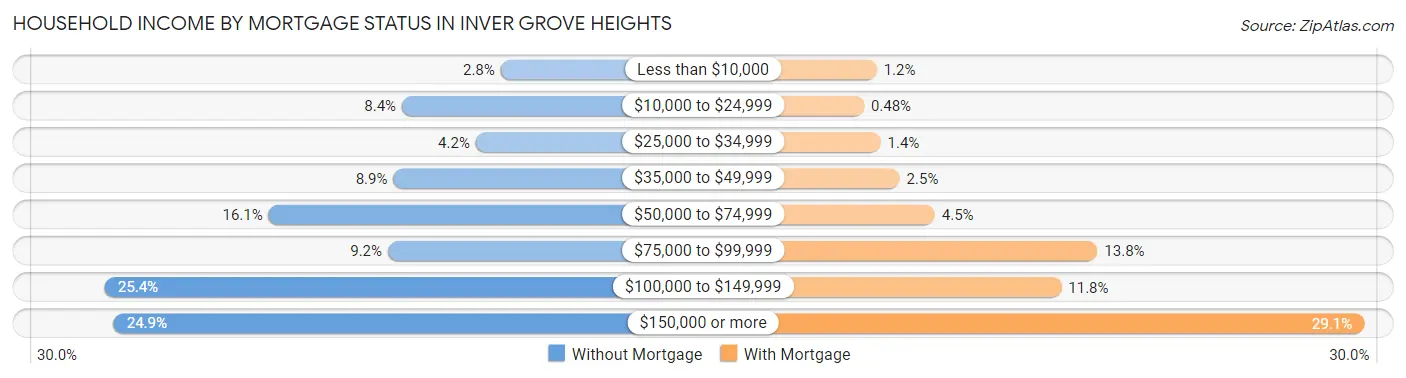
| Household Income | Without Mortgage | With Mortgage |
| Less than $10,000 | 98 (2.8%) | 89 (1.2%) |
| $10,000 to $24,999 | 296 (8.4%) | 35 (0.5%) |
| $25,000 to $34,999 | 148 (4.2%) | 105 (1.4%) |
| $35,000 to $49,999 | 313 (8.9%) | 185 (2.5%) |
| $50,000 to $74,999 | 563 (16.1%) | 333 (4.5%) |
| $75,000 to $99,999 | 324 (9.2%) | 1,015 (13.8%) |
| $100,000 to $149,999 | 891 (25.4%) | 864 (11.8%) |
| $150,000 or more | 873 (24.9%) | 2,134 (29.1%) |
| Total | 3,506 (100.0%) | 7,344 (100.0%) |
Property Value to Household Income Ratio in Inver Grove Heights
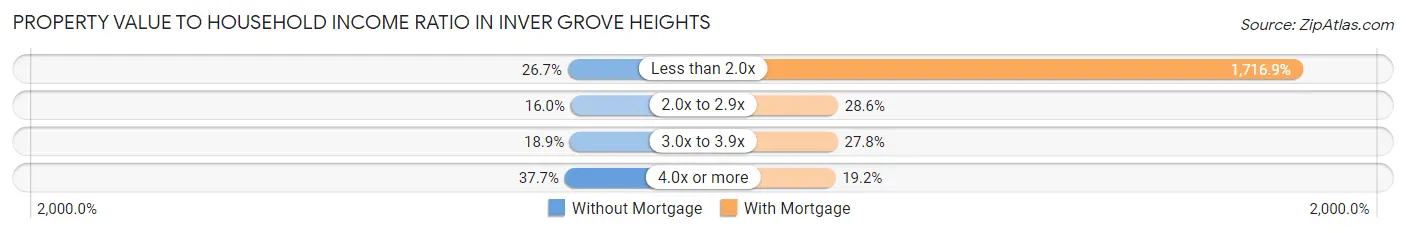
| Value-to-Income Ratio | Without Mortgage | With Mortgage |
| Less than 2.0x | 936 (26.7%) | 126,087 (1,716.9%) |
| 2.0x to 2.9x | 560 (16.0%) | 2,100 (28.6%) |
| 3.0x to 3.9x | 663 (18.9%) | 2,041 (27.8%) |
| 4.0x or more | 1,323 (37.7%) | 1,410 (19.2%) |
| Total | 3,506 (100.0%) | 7,344 (100.0%) |
Real Estate Taxes by Mortgage Status in Inver Grove Heights
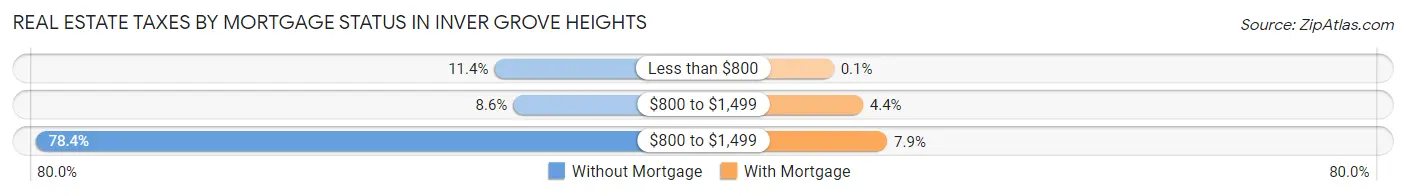
| Property Taxes | Without Mortgage | With Mortgage |
| Less than $800 | 399 (11.4%) | 7 (0.1%) |
| $800 to $1,499 | 302 (8.6%) | 320 (4.4%) |
| $800 to $1,499 | 2,748 (78.4%) | 581 (7.9%) |
| Total | 3,506 (100.0%) | 7,344 (100.0%) |
Health & Disability in Inver Grove Heights
Health Insurance Coverage by Age in Inver Grove Heights
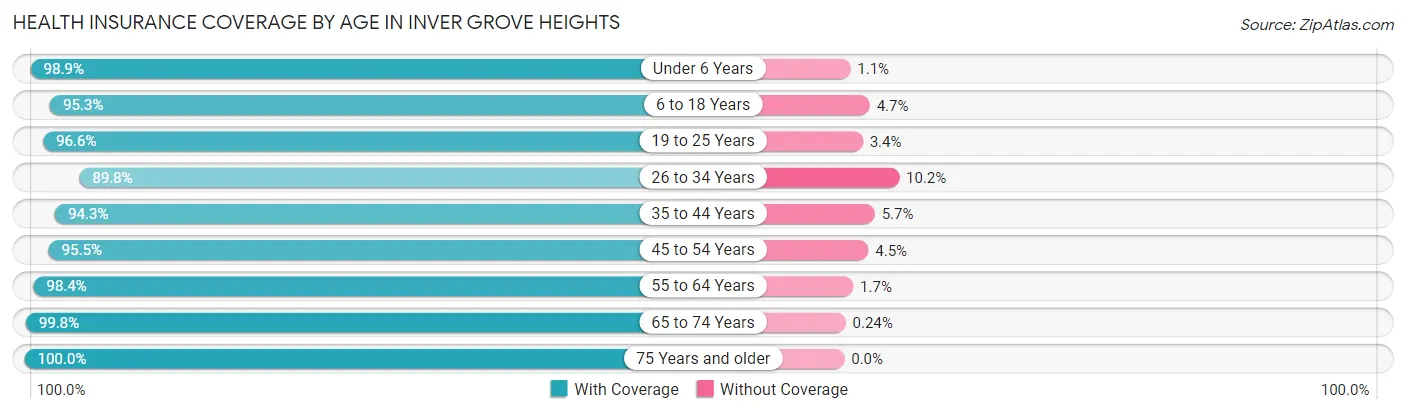
| Age Bracket | With Coverage | Without Coverage |
| Under 6 Years | 2,006 (98.9%) | 23 (1.1%) |
| 6 to 18 Years | 5,648 (95.3%) | 281 (4.7%) |
| 19 to 25 Years | 2,527 (96.6%) | 90 (3.4%) |
| 26 to 34 Years | 3,407 (89.8%) | 388 (10.2%) |
| 35 to 44 Years | 4,567 (94.3%) | 275 (5.7%) |
| 45 to 54 Years | 4,702 (95.5%) | 221 (4.5%) |
| 55 to 64 Years | 5,422 (98.4%) | 91 (1.7%) |
| 65 to 74 Years | 3,724 (99.8%) | 9 (0.2%) |
| 75 Years and older | 2,131 (100.0%) | 0 (0.0%) |
| Total | 34,134 (96.1%) | 1,378 (3.9%) |
Health Insurance Coverage by Citizenship Status in Inver Grove Heights
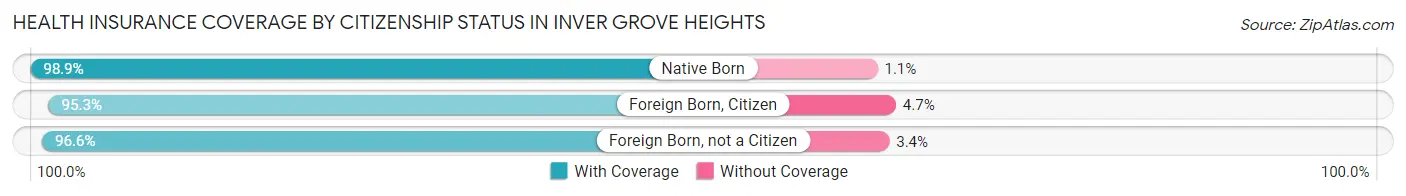
| Citizenship Status | With Coverage | Without Coverage |
| Native Born | 2,006 (98.9%) | 23 (1.1%) |
| Foreign Born, Citizen | 5,648 (95.3%) | 281 (4.7%) |
| Foreign Born, not a Citizen | 2,527 (96.6%) | 90 (3.4%) |
Health Insurance Coverage by Household Income in Inver Grove Heights
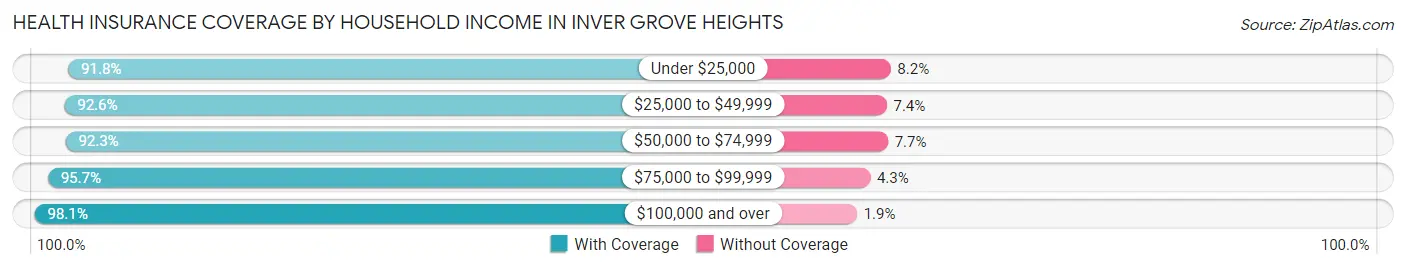
| Household Income | With Coverage | Without Coverage |
| Under $25,000 | 1,698 (91.8%) | 151 (8.2%) |
| $25,000 to $49,999 | 3,460 (92.6%) | 278 (7.4%) |
| $50,000 to $74,999 | 4,797 (92.3%) | 398 (7.7%) |
| $75,000 to $99,999 | 3,575 (95.7%) | 162 (4.3%) |
| $100,000 and over | 20,556 (98.1%) | 389 (1.9%) |
Public vs Private Health Insurance Coverage by Age in Inver Grove Heights
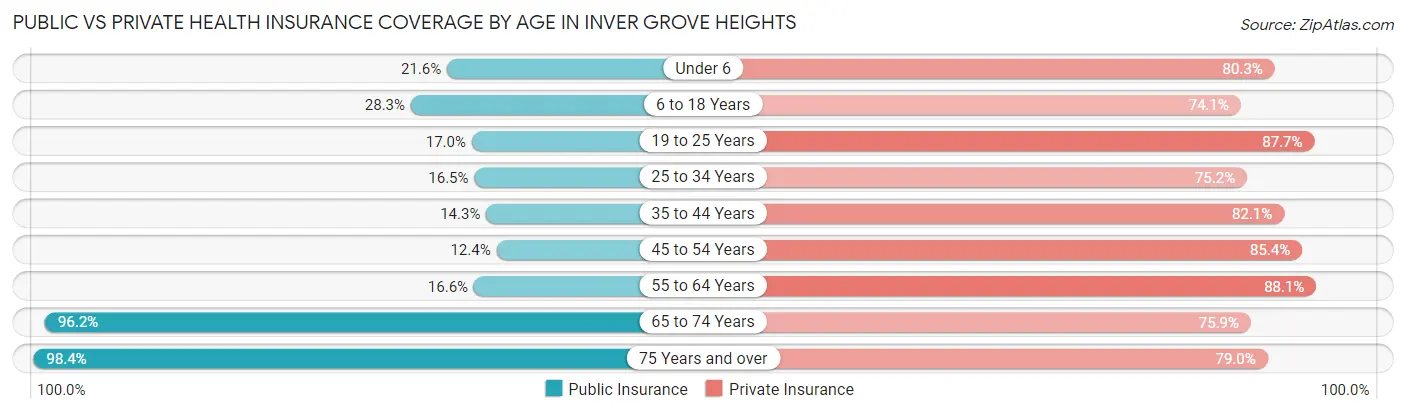
| Age Bracket | Public Insurance | Private Insurance |
| Under 6 | 438 (21.6%) | 1,630 (80.3%) |
| 6 to 18 Years | 1,678 (28.3%) | 4,391 (74.1%) |
| 19 to 25 Years | 445 (17.0%) | 2,295 (87.7%) |
| 25 to 34 Years | 627 (16.5%) | 2,854 (75.2%) |
| 35 to 44 Years | 693 (14.3%) | 3,975 (82.1%) |
| 45 to 54 Years | 611 (12.4%) | 4,206 (85.4%) |
| 55 to 64 Years | 915 (16.6%) | 4,854 (88.0%) |
| 65 to 74 Years | 3,592 (96.2%) | 2,834 (75.9%) |
| 75 Years and over | 2,096 (98.4%) | 1,684 (79.0%) |
| Total | 11,095 (31.2%) | 28,723 (80.9%) |
Disability Status by Sex by Age in Inver Grove Heights
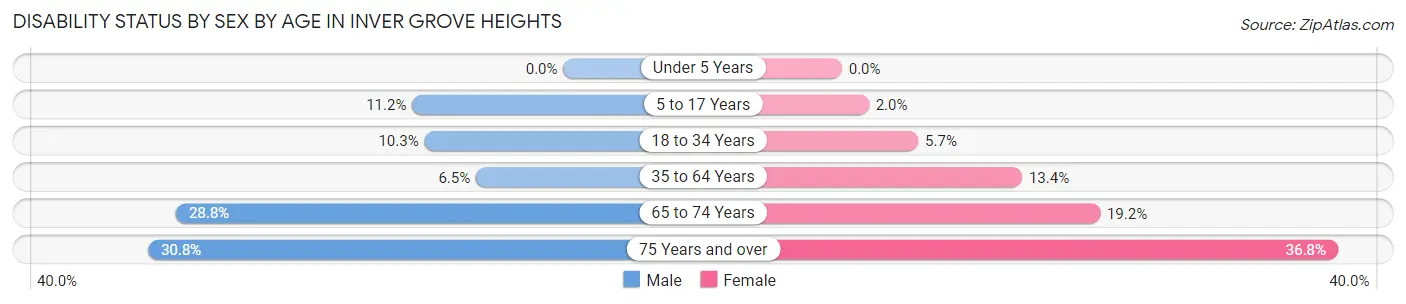
| Age Bracket | Male | Female |
| Under 5 Years | 0 (0.0%) | 0 (0.0%) |
| 5 to 17 Years | 334 (11.2%) | 59 (2.0%) |
| 18 to 34 Years | 342 (10.3%) | 195 (5.7%) |
| 35 to 64 Years | 492 (6.5%) | 1,028 (13.4%) |
| 65 to 74 Years | 514 (28.8%) | 373 (19.2%) |
| 75 Years and over | 272 (30.8%) | 460 (36.8%) |
Disability Class by Sex by Age in Inver Grove Heights
Disability Class: Hearing Difficulty
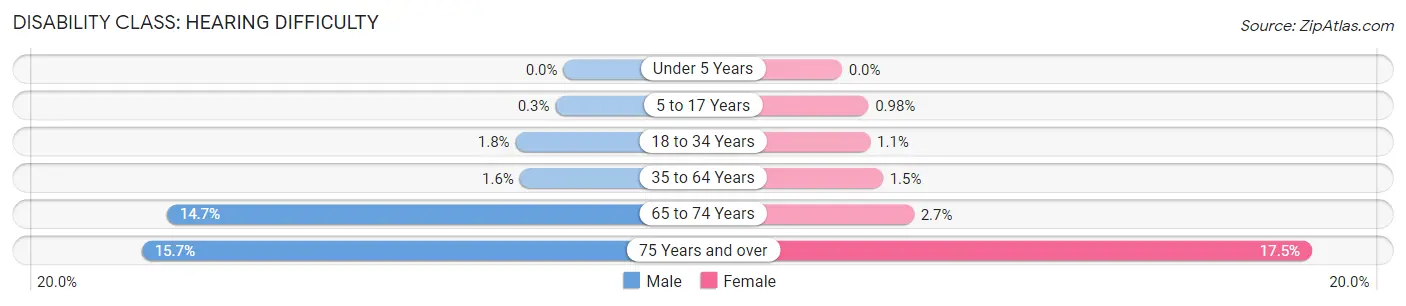
| Age Bracket | Male | Female |
| Under 5 Years | 0 (0.0%) | 0 (0.0%) |
| 5 to 17 Years | 9 (0.3%) | 29 (1.0%) |
| 18 to 34 Years | 59 (1.8%) | 36 (1.1%) |
| 35 to 64 Years | 123 (1.6%) | 117 (1.5%) |
| 65 to 74 Years | 263 (14.7%) | 52 (2.7%) |
| 75 Years and over | 138 (15.7%) | 218 (17.4%) |
Disability Class: Vision Difficulty
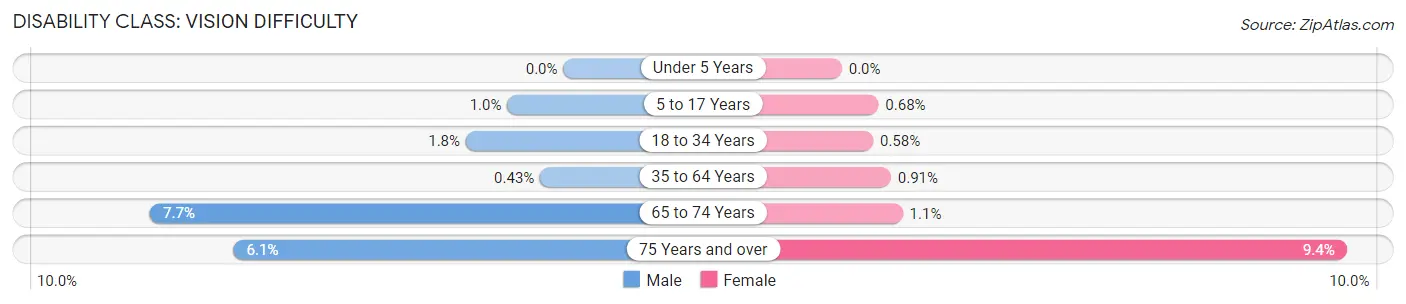
| Age Bracket | Male | Female |
| Under 5 Years | 0 (0.0%) | 0 (0.0%) |
| 5 to 17 Years | 31 (1.0%) | 20 (0.7%) |
| 18 to 34 Years | 60 (1.8%) | 20 (0.6%) |
| 35 to 64 Years | 33 (0.4%) | 70 (0.9%) |
| 65 to 74 Years | 137 (7.7%) | 22 (1.1%) |
| 75 Years and over | 54 (6.1%) | 117 (9.4%) |
Disability Class: Cognitive Difficulty
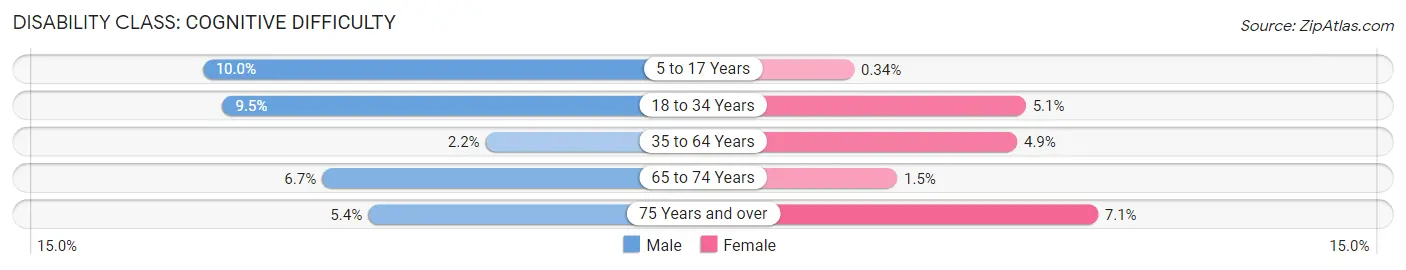
| Age Bracket | Male | Female |
| 5 to 17 Years | 299 (10.0%) | 10 (0.3%) |
| 18 to 34 Years | 315 (9.5%) | 176 (5.1%) |
| 35 to 64 Years | 165 (2.2%) | 375 (4.9%) |
| 65 to 74 Years | 120 (6.7%) | 30 (1.5%) |
| 75 Years and over | 48 (5.4%) | 89 (7.1%) |
Disability Class: Ambulatory Difficulty
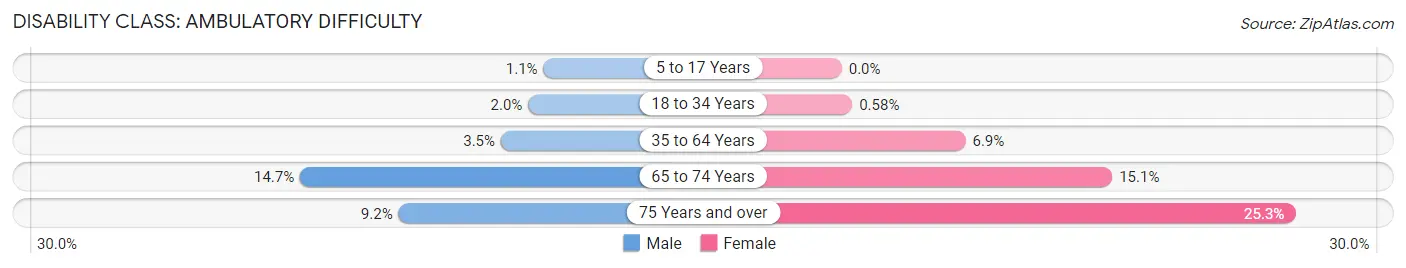
| Age Bracket | Male | Female |
| 5 to 17 Years | 33 (1.1%) | 0 (0.0%) |
| 18 to 34 Years | 65 (2.0%) | 20 (0.6%) |
| 35 to 64 Years | 264 (3.5%) | 529 (6.9%) |
| 65 to 74 Years | 262 (14.7%) | 293 (15.1%) |
| 75 Years and over | 81 (9.2%) | 316 (25.3%) |
Disability Class: Self-Care Difficulty
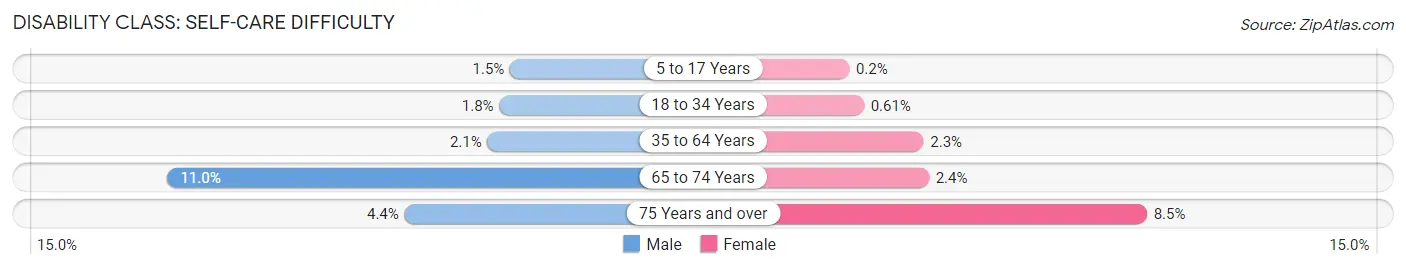
| Age Bracket | Male | Female |
| 5 to 17 Years | 44 (1.5%) | 6 (0.2%) |
| 18 to 34 Years | 59 (1.8%) | 21 (0.6%) |
| 35 to 64 Years | 160 (2.1%) | 174 (2.3%) |
| 65 to 74 Years | 197 (11.0%) | 47 (2.4%) |
| 75 Years and over | 39 (4.4%) | 106 (8.5%) |
Technology Access in Inver Grove Heights
Computing Device Access in Inver Grove Heights
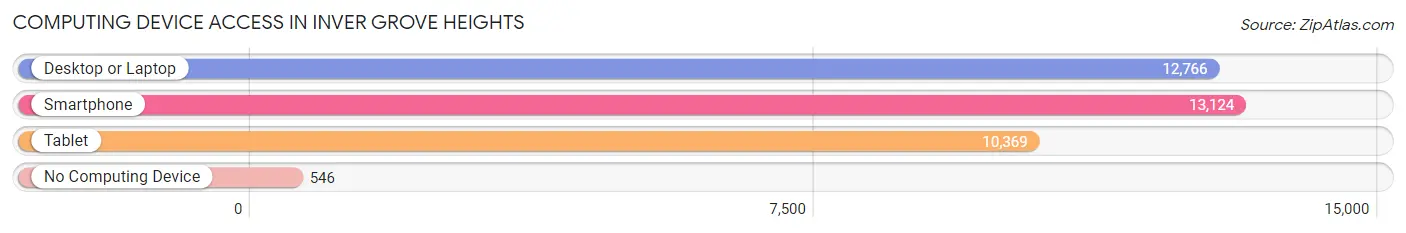
| Device Type | # Households | % Households |
| Desktop or Laptop | 12,766 | 86.7% |
| Smartphone | 13,124 | 89.1% |
| Tablet | 10,369 | 70.4% |
| No Computing Device | 546 | 3.7% |
| Total | 14,723 | 100.0% |
Internet Access in Inver Grove Heights
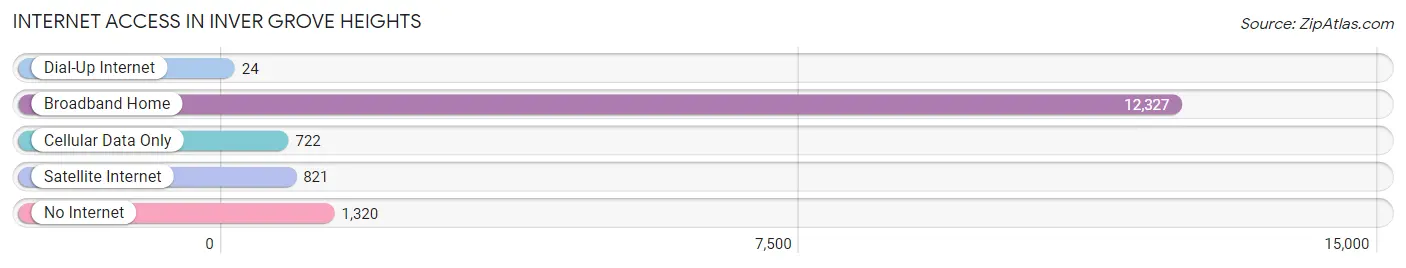
| Internet Type | # Households | % Households |
| Dial-Up Internet | 24 | 0.2% |
| Broadband Home | 12,327 | 83.7% |
| Cellular Data Only | 722 | 4.9% |
| Satellite Internet | 821 | 5.6% |
| No Internet | 1,320 | 9.0% |
| Total | 14,723 | 100.0% |
Inver Grove Heights Summary
Inver Grove Heights is a city located in Dakota County, Minnesota, United States. The population was 33,880 at the 2010 census. It is one of 186 cities and townships in the seven-county Minneapolis-St. Paul metropolitan area.
History
Inver Grove Heights was first settled in 1843 by Irish immigrants. The city was originally known as Inver Grove, named after the nearby Inver Grove Creek. The city was incorporated in 1971, and the name was changed to Inver Grove Heights in 1973.
Geography
Inver Grove Heights is located at the confluence of the Mississippi and Minnesota Rivers. The city is bordered by the cities of South St. Paul, Mendota Heights, and Eagan. The city is located approximately 10 miles south of downtown St. Paul and 20 miles north of Minneapolis.
The city has a total area of 11.2 square miles, of which 11.1 square miles is land and 0.1 square miles is water.
Economy
Inver Grove Heights is home to several large employers, including 3M, Ecolab, and Andersen Windows. The city also has a number of smaller businesses, including restaurants, retail stores, and professional services.
The city has a strong industrial base, with a number of manufacturing and distribution companies located in the city. Inver Grove Heights is also home to the Inver Grove Heights Business Park, which is home to a number of businesses, including a medical device manufacturer, a printing company, and a software company.
Demographics
As of the 2010 census, there were 33,880 people, 13,845 households, and 8,845 families residing in the city. The population density was 3,039.2 people per square mile. The racial makeup of the city was 87.2% White, 4.3% African American, 0.5% Native American, 4.2% Asian, 0.1% Pacific Islander, 1.7% from other races, and 2.1% from two or more races. Hispanic or Latino of any race were 4.7% of the population.
The median income for a household in the city was $60,945, and the median income for a family was $76,945. The per capita income for the city was $29,945. About 3.2% of families and 4.7% of the population were below the poverty line, including 5.3% of those under age 18 and 4.2% of those age 65 or over.
Inver Grove Heights is a diverse city, with a variety of cultures and backgrounds represented. The city is home to a large Somali population, as well as a growing Hispanic population. The city also has a large number of immigrants from other countries, including India, China, and Vietnam.
Common Questions
What is Per Capita Income in Inver Grove Heights?
Per Capita income in Inver Grove Heights is $51,175.
What is the Median Family Income in Inver Grove Heights?
Median Family Income in Inver Grove Heights is $119,116.
What is the Median Household income in Inver Grove Heights?
Median Household Income in Inver Grove Heights is $98,719.
What is Income or Wage Gap in Inver Grove Heights?
Income or Wage Gap in Inver Grove Heights is 25.7%.
Women in Inver Grove Heights earn 74.3 cents for every dollar earned by a man.
What is Inequality or Gini Index in Inver Grove Heights?
Inequality or Gini Index in Inver Grove Heights is 0.43.
What is the Total Population of Inver Grove Heights?
Total Population of Inver Grove Heights is 35,673.
What is the Total Male Population of Inver Grove Heights?
Total Male Population of Inver Grove Heights is 17,441.
What is the Total Female Population of Inver Grove Heights?
Total Female Population of Inver Grove Heights is 18,232.
What is the Ratio of Males per 100 Females in Inver Grove Heights?
There are 95.66 Males per 100 Females in Inver Grove Heights.
What is the Ratio of Females per 100 Males in Inver Grove Heights?
There are 104.54 Females per 100 Males in Inver Grove Heights.
What is the Median Population Age in Inver Grove Heights?
Median Population Age in Inver Grove Heights is 41.4 Years.
What is the Average Family Size in Inver Grove Heights
Average Family Size in Inver Grove Heights is 2.9 People.
What is the Average Household Size in Inver Grove Heights
Average Household Size in Inver Grove Heights is 2.4 People.
How Large is the Labor Force in Inver Grove Heights?
There are 20,354 People in the Labor Forcein in Inver Grove Heights.
What is the Percentage of People in the Labor Force in Inver Grove Heights?
70.3% of People are in the Labor Force in Inver Grove Heights.
What is the Unemployment Rate in Inver Grove Heights?
Unemployment Rate in Inver Grove Heights is 3.2%.