Monument, NM Map & Demographics
Monument Map
Monument Overview
$54,539
PER CAPITA INCOME
0.39
INEQUALITY / GINI INDEX
129
TOTAL POPULATION
65
MALE POPULATION
64
FEMALE POPULATION
101.56
MALES / 100 FEMALES
98.46
FEMALES / 100 MALES
60.2
MEDIAN AGE
2.2
AVG FAMILY SIZE
2.1
AVG HOUSEHOLD SIZE
62
LABOR FORCE [ PEOPLE ]
48.1%
PERCENT IN LABOR FORCE
Monument Zip Codes
Monument Area Codes
Income in Monument
Income Overview in Monument
| Characteristic | Number | Measure |
| Per Capita Income | 129 | $54,539 |
| Median Family Income | 55 | $0 |
| Mean Family Income | 55 | $112,136 |
| Median Household Income | 61 | $0 |
| Mean Household Income | 61 | $106,295 |
| Income Deficit | 55 | $0 |
| Wage / Income Gap (%) | 129 | 0.00% |
| Wage / Income Gap ($) | 129 | 100.00¢ per $1 |
| Gini / Inequality Index | 129 | 0.39 |
Earnings by Sex in Monument
| Sex | Number | Average Earnings |
| Male | 53 (85.5%) | $0 |
| Female | 9 (14.5%) | $0 |
| Total | 62 (100.0%) | $0 |
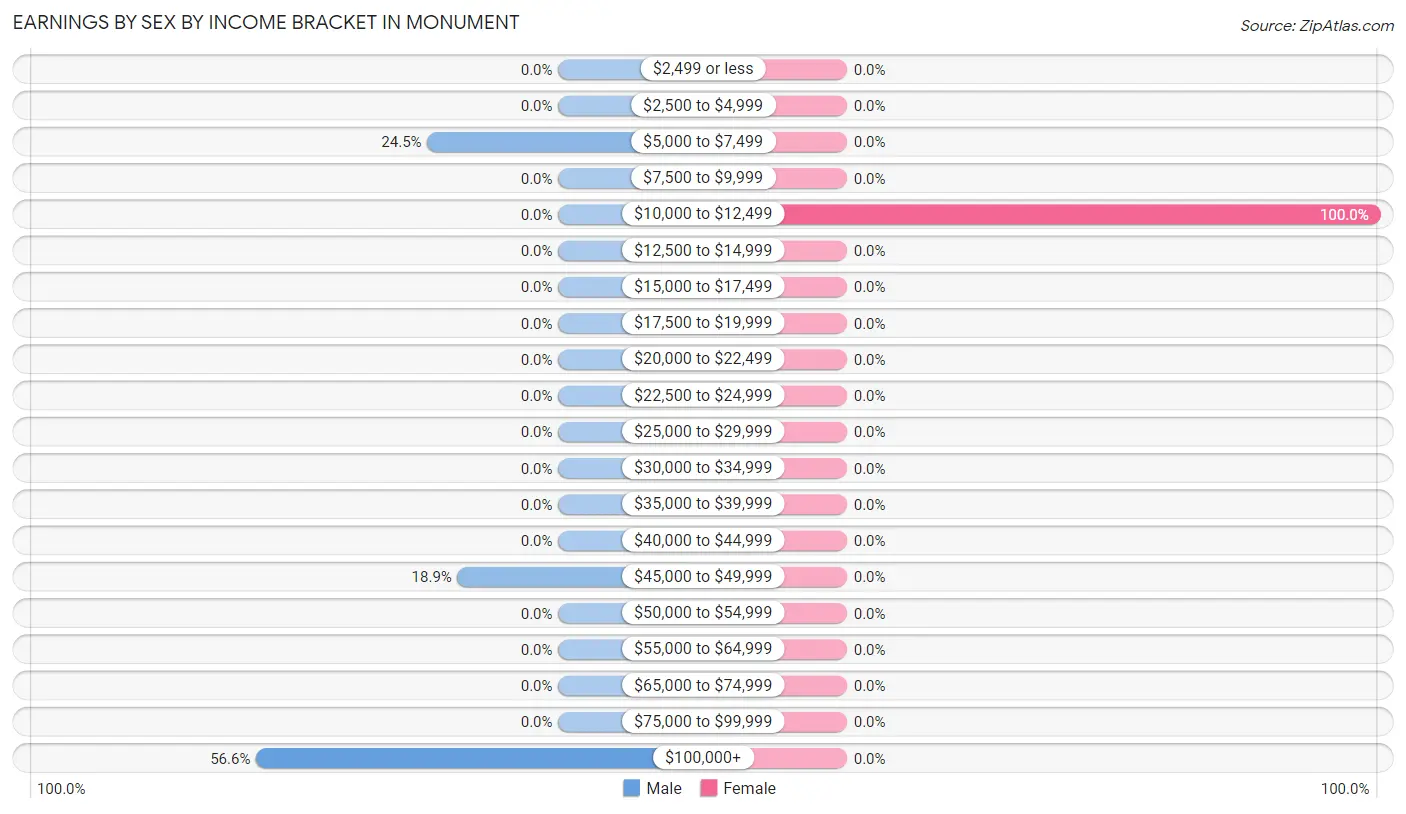
Earnings by Sex by Income Bracket in Monument
The most common earnings brackets in Monument are $100,000+ for men (30 | 56.6%) and $10,000 to $12,499 for women (9 | 100.0%).
| Income | Male | Female |
| $2,499 or less | 0 (0.0%) | 0 (0.0%) |
| $2,500 to $4,999 | 0 (0.0%) | 0 (0.0%) |
| $5,000 to $7,499 | 13 (24.5%) | 0 (0.0%) |
| $7,500 to $9,999 | 0 (0.0%) | 0 (0.0%) |
| $10,000 to $12,499 | 0 (0.0%) | 9 (100.0%) |
| $12,500 to $14,999 | 0 (0.0%) | 0 (0.0%) |
| $15,000 to $17,499 | 0 (0.0%) | 0 (0.0%) |
| $17,500 to $19,999 | 0 (0.0%) | 0 (0.0%) |
| $20,000 to $22,499 | 0 (0.0%) | 0 (0.0%) |
| $22,500 to $24,999 | 0 (0.0%) | 0 (0.0%) |
| $25,000 to $29,999 | 0 (0.0%) | 0 (0.0%) |
| $30,000 to $34,999 | 0 (0.0%) | 0 (0.0%) |
| $35,000 to $39,999 | 0 (0.0%) | 0 (0.0%) |
| $40,000 to $44,999 | 0 (0.0%) | 0 (0.0%) |
| $45,000 to $49,999 | 10 (18.9%) | 0 (0.0%) |
| $50,000 to $54,999 | 0 (0.0%) | 0 (0.0%) |
| $55,000 to $64,999 | 0 (0.0%) | 0 (0.0%) |
| $65,000 to $74,999 | 0 (0.0%) | 0 (0.0%) |
| $75,000 to $99,999 | 0 (0.0%) | 0 (0.0%) |
| $100,000+ | 30 (56.6%) | 0 (0.0%) |
| Total | 53 (100.0%) | 9 (100.0%) |
Earnings by Sex by Educational Attainment in Monument
| Educational Attainment | Male Income | Female Income |
| Less than High School | - | - |
| High School Diploma | - | - |
| College or Associate's Degree | - | - |
| Bachelor's Degree | - | - |
| Graduate Degree | - | - |
| Total | - | - |
Family Income in Monument
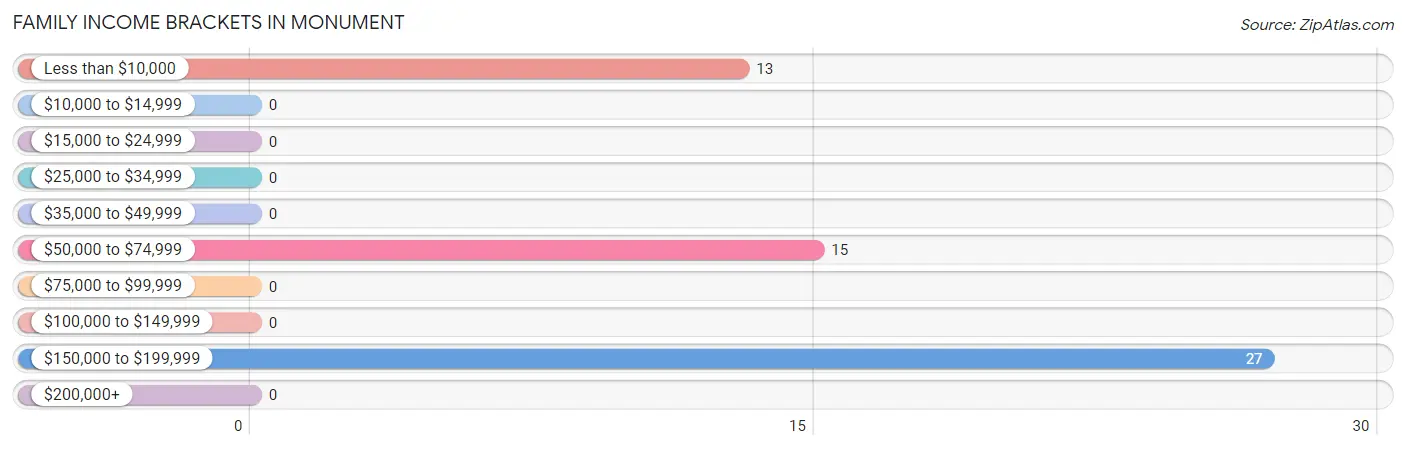
Family Income Brackets in Monument
According to the Monument family income data, there are 27 families falling into the $150,000 to $199,999 income range, which is the most common income bracket and makes up 49.1% of all families.
| Income Bracket | # Families | % Families |
| Less than $10,000 | 13 | 23.6% |
| $10,000 to $14,999 | 0 | 0.0% |
| $15,000 to $24,999 | 0 | 0.0% |
| $25,000 to $34,999 | 0 | 0.0% |
| $35,000 to $49,999 | 0 | 0.0% |
| $50,000 to $74,999 | 15 | 27.3% |
| $75,000 to $99,999 | 0 | 0.0% |
| $100,000 to $149,999 | 0 | 0.0% |
| $150,000 to $199,999 | 27 | 49.1% |
| $200,000+ | 0 | 0.0% |
Family Income by Famaliy Size in Monument
| Income Bracket | # Families | Median Income |
| 2-Person Families | 42 (76.4%) | $0 |
| 3-Person Families | 13 (23.6%) | $0 |
| 4-Person Families | 0 (0.0%) | $0 |
| 5-Person Families | 0 (0.0%) | $0 |
| 6-Person Families | 0 (0.0%) | $0 |
| 7+ Person Families | 0 (0.0%) | $0 |
| Total | 55 (100.0%) | $0 |
Family Income by Number of Earners in Monument
| Number of Earners | # Families | Median Income |
| No Earners | 6 (10.9%) | $0 |
| 1 Earner | 40 (72.7%) | $0 |
| 2 Earners | 9 (16.4%) | $0 |
| 3+ Earners | 0 (0.0%) | $0 |
| Total | 55 (100.0%) | $0 |
Household Income in Monument
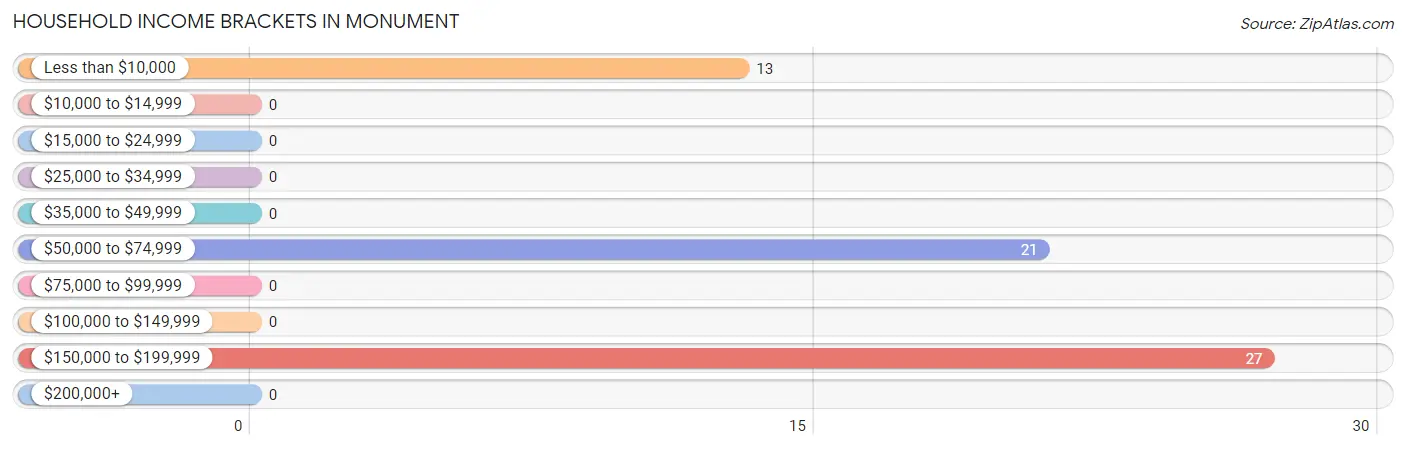
Household Income Brackets in Monument
With 27 households falling in the category, the $150,000 to $199,999 income range is the most frequent in Monument, accounting for 44.3% of all households.
| Income Bracket | # Households | % Households |
| Less than $10,000 | 13 | 21.3% |
| $10,000 to $14,999 | 0 | 0.0% |
| $15,000 to $24,999 | 0 | 0.0% |
| $25,000 to $34,999 | 0 | 0.0% |
| $35,000 to $49,999 | 0 | 0.0% |
| $50,000 to $74,999 | 21 | 34.4% |
| $75,000 to $99,999 | 0 | 0.0% |
| $100,000 to $149,999 | 0 | 0.0% |
| $150,000 to $199,999 | 27 | 44.3% |
| $200,000+ | 0 | 0.0% |
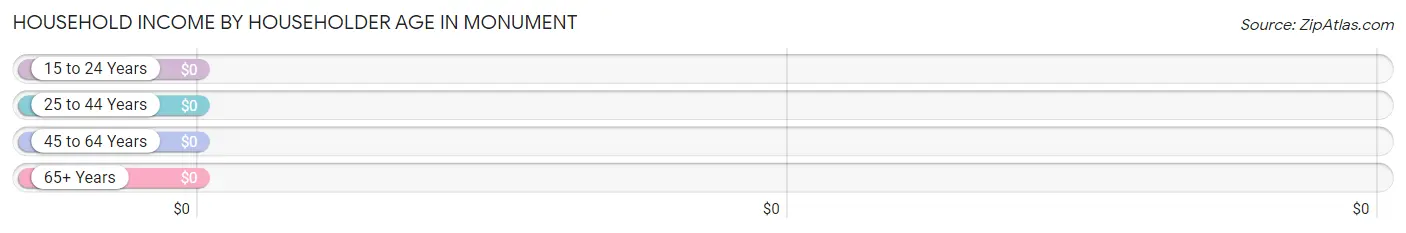
Household Income by Householder Age in Monument
| Income Bracket | # Households | Median Income |
| 15 to 24 Years | 0 (0.0%) | $0 |
| 25 to 44 Years | 0 (0.0%) | $0 |
| 45 to 64 Years | 49 (80.3%) | $0 |
| 65+ Years | 12 (19.7%) | $0 |
| Total | 61 (100.0%) | $0 |
Poverty in Monument
Income Below Poverty by Sex and Age in Monument
With 20.0% poverty level for males and 35.9% for females among the residents of Monument, 55 to 64 year old males and 18 to 24 year old females are the most vulnerable to poverty, with 13 males (24.5%) and 13 females (100.0%) in their respective age groups living below the poverty level.
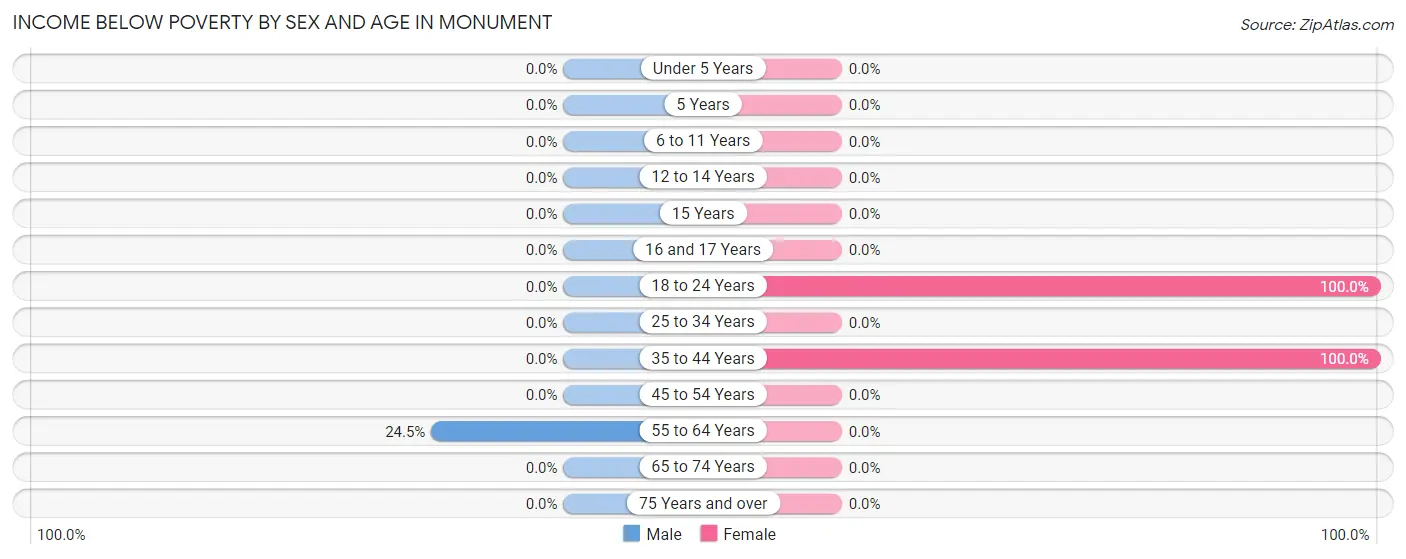
| Age Bracket | Male | Female |
| Under 5 Years | 0 (0.0%) | 0 (0.0%) |
| 5 Years | 0 (0.0%) | 0 (0.0%) |
| 6 to 11 Years | 0 (0.0%) | 0 (0.0%) |
| 12 to 14 Years | 0 (0.0%) | 0 (0.0%) |
| 15 Years | 0 (0.0%) | 0 (0.0%) |
| 16 and 17 Years | 0 (0.0%) | 0 (0.0%) |
| 18 to 24 Years | 0 (0.0%) | 13 (100.0%) |
| 25 to 34 Years | 0 (0.0%) | 0 (0.0%) |
| 35 to 44 Years | 0 (0.0%) | 10 (100.0%) |
| 45 to 54 Years | 0 (0.0%) | 0 (0.0%) |
| 55 to 64 Years | 13 (24.5%) | 0 (0.0%) |
| 65 to 74 Years | 0 (0.0%) | 0 (0.0%) |
| 75 Years and over | 0 (0.0%) | 0 (0.0%) |
| Total | 13 (20.0%) | 23 (35.9%) |
Income Above Poverty by Sex and Age in Monument
According to the poverty statistics in Monument, males aged 65 to 74 years and females aged 55 to 64 years are the age groups that are most secure financially, with 100.0% of males and 100.0% of females in these age groups living above the poverty line.
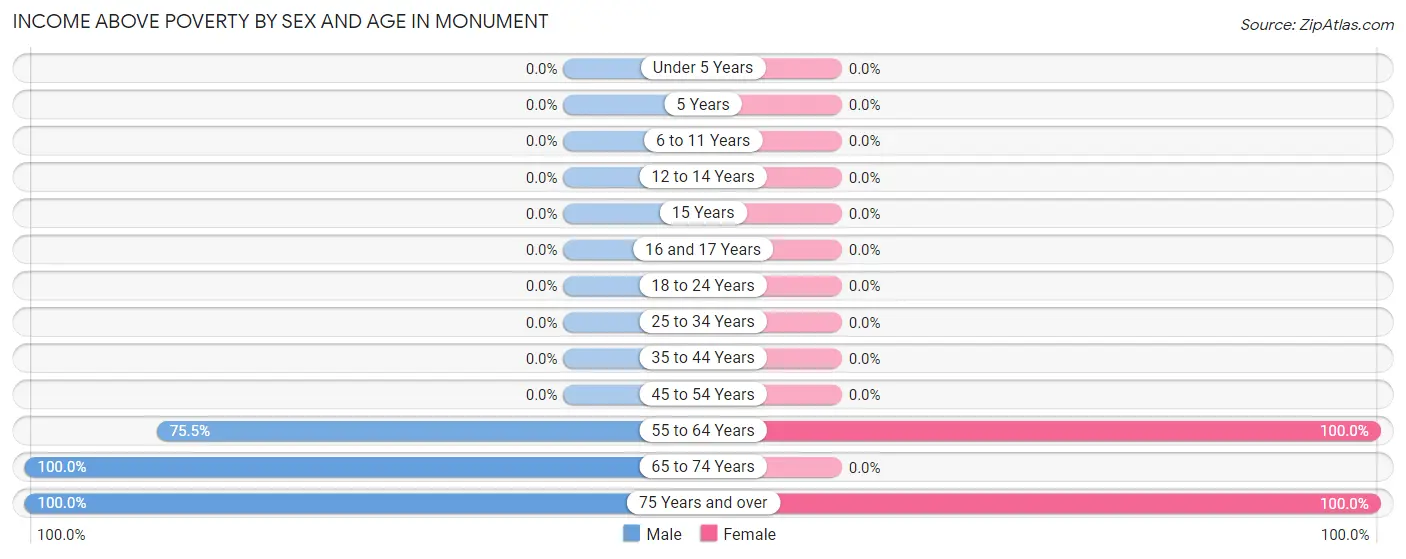
| Age Bracket | Male | Female |
| Under 5 Years | 0 (0.0%) | 0 (0.0%) |
| 5 Years | 0 (0.0%) | 0 (0.0%) |
| 6 to 11 Years | 0 (0.0%) | 0 (0.0%) |
| 12 to 14 Years | 0 (0.0%) | 0 (0.0%) |
| 15 Years | 0 (0.0%) | 0 (0.0%) |
| 16 and 17 Years | 0 (0.0%) | 0 (0.0%) |
| 18 to 24 Years | 0 (0.0%) | 0 (0.0%) |
| 25 to 34 Years | 0 (0.0%) | 0 (0.0%) |
| 35 to 44 Years | 0 (0.0%) | 0 (0.0%) |
| 45 to 54 Years | 0 (0.0%) | 0 (0.0%) |
| 55 to 64 Years | 40 (75.5%) | 36 (100.0%) |
| 65 to 74 Years | 6 (100.0%) | 0 (0.0%) |
| 75 Years and over | 6 (100.0%) | 5 (100.0%) |
| Total | 52 (80.0%) | 41 (64.1%) |
Income Below Poverty Among Married-Couple Families in Monument
The poverty statistics for married-couple families in Monument show that 23.6% or 13 of the total 55 families live below the poverty line. Families with no children have the highest poverty rate of 23.6%, comprising of 13 families. On the other hand, families with no children have the lowest poverty rate of 23.6%, which includes 13 families.
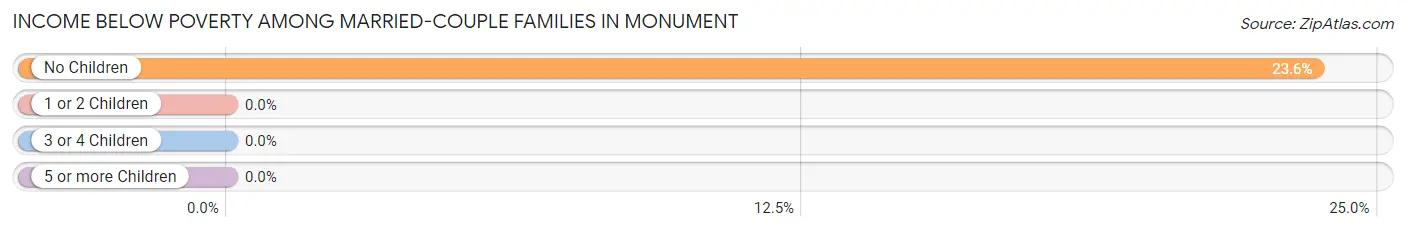
| Children | Above Poverty | Below Poverty |
| No Children | 42 (76.4%) | 13 (23.6%) |
| 1 or 2 Children | 0 (0.0%) | 0 (0.0%) |
| 3 or 4 Children | 0 (0.0%) | 0 (0.0%) |
| 5 or more Children | 0 (0.0%) | 0 (0.0%) |
| Total | 42 (76.4%) | 13 (23.6%) |
Income Below Poverty Among Single-Parent Households in Monument
| Children | Single Father | Single Mother |
| No Children | 0 (0.0%) | 0 (0.0%) |
| 1 or 2 Children | 0 (0.0%) | 0 (0.0%) |
| 3 or 4 Children | 0 (0.0%) | 0 (0.0%) |
| 5 or more Children | 0 (0.0%) | 0 (0.0%) |
| Total | 0 (0.0%) | 0 (0.0%) |
Income Below Poverty Among Married-Couple vs Single-Parent Households in Monument
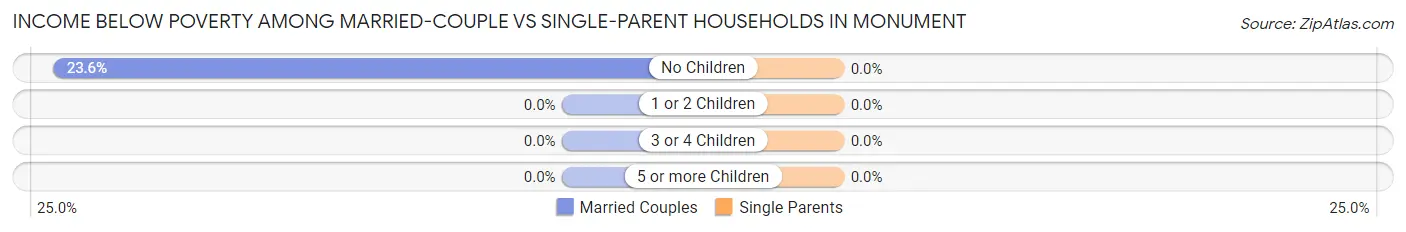
| Children | Married-Couple Families | Single-Parent Households |
| No Children | 13 (23.6%) | 0 (0.0%) |
| 1 or 2 Children | 0 (0.0%) | 0 (0.0%) |
| 3 or 4 Children | 0 (0.0%) | 0 (0.0%) |
| 5 or more Children | 0 (0.0%) | 0 (0.0%) |
| Total | 13 (23.6%) | 0 (0.0%) |
Race in Monument
The most populous races in Monument are White / Caucasian (72 | 55.8%), Two or more Races (57 | 44.2%), and Hispanic or Latino (36 | 27.9%).
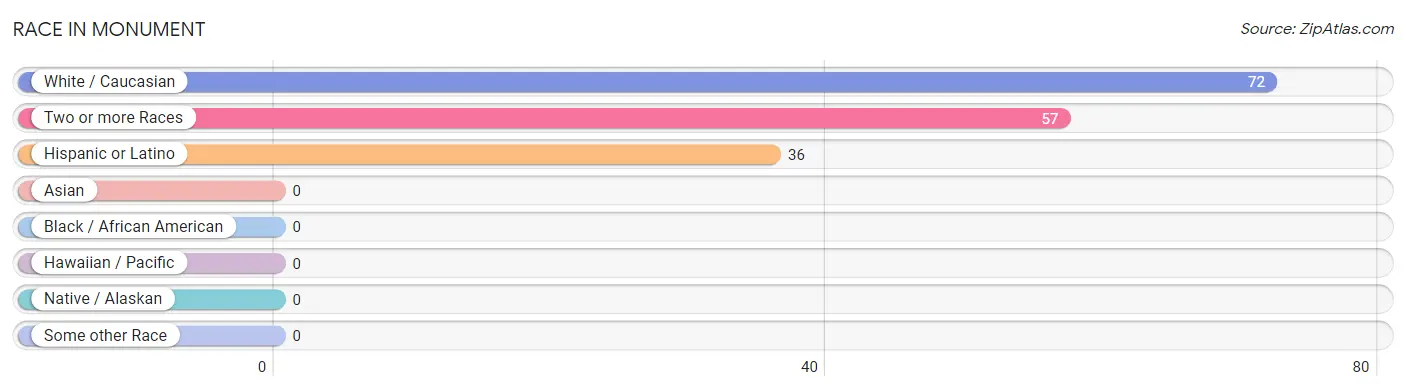
| Race | # Population | % Population |
| Asian | 0 | 0.0% |
| Black / African American | 0 | 0.0% |
| Hawaiian / Pacific | 0 | 0.0% |
| Hispanic or Latino | 36 | 27.9% |
| Native / Alaskan | 0 | 0.0% |
| White / Caucasian | 72 | 55.8% |
| Two or more Races | 57 | 44.2% |
| Some other Race | 0 | 0.0% |
| Total | 129 | 100.0% |
Ancestry in Monument
The most populous ancestries reported in Monument are Mexican (36 | 27.9%), and Scotch-Irish (6 | 4.6%), together accounting for 32.6% of all Monument residents.
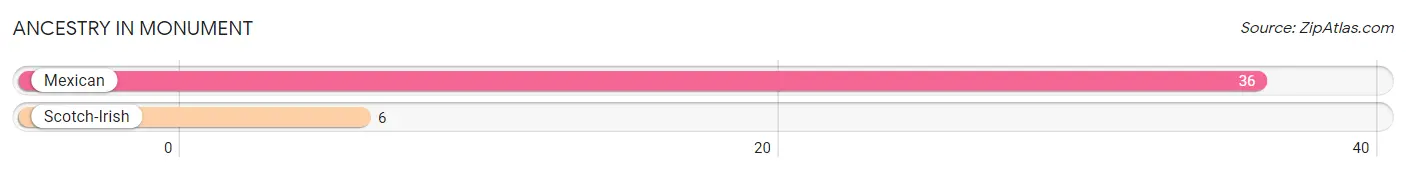
| Ancestry | # Population | % Population |
| Mexican | 36 | 27.9% |
| Scotch-Irish | 6 | 4.6% | View All 2 Rows |
Immigrants in Monument
The most numerous immigrant groups reported in Monument came from Central America (36 | 27.9%), Latin America (36 | 27.9%), and Mexico (36 | 27.9%), together accounting for 83.7% of all Monument residents.
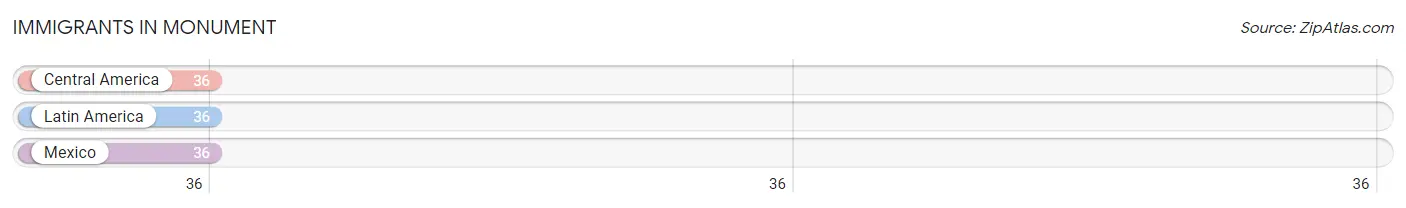
| Immigration Origin | # Population | % Population |
| Central America | 36 | 27.9% |
| Latin America | 36 | 27.9% |
| Mexico | 36 | 27.9% | View All 3 Rows |
Sex and Age in Monument
Sex and Age in Monument
The most populous age groups in Monument are 60 to 64 Years (43 | 66.1%) for men and 55 to 59 Years (27 | 42.2%) for women.
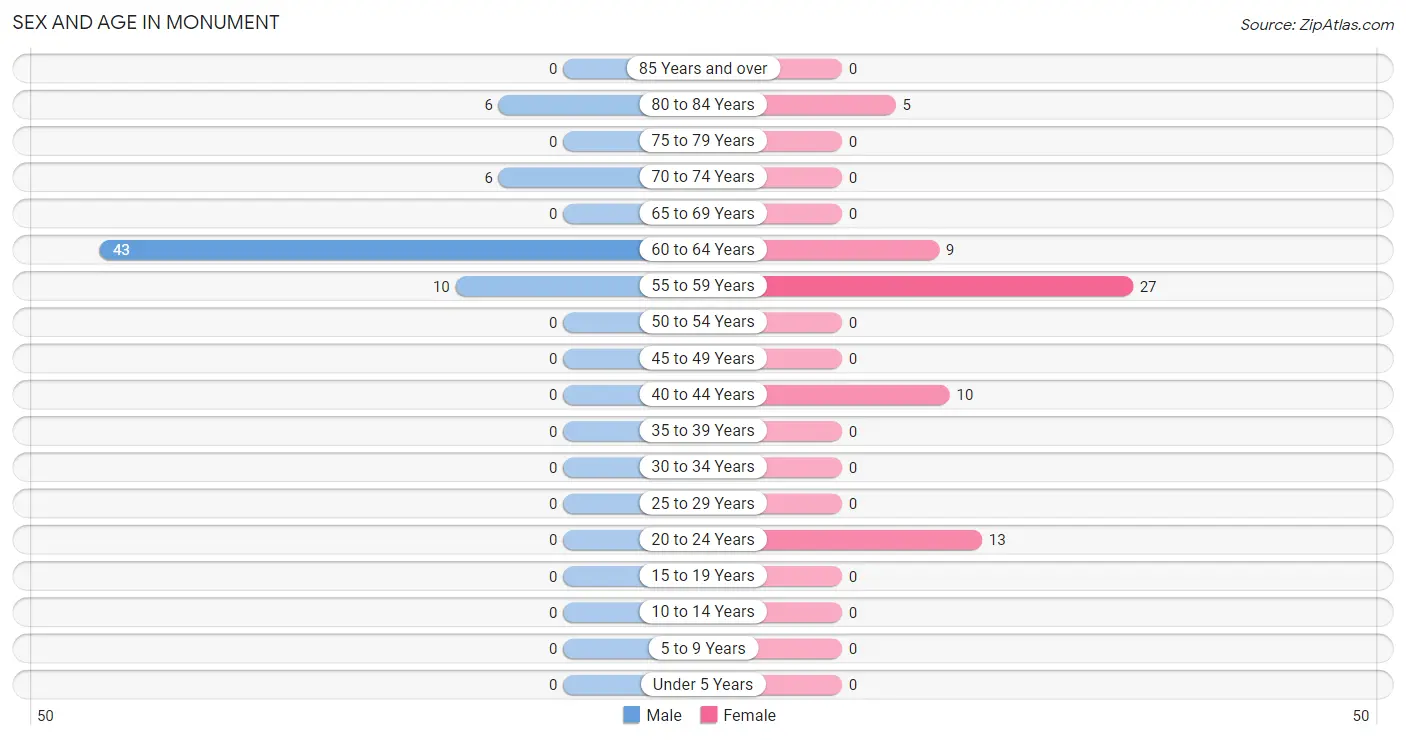
| Age Bracket | Male | Female |
| Under 5 Years | 0 (0.0%) | 0 (0.0%) |
| 5 to 9 Years | 0 (0.0%) | 0 (0.0%) |
| 10 to 14 Years | 0 (0.0%) | 0 (0.0%) |
| 15 to 19 Years | 0 (0.0%) | 0 (0.0%) |
| 20 to 24 Years | 0 (0.0%) | 13 (20.3%) |
| 25 to 29 Years | 0 (0.0%) | 0 (0.0%) |
| 30 to 34 Years | 0 (0.0%) | 0 (0.0%) |
| 35 to 39 Years | 0 (0.0%) | 0 (0.0%) |
| 40 to 44 Years | 0 (0.0%) | 10 (15.6%) |
| 45 to 49 Years | 0 (0.0%) | 0 (0.0%) |
| 50 to 54 Years | 0 (0.0%) | 0 (0.0%) |
| 55 to 59 Years | 10 (15.4%) | 27 (42.2%) |
| 60 to 64 Years | 43 (66.1%) | 9 (14.1%) |
| 65 to 69 Years | 0 (0.0%) | 0 (0.0%) |
| 70 to 74 Years | 6 (9.2%) | 0 (0.0%) |
| 75 to 79 Years | 0 (0.0%) | 0 (0.0%) |
| 80 to 84 Years | 6 (9.2%) | 5 (7.8%) |
| 85 Years and over | 0 (0.0%) | 0 (0.0%) |
| Total | 65 (100.0%) | 64 (100.0%) |
Families and Households in Monument
Median Family Size in Monument
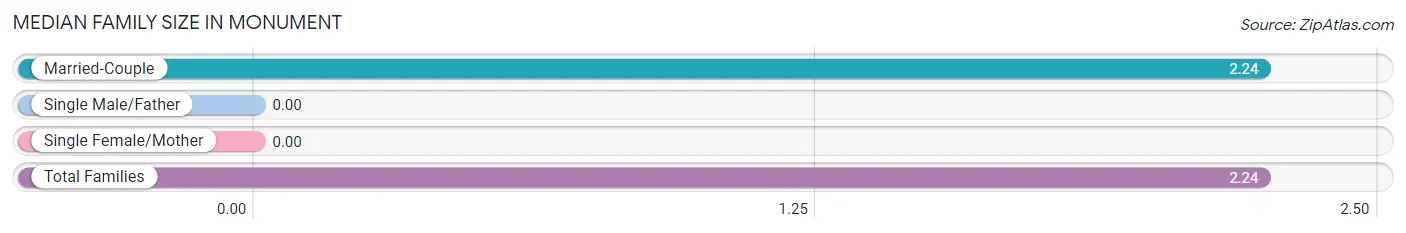
| Family Type | # Families | Family Size |
| Married-Couple | 55 (100.0%) | 2.24 |
| Single Male/Father | 0 (0.0%) | - |
| Single Female/Mother | 0 (0.0%) | - |
| Total Families | 55 (100.0%) | 2.24 |
Median Household Size in Monument
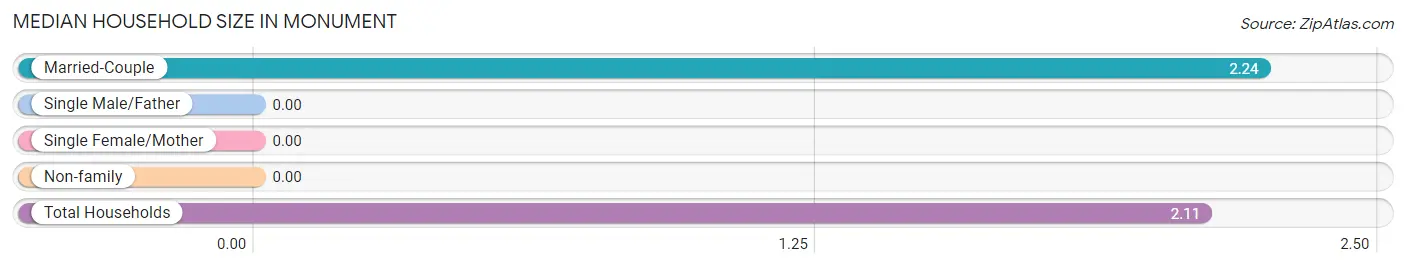
| Household Type | # Households | Household Size |
| Married-Couple | 55 (90.2%) | 2.24 |
| Single Male/Father | 0 (0.0%) | - |
| Single Female/Mother | 0 (0.0%) | - |
| Non-family | 6 (9.8%) | - |
| Total Households | 61 (100.0%) | 2.11 |
Household Size by Marriage Status in Monument
Out of a total of 61 households in Monument, 55 (90.2%) are family households, while 6 (9.8%) are nonfamily households. The most numerous type of family households are 2-person households, comprising 42, and the most common type of nonfamily households are 1-person households, comprising 6.
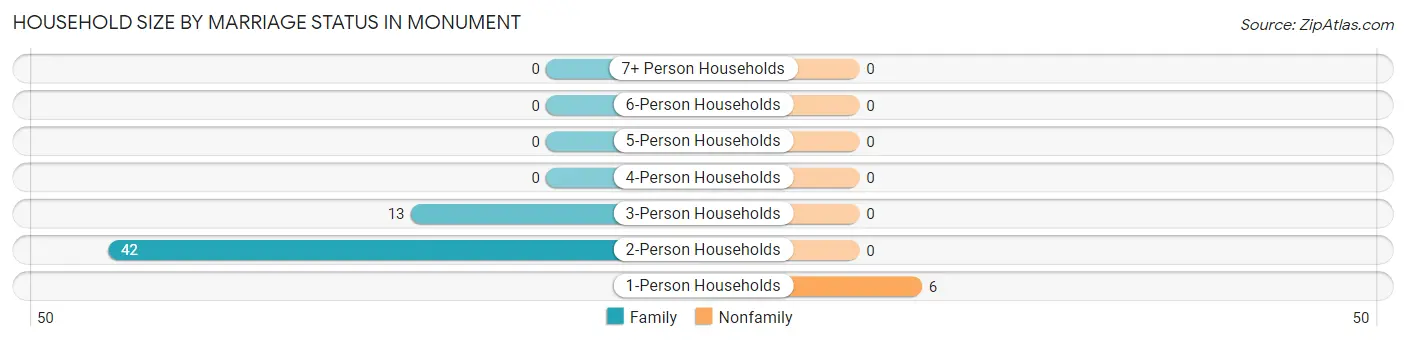
| Household Size | Family Households | Nonfamily Households |
| 1-Person Households | - | 6 (9.8%) |
| 2-Person Households | 42 (68.9%) | 0 (0.0%) |
| 3-Person Households | 13 (21.3%) | 0 (0.0%) |
| 4-Person Households | 0 (0.0%) | 0 (0.0%) |
| 5-Person Households | 0 (0.0%) | 0 (0.0%) |
| 6-Person Households | 0 (0.0%) | 0 (0.0%) |
| 7+ Person Households | 0 (0.0%) | 0 (0.0%) |
| Total | 55 (90.2%) | 6 (9.8%) |
Female Fertility in Monument
Fertility by Age in Monument
| Age Bracket | Women with Births | Births / 1,000 Women |
| 15 to 19 years | 0 (0.0%) | 0.0 |
| 20 to 34 years | 0 (0.0%) | 0.0 |
| 35 to 50 years | 0 (0.0%) | 0.0 |
| Total | 0 (0.0%) | 0.0 |
Fertility by Age by Marriage Status in Monument
| Age Bracket | Married | Unmarried |
| 15 to 19 years | 0 (0.0%) | 0 (0.0%) |
| 20 to 34 years | 0 (0.0%) | 0 (0.0%) |
| 35 to 50 years | 0 (0.0%) | 0 (0.0%) |
| Total | 0 (0.0%) | 0 (0.0%) |
Fertility by Education in Monument
| Educational Attainment | Women with Births | Births / 1,000 Women |
| Less than High School | 0 (0.0%) | 0.0 |
| High School Diploma | 0 (0.0%) | 0.0 |
| College or Associate's Degree | 0 (0.0%) | 0.0 |
| Bachelor's Degree | 0 (0.0%) | 0.0 |
| Graduate Degree | 0 (0.0%) | 0.0 |
| Total | 0 (0.0%) | 0.0 |
Fertility by Education by Marriage Status in Monument
| Educational Attainment | Married | Unmarried |
| Less than High School | 0 (0.0%) | 0 (0.0%) |
| High School Diploma | 0 (0.0%) | 0 (0.0%) |
| College or Associate's Degree | 0 (0.0%) | 0 (0.0%) |
| Bachelor's Degree | 0 (0.0%) | 0 (0.0%) |
| Graduate Degree | 0 (0.0%) | 0 (0.0%) |
| Total | 0 (0.0%) | 0 (0.0%) |
Employment Characteristics in Monument
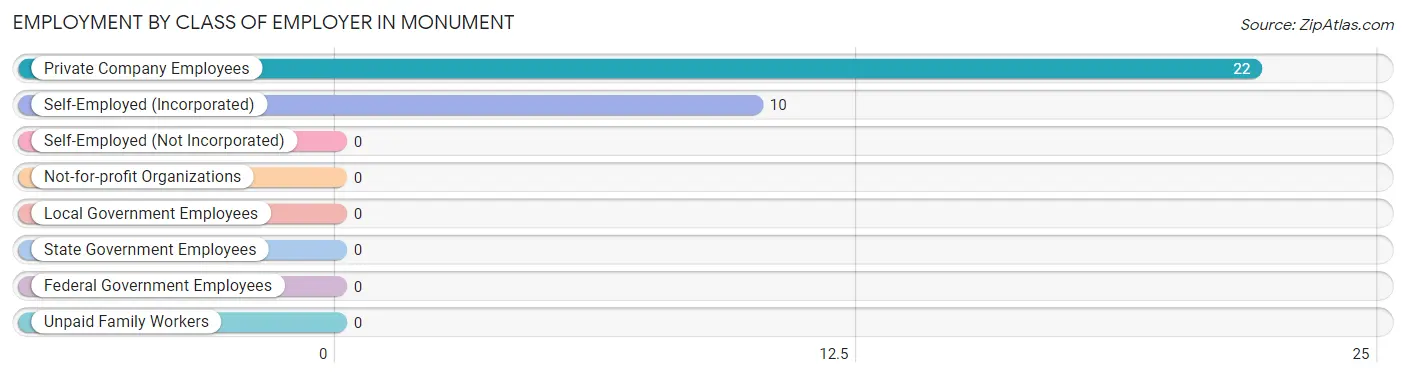
Employment by Class of Employer in Monument
Among the 32 employed individuals in Monument, private company employees (22 | 68.8%), and self-employed (incorporated) (10 | 31.2%) make up the most common classes of employment.
| Employer Class | # Employees | % Employees |
| Private Company Employees | 22 | 68.8% |
| Self-Employed (Incorporated) | 10 | 31.2% |
| Self-Employed (Not Incorporated) | 0 | 0.0% |
| Not-for-profit Organizations | 0 | 0.0% |
| Local Government Employees | 0 | 0.0% |
| State Government Employees | 0 | 0.0% |
| Federal Government Employees | 0 | 0.0% |
| Unpaid Family Workers | 0 | 0.0% |
| Total | 32 | 100.0% |
Employment Status by Age in Monument
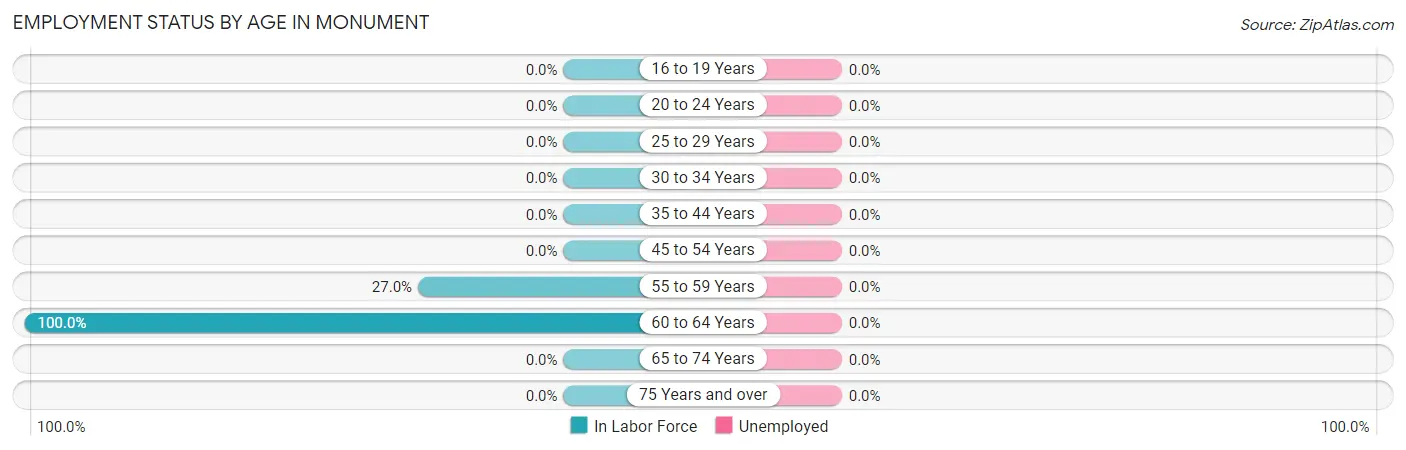
| Age Bracket | In Labor Force | Unemployed |
| 16 to 19 Years | 0 (0.0%) | 0 (0.0%) |
| 20 to 24 Years | 0 (0.0%) | 0 (0.0%) |
| 25 to 29 Years | 0 (0.0%) | 0 (0.0%) |
| 30 to 34 Years | 0 (0.0%) | 0 (0.0%) |
| 35 to 44 Years | 0 (0.0%) | 0 (0.0%) |
| 45 to 54 Years | 0 (0.0%) | 0 (0.0%) |
| 55 to 59 Years | 10 (27.0%) | 0 (0.0%) |
| 60 to 64 Years | 52 (100.0%) | 0 (0.0%) |
| 65 to 74 Years | 0 (0.0%) | 0 (0.0%) |
| 75 Years and over | 0 (0.0%) | 0 (0.0%) |
| Total | 62 (48.1%) | 0 (0.0%) |
Employment Status by Educational Attainment in Monument
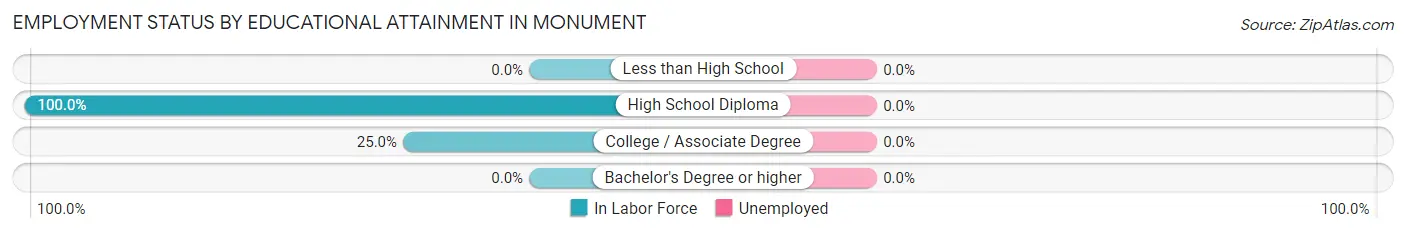
| Educational Attainment | In Labor Force | Unemployed |
| Less than High School | 0 (0.0%) | 0 (0.0%) |
| High School Diploma | 53 (100.0%) | 0 (0.0%) |
| College / Associate Degree | 9 (25.0%) | 0 (0.0%) |
| Bachelor's Degree or higher | 0 (0.0%) | 0 (0.0%) |
| Total | 62 (62.6%) | 0 (0.0%) |
Employment Occupations by Sex in Monument
Management, Business, Science and Arts Occupations
Management, Business, Science and Arts Occupations by Sex
| Occupation | Male | Female |
| Management | 0 (0.0%) | 0 (0.0%) |
| Business & Financial | 0 (0.0%) | 0 (0.0%) |
| Computers, Engineering & Science | 0 (0.0%) | 0 (0.0%) |
| Computers & Mathematics | 0 (0.0%) | 0 (0.0%) |
| Architecture & Engineering | 0 (0.0%) | 0 (0.0%) |
| Life, Physical & Social Science | 0 (0.0%) | 0 (0.0%) |
| Community & Social Service | 0 (0.0%) | 0 (0.0%) |
| Education, Arts & Media | 0 (0.0%) | 0 (0.0%) |
| Legal Services & Support | 0 (0.0%) | 0 (0.0%) |
| Education Instruction & Library | 0 (0.0%) | 0 (0.0%) |
| Arts, Media & Entertainment | 0 (0.0%) | 0 (0.0%) |
| Health Diagnosing & Treating | 0 (0.0%) | 0 (0.0%) |
| Health Technologists | 0 (0.0%) | 0 (0.0%) |
| Total (Category) | 0 (0.0%) | 0 (0.0%) |
| Total (Overall) | 53 (85.5%) | 9 (14.5%) |
Services Occupations
Services Occupations by Sex
| Occupation | Male | Female |
| Healthcare Support | 0 (0.0%) | 0 (0.0%) |
| Security & Protection | 0 (0.0%) | 0 (0.0%) |
| Firefighting & Prevention | 0 (0.0%) | 0 (0.0%) |
| Law Enforcement | 0 (0.0%) | 0 (0.0%) |
| Food Preparation & Serving | 0 (0.0%) | 0 (0.0%) |
| Cleaning & Maintenance | 0 (0.0%) | 0 (0.0%) |
| Personal Care & Service | 0 (0.0%) | 0 (0.0%) |
| Total (Category) | 0 (0.0%) | 0 (0.0%) |
| Total (Overall) | 53 (85.5%) | 9 (14.5%) |
Sales and Office Occupations
The most common Sales and Office occupations in Monument are , and Office & Administration (9 | 14.5%).
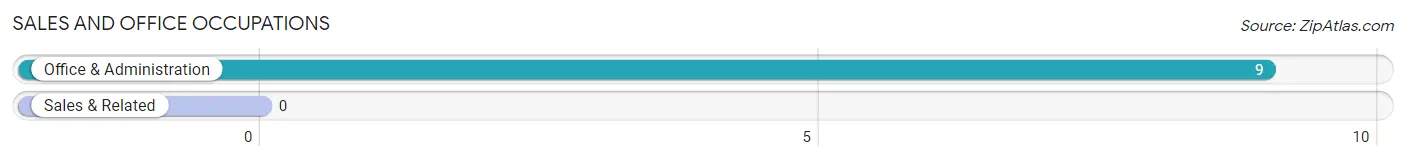
Sales and Office Occupations by Sex
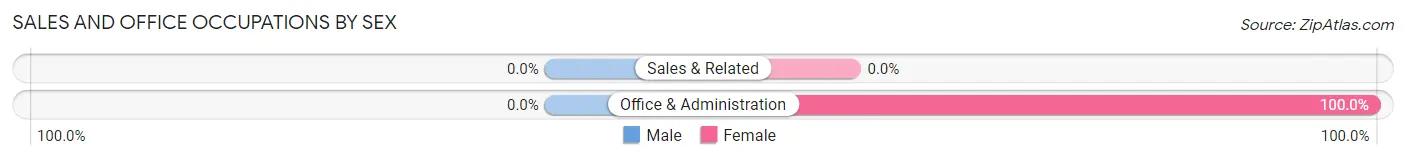
| Occupation | Male | Female |
| Sales & Related | 0 (0.0%) | 0 (0.0%) |
| Office & Administration | 0 (0.0%) | 9 (100.0%) |
| Total (Category) | 0 (0.0%) | 9 (100.0%) |
| Total (Overall) | 53 (85.5%) | 9 (14.5%) |
Natural Resources, Construction and Maintenance Occupations
The most common Natural Resources, Construction and Maintenance occupations in Monument are Construction & Extraction (13 | 21.0%), and Installation, Maintenance & Repair (10 | 16.1%).
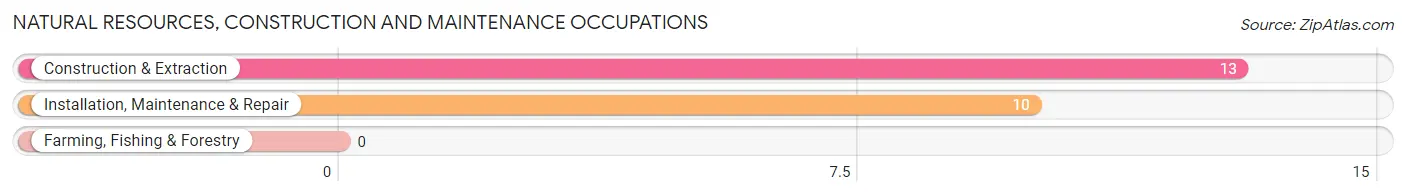
Natural Resources, Construction and Maintenance Occupations by Sex
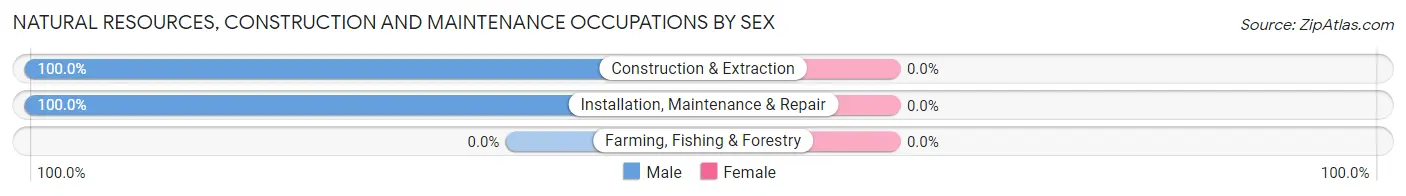
| Occupation | Male | Female |
| Farming, Fishing & Forestry | 0 (0.0%) | 0 (0.0%) |
| Construction & Extraction | 13 (100.0%) | 0 (0.0%) |
| Installation, Maintenance & Repair | 10 (100.0%) | 0 (0.0%) |
| Total (Category) | 23 (100.0%) | 0 (0.0%) |
| Total (Overall) | 53 (85.5%) | 9 (14.5%) |
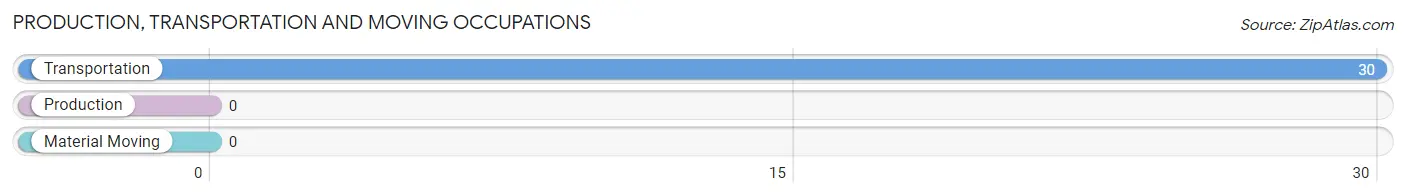
Production, Transportation and Moving Occupations
The most common Production, Transportation and Moving occupations in Monument are , and Transportation (30 | 48.4%).
Production, Transportation and Moving Occupations by Sex
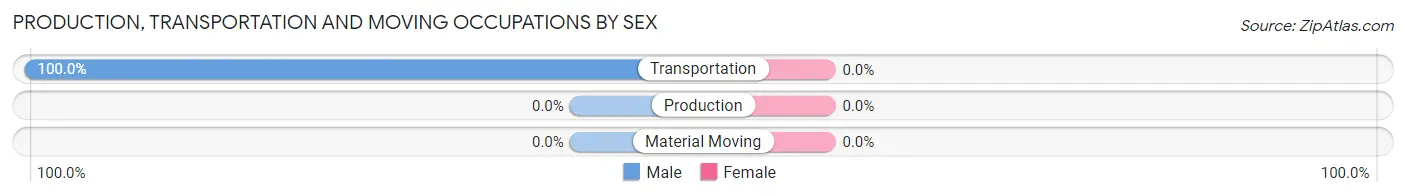
| Occupation | Male | Female |
| Production | 0 (0.0%) | 0 (0.0%) |
| Transportation | 30 (100.0%) | 0 (0.0%) |
| Material Moving | 0 (0.0%) | 0 (0.0%) |
| Total (Category) | 30 (100.0%) | 0 (0.0%) |
| Total (Overall) | 53 (85.5%) | 9 (14.5%) |
Employment Industries by Sex in Monument
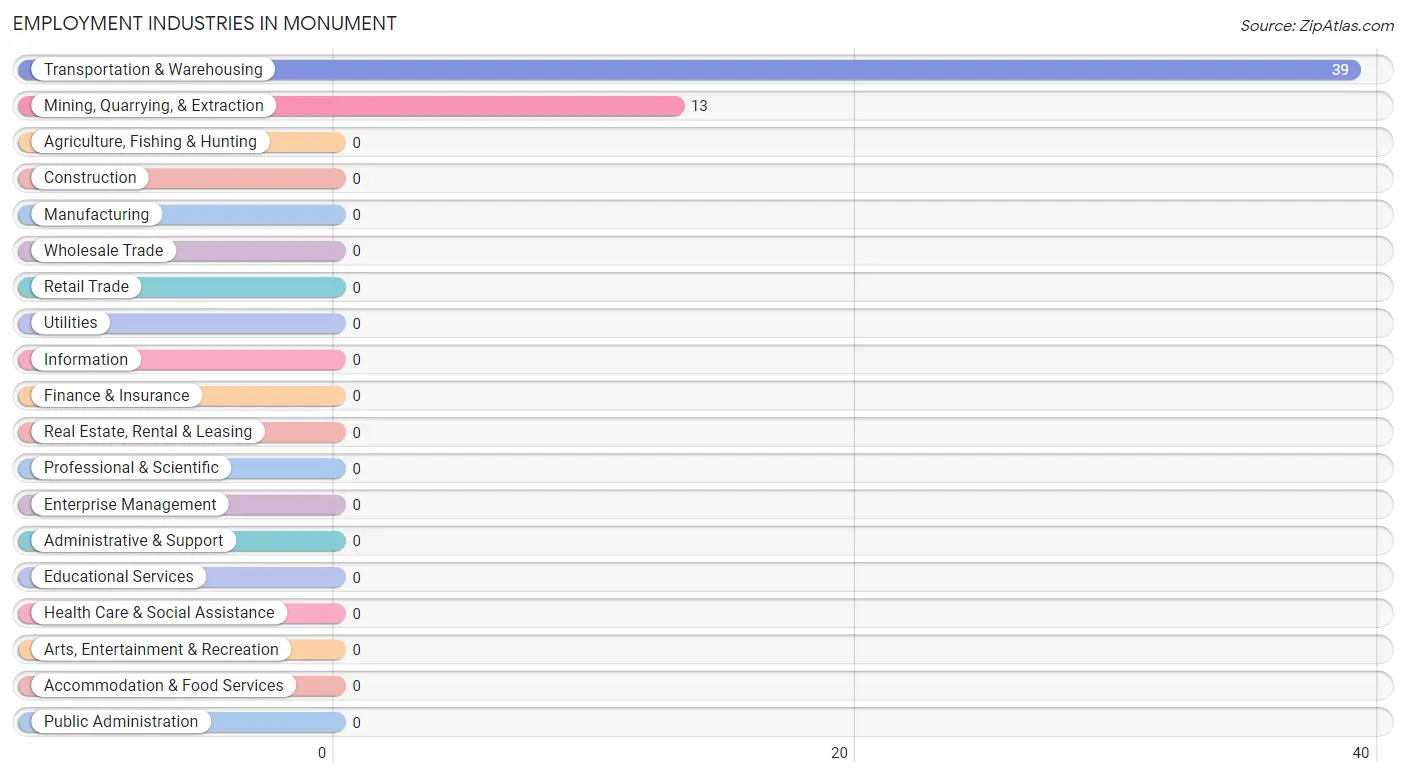
Employment Industries in Monument
The major employment industries in Monument include Transportation & Warehousing (39 | 62.9%), and Mining, Quarrying, & Extraction (13 | 21.0%).
Employment Industries by Sex in Monument
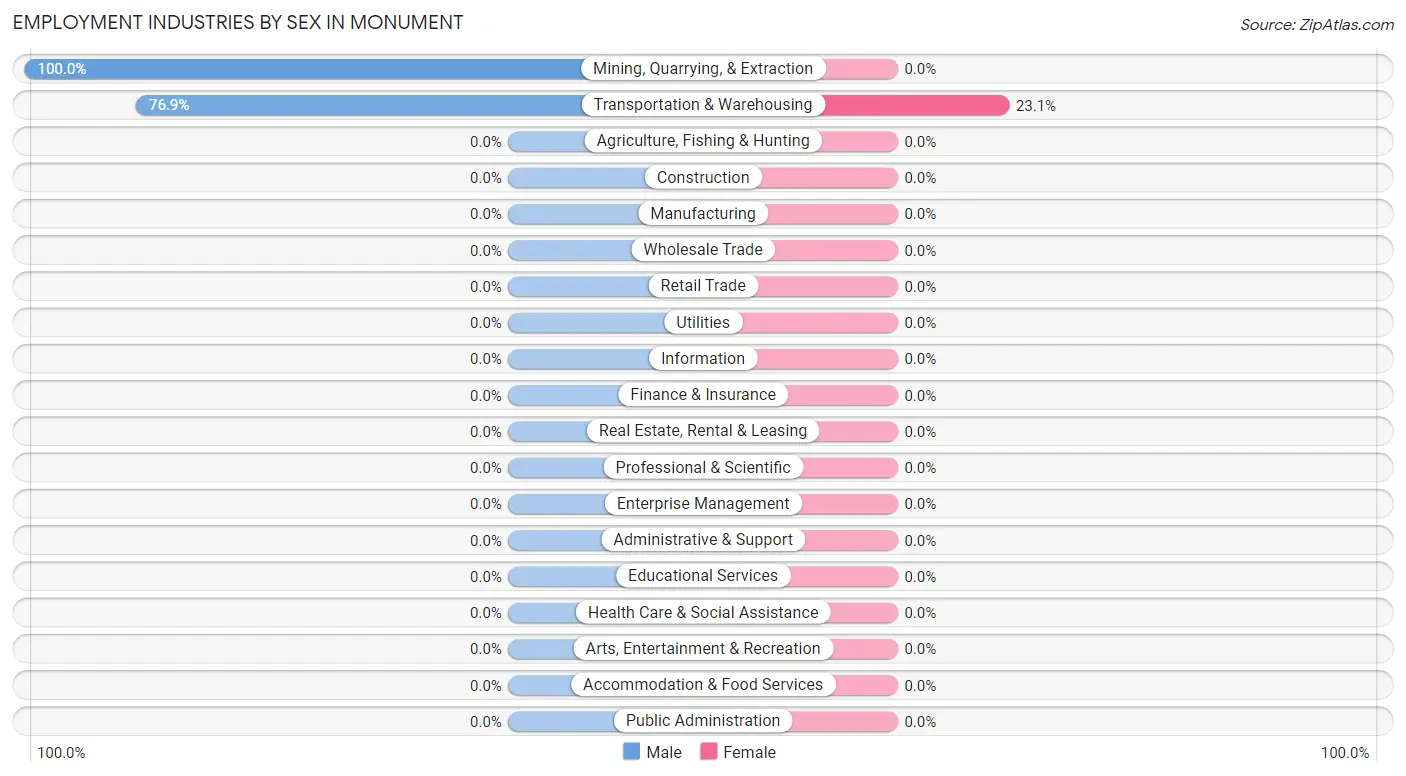
| Industry | Male | Female |
| Agriculture, Fishing & Hunting | 0 (0.0%) | 0 (0.0%) |
| Mining, Quarrying, & Extraction | 13 (100.0%) | 0 (0.0%) |
| Construction | 0 (0.0%) | 0 (0.0%) |
| Manufacturing | 0 (0.0%) | 0 (0.0%) |
| Wholesale Trade | 0 (0.0%) | 0 (0.0%) |
| Retail Trade | 0 (0.0%) | 0 (0.0%) |
| Transportation & Warehousing | 30 (76.9%) | 9 (23.1%) |
| Utilities | 0 (0.0%) | 0 (0.0%) |
| Information | 0 (0.0%) | 0 (0.0%) |
| Finance & Insurance | 0 (0.0%) | 0 (0.0%) |
| Real Estate, Rental & Leasing | 0 (0.0%) | 0 (0.0%) |
| Professional & Scientific | 0 (0.0%) | 0 (0.0%) |
| Enterprise Management | 0 (0.0%) | 0 (0.0%) |
| Administrative & Support | 0 (0.0%) | 0 (0.0%) |
| Educational Services | 0 (0.0%) | 0 (0.0%) |
| Health Care & Social Assistance | 0 (0.0%) | 0 (0.0%) |
| Arts, Entertainment & Recreation | 0 (0.0%) | 0 (0.0%) |
| Accommodation & Food Services | 0 (0.0%) | 0 (0.0%) |
| Public Administration | 0 (0.0%) | 0 (0.0%) |
| Total | 53 (85.5%) | 9 (14.5%) |
Education in Monument
School Enrollment in Monument
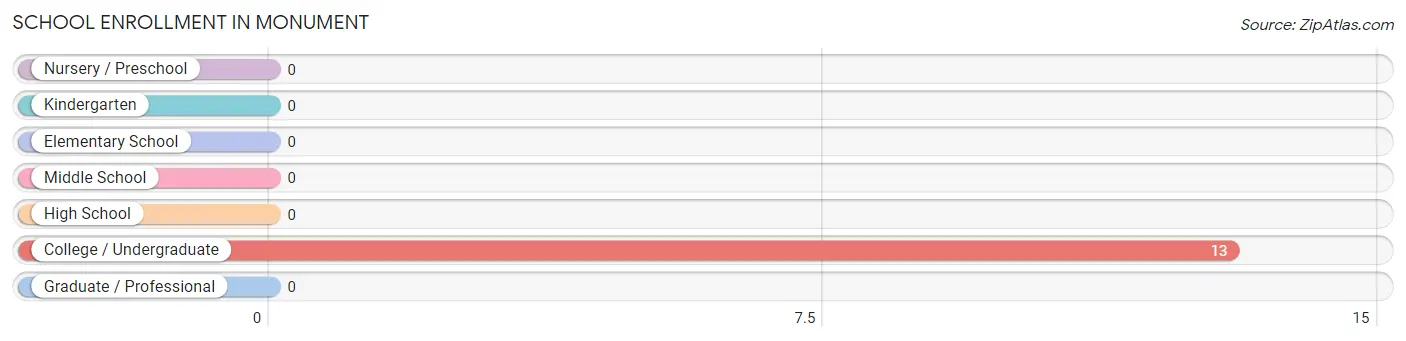
| School Level | # Students | % Students |
| Nursery / Preschool | 0 | 0.0% |
| Kindergarten | 0 | 0.0% |
| Elementary School | 0 | 0.0% |
| Middle School | 0 | 0.0% |
| High School | 0 | 0.0% |
| College / Undergraduate | 13 | 100.0% |
| Graduate / Professional | 0 | 0.0% |
| Total | 13 | 100.0% |
School Enrollment by Age by Funding Source in Monument
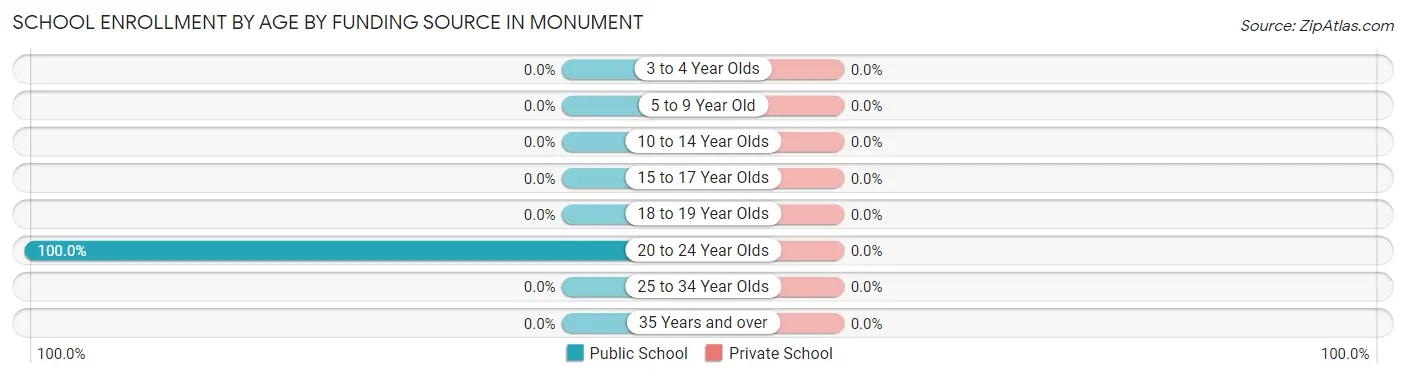
| Age Bracket | Public School | Private School |
| 3 to 4 Year Olds | 0 (0.0%) | 0 (0.0%) |
| 5 to 9 Year Old | 0 (0.0%) | 0 (0.0%) |
| 10 to 14 Year Olds | 0 (0.0%) | 0 (0.0%) |
| 15 to 17 Year Olds | 0 (0.0%) | 0 (0.0%) |
| 18 to 19 Year Olds | 0 (0.0%) | 0 (0.0%) |
| 20 to 24 Year Olds | 13 (100.0%) | 0 (0.0%) |
| 25 to 34 Year Olds | 0 (0.0%) | 0 (0.0%) |
| 35 Years and over | 0 (0.0%) | 0 (0.0%) |
| Total | 13 (100.0%) | 0 (0.0%) |
Educational Attainment by Field of Study in Monument
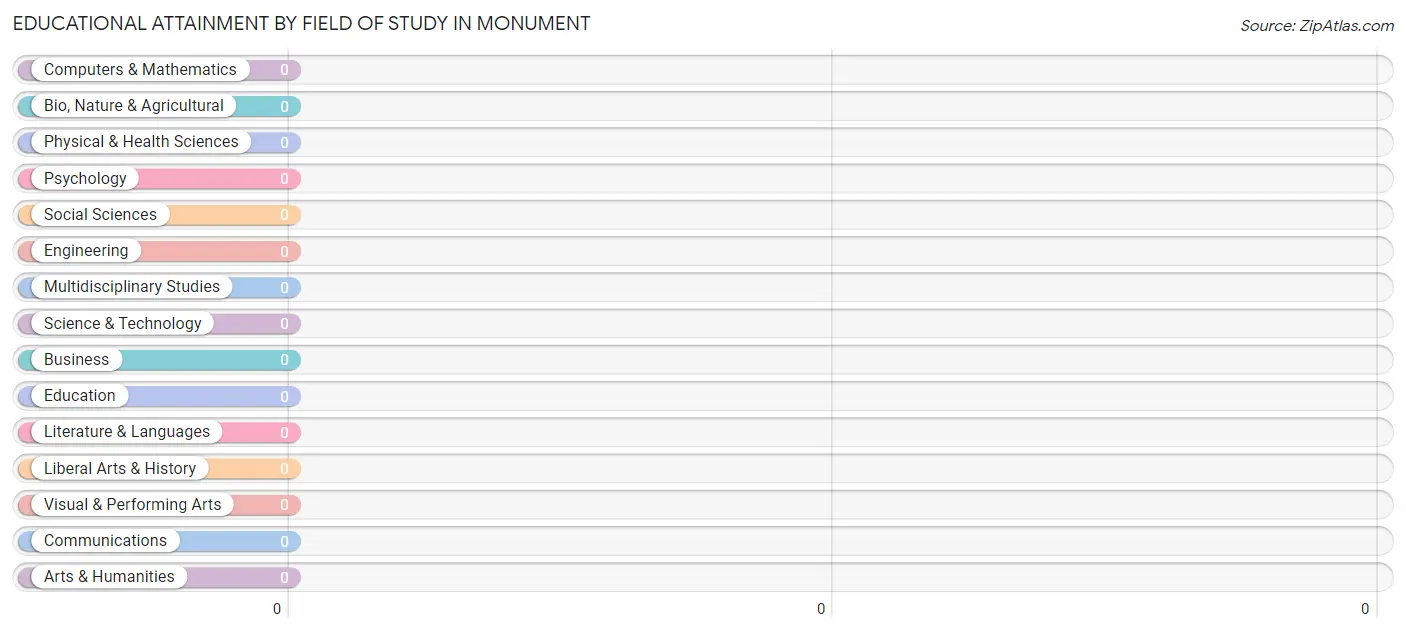
| Field of Study | # Graduates | % Graduates |
| Computers & Mathematics | 0 | 0.0% |
| Bio, Nature & Agricultural | 0 | 0.0% |
| Physical & Health Sciences | 0 | 0.0% |
| Psychology | 0 | 0.0% |
| Social Sciences | 0 | 0.0% |
| Engineering | 0 | 0.0% |
| Multidisciplinary Studies | 0 | 0.0% |
| Science & Technology | 0 | 0.0% |
| Business | 0 | 0.0% |
| Education | 0 | 0.0% |
| Literature & Languages | 0 | 0.0% |
| Liberal Arts & History | 0 | 0.0% |
| Visual & Performing Arts | 0 | 0.0% |
| Communications | 0 | 0.0% |
| Arts & Humanities | 0 | 0.0% |
| Total | 0 | 0.0% |
Transportation & Commute in Monument
Vehicle Availability by Sex in Monument
The most prevalent vehicle ownership categories in Monument are males with 2 vehicles (13, accounting for 56.5%) and females with 2 vehicles (0, making up 144.4%).
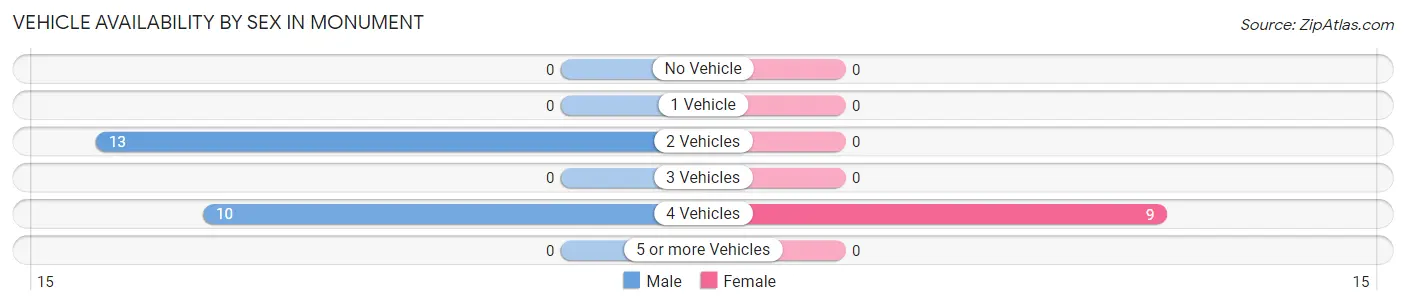
| Vehicles Available | Male | Female |
| No Vehicle | 0 (0.0%) | 0 (0.0%) |
| 1 Vehicle | 0 (0.0%) | 0 (0.0%) |
| 2 Vehicles | 13 (56.5%) | 0 (0.0%) |
| 3 Vehicles | 0 (0.0%) | 0 (0.0%) |
| 4 Vehicles | 10 (43.5%) | 9 (100.0%) |
| 5 or more Vehicles | 0 (0.0%) | 0 (0.0%) |
| Total | 23 (100.0%) | 9 (100.0%) |
Commute Time in Monument
The most frequently occuring commute durations in Monument are 90 or more minutes (13 commuters, 40.6%), less than 5 minutes (10 commuters, 31.2%), and 20 to 24 minutes (9 commuters, 28.1%).
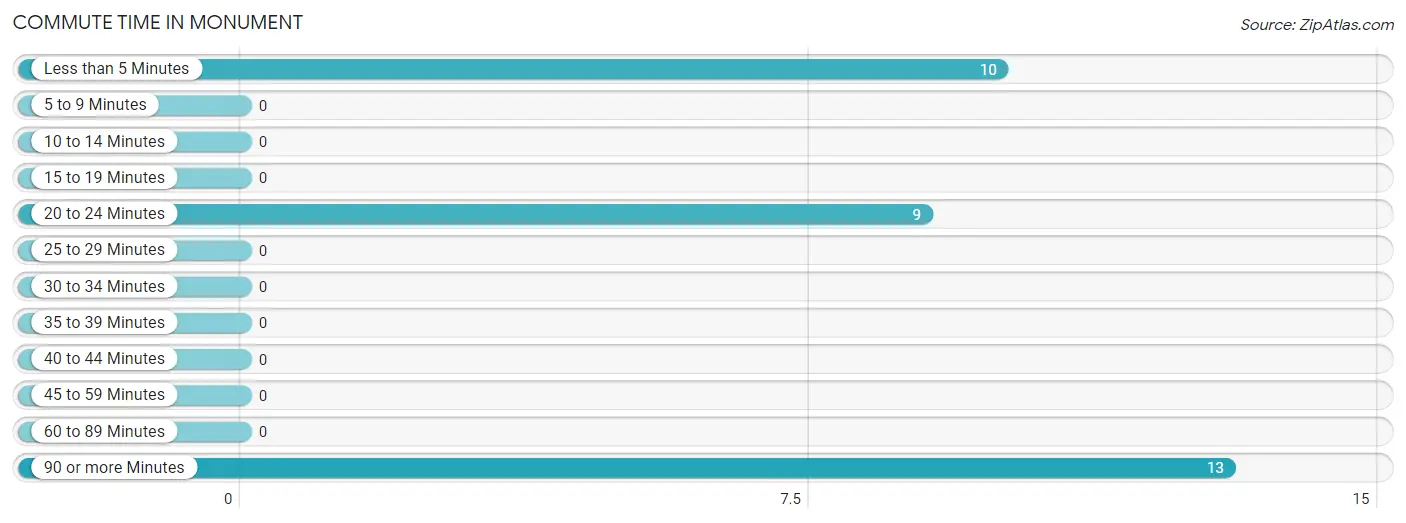
| Commute Time | # Commuters | % Commuters |
| Less than 5 Minutes | 10 | 31.2% |
| 5 to 9 Minutes | 0 | 0.0% |
| 10 to 14 Minutes | 0 | 0.0% |
| 15 to 19 Minutes | 0 | 0.0% |
| 20 to 24 Minutes | 9 | 28.1% |
| 25 to 29 Minutes | 0 | 0.0% |
| 30 to 34 Minutes | 0 | 0.0% |
| 35 to 39 Minutes | 0 | 0.0% |
| 40 to 44 Minutes | 0 | 0.0% |
| 45 to 59 Minutes | 0 | 0.0% |
| 60 to 89 Minutes | 0 | 0.0% |
| 90 or more Minutes | 13 | 40.6% |
Commute Time by Sex in Monument
The most common commute times in Monument are 90 or more minutes (13 commuters, 56.5%) for males and 20 to 24 minutes (9 commuters, 100.0%) for females.
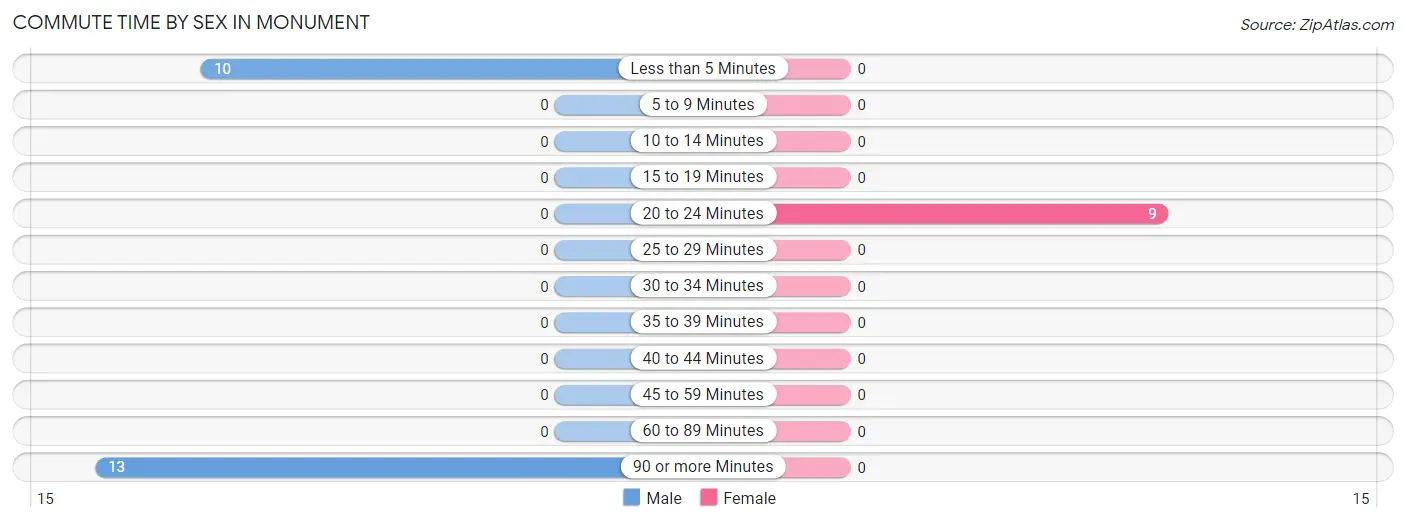
| Commute Time | Male | Female |
| Less than 5 Minutes | 10 (43.5%) | 0 (0.0%) |
| 5 to 9 Minutes | 0 (0.0%) | 0 (0.0%) |
| 10 to 14 Minutes | 0 (0.0%) | 0 (0.0%) |
| 15 to 19 Minutes | 0 (0.0%) | 0 (0.0%) |
| 20 to 24 Minutes | 0 (0.0%) | 9 (100.0%) |
| 25 to 29 Minutes | 0 (0.0%) | 0 (0.0%) |
| 30 to 34 Minutes | 0 (0.0%) | 0 (0.0%) |
| 35 to 39 Minutes | 0 (0.0%) | 0 (0.0%) |
| 40 to 44 Minutes | 0 (0.0%) | 0 (0.0%) |
| 45 to 59 Minutes | 0 (0.0%) | 0 (0.0%) |
| 60 to 89 Minutes | 0 (0.0%) | 0 (0.0%) |
| 90 or more Minutes | 13 (56.5%) | 0 (0.0%) |
Time of Departure to Work by Sex in Monument
The most frequent times of departure to work in Monument are 12:00 AM to 4:59 AM (13, 56.5%) for males and 6:00 AM to 6:29 AM (9, 100.0%) for females.
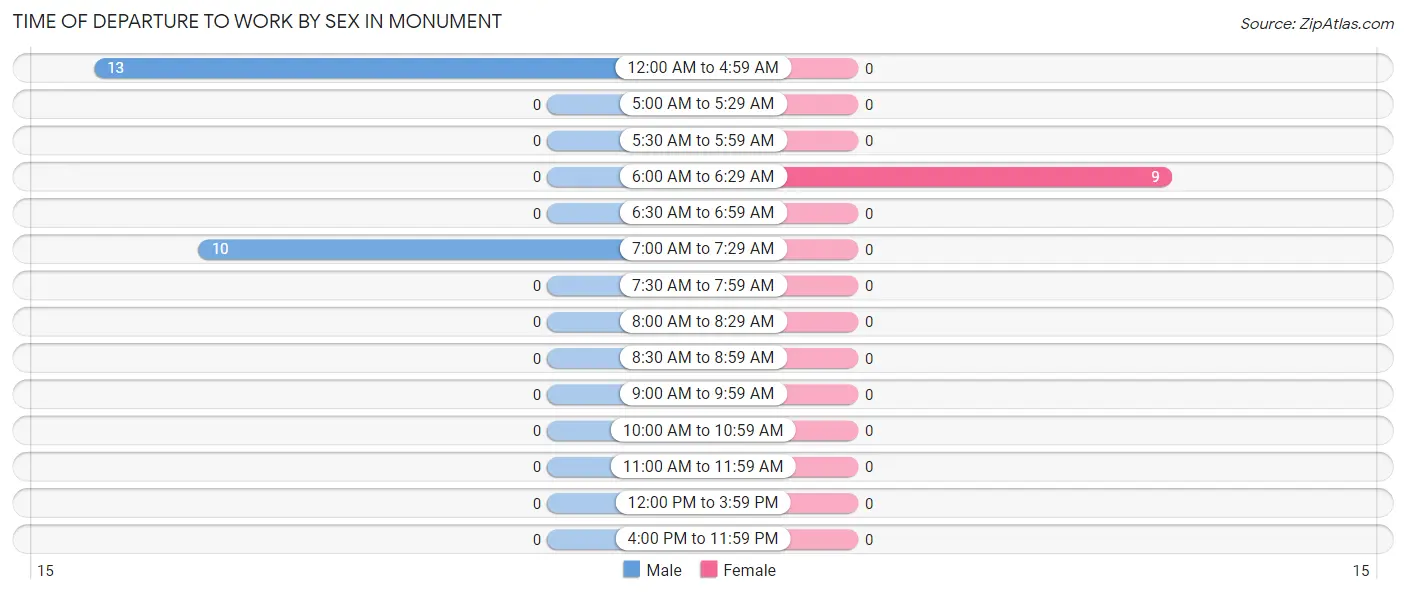
| Time of Departure | Male | Female |
| 12:00 AM to 4:59 AM | 13 (56.5%) | 0 (0.0%) |
| 5:00 AM to 5:29 AM | 0 (0.0%) | 0 (0.0%) |
| 5:30 AM to 5:59 AM | 0 (0.0%) | 0 (0.0%) |
| 6:00 AM to 6:29 AM | 0 (0.0%) | 9 (100.0%) |
| 6:30 AM to 6:59 AM | 0 (0.0%) | 0 (0.0%) |
| 7:00 AM to 7:29 AM | 10 (43.5%) | 0 (0.0%) |
| 7:30 AM to 7:59 AM | 0 (0.0%) | 0 (0.0%) |
| 8:00 AM to 8:29 AM | 0 (0.0%) | 0 (0.0%) |
| 8:30 AM to 8:59 AM | 0 (0.0%) | 0 (0.0%) |
| 9:00 AM to 9:59 AM | 0 (0.0%) | 0 (0.0%) |
| 10:00 AM to 10:59 AM | 0 (0.0%) | 0 (0.0%) |
| 11:00 AM to 11:59 AM | 0 (0.0%) | 0 (0.0%) |
| 12:00 PM to 3:59 PM | 0 (0.0%) | 0 (0.0%) |
| 4:00 PM to 11:59 PM | 0 (0.0%) | 0 (0.0%) |
| Total | 23 (100.0%) | 9 (100.0%) |
Housing Occupancy in Monument
Occupancy by Ownership in Monument
Of the total 61 dwellings in Monument, owner-occupied units account for 61 (100.0%), while renter-occupied units make up 0 (0.0%).
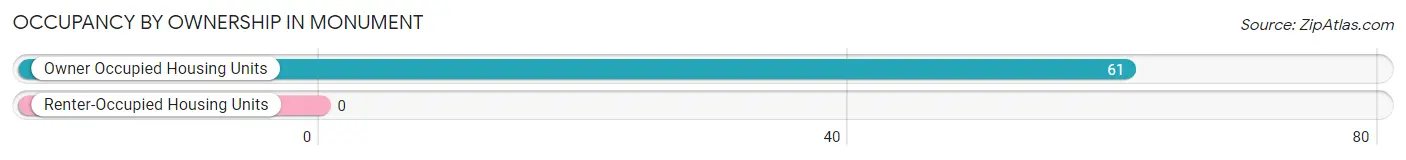
| Occupancy | # Housing Units | % Housing Units |
| Owner Occupied Housing Units | 61 | 100.0% |
| Renter-Occupied Housing Units | 0 | 0.0% |
| Total Occupied Housing Units | 61 | 100.0% |
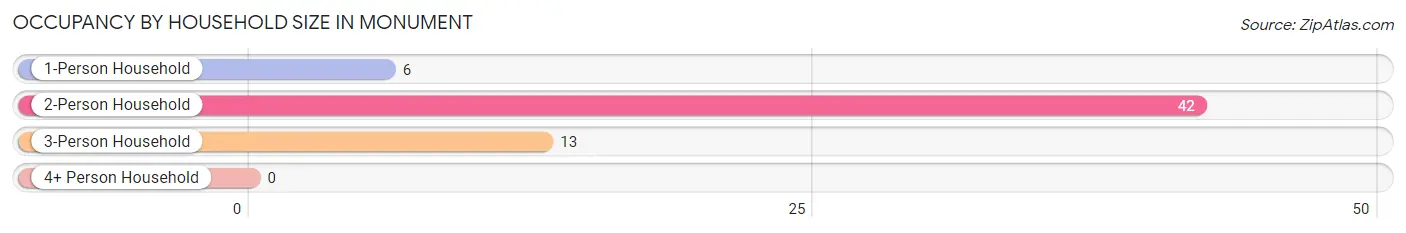
Occupancy by Household Size in Monument
| Household Size | # Housing Units | % Housing Units |
| 1-Person Household | 6 | 9.8% |
| 2-Person Household | 42 | 68.9% |
| 3-Person Household | 13 | 21.3% |
| 4+ Person Household | 0 | 0.0% |
| Total Housing Units | 61 | 100.0% |
Occupancy by Ownership by Household Size in Monument
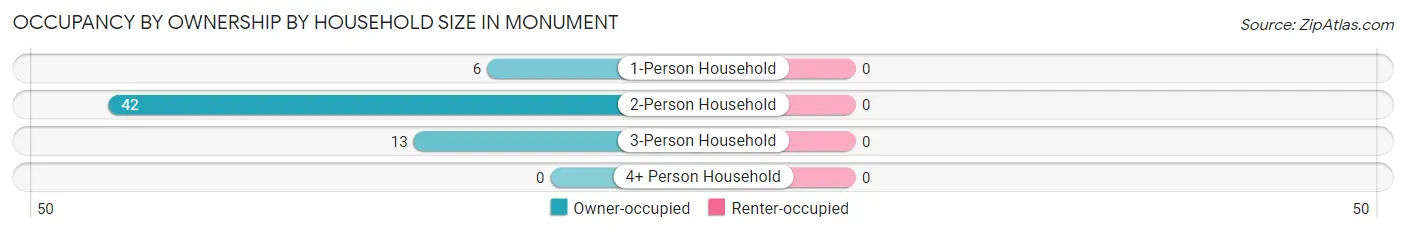
| Household Size | Owner-occupied | Renter-occupied |
| 1-Person Household | 6 (100.0%) | 0 (0.0%) |
| 2-Person Household | 42 (100.0%) | 0 (0.0%) |
| 3-Person Household | 13 (100.0%) | 0 (0.0%) |
| 4+ Person Household | 0 (0.0%) | 0 (0.0%) |
| Total Housing Units | 61 (100.0%) | 0 (0.0%) |
Occupancy by Educational Attainment in Monument
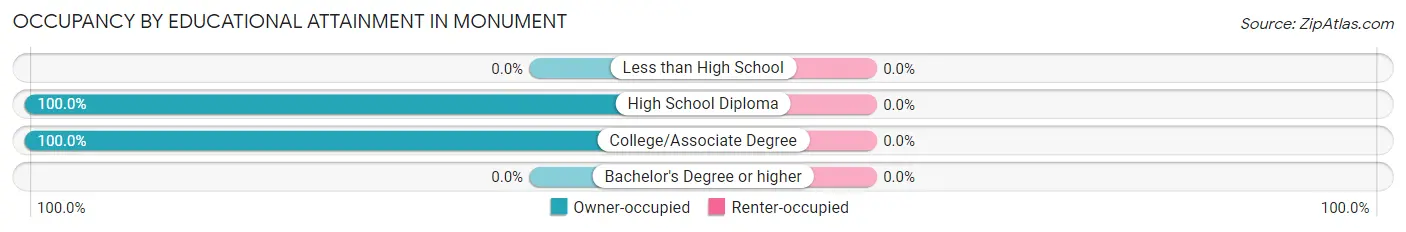
| Household Size | Owner-occupied | Renter-occupied |
| Less than High School | 0 (0.0%) | 0 (0.0%) |
| High School Diploma | 19 (100.0%) | 0 (0.0%) |
| College/Associate Degree | 42 (100.0%) | 0 (0.0%) |
| Bachelor's Degree or higher | 0 (0.0%) | 0 (0.0%) |
Occupancy by Age of Householder in Monument
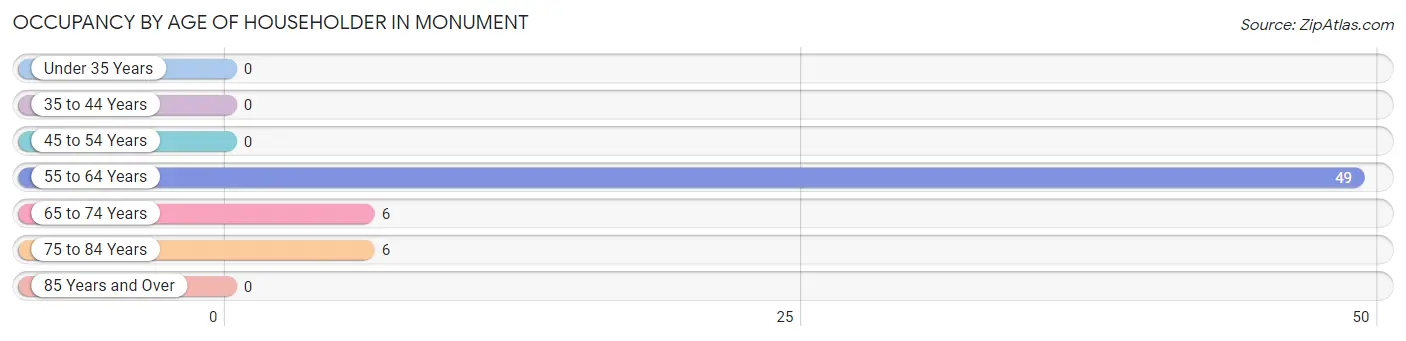
| Age Bracket | # Households | % Households |
| Under 35 Years | 0 | 0.0% |
| 35 to 44 Years | 0 | 0.0% |
| 45 to 54 Years | 0 | 0.0% |
| 55 to 64 Years | 49 | 80.3% |
| 65 to 74 Years | 6 | 9.8% |
| 75 to 84 Years | 6 | 9.8% |
| 85 Years and Over | 0 | 0.0% |
| Total | 61 | 100.0% |
Housing Finances in Monument
Median Income by Occupancy in Monument
| Occupancy Type | # Households | Median Income |
| Owner-Occupied | 61 (100.0%) | $0 |
| Renter-Occupied | 0 (0.0%) | $0 |
| Average | 61 (100.0%) | $0 |
Occupancy by Householder Income Bracket in Monument
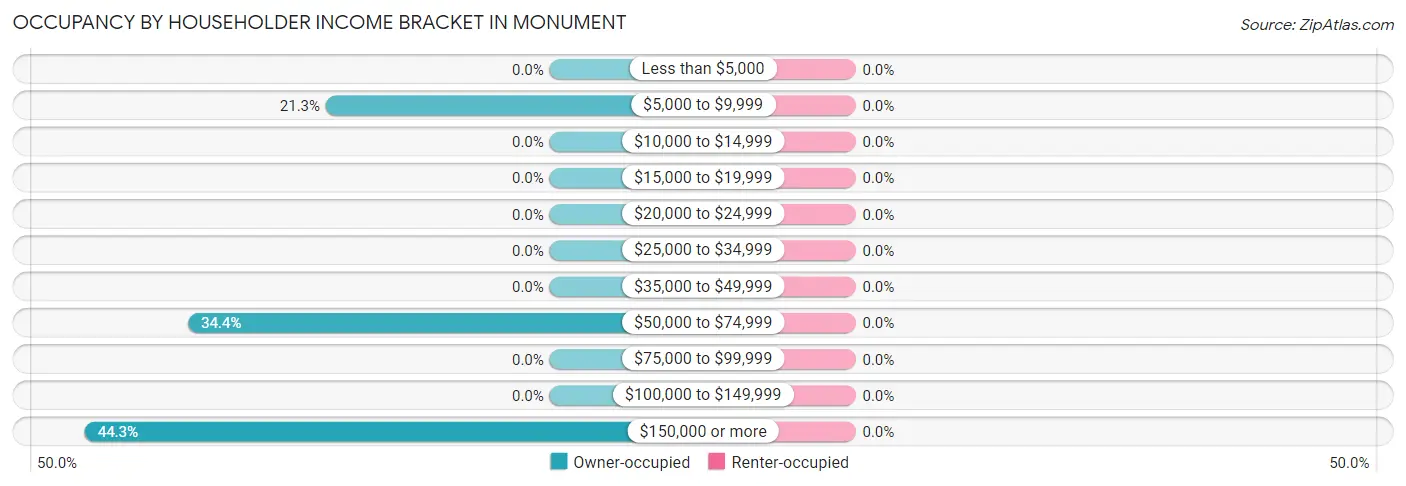
| Income Bracket | Owner-occupied | Renter-occupied |
| Less than $5,000 | 0 (0.0%) | 0 (0.0%) |
| $5,000 to $9,999 | 13 (21.3%) | 0 (0.0%) |
| $10,000 to $14,999 | 0 (0.0%) | 0 (0.0%) |
| $15,000 to $19,999 | 0 (0.0%) | 0 (0.0%) |
| $20,000 to $24,999 | 0 (0.0%) | 0 (0.0%) |
| $25,000 to $34,999 | 0 (0.0%) | 0 (0.0%) |
| $35,000 to $49,999 | 0 (0.0%) | 0 (0.0%) |
| $50,000 to $74,999 | 21 (34.4%) | 0 (0.0%) |
| $75,000 to $99,999 | 0 (0.0%) | 0 (0.0%) |
| $100,000 to $149,999 | 0 (0.0%) | 0 (0.0%) |
| $150,000 or more | 27 (44.3%) | 0 (0.0%) |
| Total | 61 (100.0%) | 0 (0.0%) |
Monthly Housing Cost Tiers in Monument
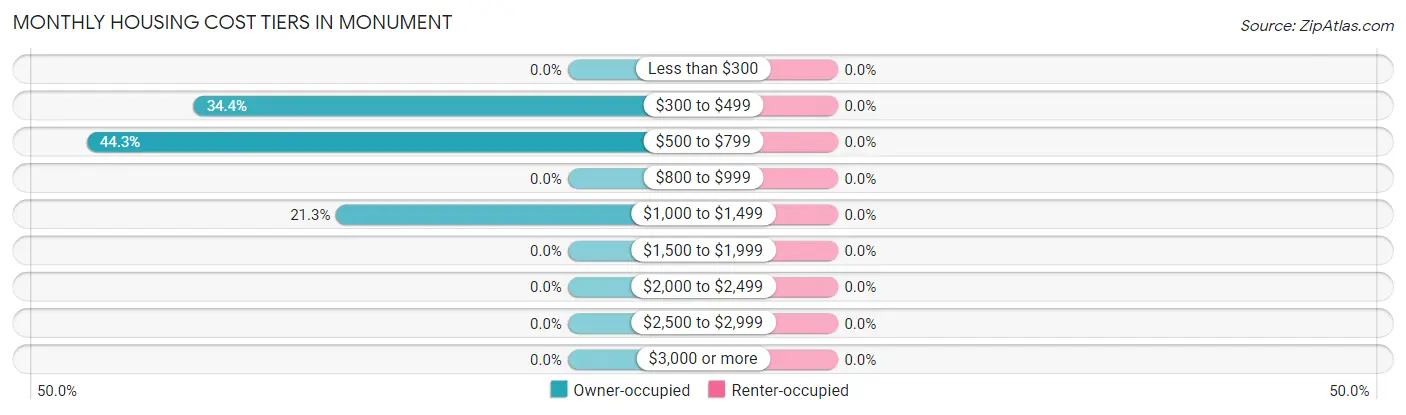
| Monthly Cost | Owner-occupied | Renter-occupied |
| Less than $300 | 0 (0.0%) | 0 (0.0%) |
| $300 to $499 | 21 (34.4%) | 0 (0.0%) |
| $500 to $799 | 27 (44.3%) | 0 (0.0%) |
| $800 to $999 | 0 (0.0%) | 0 (0.0%) |
| $1,000 to $1,499 | 13 (21.3%) | 0 (0.0%) |
| $1,500 to $1,999 | 0 (0.0%) | 0 (0.0%) |
| $2,000 to $2,499 | 0 (0.0%) | 0 (0.0%) |
| $2,500 to $2,999 | 0 (0.0%) | 0 (0.0%) |
| $3,000 or more | 0 (0.0%) | 0 (0.0%) |
| Total | 61 (100.0%) | 0 (0.0%) |
Physical Housing Characteristics in Monument
Housing Structures in Monument

| Structure Type | # Housing Units | % Housing Units |
| Single Unit, Detached | 61 | 100.0% |
| Single Unit, Attached | 0 | 0.0% |
| 2 Unit Apartments | 0 | 0.0% |
| 3 or 4 Unit Apartments | 0 | 0.0% |
| 5 to 9 Unit Apartments | 0 | 0.0% |
| 10 or more Apartments | 0 | 0.0% |
| Mobile Home / Other | 0 | 0.0% |
| Total | 61 | 100.0% |
Housing Structures by Occupancy in Monument
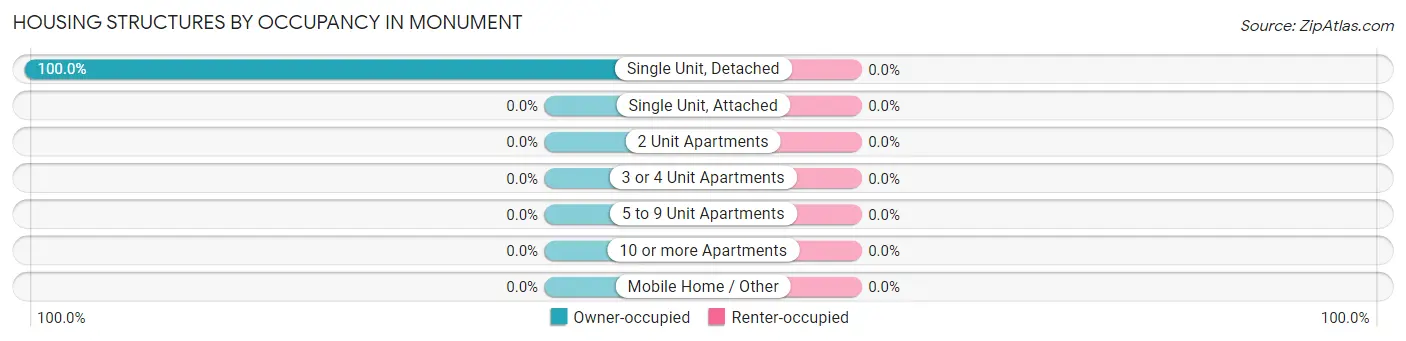
| Structure Type | Owner-occupied | Renter-occupied |
| Single Unit, Detached | 61 (100.0%) | 0 (0.0%) |
| Single Unit, Attached | 0 (0.0%) | 0 (0.0%) |
| 2 Unit Apartments | 0 (0.0%) | 0 (0.0%) |
| 3 or 4 Unit Apartments | 0 (0.0%) | 0 (0.0%) |
| 5 to 9 Unit Apartments | 0 (0.0%) | 0 (0.0%) |
| 10 or more Apartments | 0 (0.0%) | 0 (0.0%) |
| Mobile Home / Other | 0 (0.0%) | 0 (0.0%) |
| Total | 61 (100.0%) | 0 (0.0%) |
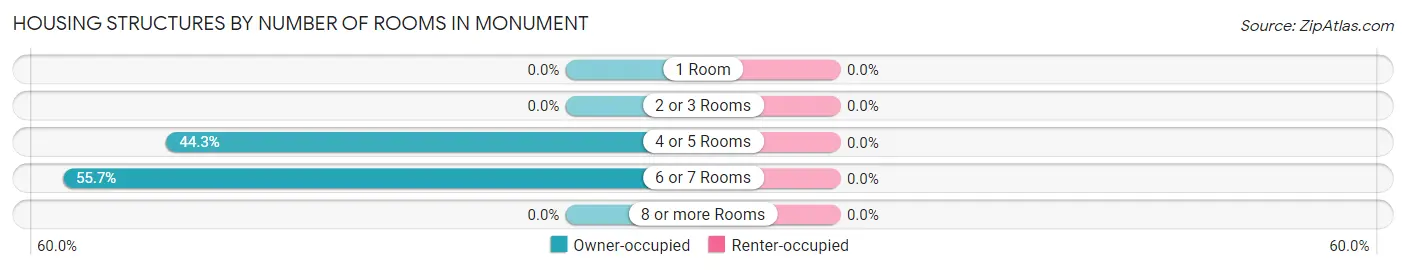
Housing Structures by Number of Rooms in Monument
| Number of Rooms | Owner-occupied | Renter-occupied |
| 1 Room | 0 (0.0%) | 0 (0.0%) |
| 2 or 3 Rooms | 0 (0.0%) | 0 (0.0%) |
| 4 or 5 Rooms | 27 (44.3%) | 0 (0.0%) |
| 6 or 7 Rooms | 34 (55.7%) | 0 (0.0%) |
| 8 or more Rooms | 0 (0.0%) | 0 (0.0%) |
| Total | 61 (100.0%) | 0 (0.0%) |
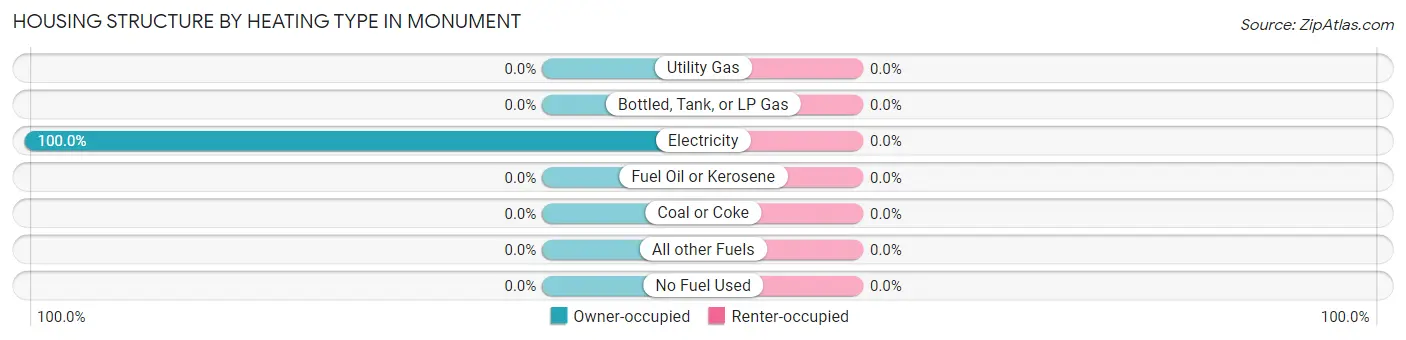
Housing Structure by Heating Type in Monument
| Heating Type | Owner-occupied | Renter-occupied |
| Utility Gas | 0 (0.0%) | 0 (0.0%) |
| Bottled, Tank, or LP Gas | 0 (0.0%) | 0 (0.0%) |
| Electricity | 61 (100.0%) | 0 (0.0%) |
| Fuel Oil or Kerosene | 0 (0.0%) | 0 (0.0%) |
| Coal or Coke | 0 (0.0%) | 0 (0.0%) |
| All other Fuels | 0 (0.0%) | 0 (0.0%) |
| No Fuel Used | 0 (0.0%) | 0 (0.0%) |
| Total | 61 (100.0%) | 0 (0.0%) |
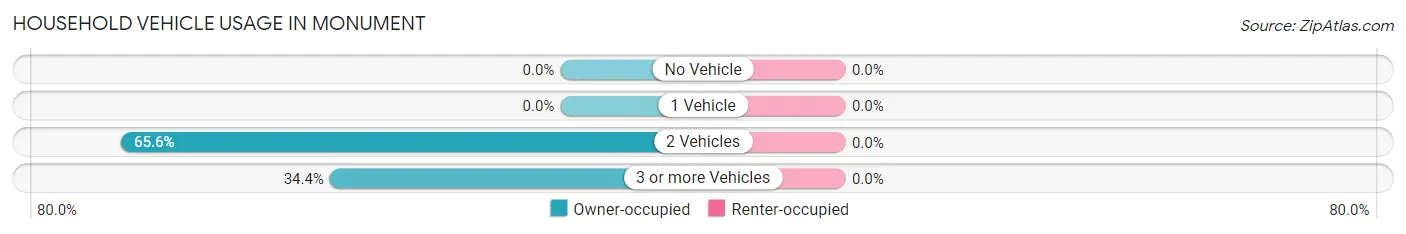
Household Vehicle Usage in Monument
| Vehicles per Household | Owner-occupied | Renter-occupied |
| No Vehicle | 0 (0.0%) | 0 (0.0%) |
| 1 Vehicle | 0 (0.0%) | 0 (0.0%) |
| 2 Vehicles | 40 (65.6%) | 0 (0.0%) |
| 3 or more Vehicles | 21 (34.4%) | 0 (0.0%) |
| Total | 61 (100.0%) | 0 (0.0%) |
Real Estate & Mortgages in Monument
Real Estate and Mortgage Overview in Monument
| Characteristic | Without Mortgage | With Mortgage |
| Housing Units | 48 | 13 |
| Median Property Value | $255,600 | $0 |
| Median Household Income | - | - |
| Monthly Housing Costs | $511 | $0 |
| Real Estate Taxes | $711 | $0 |
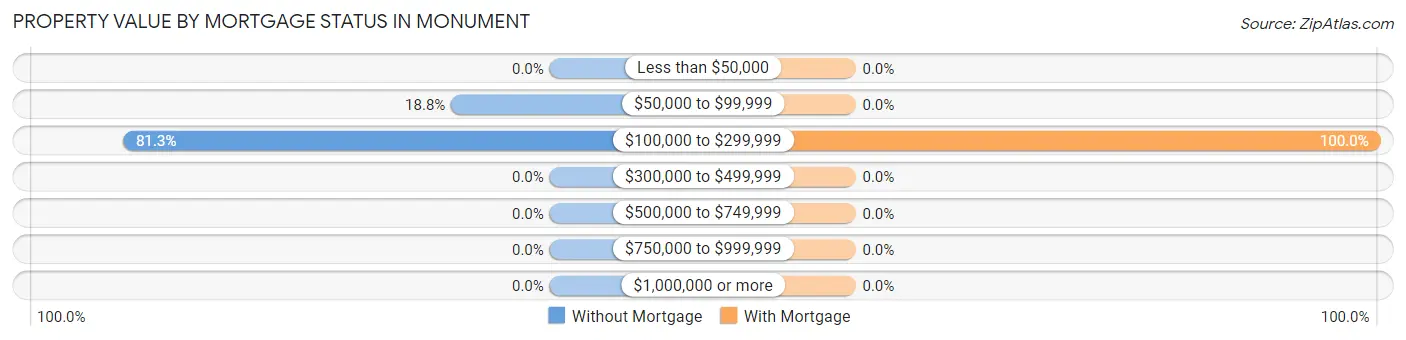
Property Value by Mortgage Status in Monument
| Property Value | Without Mortgage | With Mortgage |
| Less than $50,000 | 0 (0.0%) | 0 (0.0%) |
| $50,000 to $99,999 | 9 (18.8%) | 0 (0.0%) |
| $100,000 to $299,999 | 39 (81.2%) | 13 (100.0%) |
| $300,000 to $499,999 | 0 (0.0%) | 0 (0.0%) |
| $500,000 to $749,999 | 0 (0.0%) | 0 (0.0%) |
| $750,000 to $999,999 | 0 (0.0%) | 0 (0.0%) |
| $1,000,000 or more | 0 (0.0%) | 0 (0.0%) |
| Total | 48 (100.0%) | 13 (100.0%) |
Household Income by Mortgage Status in Monument
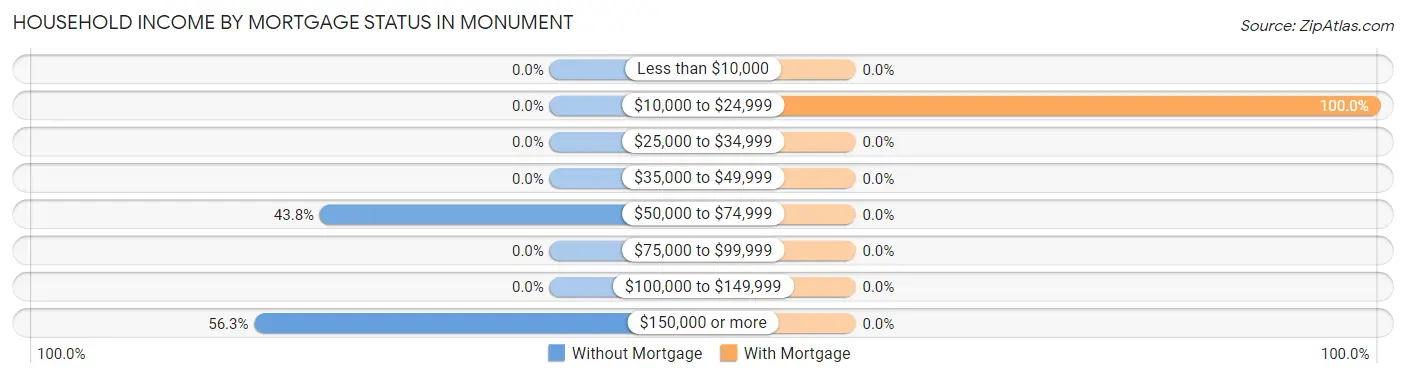
| Household Income | Without Mortgage | With Mortgage |
| Less than $10,000 | 0 (0.0%) | 0 (0.0%) |
| $10,000 to $24,999 | 0 (0.0%) | 13 (100.0%) |
| $25,000 to $34,999 | 0 (0.0%) | 0 (0.0%) |
| $35,000 to $49,999 | 0 (0.0%) | 0 (0.0%) |
| $50,000 to $74,999 | 21 (43.8%) | 0 (0.0%) |
| $75,000 to $99,999 | 0 (0.0%) | 0 (0.0%) |
| $100,000 to $149,999 | 0 (0.0%) | 0 (0.0%) |
| $150,000 or more | 27 (56.2%) | 0 (0.0%) |
| Total | 48 (100.0%) | 13 (100.0%) |
Property Value to Household Income Ratio in Monument
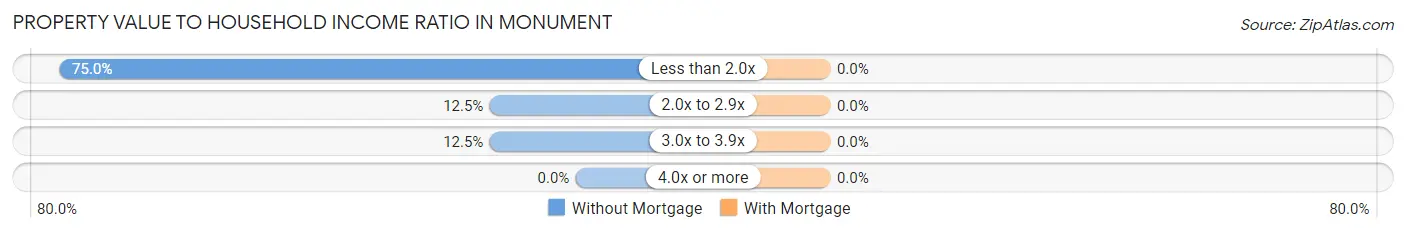
| Value-to-Income Ratio | Without Mortgage | With Mortgage |
| Less than 2.0x | 36 (75.0%) | 0 (0.0%) |
| 2.0x to 2.9x | 6 (12.5%) | 0 (0.0%) |
| 3.0x to 3.9x | 6 (12.5%) | 0 (0.0%) |
| 4.0x or more | 0 (0.0%) | 0 (0.0%) |
| Total | 48 (100.0%) | 13 (100.0%) |
Real Estate Taxes by Mortgage Status in Monument
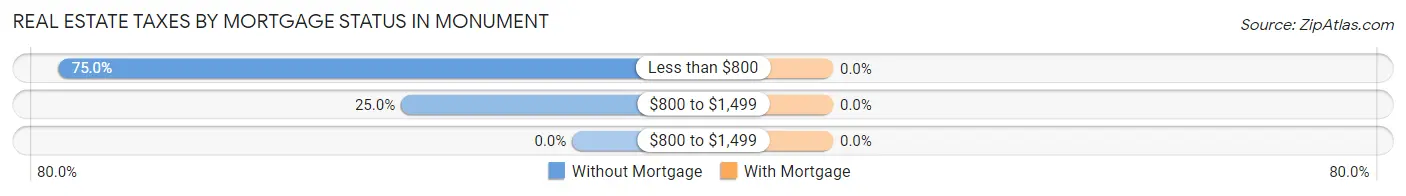
| Property Taxes | Without Mortgage | With Mortgage |
| Less than $800 | 36 (75.0%) | 0 (0.0%) |
| $800 to $1,499 | 12 (25.0%) | 0 (0.0%) |
| $800 to $1,499 | 0 (0.0%) | 0 (0.0%) |
| Total | 48 (100.0%) | 13 (100.0%) |
Health & Disability in Monument
Health Insurance Coverage by Age in Monument
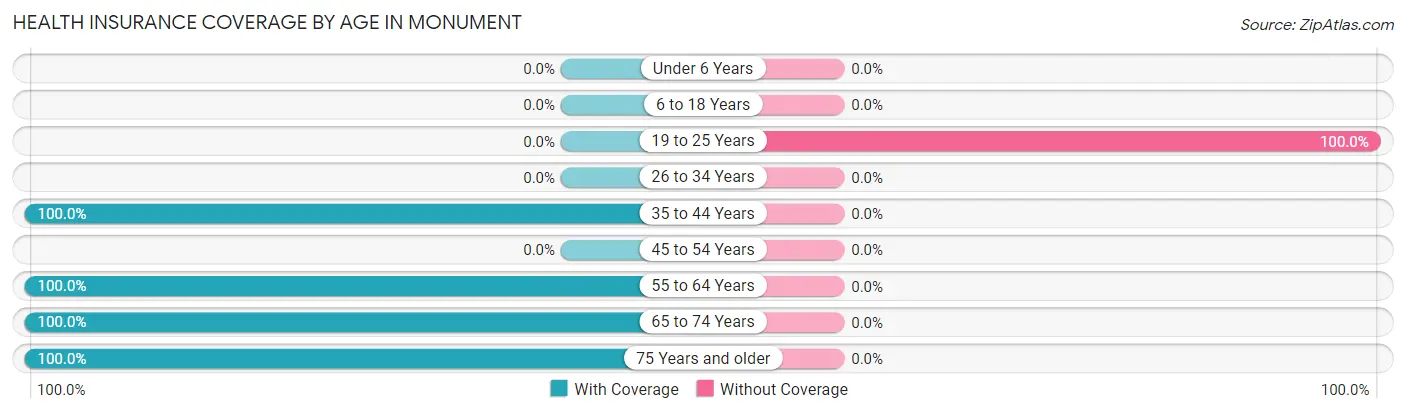
| Age Bracket | With Coverage | Without Coverage |
| Under 6 Years | 0 (0.0%) | 0 (0.0%) |
| 6 to 18 Years | 0 (0.0%) | 0 (0.0%) |
| 19 to 25 Years | 0 (0.0%) | 13 (100.0%) |
| 26 to 34 Years | 0 (0.0%) | 0 (0.0%) |
| 35 to 44 Years | 10 (100.0%) | 0 (0.0%) |
| 45 to 54 Years | 0 (0.0%) | 0 (0.0%) |
| 55 to 64 Years | 89 (100.0%) | 0 (0.0%) |
| 65 to 74 Years | 6 (100.0%) | 0 (0.0%) |
| 75 Years and older | 11 (100.0%) | 0 (0.0%) |
| Total | 116 (89.9%) | 13 (10.1%) |
Health Insurance Coverage by Citizenship Status in Monument
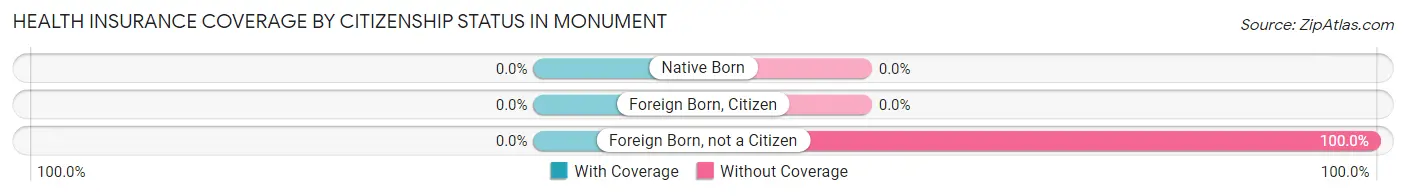
| Citizenship Status | With Coverage | Without Coverage |
| Native Born | 0 (0.0%) | 0 (0.0%) |
| Foreign Born, Citizen | 0 (0.0%) | 0 (0.0%) |
| Foreign Born, not a Citizen | 0 (0.0%) | 13 (100.0%) |
Health Insurance Coverage by Household Income in Monument
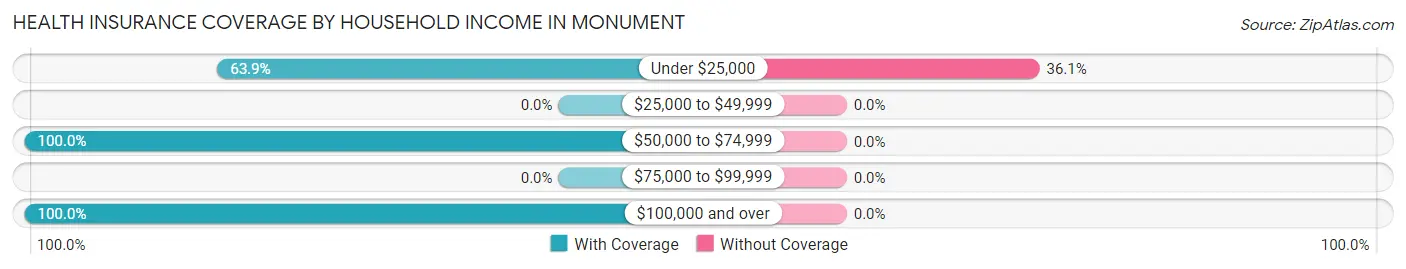
| Household Income | With Coverage | Without Coverage |
| Under $25,000 | 23 (63.9%) | 13 (36.1%) |
| $25,000 to $49,999 | 0 (0.0%) | 0 (0.0%) |
| $50,000 to $74,999 | 36 (100.0%) | 0 (0.0%) |
| $75,000 to $99,999 | 0 (0.0%) | 0 (0.0%) |
| $100,000 and over | 57 (100.0%) | 0 (0.0%) |
Public vs Private Health Insurance Coverage by Age in Monument
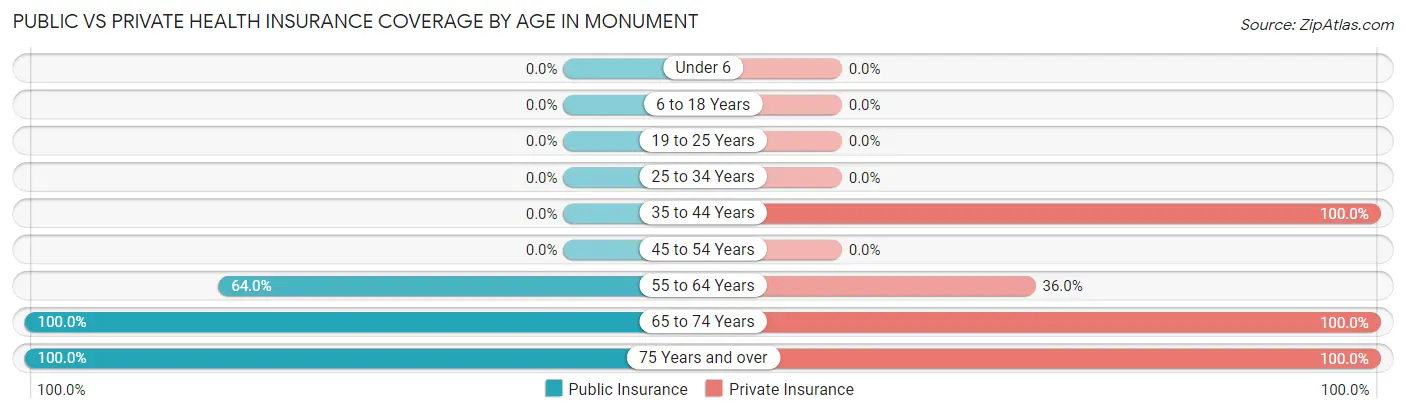
| Age Bracket | Public Insurance | Private Insurance |
| Under 6 | 0 (0.0%) | 0 (0.0%) |
| 6 to 18 Years | 0 (0.0%) | 0 (0.0%) |
| 19 to 25 Years | 0 (0.0%) | 0 (0.0%) |
| 25 to 34 Years | 0 (0.0%) | 0 (0.0%) |
| 35 to 44 Years | 0 (0.0%) | 10 (100.0%) |
| 45 to 54 Years | 0 (0.0%) | 0 (0.0%) |
| 55 to 64 Years | 57 (64.0%) | 32 (36.0%) |
| 65 to 74 Years | 6 (100.0%) | 6 (100.0%) |
| 75 Years and over | 11 (100.0%) | 11 (100.0%) |
| Total | 74 (57.4%) | 59 (45.7%) |
Disability Status by Sex by Age in Monument
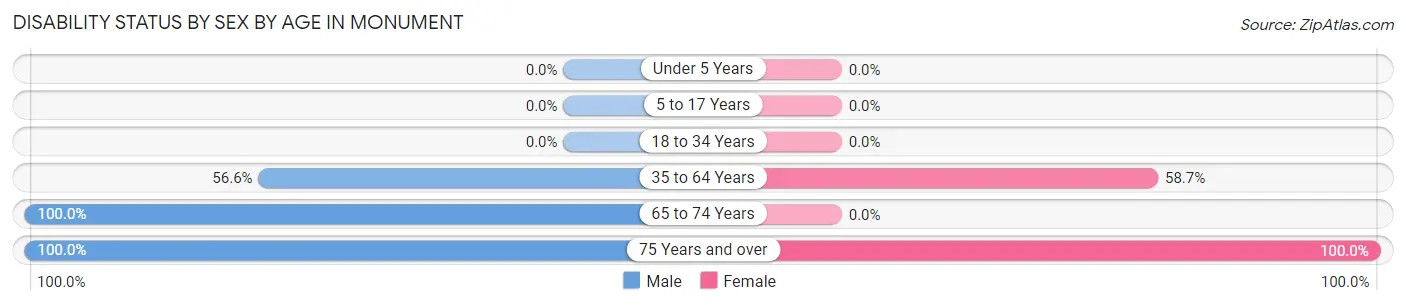
| Age Bracket | Male | Female |
| Under 5 Years | 0 (0.0%) | 0 (0.0%) |
| 5 to 17 Years | 0 (0.0%) | 0 (0.0%) |
| 18 to 34 Years | 0 (0.0%) | 0 (0.0%) |
| 35 to 64 Years | 30 (56.6%) | 27 (58.7%) |
| 65 to 74 Years | 6 (100.0%) | 0 (0.0%) |
| 75 Years and over | 6 (100.0%) | 5 (100.0%) |
Disability Class by Sex by Age in Monument
Disability Class: Hearing Difficulty
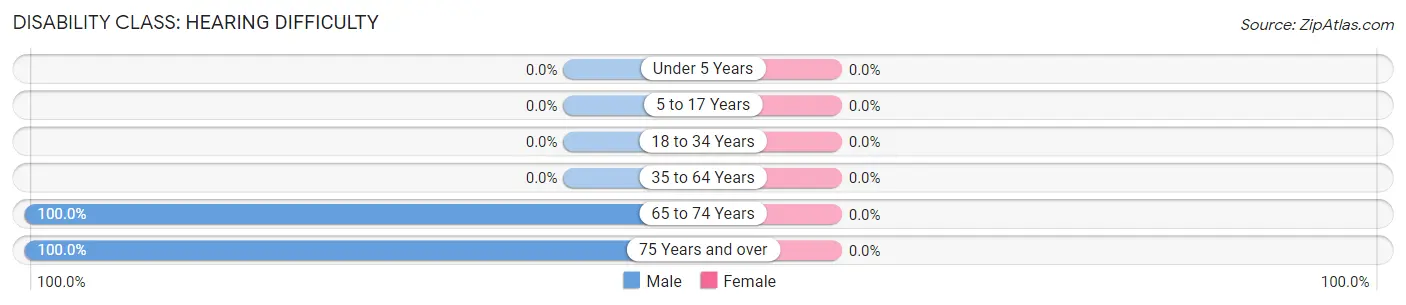
| Age Bracket | Male | Female |
| Under 5 Years | 0 (0.0%) | 0 (0.0%) |
| 5 to 17 Years | 0 (0.0%) | 0 (0.0%) |
| 18 to 34 Years | 0 (0.0%) | 0 (0.0%) |
| 35 to 64 Years | 0 (0.0%) | 0 (0.0%) |
| 65 to 74 Years | 6 (100.0%) | 0 (0.0%) |
| 75 Years and over | 6 (100.0%) | 0 (0.0%) |
Disability Class: Vision Difficulty
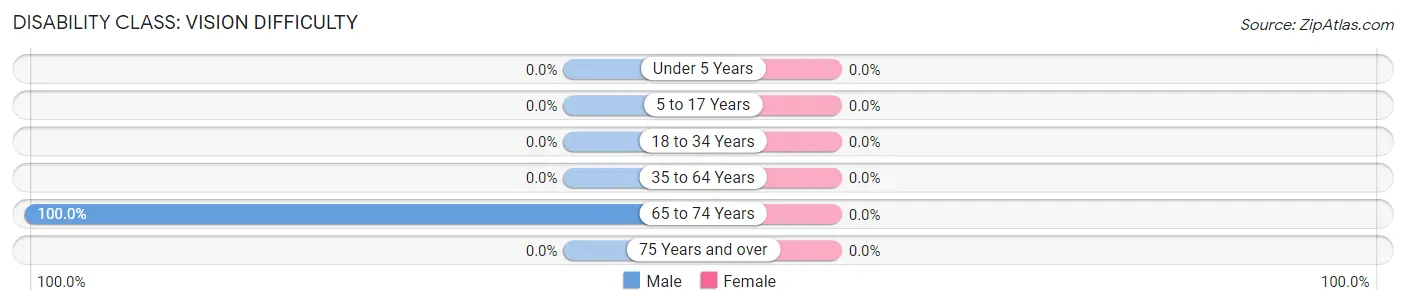
| Age Bracket | Male | Female |
| Under 5 Years | 0 (0.0%) | 0 (0.0%) |
| 5 to 17 Years | 0 (0.0%) | 0 (0.0%) |
| 18 to 34 Years | 0 (0.0%) | 0 (0.0%) |
| 35 to 64 Years | 0 (0.0%) | 0 (0.0%) |
| 65 to 74 Years | 6 (100.0%) | 0 (0.0%) |
| 75 Years and over | 0 (0.0%) | 0 (0.0%) |
Disability Class: Cognitive Difficulty
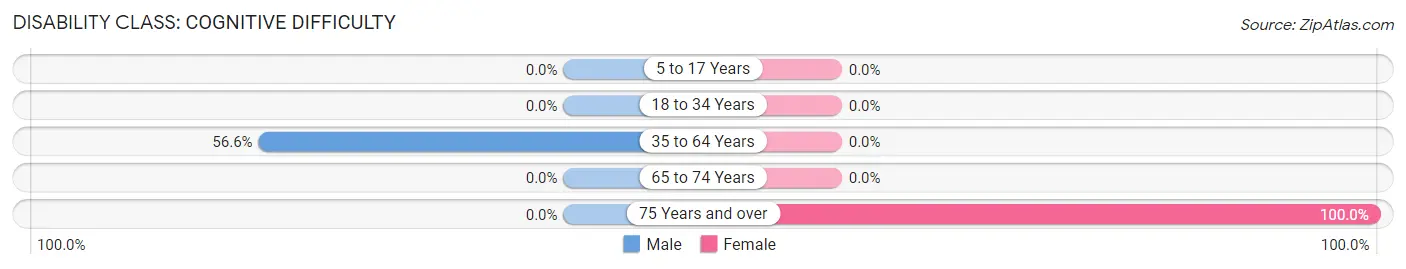
| Age Bracket | Male | Female |
| 5 to 17 Years | 0 (0.0%) | 0 (0.0%) |
| 18 to 34 Years | 0 (0.0%) | 0 (0.0%) |
| 35 to 64 Years | 30 (56.6%) | 0 (0.0%) |
| 65 to 74 Years | 0 (0.0%) | 0 (0.0%) |
| 75 Years and over | 0 (0.0%) | 5 (100.0%) |
Disability Class: Ambulatory Difficulty
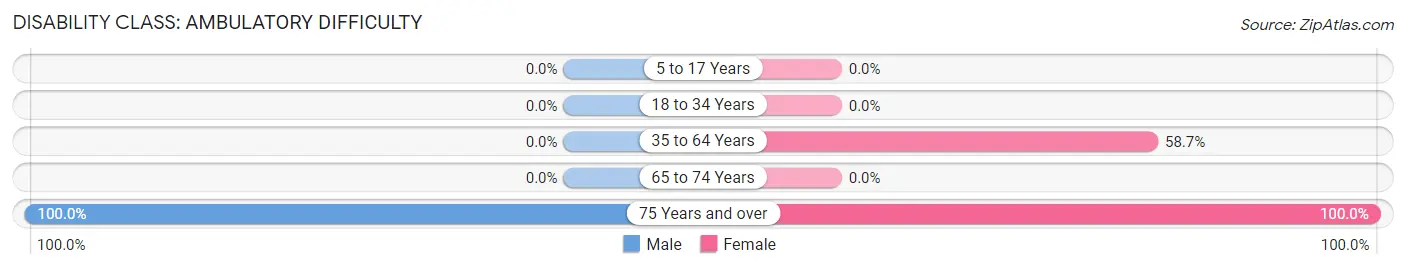
| Age Bracket | Male | Female |
| 5 to 17 Years | 0 (0.0%) | 0 (0.0%) |
| 18 to 34 Years | 0 (0.0%) | 0 (0.0%) |
| 35 to 64 Years | 0 (0.0%) | 27 (58.7%) |
| 65 to 74 Years | 0 (0.0%) | 0 (0.0%) |
| 75 Years and over | 6 (100.0%) | 5 (100.0%) |
Disability Class: Self-Care Difficulty
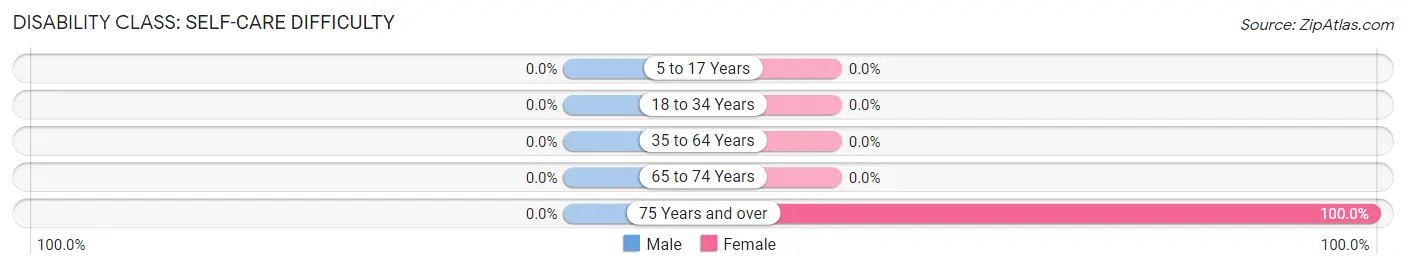
| Age Bracket | Male | Female |
| 5 to 17 Years | 0 (0.0%) | 0 (0.0%) |
| 18 to 34 Years | 0 (0.0%) | 0 (0.0%) |
| 35 to 64 Years | 0 (0.0%) | 0 (0.0%) |
| 65 to 74 Years | 0 (0.0%) | 0 (0.0%) |
| 75 Years and over | 0 (0.0%) | 5 (100.0%) |
Technology Access in Monument
Computing Device Access in Monument
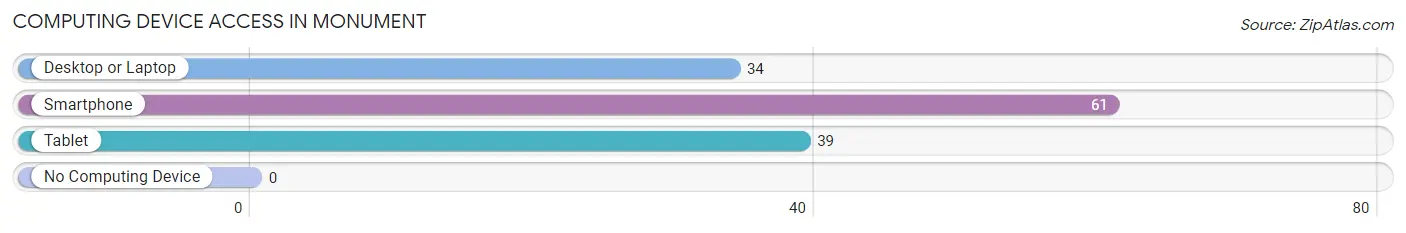
| Device Type | # Households | % Households |
| Desktop or Laptop | 34 | 55.7% |
| Smartphone | 61 | 100.0% |
| Tablet | 39 | 63.9% |
| No Computing Device | 0 | 0.0% |
| Total | 61 | 100.0% |
Internet Access in Monument
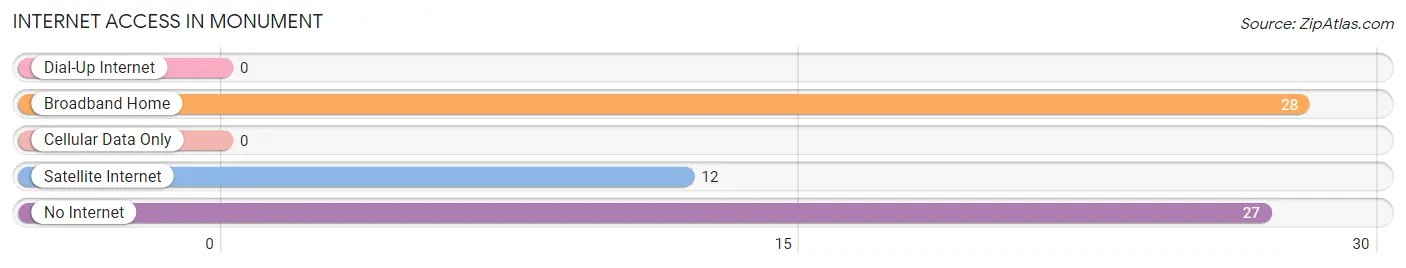
| Internet Type | # Households | % Households |
| Dial-Up Internet | 0 | 0.0% |
| Broadband Home | 28 | 45.9% |
| Cellular Data Only | 0 | 0.0% |
| Satellite Internet | 12 | 19.7% |
| No Internet | 27 | 44.3% |
| Total | 61 | 100.0% |
Monument Summary
Monument, New Mexico is a small town located in the northeastern corner of the state, near the Texas border. It is part of the Las Cruces Metropolitan Statistical Area and is home to a population of just over 1,000 people. The town was founded in 1881 and has a rich history that is deeply rooted in the area’s Native American heritage.
Geography
Monument is located in the northeastern corner of New Mexico, near the Texas border. It is situated in the Chihuahuan Desert, which is characterized by hot, dry summers and mild winters. The town is located at an elevation of 4,000 feet and is surrounded by the Organ Mountains to the east and the San Andres Mountains to the west. The town is located on the banks of the Rio Grande, which provides a source of irrigation for the area’s agricultural industry.
Economy
The economy of Monument is largely based on agriculture. The town is home to a number of farms and ranches that produce a variety of crops, including alfalfa, cotton, and pecans. The town is also home to a number of small businesses, including restaurants, retail stores, and service providers. The town is also home to a number of manufacturing companies, including a furniture factory and a plastics factory.
Demographics
As of the 2010 census, Monument had a population of 1,072 people. The racial makeup of the town was 79.3% White, 0.7% African American, 0.7% Native American, 0.3% Asian, 0.1% Pacific Islander, and 18.2% from other races. The median household income was $30,938, and the median family income was $35,625. The per capita income was $14,945.
Conclusion
Monument, New Mexico is a small town located in the northeastern corner of the state, near the Texas border. It is part of the Las Cruces Metropolitan Statistical Area and is home to a population of just over 1,000 people. The town was founded in 1881 and has a rich history that is deeply rooted in the area’s Native American heritage. The economy of Monument is largely based on agriculture, and the town is home to a number of small businesses. As of the 2010 census, Monument had a population of 1,072 people, with a median household income of $30,938 and a median family income of $35,625.
Common Questions
What is Per Capita Income in Monument?
Per Capita income in Monument is $54,539.
What is Inequality or Gini Index in Monument?
Inequality or Gini Index in Monument is 0.39.
What is the Total Population of Monument?
Total Population of Monument is 129.
What is the Total Male Population of Monument?
Total Male Population of Monument is 65.
What is the Total Female Population of Monument?
Total Female Population of Monument is 64.
What is the Ratio of Males per 100 Females in Monument?
There are 101.56 Males per 100 Females in Monument.
What is the Ratio of Females per 100 Males in Monument?
There are 98.46 Females per 100 Males in Monument.
What is the Median Population Age in Monument?
Median Population Age in Monument is 60.2 Years.
What is the Average Family Size in Monument
Average Family Size in Monument is 2.2 People.
What is the Average Household Size in Monument
Average Household Size in Monument is 2.1 People.
How Large is the Labor Force in Monument?
There are 62 People in the Labor Forcein in Monument.
What is the Percentage of People in the Labor Force in Monument?
48.1% of People are in the Labor Force in Monument.