Cities with the Highest Percentage of Population Employed in Transportation & Warehousing in New Hampshire
RELATED REPORTS & OPTIONS
Transportation & Warehousing
New Hampshire
Compare Cities
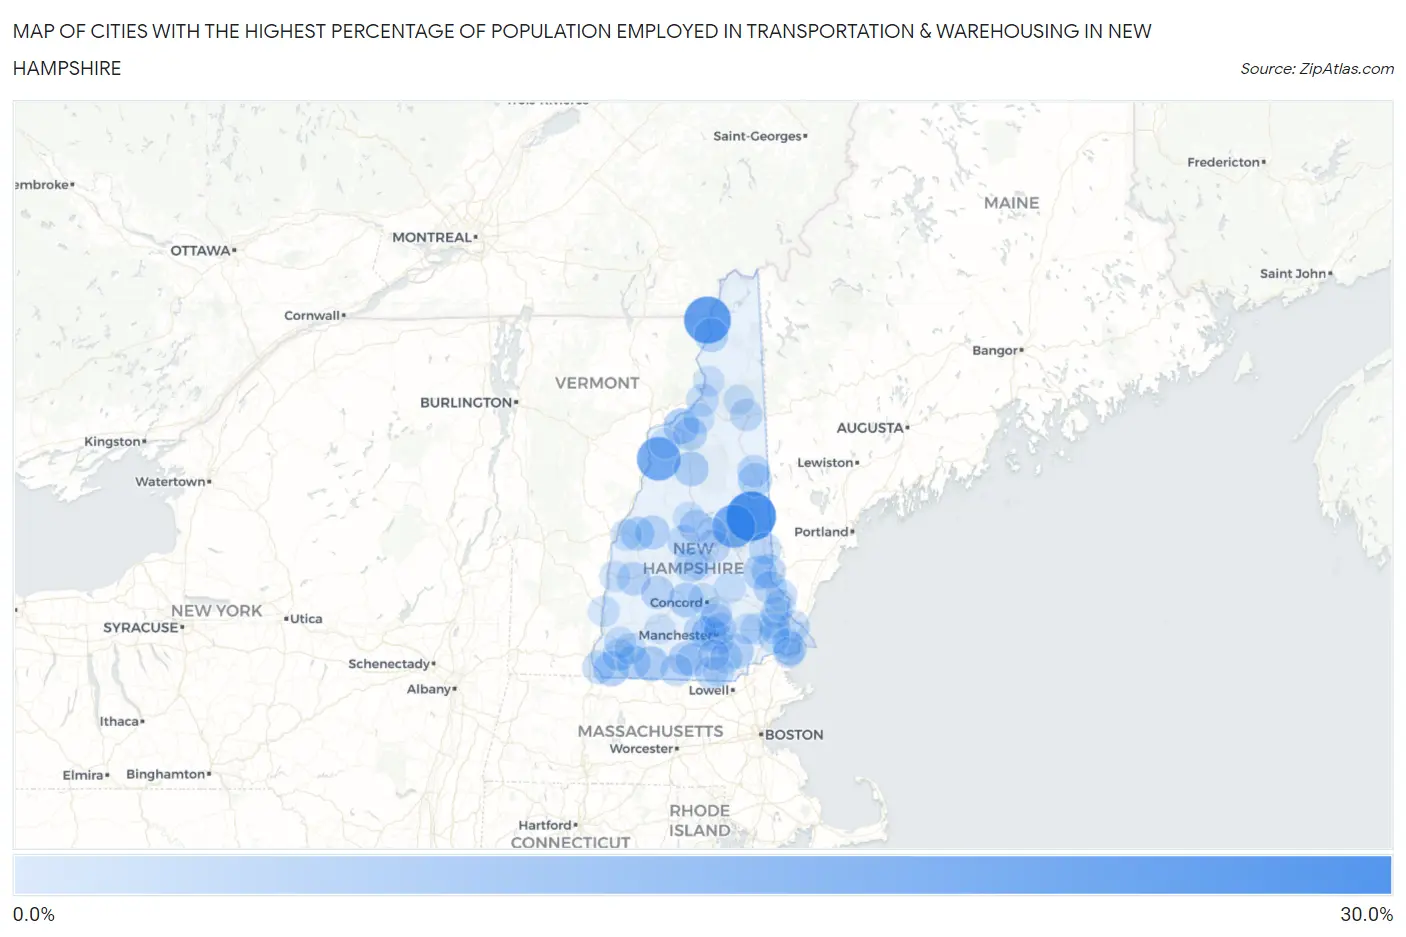
Map of Cities with the Highest Percentage of Population Employed in Transportation & Warehousing in New Hampshire
0.0%
30.0%
Cities with the Highest Percentage of Population Employed in Transportation & Warehousing in New Hampshire
| City | % Employed | vs State | vs National | |
| 1. | Center Ossipee | 25.1% | 3.1%(+21.9)#1 | 4.9%(+20.1)#534 |
| 2. | West Stewartstown | 21.5% | 3.1%(+18.3)#2 | 4.9%(+16.5)#721 |
| 3. | Mountain Lakes | 17.2% | 3.1%(+14.1)#3 | 4.9%(+12.3)#1,123 |
| 4. | Melvin Village | 16.7% | 3.1%(+13.5)#4 | 4.9%(+11.7)#1,226 |
| 5. | Littleton | 7.0% | 3.1%(+3.89)#5 | 4.9%(+2.08)#6,746 |
| 6. | Winchester | 6.5% | 3.1%(+3.36)#6 | 4.9%(+1.55)#7,685 |
| 7. | Jaffrey | 6.5% | 3.1%(+3.35)#7 | 4.9%(+1.54)#7,714 |
| 8. | Pinardville | 6.1% | 3.1%(+2.95)#8 | 4.9%(+1.14)#8,500 |
| 9. | Lincoln | 5.9% | 3.1%(+2.80)#9 | 4.9%(+0.992)#8,789 |
| 10. | Contoocook | 5.9% | 3.1%(+2.75)#10 | 4.9%(+0.936)#8,899 |
| 11. | Derry | 5.6% | 3.1%(+2.50)#11 | 4.9%(+0.686)#9,472 |
| 12. | Milton | 5.2% | 3.1%(+2.11)#12 | 4.9%(+0.294)#10,415 |
| 13. | Colebrook | 5.1% | 3.1%(+1.97)#13 | 4.9%(+0.156)#10,777 |
| 14. | Canaan | 5.1% | 3.1%(+1.95)#14 | 4.9%(+0.138)#10,833 |
| 15. | Farmington | 5.0% | 3.1%(+1.85)#15 | 4.9%(+0.041)#11,107 |
| 16. | Conway | 5.0% | 3.1%(+1.84)#16 | 4.9%(+0.025)#11,139 |
| 17. | Enfield | 4.9% | 3.1%(+1.78)#17 | 4.9%(-0.033)#11,291 |
| 18. | Troy | 4.8% | 3.1%(+1.65)#18 | 4.9%(-0.166)#11,621 |
| 19. | Franklin | 4.7% | 3.1%(+1.58)#19 | 4.9%(-0.236)#11,835 |
| 20. | Bethlehem | 4.6% | 3.1%(+1.44)#20 | 4.9%(-0.374)#12,235 |
| 21. | Hampton Beach | 4.5% | 3.1%(+1.35)#21 | 4.9%(-0.462)#12,517 |
| 22. | Wilton | 4.4% | 3.1%(+1.29)#22 | 4.9%(-0.525)#12,712 |
| 23. | Newport | 4.4% | 3.1%(+1.28)#23 | 4.9%(-0.533)#12,739 |
| 24. | Manchester | 4.3% | 3.1%(+1.18)#24 | 4.9%(-0.632)#13,015 |
| 25. | Bradford | 4.3% | 3.1%(+1.12)#25 | 4.9%(-0.691)#13,210 |
| 26. | Rochester | 3.9% | 3.1%(+0.764)#26 | 4.9%(-1.05)#14,273 |
| 27. | Milford | 3.9% | 3.1%(+0.730)#27 | 4.9%(-1.08)#14,397 |
| 28. | Laconia | 3.7% | 3.1%(+0.586)#28 | 4.9%(-1.22)#14,834 |
| 29. | Ashland | 3.7% | 3.1%(+0.574)#29 | 4.9%(-1.24)#14,880 |
| 30. | Hooksett | 3.7% | 3.1%(+0.573)#30 | 4.9%(-1.24)#14,882 |
| 31. | Hinsdale | 3.6% | 3.1%(+0.455)#31 | 4.9%(-1.36)#15,294 |
| 32. | Nashua | 3.5% | 3.1%(+0.354)#32 | 4.9%(-1.46)#15,643 |
| 33. | Lancaster | 3.4% | 3.1%(+0.304)#33 | 4.9%(-1.51)#15,841 |
| 34. | Bristol | 3.4% | 3.1%(+0.276)#34 | 4.9%(-1.53)#15,927 |
| 35. | North Conway | 3.4% | 3.1%(+0.265)#35 | 4.9%(-1.55)#15,969 |
| 36. | Goffstown | 3.4% | 3.1%(+0.246)#36 | 4.9%(-1.57)#16,029 |
| 37. | West Swanzey | 3.4% | 3.1%(+0.231)#37 | 4.9%(-1.58)#16,075 |
| 38. | Londonderry | 3.1% | 3.1%(-0.012)#38 | 4.9%(-1.82)#16,928 |
| 39. | Gorham | 3.1% | 3.1%(-0.025)#39 | 4.9%(-1.84)#16,976 |
| 40. | Greenville | 3.0% | 3.1%(-0.131)#40 | 4.9%(-1.94)#17,303 |
| 41. | Sanbornville | 2.9% | 3.1%(-0.278)#41 | 4.9%(-2.09)#17,776 |
| 42. | Newmarket | 2.8% | 3.1%(-0.322)#42 | 4.9%(-2.13)#17,919 |
| 43. | South Hooksett | 2.8% | 3.1%(-0.330)#43 | 4.9%(-2.14)#17,943 |
| 44. | Portsmouth | 2.5% | 3.1%(-0.671)#44 | 4.9%(-2.48)#19,067 |
| 45. | Keene | 2.4% | 3.1%(-0.736)#45 | 4.9%(-2.55)#19,293 |
| 46. | Epping | 2.2% | 3.1%(-0.938)#46 | 4.9%(-2.75)#19,929 |
| 47. | Lebanon | 2.1% | 3.1%(-1.01)#47 | 4.9%(-2.82)#20,178 |
| 48. | Somersworth | 2.1% | 3.1%(-1.07)#48 | 4.9%(-2.89)#20,408 |
| 49. | Marlborough | 2.1% | 3.1%(-1.08)#49 | 4.9%(-2.89)#20,414 |
| 50. | Exeter | 2.1% | 3.1%(-1.08)#50 | 4.9%(-2.90)#20,448 |
| 51. | North Walpole | 2.0% | 3.1%(-1.16)#51 | 4.9%(-2.97)#20,697 |
| 52. | Pittsfield | 1.9% | 3.1%(-1.20)#52 | 4.9%(-3.01)#20,806 |
| 53. | Concord | 1.9% | 3.1%(-1.22)#53 | 4.9%(-3.04)#20,881 |
| 54. | Durham | 1.9% | 3.1%(-1.24)#54 | 4.9%(-3.05)#20,929 |
| 55. | Plymouth | 1.9% | 3.1%(-1.26)#55 | 4.9%(-3.07)#20,990 |
| 56. | Dover | 1.8% | 3.1%(-1.29)#56 | 4.9%(-3.10)#21,065 |
| 57. | Hampton | 1.8% | 3.1%(-1.33)#57 | 4.9%(-3.14)#21,180 |
| 58. | Whitefield | 1.8% | 3.1%(-1.33)#58 | 4.9%(-3.14)#21,186 |
| 59. | Claremont | 1.8% | 3.1%(-1.36)#59 | 4.9%(-3.17)#21,255 |
| 60. | Hudson | 1.8% | 3.1%(-1.36)#60 | 4.9%(-3.17)#21,259 |
| 61. | Newfields | 1.8% | 3.1%(-1.38)#61 | 4.9%(-3.19)#21,304 |
| 62. | Seabrook Beach | 1.7% | 3.1%(-1.41)#62 | 4.9%(-3.22)#21,394 |
| 63. | East Merrimack | 1.6% | 3.1%(-1.57)#63 | 4.9%(-3.38)#21,830 |
| 64. | Raymond | 1.5% | 3.1%(-1.60)#64 | 4.9%(-3.42)#21,916 |
| 65. | Groveton | 1.5% | 3.1%(-1.62)#65 | 4.9%(-3.43)#21,950 |
| 66. | Lisbon | 1.5% | 3.1%(-1.67)#66 | 4.9%(-3.48)#22,115 |
| 67. | Suncook | 1.4% | 3.1%(-1.70)#67 | 4.9%(-3.51)#22,170 |
| 68. | Berlin | 1.2% | 3.1%(-1.91)#68 | 4.9%(-3.73)#22,743 |
| 69. | Meredith | 0.94% | 3.1%(-2.19)#69 | 4.9%(-4.01)#23,413 |
| 70. | Tilton Northfield | 0.88% | 3.1%(-2.26)#70 | 4.9%(-4.07)#23,505 |
| 71. | Antrim | 0.60% | 3.1%(-2.53)#71 | 4.9%(-4.34)#24,031 |
1
Common Questions
What are the Top 10 Cities with the Highest Percentage of Population Employed in Transportation & Warehousing in New Hampshire?
Top 10 Cities with the Highest Percentage of Population Employed in Transportation & Warehousing in New Hampshire are:
#1
25.1%
#2
21.5%
#3
17.2%
#4
16.7%
#5
7.0%
#6
6.5%
#7
6.5%
#8
6.1%
#9
5.9%
#10
5.9%
What city has the Highest Percentage of Population Employed in Transportation & Warehousing in New Hampshire?
Center Ossipee has the Highest Percentage of Population Employed in Transportation & Warehousing in New Hampshire with 25.1%.
What is the Percentage of Population Employed in Transportation & Warehousing in the State of New Hampshire?
Percentage of Population Employed in Transportation & Warehousing in New Hampshire is 3.1%.
What is the Percentage of Population Employed in Transportation & Warehousing in the United States?
Percentage of Population Employed in Transportation & Warehousing in the United States is 4.9%.