Cities with the Highest Percentage of Population Employed in Transportation & Warehousing in Maryland
RELATED REPORTS & OPTIONS
Transportation & Warehousing
Maryland
Compare Cities
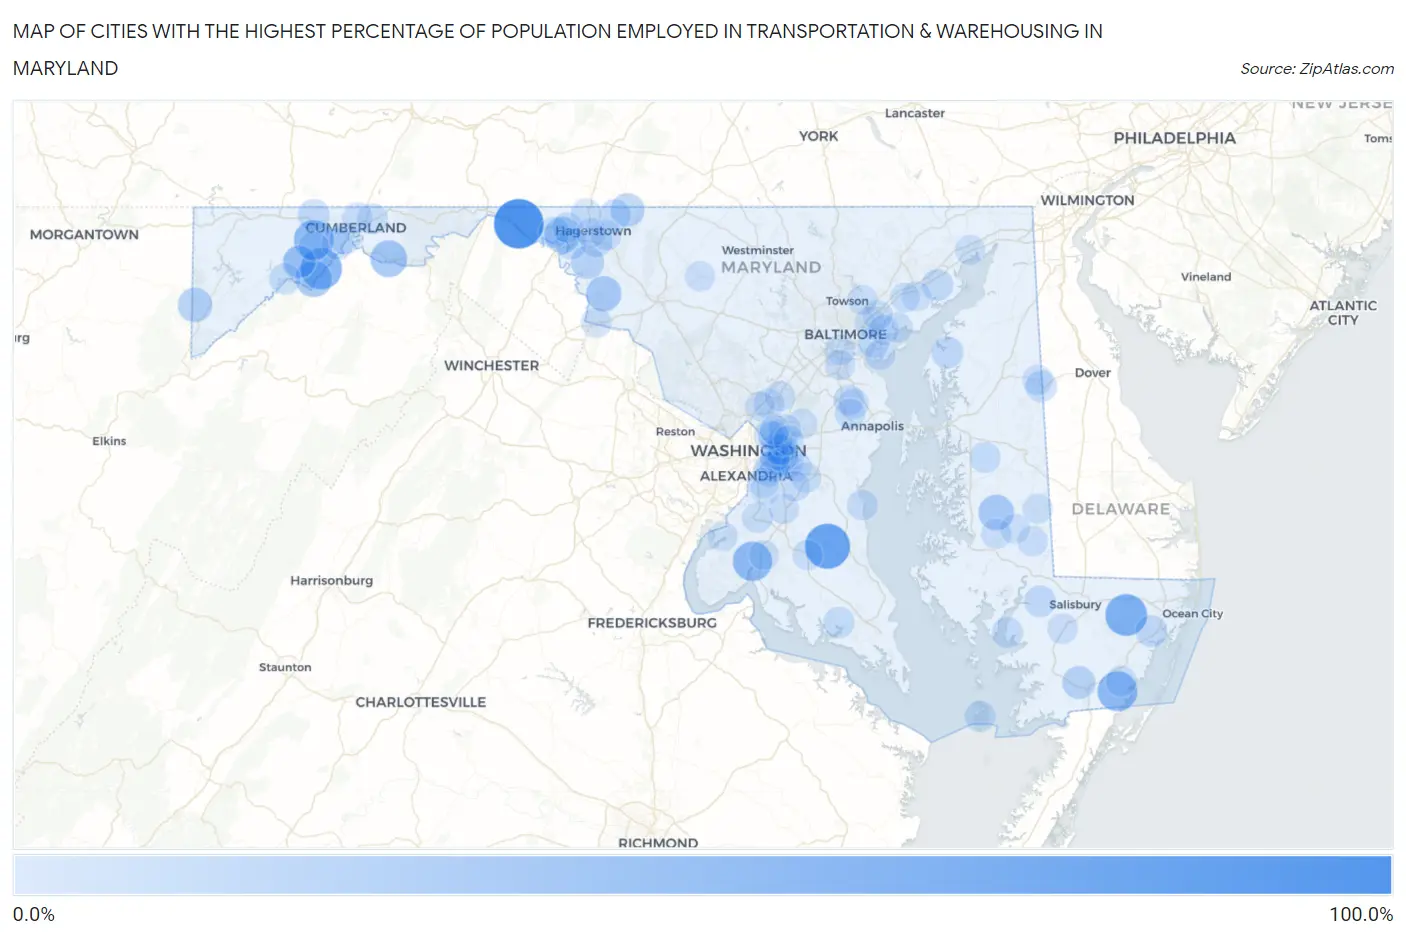
Map of Cities with the Highest Percentage of Population Employed in Transportation & Warehousing in Maryland
0.0%
100.0%
Cities with the Highest Percentage of Population Employed in Transportation & Warehousing in Maryland
| City | % Employed | vs State | vs National | |
| 1. | Pecktonville | 100.0% | 4.4%(+95.6)#1 | 4.9%(+95.1)#10 |
| 2. | Eagle Harbor | 78.1% | 4.4%(+73.7)#2 | 4.9%(+73.2)#37 |
| 3. | Powellville | 62.2% | 4.4%(+57.7)#3 | 4.9%(+57.2)#64 |
| 4. | Danville | 59.7% | 4.4%(+55.3)#4 | 4.9%(+54.8)#72 |
| 5. | Stockton | 52.6% | 4.4%(+48.2)#5 | 4.9%(+47.7)#103 |
| 6. | Woodland | 51.7% | 4.4%(+47.3)#6 | 4.9%(+46.8)#108 |
| 7. | Port Tobacco Village | 50.0% | 4.4%(+45.6)#7 | 4.9%(+45.1)#129 |
| 8. | Oldtown | 37.8% | 4.4%(+33.4)#8 | 4.9%(+32.9)#211 |
| 9. | Dawson | 37.0% | 4.4%(+32.6)#9 | 4.9%(+32.1)#224 |
| 10. | Pinesburg | 35.1% | 4.4%(+30.7)#10 | 4.9%(+30.2)#260 |
| 11. | Choptank | 31.9% | 4.4%(+27.5)#11 | 4.9%(+26.9)#333 |
| 12. | Trego Rohrersville Station | 31.4% | 4.4%(+26.9)#12 | 4.9%(+26.4)#340 |
| 13. | Crellin | 26.5% | 4.4%(+22.1)#13 | 4.9%(+21.6)#475 |
| 14. | Ringgold | 22.0% | 4.4%(+17.5)#14 | 4.9%(+17.0)#692 |
| 15. | Fairplay | 20.5% | 4.4%(+16.1)#15 | 4.9%(+15.6)#793 |
| 16. | Crumpton | 20.3% | 4.4%(+15.8)#16 | 4.9%(+15.3)#813 |
| 17. | West Pocomoke | 20.2% | 4.4%(+15.7)#17 | 4.9%(+15.2)#819 |
| 18. | Barton | 18.5% | 4.4%(+14.1)#18 | 4.9%(+13.6)#950 |
| 19. | Moscow | 17.9% | 4.4%(+13.5)#19 | 4.9%(+13.0)#1,030 |
| 20. | District Heights | 17.8% | 4.4%(+13.4)#20 | 4.9%(+12.9)#1,050 |
| 21. | Fairlee | 15.4% | 4.4%(+11.0)#21 | 4.9%(+10.4)#1,451 |
| 22. | Funkstown | 15.1% | 4.4%(+10.7)#22 | 4.9%(+10.2)#1,514 |
| 23. | Silver Hill | 15.0% | 4.4%(+10.6)#23 | 4.9%(+10.1)#1,530 |
| 24. | Quantico | 14.5% | 4.4%(+10.1)#24 | 4.9%(+9.60)#1,648 |
| 25. | Finzel | 14.5% | 4.4%(+10.1)#25 | 4.9%(+9.54)#1,659 |
| 26. | Newark | 14.5% | 4.4%(+10.0)#26 | 4.9%(+9.52)#1,664 |
| 27. | Perryman | 14.2% | 4.4%(+9.81)#27 | 4.9%(+9.29)#1,744 |
| 28. | Leitersburg | 14.2% | 4.4%(+9.73)#28 | 4.9%(+9.21)#1,759 |
| 29. | Cresaptown | 14.0% | 4.4%(+9.52)#29 | 4.9%(+9.01)#1,804 |
| 30. | New Carrollton | 13.9% | 4.4%(+9.44)#30 | 4.9%(+8.93)#1,826 |
| 31. | Forestville | 13.5% | 4.4%(+9.03)#31 | 4.9%(+8.51)#1,935 |
| 32. | Bloomington | 12.9% | 4.4%(+8.47)#32 | 4.9%(+7.96)#2,119 |
| 33. | Williamsport | 12.5% | 4.4%(+8.11)#33 | 4.9%(+7.60)#2,233 |
| 34. | Marydel | 12.5% | 4.4%(+8.07)#34 | 4.9%(+7.55)#2,261 |
| 35. | Marlow Heights | 12.1% | 4.4%(+7.66)#35 | 4.9%(+7.15)#2,430 |
| 36. | Leonardtown | 11.8% | 4.4%(+7.40)#36 | 4.9%(+6.89)#2,524 |
| 37. | Nanticoke | 11.8% | 4.4%(+7.39)#37 | 4.9%(+6.87)#2,537 |
| 38. | Smith Island | 11.6% | 4.4%(+7.18)#38 | 4.9%(+6.67)#2,637 |
| 39. | Charlton | 11.5% | 4.4%(+7.09)#39 | 4.9%(+6.57)#2,680 |
| 40. | Fairmount Heights | 11.4% | 4.4%(+6.94)#40 | 4.9%(+6.42)#2,760 |
| 41. | Potomac Park | 11.2% | 4.4%(+6.73)#41 | 4.9%(+6.22)#2,867 |
| 42. | Dundalk | 11.1% | 4.4%(+6.71)#42 | 4.9%(+6.19)#2,877 |
| 43. | Cordova | 11.0% | 4.4%(+6.56)#43 | 4.9%(+6.05)#2,950 |
| 44. | Peppermill Village | 10.6% | 4.4%(+6.14)#44 | 4.9%(+5.63)#3,170 |
| 45. | Girdletree | 10.4% | 4.4%(+6.01)#45 | 4.9%(+5.50)#3,246 |
| 46. | Baltimore Highlands | 10.3% | 4.4%(+5.88)#46 | 4.9%(+5.36)#3,343 |
| 47. | North Beach | 10.3% | 4.4%(+5.86)#47 | 4.9%(+5.35)#3,354 |
| 48. | Accokeek | 10.1% | 4.4%(+5.67)#48 | 4.9%(+5.15)#3,477 |
| 49. | Rosedale | 9.9% | 4.4%(+5.50)#49 | 4.9%(+4.98)#3,587 |
| 50. | Suitland | 9.8% | 4.4%(+5.37)#50 | 4.9%(+4.85)#3,684 |
| 51. | Robinwood | 9.7% | 4.4%(+5.31)#51 | 4.9%(+4.79)#3,726 |
| 52. | Woodlawn Cdp Prince George S County | 9.6% | 4.4%(+5.18)#52 | 4.9%(+4.67)#3,819 |
| 53. | Wilson Conococheague | 9.6% | 4.4%(+5.15)#53 | 4.9%(+4.64)#3,844 |
| 54. | Pleasant Grove | 9.6% | 4.4%(+5.13)#54 | 4.9%(+4.61)#3,868 |
| 55. | Maugansville | 9.4% | 4.4%(+4.99)#55 | 4.9%(+4.47)#3,971 |
| 56. | Arden On The Severn | 9.4% | 4.4%(+4.98)#56 | 4.9%(+4.46)#3,979 |
| 57. | Walker Mill | 9.4% | 4.4%(+4.96)#57 | 4.9%(+4.44)#3,996 |
| 58. | Sandy Hook | 9.2% | 4.4%(+4.73)#58 | 4.9%(+4.21)#4,167 |
| 59. | Calverton | 9.1% | 4.4%(+4.69)#59 | 4.9%(+4.18)#4,193 |
| 60. | Herald Harbor | 9.0% | 4.4%(+4.57)#60 | 4.9%(+4.06)#4,298 |
| 61. | Westphalia | 9.0% | 4.4%(+4.56)#61 | 4.9%(+4.04)#4,317 |
| 62. | Seat Pleasant | 9.0% | 4.4%(+4.53)#62 | 4.9%(+4.02)#4,343 |
| 63. | Hughesville | 8.9% | 4.4%(+4.50)#63 | 4.9%(+3.99)#4,368 |
| 64. | Ferndale | 8.9% | 4.4%(+4.45)#64 | 4.9%(+3.94)#4,417 |
| 65. | Coral Hills | 8.8% | 4.4%(+4.40)#65 | 4.9%(+3.88)#4,461 |
| 66. | Eden | 8.8% | 4.4%(+4.35)#66 | 4.9%(+3.84)#4,512 |
| 67. | Crownsville | 8.7% | 4.4%(+4.30)#67 | 4.9%(+3.79)#4,558 |
| 68. | Eldorado | 8.7% | 4.4%(+4.26)#68 | 4.9%(+3.75)#4,610 |
| 69. | Brandywine | 8.5% | 4.4%(+4.10)#69 | 4.9%(+3.58)#4,765 |
| 70. | Queensland | 8.5% | 4.4%(+4.08)#70 | 4.9%(+3.56)#4,788 |
| 71. | Essex | 8.5% | 4.4%(+4.04)#71 | 4.9%(+3.52)#4,829 |
| 72. | Bowmans Addition | 8.4% | 4.4%(+3.99)#72 | 4.9%(+3.47)#4,875 |
| 73. | Libertytown | 8.4% | 4.4%(+3.97)#73 | 4.9%(+3.45)#4,899 |
| 74. | Templeville | 8.3% | 4.4%(+3.90)#74 | 4.9%(+3.39)#4,983 |
| 75. | Rosaryville | 8.3% | 4.4%(+3.89)#75 | 4.9%(+3.38)#5,001 |
| 76. | Bowleys Quarters | 8.2% | 4.4%(+3.80)#76 | 4.9%(+3.29)#5,091 |
| 77. | Secretary | 8.2% | 4.4%(+3.74)#77 | 4.9%(+3.22)#5,166 |
| 78. | Konterra | 8.1% | 4.4%(+3.62)#78 | 4.9%(+3.11)#5,293 |
| 79. | Edmonston | 7.9% | 4.4%(+3.42)#79 | 4.9%(+2.90)#5,553 |
| 80. | Edgemere | 7.7% | 4.4%(+3.29)#80 | 4.9%(+2.77)#5,693 |
| 81. | Federalsburg | 7.7% | 4.4%(+3.27)#81 | 4.9%(+2.76)#5,705 |
| 82. | Perryville | 7.6% | 4.4%(+3.18)#82 | 4.9%(+2.66)#5,854 |
| 83. | Hagerstown | 7.6% | 4.4%(+3.17)#83 | 4.9%(+2.66)#5,859 |
| 84. | Indian Head | 7.6% | 4.4%(+3.17)#84 | 4.9%(+2.66)#5,860 |
| 85. | Landover | 7.6% | 4.4%(+3.17)#85 | 4.9%(+2.66)#5,862 |
| 86. | North Brentwood | 7.6% | 4.4%(+3.17)#86 | 4.9%(+2.65)#5,873 |
| 87. | Rossville | 7.6% | 4.4%(+3.16)#87 | 4.9%(+2.65)#5,882 |
| 88. | Midland | 7.6% | 4.4%(+3.15)#88 | 4.9%(+2.64)#5,887 |
| 89. | Oxon Hill | 7.6% | 4.4%(+3.13)#89 | 4.9%(+2.62)#5,914 |
| 90. | Edgewood | 7.5% | 4.4%(+3.09)#90 | 4.9%(+2.58)#5,993 |
| 91. | Bladensburg | 7.5% | 4.4%(+3.08)#91 | 4.9%(+2.57)#6,007 |
| 92. | Friendly | 7.5% | 4.4%(+3.06)#92 | 4.9%(+2.55)#6,030 |
| 93. | Glenn Dale | 7.5% | 4.4%(+3.05)#93 | 4.9%(+2.54)#6,047 |
| 94. | White Oak | 7.5% | 4.4%(+3.04)#94 | 4.9%(+2.53)#6,054 |
| 95. | Riverdale Park | 7.4% | 4.4%(+2.99)#95 | 4.9%(+2.48)#6,119 |
| 96. | Hurlock | 7.3% | 4.4%(+2.91)#96 | 4.9%(+2.39)#6,256 |
| 97. | Joppatowne | 7.1% | 4.4%(+2.64)#97 | 4.9%(+2.12)#6,672 |
| 98. | La Plata | 7.0% | 4.4%(+2.55)#98 | 4.9%(+2.04)#6,820 |
| 99. | Glenarden | 6.9% | 4.4%(+2.50)#99 | 4.9%(+1.99)#6,910 |
| 100. | Carney | 6.9% | 4.4%(+2.47)#100 | 4.9%(+1.96)#6,968 |
Common Questions
What are the Top 10 Cities with the Highest Percentage of Population Employed in Transportation & Warehousing in Maryland?
Top 10 Cities with the Highest Percentage of Population Employed in Transportation & Warehousing in Maryland are:
#1
100.0%
#2
78.1%
#3
62.2%
#4
59.7%
#5
52.6%
#6
51.7%
#7
50.0%
#8
37.8%
#9
37.0%
#10
35.1%
What city has the Highest Percentage of Population Employed in Transportation & Warehousing in Maryland?
Pecktonville has the Highest Percentage of Population Employed in Transportation & Warehousing in Maryland with 100.0%.
What is the Percentage of Population Employed in Transportation & Warehousing in the State of Maryland?
Percentage of Population Employed in Transportation & Warehousing in Maryland is 4.4%.
What is the Percentage of Population Employed in Transportation & Warehousing in the United States?
Percentage of Population Employed in Transportation & Warehousing in the United States is 4.9%.