Port Mansfield, TX Map & Demographics
Port Mansfield Map
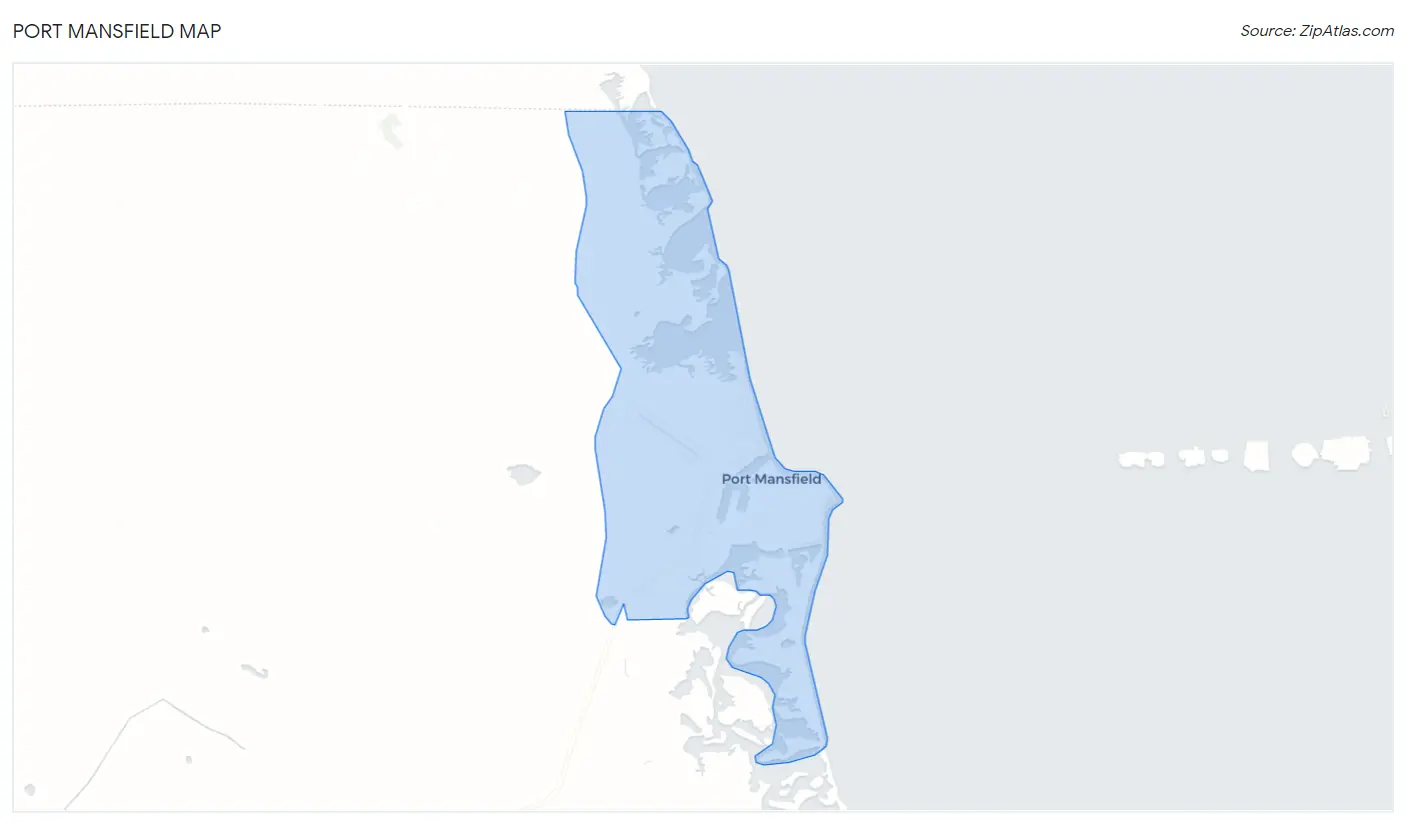
Port Mansfield Overview
$23,684
PER CAPITA INCOME
$23,523
AVG HOUSEHOLD INCOME
0.42
INEQUALITY / GINI INDEX
108
TOTAL POPULATION
66
MALE POPULATION
42
FEMALE POPULATION
157.14
MALES / 100 FEMALES
63.64
FEMALES / 100 MALES
67.2
MEDIAN AGE
1.9
AVG FAMILY SIZE
1.6
AVG HOUSEHOLD SIZE
27
LABOR FORCE [ PEOPLE ]
27.3%
PERCENT IN LABOR FORCE
Port Mansfield Zip Codes
Port Mansfield Area Codes
Income in Port Mansfield
Income Overview in Port Mansfield
| Characteristic | Number | Measure |
| Per Capita Income | 108 | $23,684 |
| Median Family Income | 26 | $0 |
| Mean Family Income | 26 | $44,092 |
| Median Household Income | 67 | $23,523 |
| Mean Household Income | 67 | $37,064 |
| Income Deficit | 26 | $0 |
| Wage / Income Gap (%) | 108 | 0.00% |
| Wage / Income Gap ($) | 108 | 100.00¢ per $1 |
| Gini / Inequality Index | 108 | 0.42 |
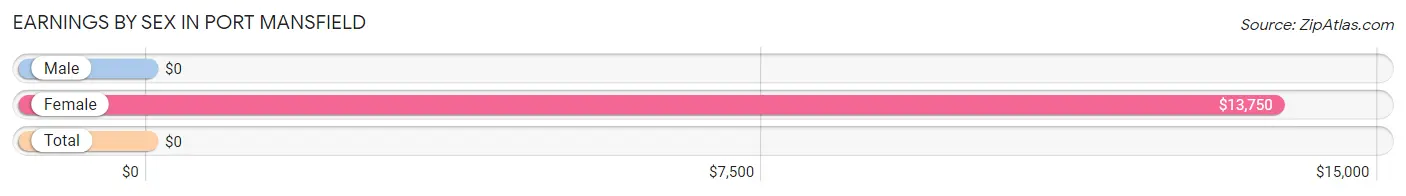
Earnings by Sex in Port Mansfield
| Sex | Number | Average Earnings |
| Male | 9 (33.3%) | $0 |
| Female | 18 (66.7%) | $13,750 |
| Total | 27 (100.0%) | $0 |
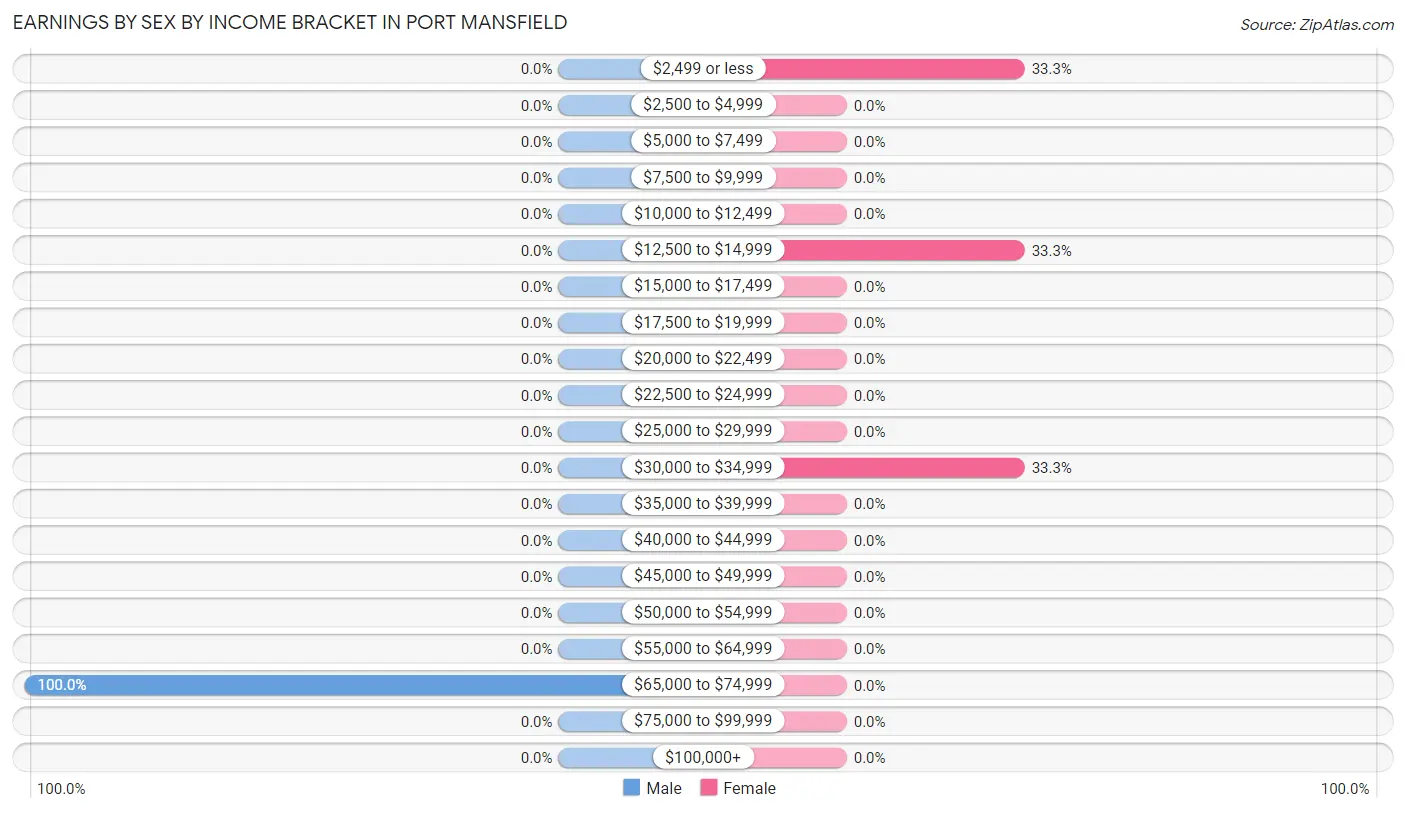
Earnings by Sex by Income Bracket in Port Mansfield
The most common earnings brackets in Port Mansfield are $65,000 to $74,999 for men (9 | 100.0%) and $2,499 or less for women (6 | 33.3%).
| Income | Male | Female |
| $2,499 or less | 0 (0.0%) | 6 (33.3%) |
| $2,500 to $4,999 | 0 (0.0%) | 0 (0.0%) |
| $5,000 to $7,499 | 0 (0.0%) | 0 (0.0%) |
| $7,500 to $9,999 | 0 (0.0%) | 0 (0.0%) |
| $10,000 to $12,499 | 0 (0.0%) | 0 (0.0%) |
| $12,500 to $14,999 | 0 (0.0%) | 6 (33.3%) |
| $15,000 to $17,499 | 0 (0.0%) | 0 (0.0%) |
| $17,500 to $19,999 | 0 (0.0%) | 0 (0.0%) |
| $20,000 to $22,499 | 0 (0.0%) | 0 (0.0%) |
| $22,500 to $24,999 | 0 (0.0%) | 0 (0.0%) |
| $25,000 to $29,999 | 0 (0.0%) | 0 (0.0%) |
| $30,000 to $34,999 | 0 (0.0%) | 6 (33.3%) |
| $35,000 to $39,999 | 0 (0.0%) | 0 (0.0%) |
| $40,000 to $44,999 | 0 (0.0%) | 0 (0.0%) |
| $45,000 to $49,999 | 0 (0.0%) | 0 (0.0%) |
| $50,000 to $54,999 | 0 (0.0%) | 0 (0.0%) |
| $55,000 to $64,999 | 0 (0.0%) | 0 (0.0%) |
| $65,000 to $74,999 | 9 (100.0%) | 0 (0.0%) |
| $75,000 to $99,999 | 0 (0.0%) | 0 (0.0%) |
| $100,000+ | 0 (0.0%) | 0 (0.0%) |
| Total | 9 (100.0%) | 18 (100.0%) |
Earnings by Sex by Educational Attainment in Port Mansfield
| Educational Attainment | Male Income | Female Income |
| Less than High School | - | - |
| High School Diploma | - | - |
| College or Associate's Degree | - | - |
| Bachelor's Degree | - | - |
| Graduate Degree | - | - |
| Total | - | - |
Family Income in Port Mansfield
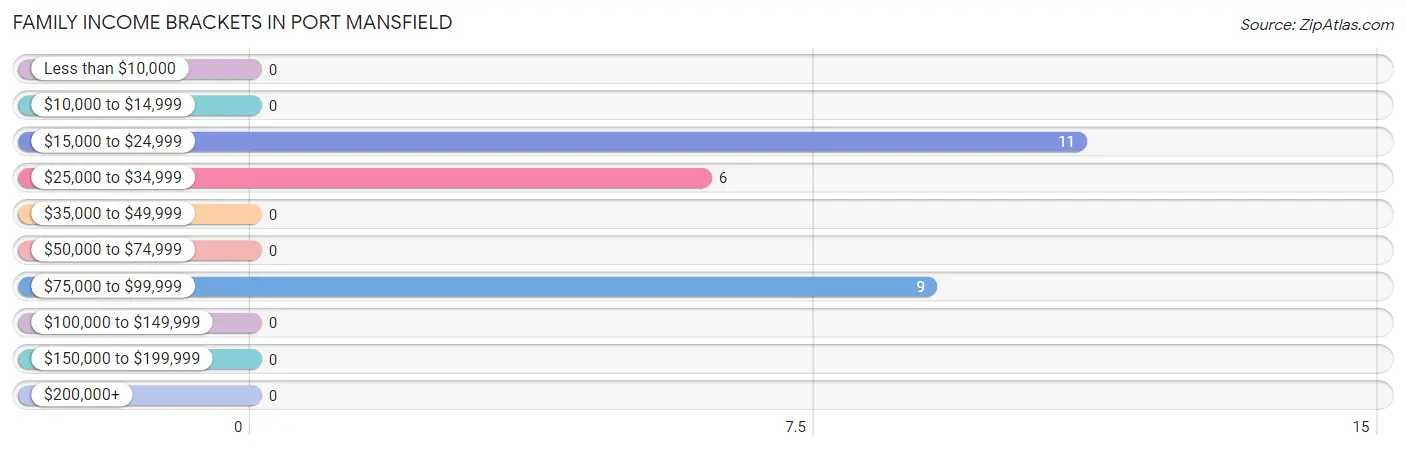
Family Income Brackets in Port Mansfield
According to the Port Mansfield family income data, there are 11 families falling into the $15,000 to $24,999 income range, which is the most common income bracket and makes up 42.3% of all families.
| Income Bracket | # Families | % Families |
| Less than $10,000 | 0 | 0.0% |
| $10,000 to $14,999 | 0 | 0.0% |
| $15,000 to $24,999 | 11 | 42.3% |
| $25,000 to $34,999 | 6 | 23.1% |
| $35,000 to $49,999 | 0 | 0.0% |
| $50,000 to $74,999 | 0 | 0.0% |
| $75,000 to $99,999 | 9 | 34.6% |
| $100,000 to $149,999 | 0 | 0.0% |
| $150,000 to $199,999 | 0 | 0.0% |
| $200,000+ | 0 | 0.0% |
Family Income by Famaliy Size in Port Mansfield
| Income Bracket | # Families | Median Income |
| 2-Person Families | 20 (76.9%) | $0 |
| 3-Person Families | 6 (23.1%) | $0 |
| 4-Person Families | 0 (0.0%) | $0 |
| 5-Person Families | 0 (0.0%) | $0 |
| 6-Person Families | 0 (0.0%) | $0 |
| 7+ Person Families | 0 (0.0%) | $0 |
| Total | 26 (100.0%) | $0 |
Family Income by Number of Earners in Port Mansfield
| Number of Earners | # Families | Median Income |
| No Earners | 11 (42.3%) | $0 |
| 1 Earner | 9 (34.6%) | $0 |
| 2 Earners | 6 (23.1%) | $0 |
| 3+ Earners | 0 (0.0%) | $0 |
| Total | 26 (100.0%) | $0 |
Household Income in Port Mansfield
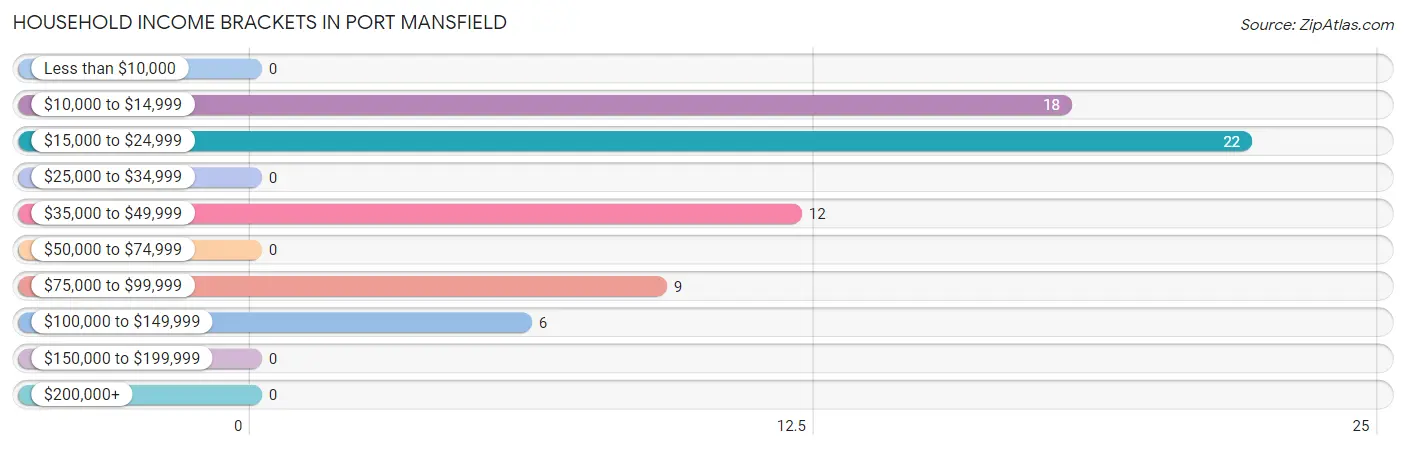
Household Income Brackets in Port Mansfield
With 22 households falling in the category, the $15,000 to $24,999 income range is the most frequent in Port Mansfield, accounting for 32.8% of all households.
| Income Bracket | # Households | % Households |
| Less than $10,000 | 0 | 0.0% |
| $10,000 to $14,999 | 18 | 26.9% |
| $15,000 to $24,999 | 22 | 32.8% |
| $25,000 to $34,999 | 0 | 0.0% |
| $35,000 to $49,999 | 12 | 17.9% |
| $50,000 to $74,999 | 0 | 0.0% |
| $75,000 to $99,999 | 9 | 13.4% |
| $100,000 to $149,999 | 6 | 9.0% |
| $150,000 to $199,999 | 0 | 0.0% |
| $200,000+ | 0 | 0.0% |
Household Income by Householder Age in Port Mansfield
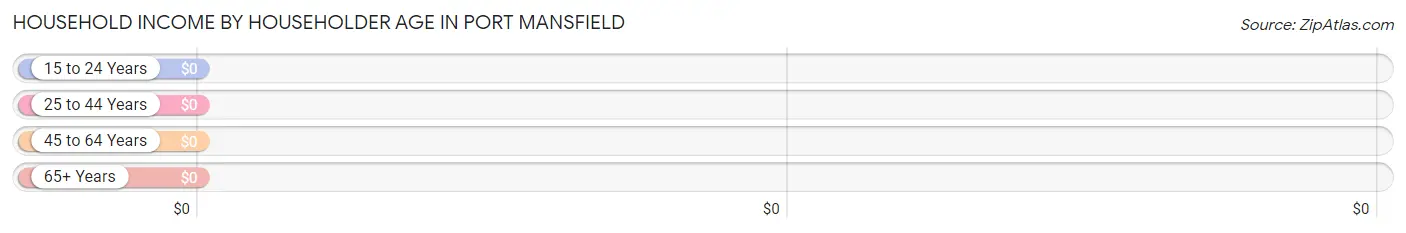
| Income Bracket | # Households | Median Income |
| 15 to 24 Years | 0 (0.0%) | $0 |
| 25 to 44 Years | 0 (0.0%) | $0 |
| 45 to 64 Years | 17 (25.4%) | $0 |
| 65+ Years | 50 (74.6%) | $0 |
| Total | 67 (100.0%) | $23,523 |
Poverty in Port Mansfield
Income Below Poverty by Sex and Age in Port Mansfield
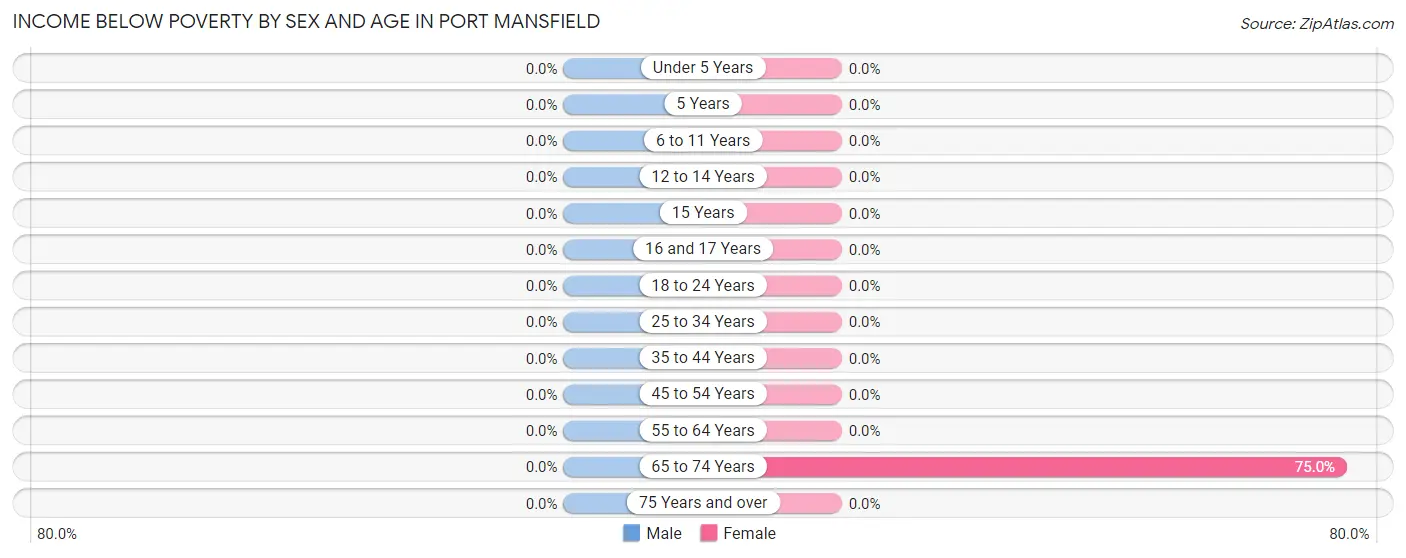
| Age Bracket | Male | Female |
| Under 5 Years | 0 (0.0%) | 0 (0.0%) |
| 5 Years | 0 (0.0%) | 0 (0.0%) |
| 6 to 11 Years | 0 (0.0%) | 0 (0.0%) |
| 12 to 14 Years | 0 (0.0%) | 0 (0.0%) |
| 15 Years | 0 (0.0%) | 0 (0.0%) |
| 16 and 17 Years | 0 (0.0%) | 0 (0.0%) |
| 18 to 24 Years | 0 (0.0%) | 0 (0.0%) |
| 25 to 34 Years | 0 (0.0%) | 0 (0.0%) |
| 35 to 44 Years | 0 (0.0%) | 0 (0.0%) |
| 45 to 54 Years | 0 (0.0%) | 0 (0.0%) |
| 55 to 64 Years | 0 (0.0%) | 0 (0.0%) |
| 65 to 74 Years | 0 (0.0%) | 18 (75.0%) |
| 75 Years and over | 0 (0.0%) | 0 (0.0%) |
| Total | 0 (0.0%) | 18 (42.9%) |
Income Above Poverty by Sex and Age in Port Mansfield
According to the poverty statistics in Port Mansfield, males aged 35 to 44 years and females aged 25 to 34 years are the age groups that are most secure financially, with 100.0% of males and 100.0% of females in these age groups living above the poverty line.
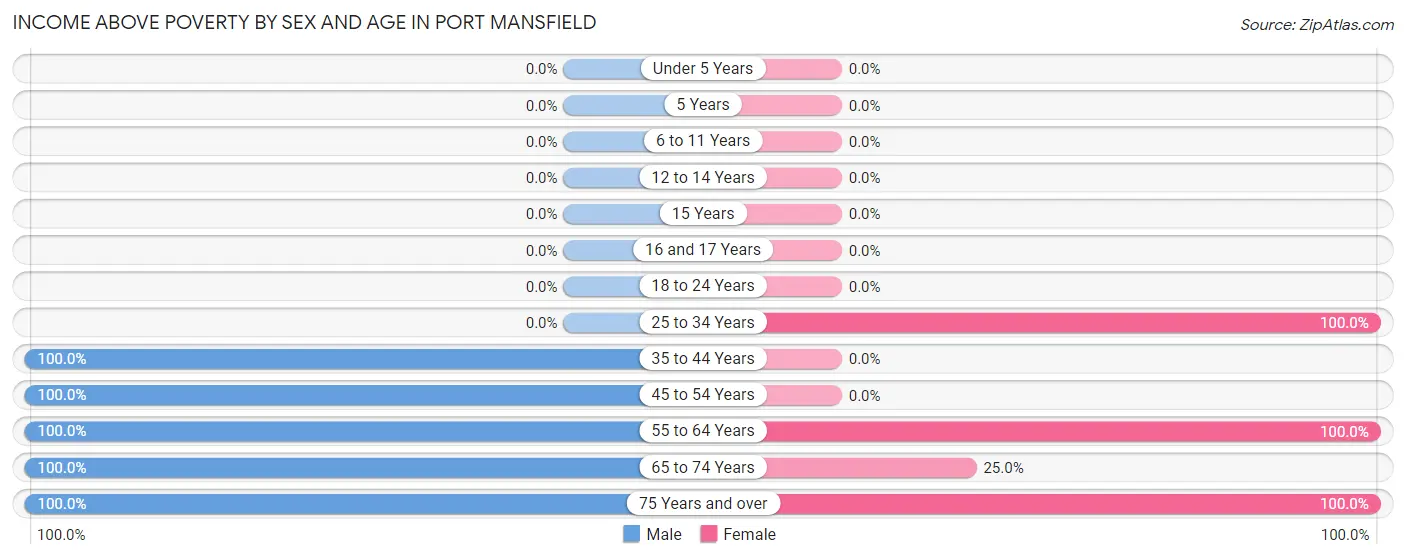
| Age Bracket | Male | Female |
| Under 5 Years | 0 (0.0%) | 0 (0.0%) |
| 5 Years | 0 (0.0%) | 0 (0.0%) |
| 6 to 11 Years | 0 (0.0%) | 0 (0.0%) |
| 12 to 14 Years | 0 (0.0%) | 0 (0.0%) |
| 15 Years | 0 (0.0%) | 0 (0.0%) |
| 16 and 17 Years | 0 (0.0%) | 0 (0.0%) |
| 18 to 24 Years | 0 (0.0%) | 0 (0.0%) |
| 25 to 34 Years | 0 (0.0%) | 6 (100.0%) |
| 35 to 44 Years | 9 (100.0%) | 0 (0.0%) |
| 45 to 54 Years | 5 (100.0%) | 0 (0.0%) |
| 55 to 64 Years | 11 (100.0%) | 6 (100.0%) |
| 65 to 74 Years | 21 (100.0%) | 6 (25.0%) |
| 75 Years and over | 11 (100.0%) | 6 (100.0%) |
| Total | 57 (100.0%) | 24 (57.1%) |
Income Below Poverty Among Married-Couple Families in Port Mansfield
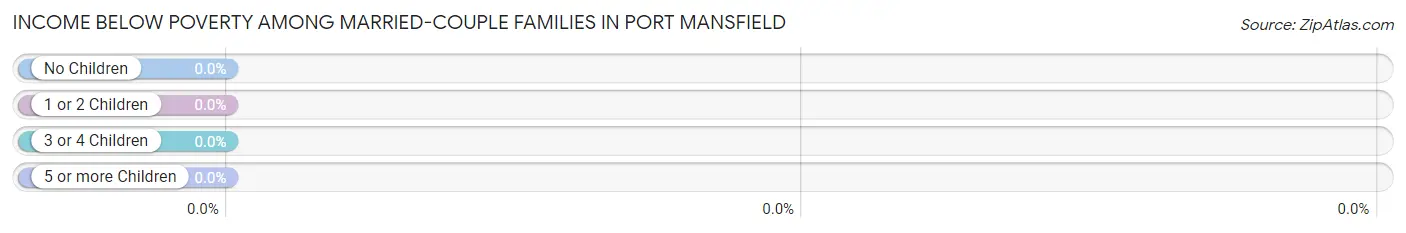
| Children | Above Poverty | Below Poverty |
| No Children | 26 (100.0%) | 0 (0.0%) |
| 1 or 2 Children | 0 (0.0%) | 0 (0.0%) |
| 3 or 4 Children | 0 (0.0%) | 0 (0.0%) |
| 5 or more Children | 0 (0.0%) | 0 (0.0%) |
| Total | 26 (100.0%) | 0 (0.0%) |
Income Below Poverty Among Single-Parent Households in Port Mansfield
| Children | Single Father | Single Mother |
| No Children | 0 (0.0%) | 0 (0.0%) |
| 1 or 2 Children | 0 (0.0%) | 0 (0.0%) |
| 3 or 4 Children | 0 (0.0%) | 0 (0.0%) |
| 5 or more Children | 0 (0.0%) | 0 (0.0%) |
| Total | 0 (0.0%) | 0 (0.0%) |
Income Below Poverty Among Married-Couple vs Single-Parent Households in Port Mansfield
| Children | Married-Couple Families | Single-Parent Households |
| No Children | 0 (0.0%) | 0 (0.0%) |
| 1 or 2 Children | 0 (0.0%) | 0 (0.0%) |
| 3 or 4 Children | 0 (0.0%) | 0 (0.0%) |
| 5 or more Children | 0 (0.0%) | 0 (0.0%) |
| Total | 0 (0.0%) | 0 (0.0%) |
Race in Port Mansfield
The most populous races in Port Mansfield are White / Caucasian (108 | 100.0%), and Hispanic or Latino (11 | 10.2%).
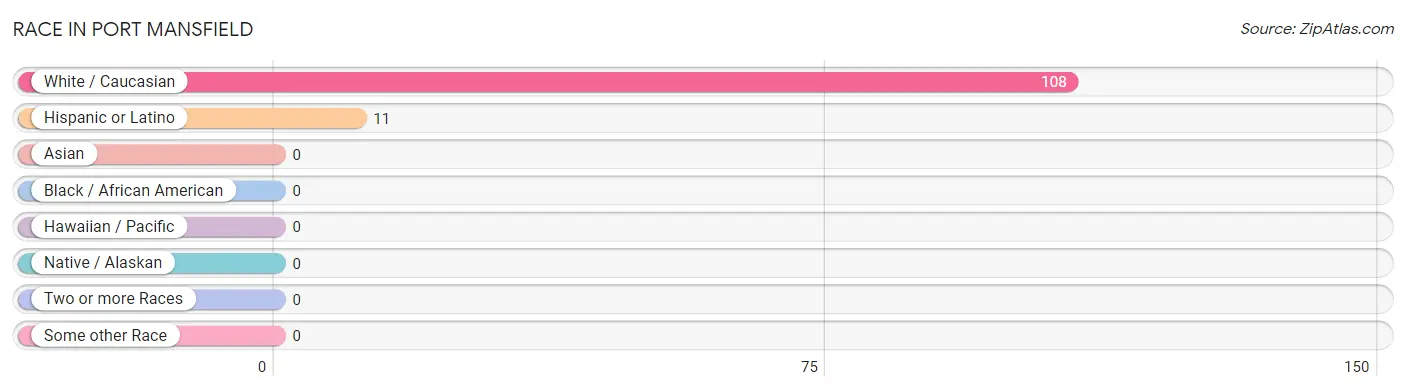
| Race | # Population | % Population |
| Asian | 0 | 0.0% |
| Black / African American | 0 | 0.0% |
| Hawaiian / Pacific | 0 | 0.0% |
| Hispanic or Latino | 11 | 10.2% |
| Native / Alaskan | 0 | 0.0% |
| White / Caucasian | 108 | 100.0% |
| Two or more Races | 0 | 0.0% |
| Some other Race | 0 | 0.0% |
| Total | 108 | 100.0% |
Ancestry in Port Mansfield
The most populous ancestries reported in Port Mansfield are American (35 | 32.4%), German (30 | 27.8%), Irish (27 | 25.0%), English (11 | 10.2%), and Mexican (11 | 10.2%), together accounting for 105.6% of all Port Mansfield residents.
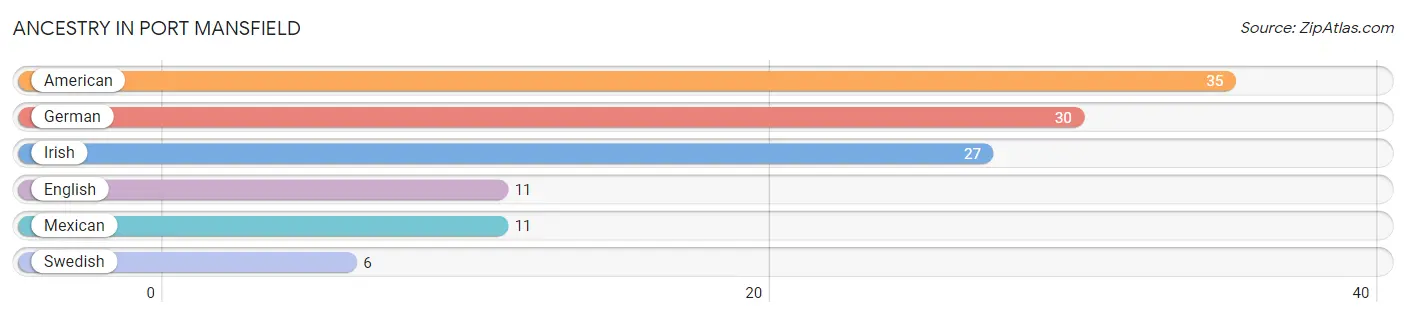
| Ancestry | # Population | % Population |
| American | 35 | 32.4% |
| English | 11 | 10.2% |
| German | 30 | 27.8% |
| Irish | 27 | 25.0% |
| Mexican | 11 | 10.2% |
| Swedish | 6 | 5.6% | View All 6 Rows |
Immigrants in Port Mansfield

| Immigration Origin | # Population | % Population | View All 0 Rows |
Sex and Age in Port Mansfield
Sex and Age in Port Mansfield
The most populous age groups in Port Mansfield are 70 to 74 Years (12 | 18.2%) for men and 70 to 74 Years (18 | 42.9%) for women.
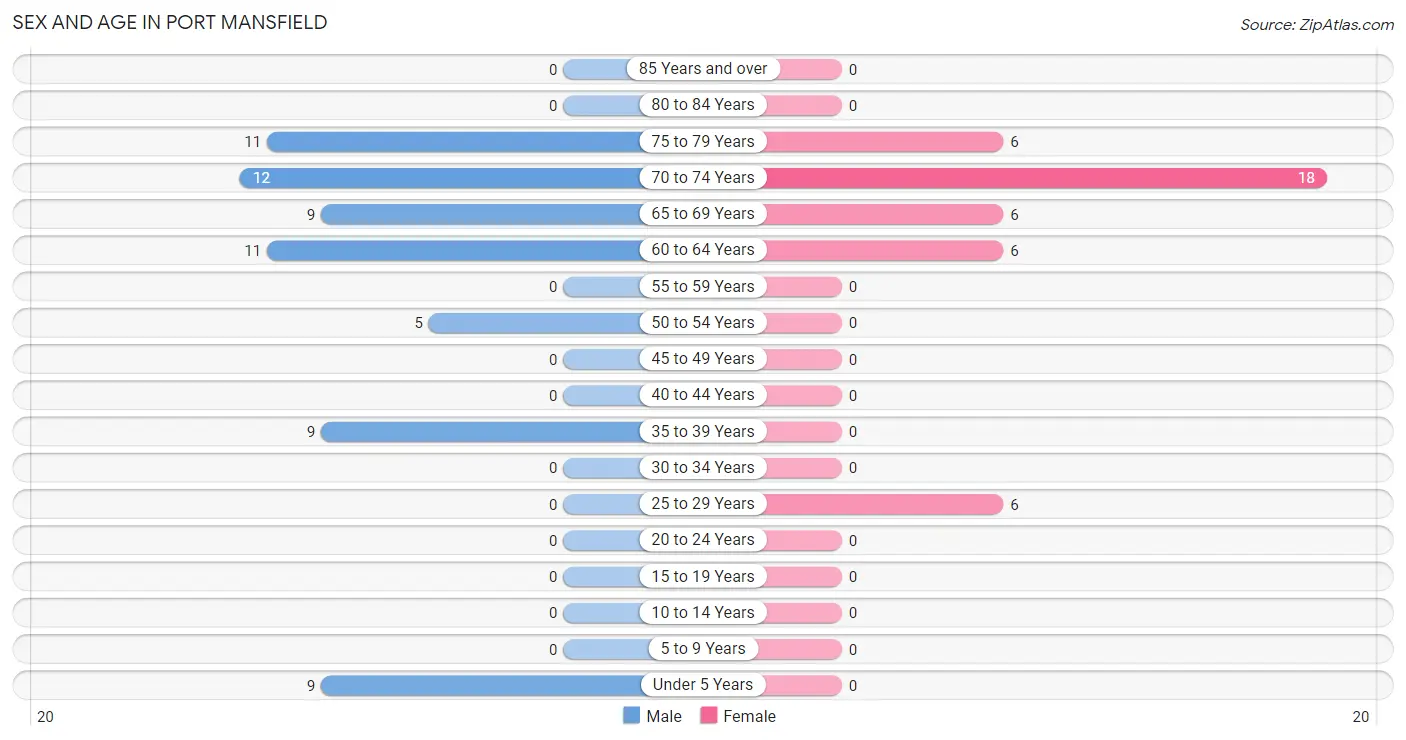
| Age Bracket | Male | Female |
| Under 5 Years | 9 (13.6%) | 0 (0.0%) |
| 5 to 9 Years | 0 (0.0%) | 0 (0.0%) |
| 10 to 14 Years | 0 (0.0%) | 0 (0.0%) |
| 15 to 19 Years | 0 (0.0%) | 0 (0.0%) |
| 20 to 24 Years | 0 (0.0%) | 0 (0.0%) |
| 25 to 29 Years | 0 (0.0%) | 6 (14.3%) |
| 30 to 34 Years | 0 (0.0%) | 0 (0.0%) |
| 35 to 39 Years | 9 (13.6%) | 0 (0.0%) |
| 40 to 44 Years | 0 (0.0%) | 0 (0.0%) |
| 45 to 49 Years | 0 (0.0%) | 0 (0.0%) |
| 50 to 54 Years | 5 (7.6%) | 0 (0.0%) |
| 55 to 59 Years | 0 (0.0%) | 0 (0.0%) |
| 60 to 64 Years | 11 (16.7%) | 6 (14.3%) |
| 65 to 69 Years | 9 (13.6%) | 6 (14.3%) |
| 70 to 74 Years | 12 (18.2%) | 18 (42.9%) |
| 75 to 79 Years | 11 (16.7%) | 6 (14.3%) |
| 80 to 84 Years | 0 (0.0%) | 0 (0.0%) |
| 85 Years and over | 0 (0.0%) | 0 (0.0%) |
| Total | 66 (100.0%) | 42 (100.0%) |
Families and Households in Port Mansfield
Median Family Size in Port Mansfield
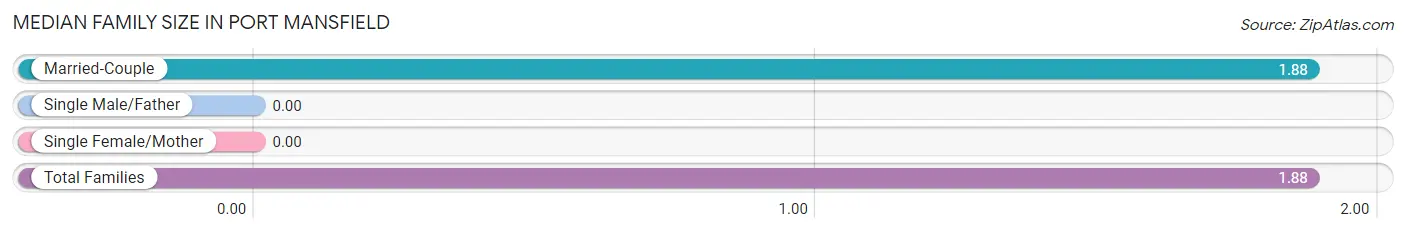
| Family Type | # Families | Family Size |
| Married-Couple | 26 (100.0%) | 1.88 |
| Single Male/Father | 0 (0.0%) | - |
| Single Female/Mother | 0 (0.0%) | - |
| Total Families | 26 (100.0%) | 1.88 |
Median Household Size in Port Mansfield
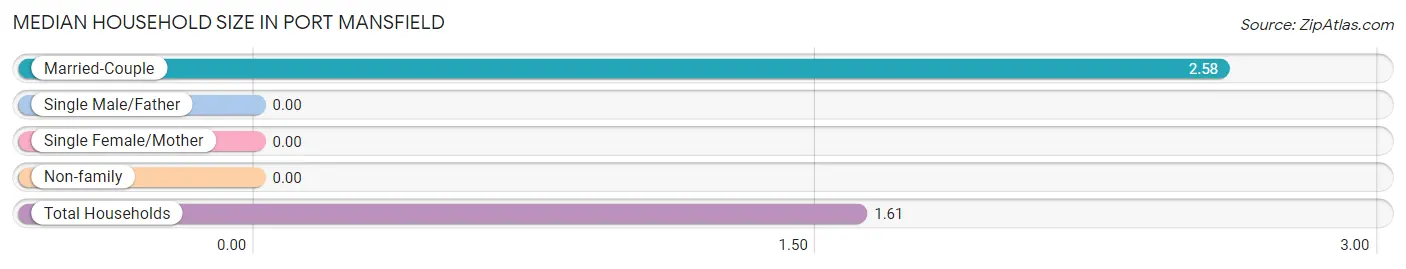
| Household Type | # Households | Household Size |
| Married-Couple | 26 (38.8%) | 2.58 |
| Single Male/Father | 0 (0.0%) | - |
| Single Female/Mother | 0 (0.0%) | - |
| Non-family | 41 (61.2%) | - |
| Total Households | 67 (100.0%) | 1.61 |
Household Size by Marriage Status in Port Mansfield
Out of a total of 67 households in Port Mansfield, 26 (38.8%) are family households, while 41 (61.2%) are nonfamily households. The most numerous type of family households are 2-person households, comprising 20, and the most common type of nonfamily households are 1-person households, comprising 41.
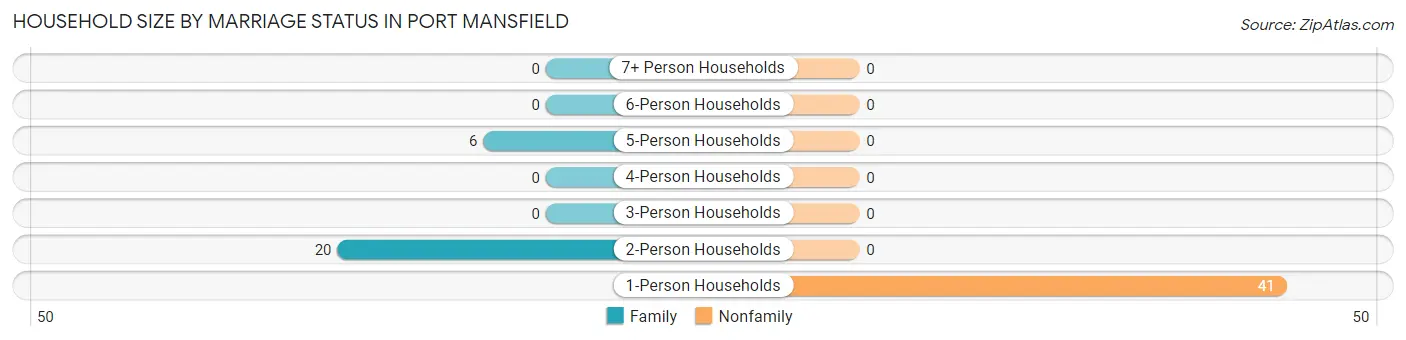
| Household Size | Family Households | Nonfamily Households |
| 1-Person Households | - | 41 (61.2%) |
| 2-Person Households | 20 (29.8%) | 0 (0.0%) |
| 3-Person Households | 0 (0.0%) | 0 (0.0%) |
| 4-Person Households | 0 (0.0%) | 0 (0.0%) |
| 5-Person Households | 6 (9.0%) | 0 (0.0%) |
| 6-Person Households | 0 (0.0%) | 0 (0.0%) |
| 7+ Person Households | 0 (0.0%) | 0 (0.0%) |
| Total | 26 (38.8%) | 41 (61.2%) |
Female Fertility in Port Mansfield
Fertility by Age in Port Mansfield
| Age Bracket | Women with Births | Births / 1,000 Women |
| 15 to 19 years | 0 (0.0%) | 0.0 |
| 20 to 34 years | 0 (0.0%) | 0.0 |
| 35 to 50 years | 0 (0.0%) | 0.0 |
| Total | 0 (0.0%) | 0.0 |
Fertility by Age by Marriage Status in Port Mansfield
| Age Bracket | Married | Unmarried |
| 15 to 19 years | 0 (0.0%) | 0 (0.0%) |
| 20 to 34 years | 0 (0.0%) | 0 (0.0%) |
| 35 to 50 years | 0 (0.0%) | 0 (0.0%) |
| Total | 0 (0.0%) | 0 (0.0%) |
Fertility by Education in Port Mansfield
| Educational Attainment | Women with Births | Births / 1,000 Women |
| Less than High School | 0 (0.0%) | 0.0 |
| High School Diploma | 0 (0.0%) | 0.0 |
| College or Associate's Degree | 0 (0.0%) | 0.0 |
| Bachelor's Degree | 0 (0.0%) | 0.0 |
| Graduate Degree | 0 (0.0%) | 0.0 |
| Total | 0 (0.0%) | 0.0 |
Fertility by Education by Marriage Status in Port Mansfield
| Educational Attainment | Married | Unmarried |
| Less than High School | 0 (0.0%) | 0 (0.0%) |
| High School Diploma | 0 (0.0%) | 0 (0.0%) |
| College or Associate's Degree | 0 (0.0%) | 0 (0.0%) |
| Bachelor's Degree | 0 (0.0%) | 0 (0.0%) |
| Graduate Degree | 0 (0.0%) | 0 (0.0%) |
| Total | 0 (0.0%) | 0 (0.0%) |
Employment Characteristics in Port Mansfield
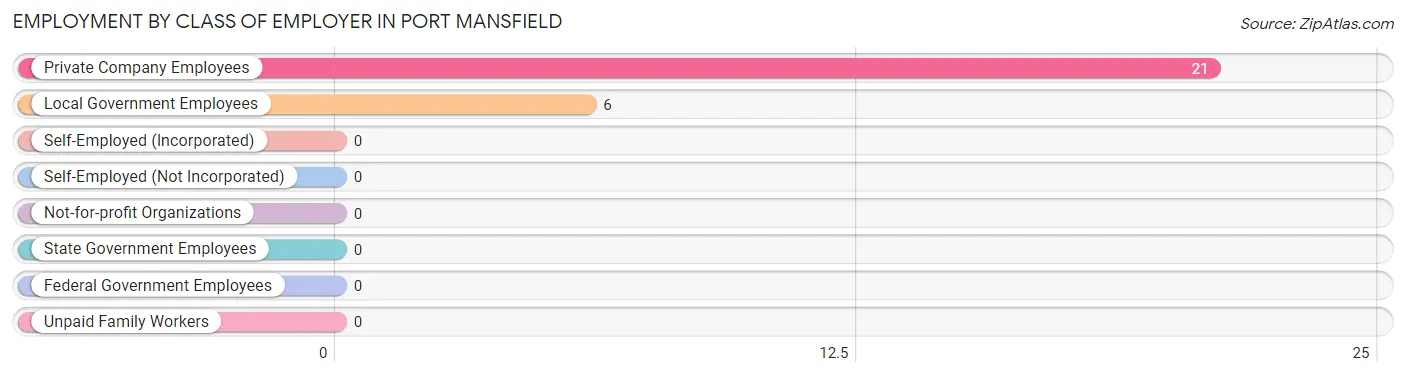
Employment by Class of Employer in Port Mansfield
Among the 27 employed individuals in Port Mansfield, private company employees (21 | 77.8%), and local government employees (6 | 22.2%) make up the most common classes of employment.
| Employer Class | # Employees | % Employees |
| Private Company Employees | 21 | 77.8% |
| Self-Employed (Incorporated) | 0 | 0.0% |
| Self-Employed (Not Incorporated) | 0 | 0.0% |
| Not-for-profit Organizations | 0 | 0.0% |
| Local Government Employees | 6 | 22.2% |
| State Government Employees | 0 | 0.0% |
| Federal Government Employees | 0 | 0.0% |
| Unpaid Family Workers | 0 | 0.0% |
| Total | 27 | 100.0% |
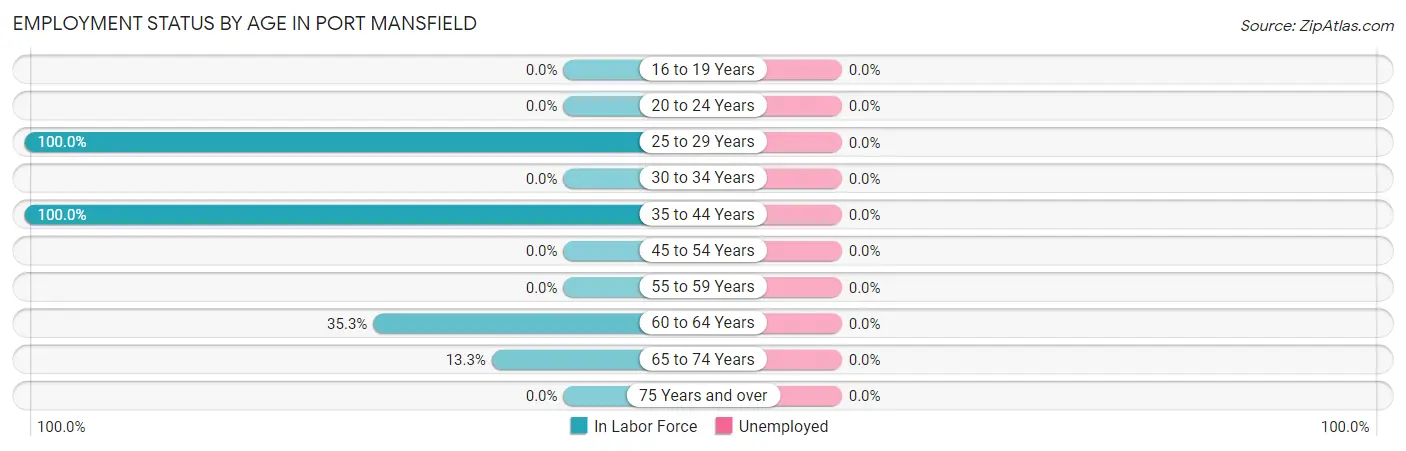
Employment Status by Age in Port Mansfield
| Age Bracket | In Labor Force | Unemployed |
| 16 to 19 Years | 0 (0.0%) | 0 (0.0%) |
| 20 to 24 Years | 0 (0.0%) | 0 (0.0%) |
| 25 to 29 Years | 6 (100.0%) | 0 (0.0%) |
| 30 to 34 Years | 0 (0.0%) | 0 (0.0%) |
| 35 to 44 Years | 9 (100.0%) | 0 (0.0%) |
| 45 to 54 Years | 0 (0.0%) | 0 (0.0%) |
| 55 to 59 Years | 0 (0.0%) | 0 (0.0%) |
| 60 to 64 Years | 6 (35.3%) | 0 (0.0%) |
| 65 to 74 Years | 6 (13.3%) | 0 (0.0%) |
| 75 Years and over | 0 (0.0%) | 0 (0.0%) |
| Total | 27 (27.3%) | 0 (0.0%) |
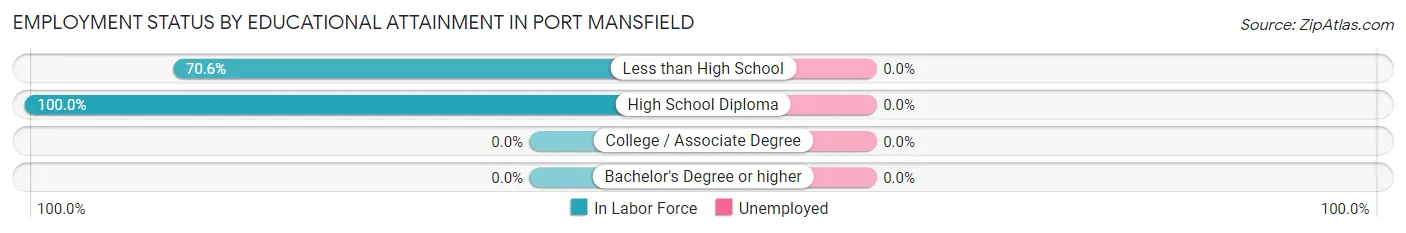
Employment Status by Educational Attainment in Port Mansfield
| Educational Attainment | In Labor Force | Unemployed |
| Less than High School | 12 (70.6%) | 0 (0.0%) |
| High School Diploma | 9 (100.0%) | 0 (0.0%) |
| College / Associate Degree | 0 (0.0%) | 0 (0.0%) |
| Bachelor's Degree or higher | 0 (0.0%) | 0 (0.0%) |
| Total | 21 (56.8%) | 0 (0.0%) |
Employment Occupations by Sex in Port Mansfield
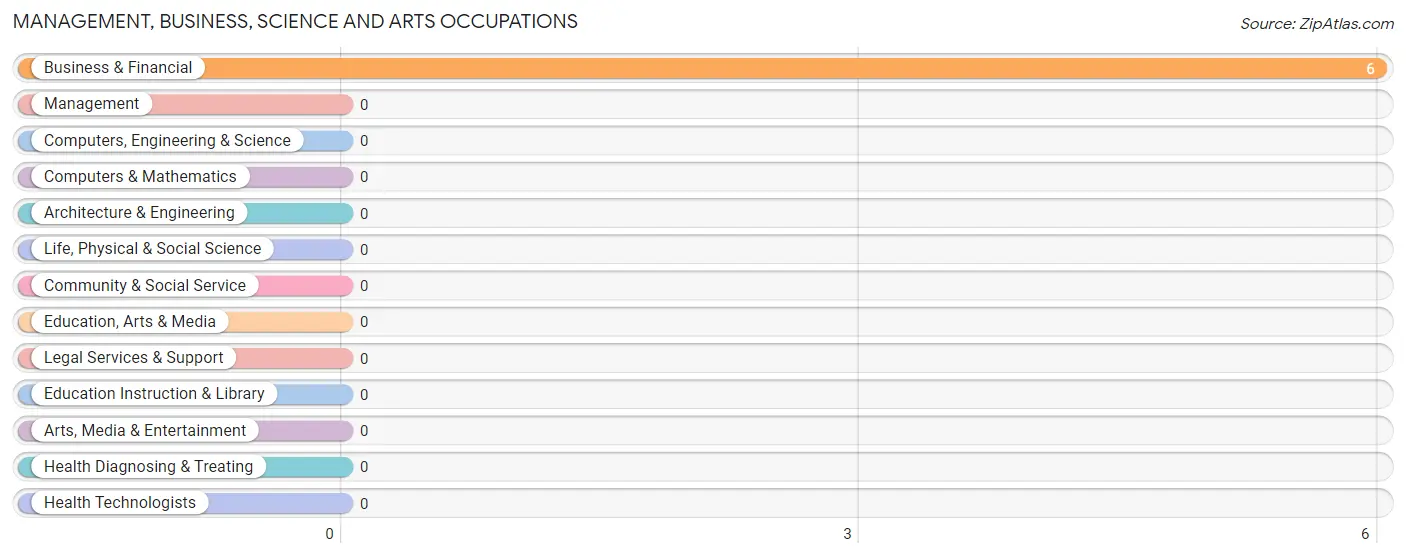
Management, Business, Science and Arts Occupations
The most common Management, Business, Science and Arts occupations in Port Mansfield are , and Business & Financial (6 | 22.2%).
Management, Business, Science and Arts Occupations by Sex
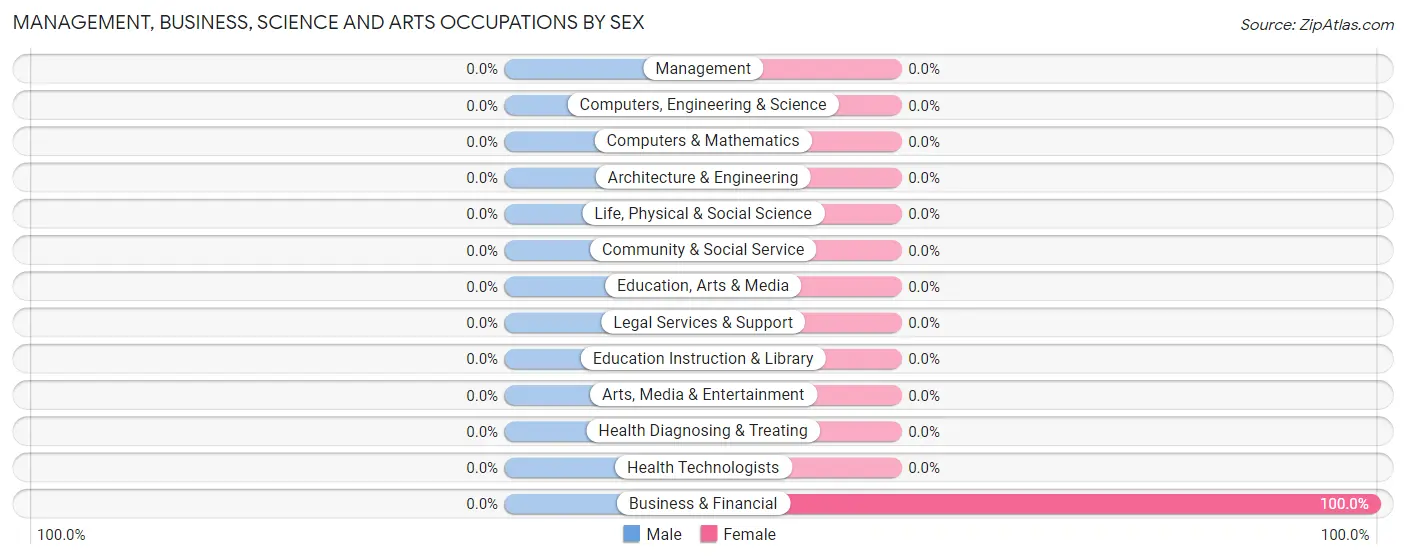
| Occupation | Male | Female |
| Management | 0 (0.0%) | 0 (0.0%) |
| Business & Financial | 0 (0.0%) | 6 (100.0%) |
| Computers, Engineering & Science | 0 (0.0%) | 0 (0.0%) |
| Computers & Mathematics | 0 (0.0%) | 0 (0.0%) |
| Architecture & Engineering | 0 (0.0%) | 0 (0.0%) |
| Life, Physical & Social Science | 0 (0.0%) | 0 (0.0%) |
| Community & Social Service | 0 (0.0%) | 0 (0.0%) |
| Education, Arts & Media | 0 (0.0%) | 0 (0.0%) |
| Legal Services & Support | 0 (0.0%) | 0 (0.0%) |
| Education Instruction & Library | 0 (0.0%) | 0 (0.0%) |
| Arts, Media & Entertainment | 0 (0.0%) | 0 (0.0%) |
| Health Diagnosing & Treating | 0 (0.0%) | 0 (0.0%) |
| Health Technologists | 0 (0.0%) | 0 (0.0%) |
| Total (Category) | 0 (0.0%) | 6 (100.0%) |
| Total (Overall) | 9 (33.3%) | 18 (66.7%) |
Services Occupations
The most common Services occupations in Port Mansfield are Security & Protection (6 | 22.2%), Law Enforcement (6 | 22.2%), and Food Preparation & Serving (6 | 22.2%).
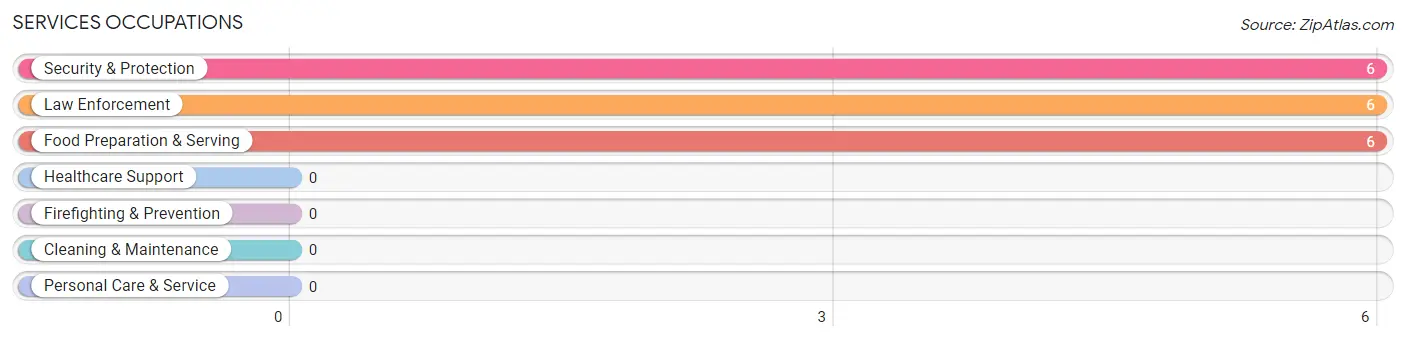
Services Occupations by Sex
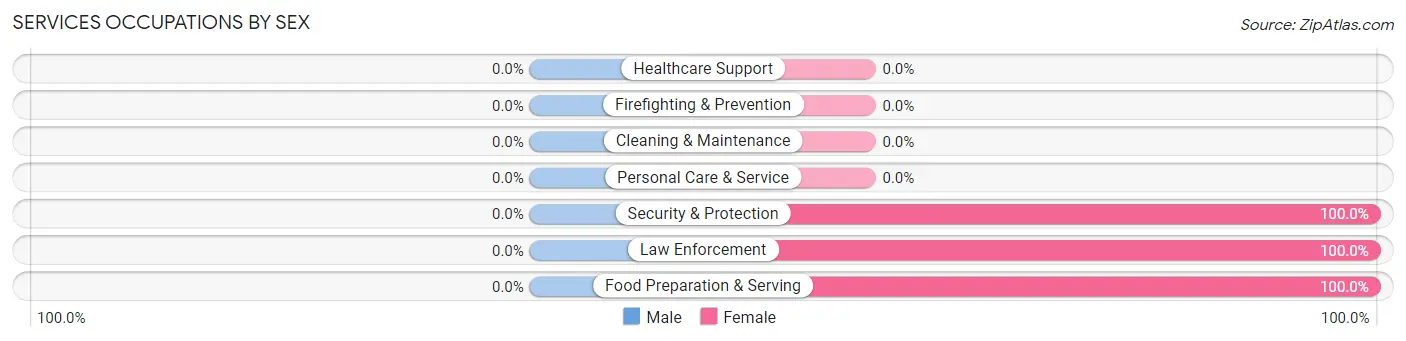
| Occupation | Male | Female |
| Healthcare Support | 0 (0.0%) | 0 (0.0%) |
| Security & Protection | 0 (0.0%) | 6 (100.0%) |
| Firefighting & Prevention | 0 (0.0%) | 0 (0.0%) |
| Law Enforcement | 0 (0.0%) | 6 (100.0%) |
| Food Preparation & Serving | 0 (0.0%) | 6 (100.0%) |
| Cleaning & Maintenance | 0 (0.0%) | 0 (0.0%) |
| Personal Care & Service | 0 (0.0%) | 0 (0.0%) |
| Total (Category) | 0 (0.0%) | 12 (100.0%) |
| Total (Overall) | 9 (33.3%) | 18 (66.7%) |
Sales and Office Occupations
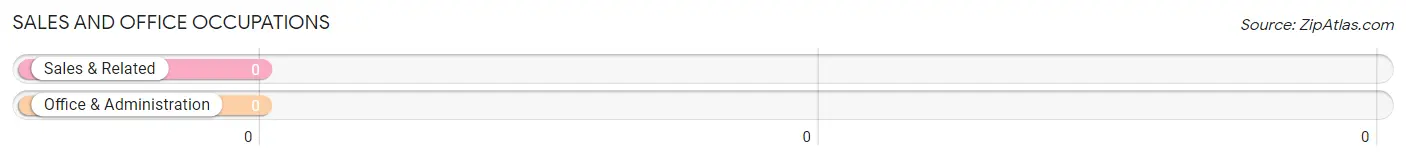
Sales and Office Occupations by Sex
| Occupation | Male | Female |
| Sales & Related | 0 (0.0%) | 0 (0.0%) |
| Office & Administration | 0 (0.0%) | 0 (0.0%) |
| Total (Category) | 0 (0.0%) | 0 (0.0%) |
| Total (Overall) | 9 (33.3%) | 18 (66.7%) |
Natural Resources, Construction and Maintenance Occupations
Natural Resources, Construction and Maintenance Occupations by Sex
| Occupation | Male | Female |
| Farming, Fishing & Forestry | 0 (0.0%) | 0 (0.0%) |
| Construction & Extraction | 0 (0.0%) | 0 (0.0%) |
| Installation, Maintenance & Repair | 0 (0.0%) | 0 (0.0%) |
| Total (Category) | 0 (0.0%) | 0 (0.0%) |
| Total (Overall) | 9 (33.3%) | 18 (66.7%) |
Production, Transportation and Moving Occupations
The most common Production, Transportation and Moving occupations in Port Mansfield are , and Material Moving (9 | 33.3%).
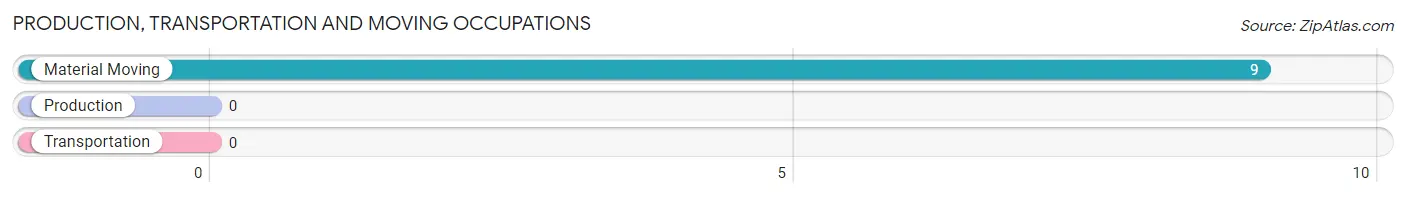
Production, Transportation and Moving Occupations by Sex
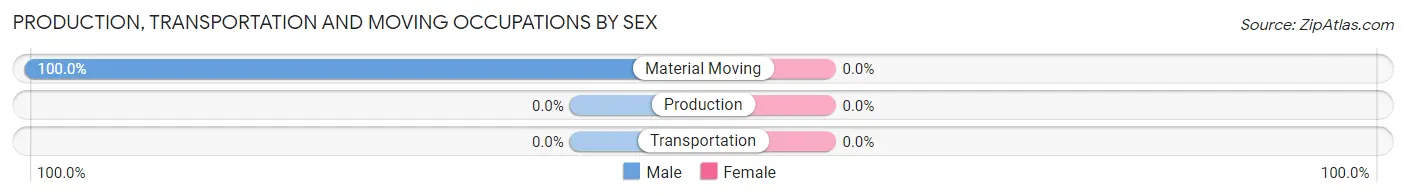
| Occupation | Male | Female |
| Production | 0 (0.0%) | 0 (0.0%) |
| Transportation | 0 (0.0%) | 0 (0.0%) |
| Material Moving | 9 (100.0%) | 0 (0.0%) |
| Total (Category) | 9 (100.0%) | 0 (0.0%) |
| Total (Overall) | 9 (33.3%) | 18 (66.7%) |
Employment Industries by Sex in Port Mansfield
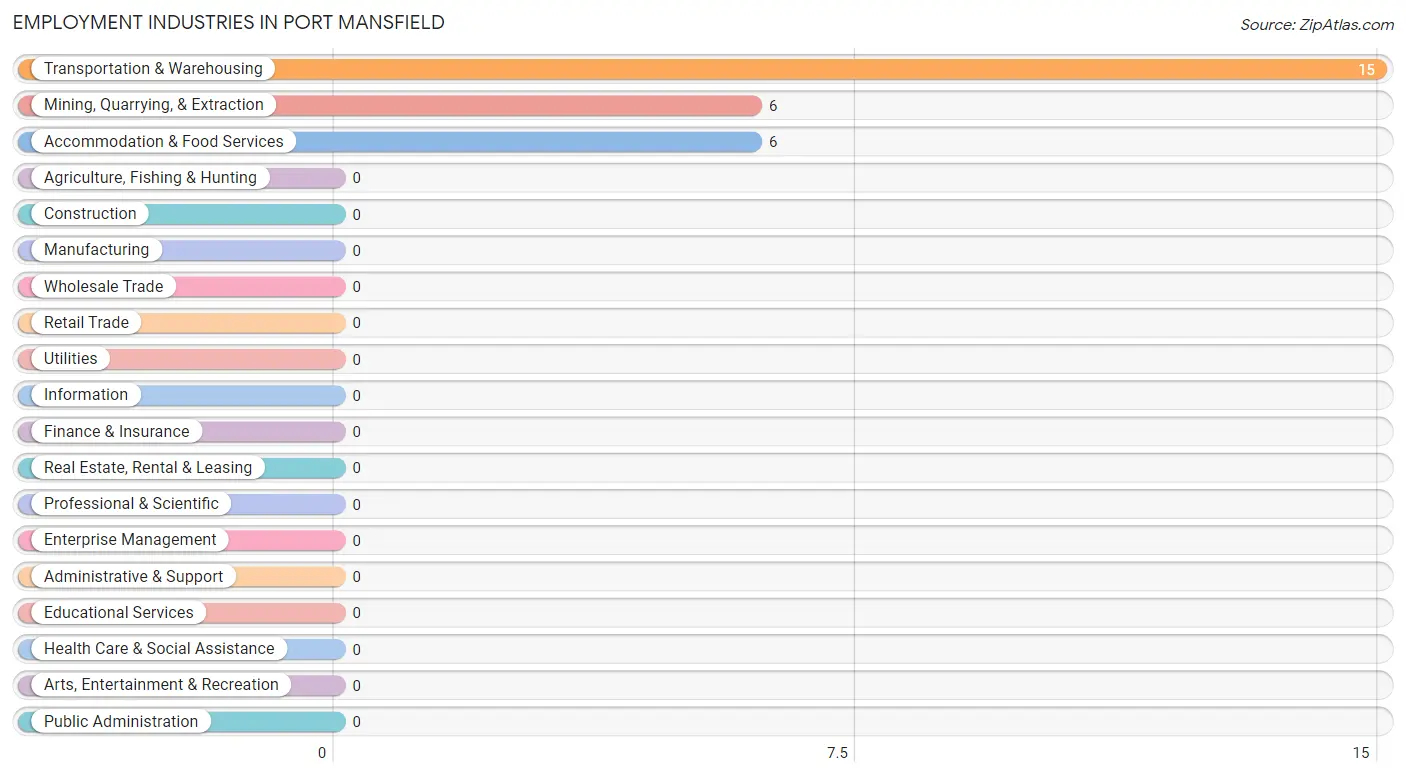
Employment Industries in Port Mansfield
The major employment industries in Port Mansfield include Transportation & Warehousing (15 | 55.6%), Mining, Quarrying, & Extraction (6 | 22.2%), and Accommodation & Food Services (6 | 22.2%).
Employment Industries by Sex in Port Mansfield
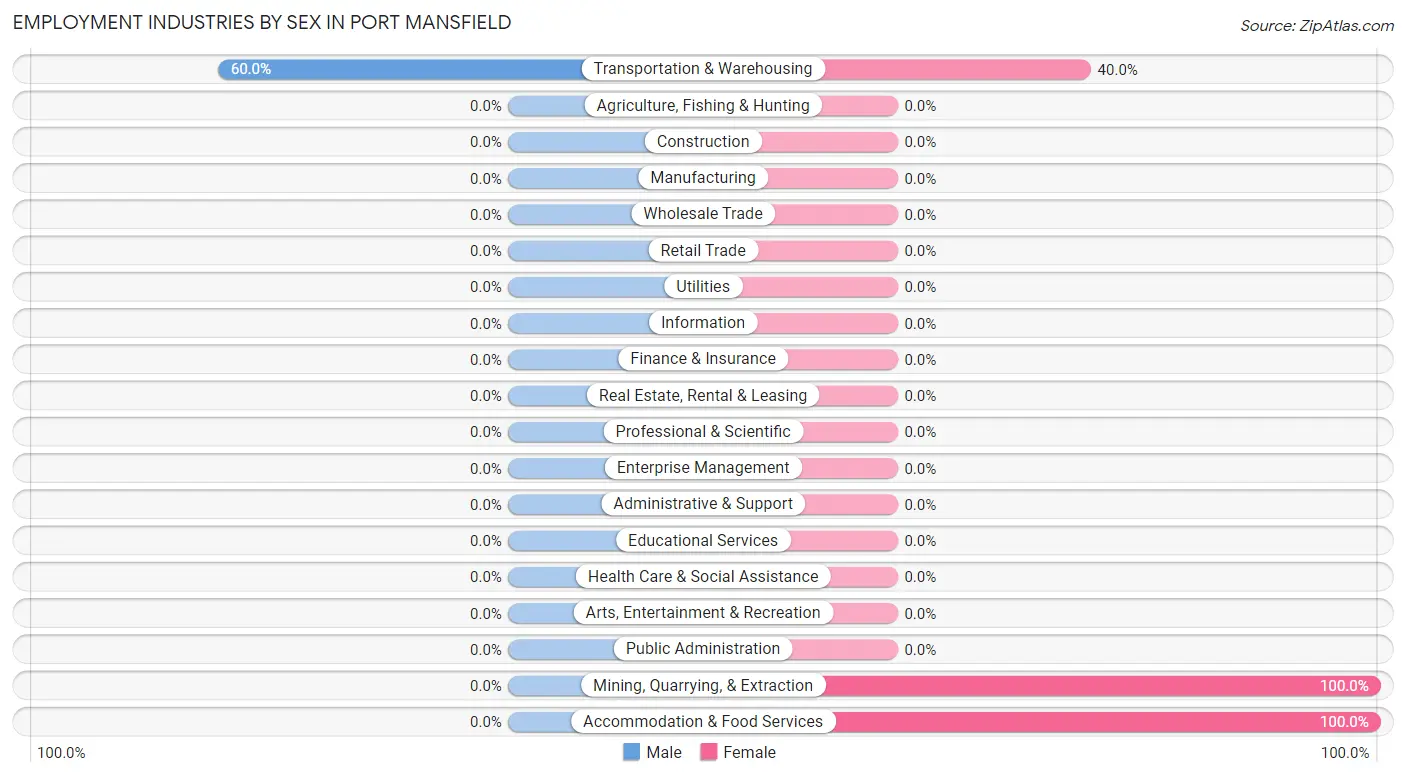
| Industry | Male | Female |
| Agriculture, Fishing & Hunting | 0 (0.0%) | 0 (0.0%) |
| Mining, Quarrying, & Extraction | 0 (0.0%) | 6 (100.0%) |
| Construction | 0 (0.0%) | 0 (0.0%) |
| Manufacturing | 0 (0.0%) | 0 (0.0%) |
| Wholesale Trade | 0 (0.0%) | 0 (0.0%) |
| Retail Trade | 0 (0.0%) | 0 (0.0%) |
| Transportation & Warehousing | 9 (60.0%) | 6 (40.0%) |
| Utilities | 0 (0.0%) | 0 (0.0%) |
| Information | 0 (0.0%) | 0 (0.0%) |
| Finance & Insurance | 0 (0.0%) | 0 (0.0%) |
| Real Estate, Rental & Leasing | 0 (0.0%) | 0 (0.0%) |
| Professional & Scientific | 0 (0.0%) | 0 (0.0%) |
| Enterprise Management | 0 (0.0%) | 0 (0.0%) |
| Administrative & Support | 0 (0.0%) | 0 (0.0%) |
| Educational Services | 0 (0.0%) | 0 (0.0%) |
| Health Care & Social Assistance | 0 (0.0%) | 0 (0.0%) |
| Arts, Entertainment & Recreation | 0 (0.0%) | 0 (0.0%) |
| Accommodation & Food Services | 0 (0.0%) | 6 (100.0%) |
| Public Administration | 0 (0.0%) | 0 (0.0%) |
| Total | 9 (33.3%) | 18 (66.7%) |
Education in Port Mansfield
School Enrollment in Port Mansfield
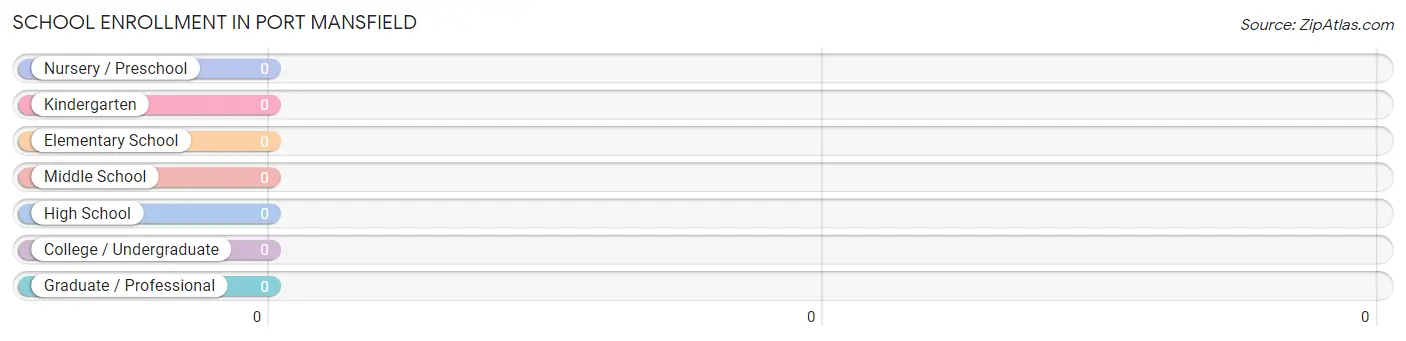
| School Level | # Students | % Students |
| Nursery / Preschool | 0 | 0.0% |
| Kindergarten | 0 | 0.0% |
| Elementary School | 0 | 0.0% |
| Middle School | 0 | 0.0% |
| High School | 0 | 0.0% |
| College / Undergraduate | 0 | 0.0% |
| Graduate / Professional | 0 | 0.0% |
| Total | 0 | 0.0% |
School Enrollment by Age by Funding Source in Port Mansfield
| Age Bracket | Public School | Private School |
| 3 to 4 Year Olds | 0 (0.0%) | 0 (0.0%) |
| 5 to 9 Year Old | 0 (0.0%) | 0 (0.0%) |
| 10 to 14 Year Olds | 0 (0.0%) | 0 (0.0%) |
| 15 to 17 Year Olds | 0 (0.0%) | 0 (0.0%) |
| 18 to 19 Year Olds | 0 (0.0%) | 0 (0.0%) |
| 20 to 24 Year Olds | 0 (0.0%) | 0 (0.0%) |
| 25 to 34 Year Olds | 0 (0.0%) | 0 (0.0%) |
| 35 Years and over | 0 (0.0%) | 0 (0.0%) |
| Total | 0 (0.0%) | 0 (0.0%) |
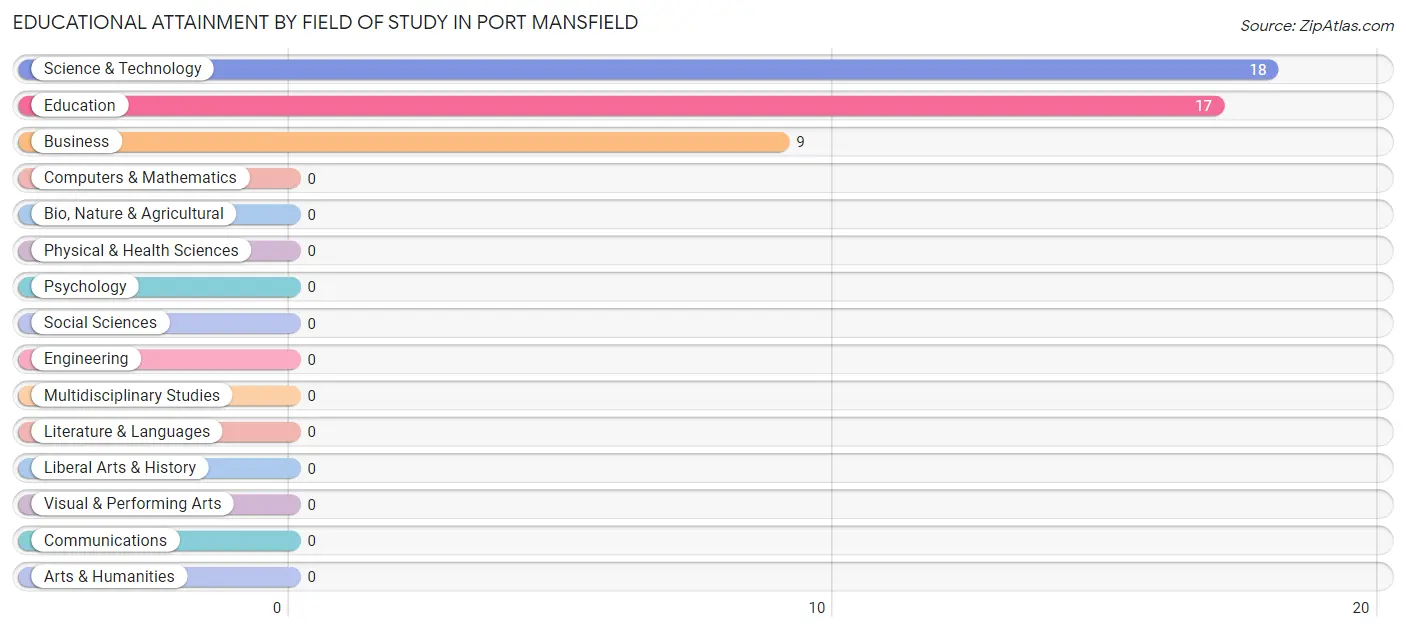
Educational Attainment by Field of Study in Port Mansfield
Science & technology (18 | 40.9%), education (17 | 38.6%), and business (9 | 20.4%) are the most common fields of study among 44 individuals in Port Mansfield who have obtained a bachelor's degree or higher.
| Field of Study | # Graduates | % Graduates |
| Computers & Mathematics | 0 | 0.0% |
| Bio, Nature & Agricultural | 0 | 0.0% |
| Physical & Health Sciences | 0 | 0.0% |
| Psychology | 0 | 0.0% |
| Social Sciences | 0 | 0.0% |
| Engineering | 0 | 0.0% |
| Multidisciplinary Studies | 0 | 0.0% |
| Science & Technology | 18 | 40.9% |
| Business | 9 | 20.4% |
| Education | 17 | 38.6% |
| Literature & Languages | 0 | 0.0% |
| Liberal Arts & History | 0 | 0.0% |
| Visual & Performing Arts | 0 | 0.0% |
| Communications | 0 | 0.0% |
| Arts & Humanities | 0 | 0.0% |
| Total | 44 | 100.0% |
Transportation & Commute in Port Mansfield
Vehicle Availability by Sex in Port Mansfield
The most prevalent vehicle ownership categories in Port Mansfield are males with 5 or more vehicles (9, accounting for 100.0%) and females with 5 or more vehicles (12, making up 50.0%).
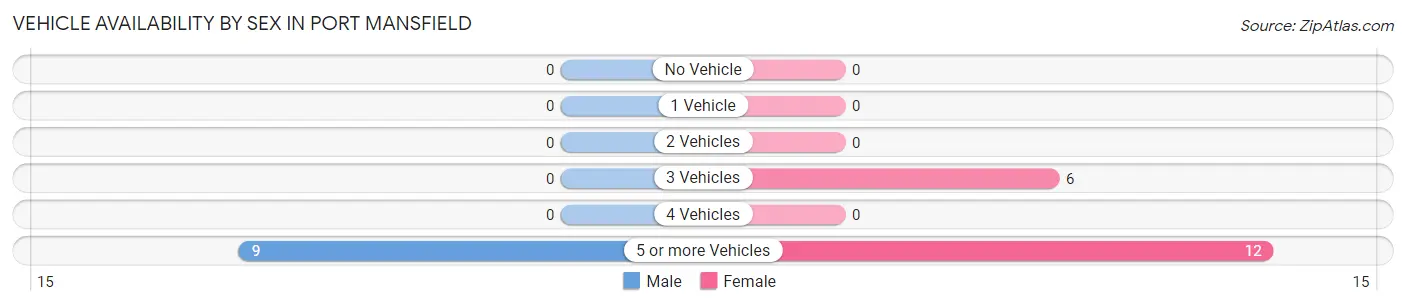
| Vehicles Available | Male | Female |
| No Vehicle | 0 (0.0%) | 0 (0.0%) |
| 1 Vehicle | 0 (0.0%) | 0 (0.0%) |
| 2 Vehicles | 0 (0.0%) | 0 (0.0%) |
| 3 Vehicles | 0 (0.0%) | 6 (33.3%) |
| 4 Vehicles | 0 (0.0%) | 0 (0.0%) |
| 5 or more Vehicles | 9 (100.0%) | 12 (66.7%) |
| Total | 9 (100.0%) | 18 (100.0%) |
Commute Time in Port Mansfield
The most frequently occuring commute durations in Port Mansfield are 5 to 9 minutes (12 commuters, 57.1%), 10 to 14 minutes (9 commuters, 42.9%), and less than 5 minutes (0 commuters, 0.0%).
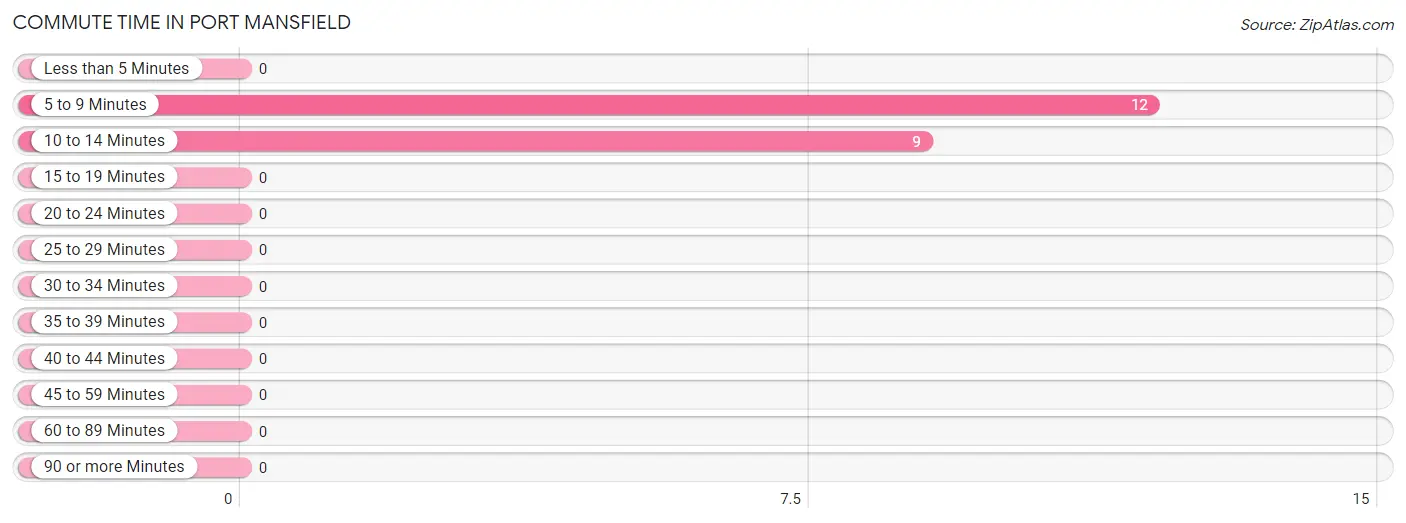
| Commute Time | # Commuters | % Commuters |
| Less than 5 Minutes | 0 | 0.0% |
| 5 to 9 Minutes | 12 | 57.1% |
| 10 to 14 Minutes | 9 | 42.9% |
| 15 to 19 Minutes | 0 | 0.0% |
| 20 to 24 Minutes | 0 | 0.0% |
| 25 to 29 Minutes | 0 | 0.0% |
| 30 to 34 Minutes | 0 | 0.0% |
| 35 to 39 Minutes | 0 | 0.0% |
| 40 to 44 Minutes | 0 | 0.0% |
| 45 to 59 Minutes | 0 | 0.0% |
| 60 to 89 Minutes | 0 | 0.0% |
| 90 or more Minutes | 0 | 0.0% |
Commute Time by Sex in Port Mansfield
The most common commute times in Port Mansfield are 10 to 14 minutes (9 commuters, 100.0%) for males and 5 to 9 minutes (12 commuters, 100.0%) for females.
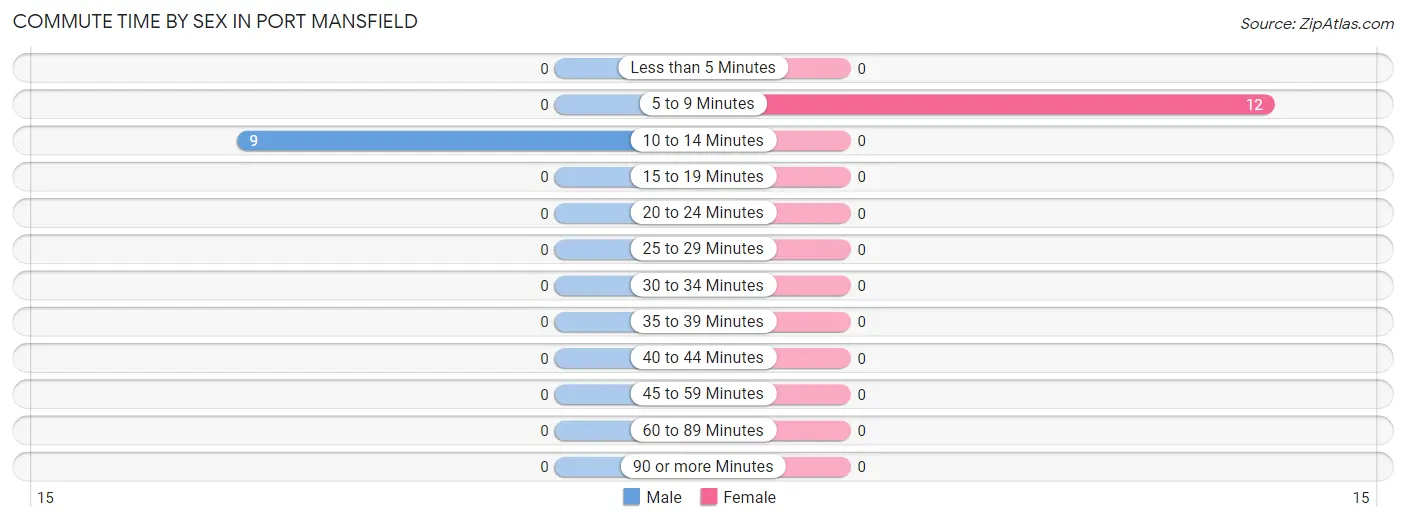
| Commute Time | Male | Female |
| Less than 5 Minutes | 0 (0.0%) | 0 (0.0%) |
| 5 to 9 Minutes | 0 (0.0%) | 12 (100.0%) |
| 10 to 14 Minutes | 9 (100.0%) | 0 (0.0%) |
| 15 to 19 Minutes | 0 (0.0%) | 0 (0.0%) |
| 20 to 24 Minutes | 0 (0.0%) | 0 (0.0%) |
| 25 to 29 Minutes | 0 (0.0%) | 0 (0.0%) |
| 30 to 34 Minutes | 0 (0.0%) | 0 (0.0%) |
| 35 to 39 Minutes | 0 (0.0%) | 0 (0.0%) |
| 40 to 44 Minutes | 0 (0.0%) | 0 (0.0%) |
| 45 to 59 Minutes | 0 (0.0%) | 0 (0.0%) |
| 60 to 89 Minutes | 0 (0.0%) | 0 (0.0%) |
| 90 or more Minutes | 0 (0.0%) | 0 (0.0%) |
Time of Departure to Work by Sex in Port Mansfield
The most frequent times of departure to work in Port Mansfield are 8:00 AM to 8:29 AM (9, 100.0%) for males and 8:00 AM to 8:29 AM (12, 100.0%) for females.
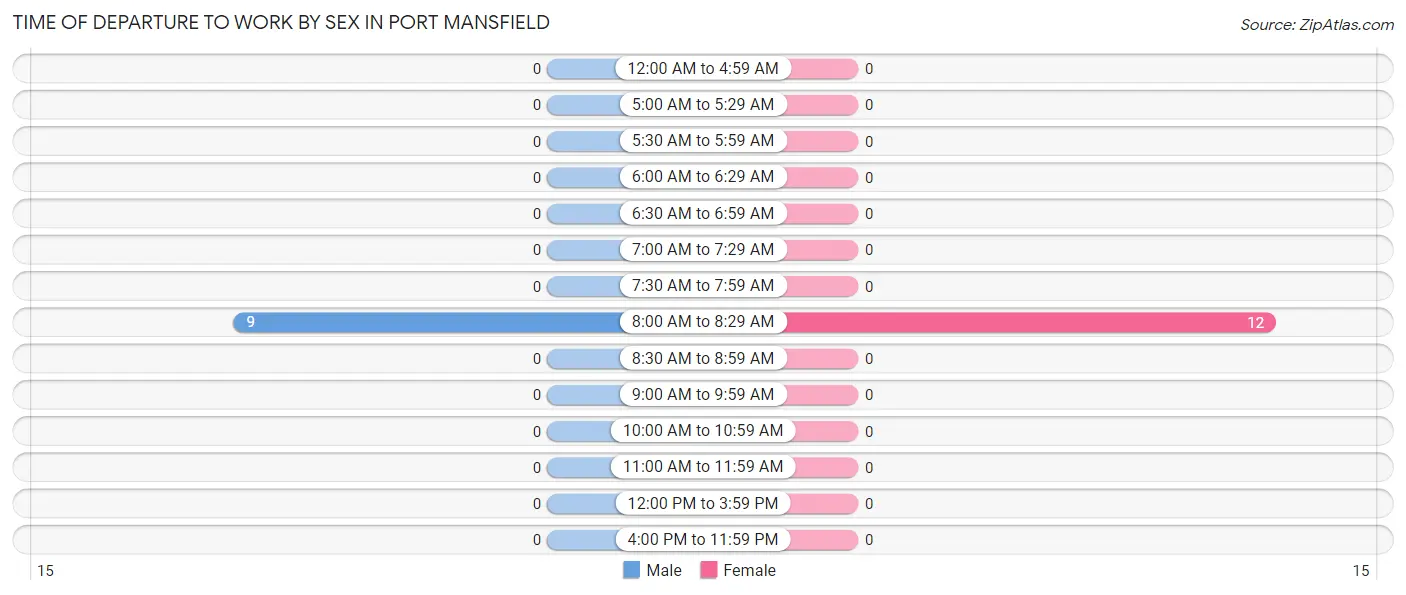
| Time of Departure | Male | Female |
| 12:00 AM to 4:59 AM | 0 (0.0%) | 0 (0.0%) |
| 5:00 AM to 5:29 AM | 0 (0.0%) | 0 (0.0%) |
| 5:30 AM to 5:59 AM | 0 (0.0%) | 0 (0.0%) |
| 6:00 AM to 6:29 AM | 0 (0.0%) | 0 (0.0%) |
| 6:30 AM to 6:59 AM | 0 (0.0%) | 0 (0.0%) |
| 7:00 AM to 7:29 AM | 0 (0.0%) | 0 (0.0%) |
| 7:30 AM to 7:59 AM | 0 (0.0%) | 0 (0.0%) |
| 8:00 AM to 8:29 AM | 9 (100.0%) | 12 (100.0%) |
| 8:30 AM to 8:59 AM | 0 (0.0%) | 0 (0.0%) |
| 9:00 AM to 9:59 AM | 0 (0.0%) | 0 (0.0%) |
| 10:00 AM to 10:59 AM | 0 (0.0%) | 0 (0.0%) |
| 11:00 AM to 11:59 AM | 0 (0.0%) | 0 (0.0%) |
| 12:00 PM to 3:59 PM | 0 (0.0%) | 0 (0.0%) |
| 4:00 PM to 11:59 PM | 0 (0.0%) | 0 (0.0%) |
| Total | 9 (100.0%) | 12 (100.0%) |
Housing Occupancy in Port Mansfield
Occupancy by Ownership in Port Mansfield
Of the total 67 dwellings in Port Mansfield, owner-occupied units account for 56 (83.6%), while renter-occupied units make up 11 (16.4%).
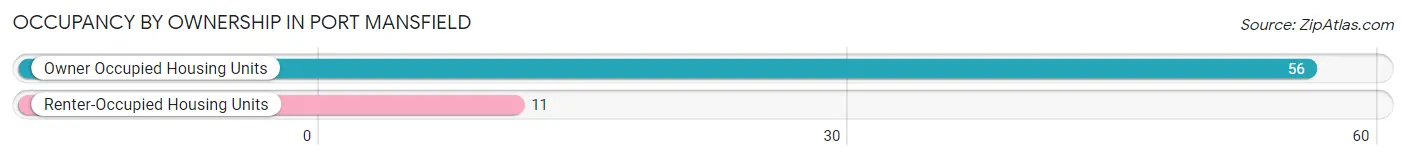
| Occupancy | # Housing Units | % Housing Units |
| Owner Occupied Housing Units | 56 | 83.6% |
| Renter-Occupied Housing Units | 11 | 16.4% |
| Total Occupied Housing Units | 67 | 100.0% |
Occupancy by Household Size in Port Mansfield
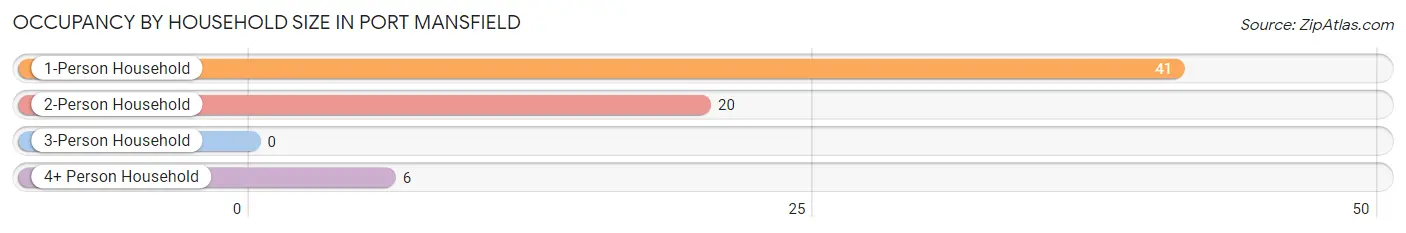
| Household Size | # Housing Units | % Housing Units |
| 1-Person Household | 41 | 61.2% |
| 2-Person Household | 20 | 29.8% |
| 3-Person Household | 0 | 0.0% |
| 4+ Person Household | 6 | 9.0% |
| Total Housing Units | 67 | 100.0% |
Occupancy by Ownership by Household Size in Port Mansfield
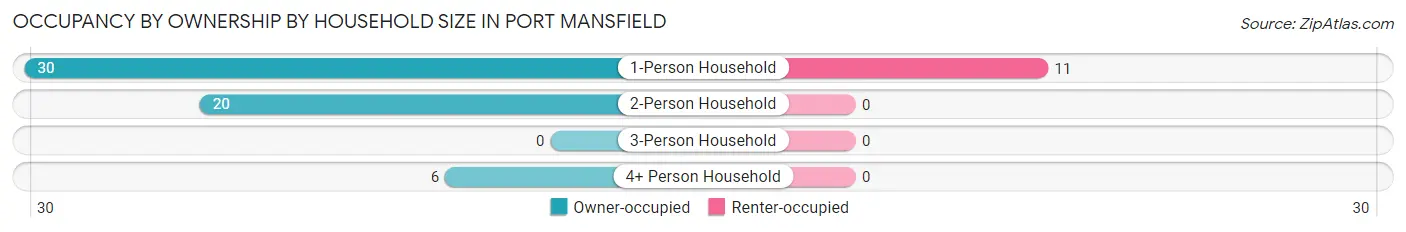
| Household Size | Owner-occupied | Renter-occupied |
| 1-Person Household | 30 (73.2%) | 11 (26.8%) |
| 2-Person Household | 20 (100.0%) | 0 (0.0%) |
| 3-Person Household | 0 (0.0%) | 0 (0.0%) |
| 4+ Person Household | 6 (100.0%) | 0 (0.0%) |
| Total Housing Units | 56 (83.6%) | 11 (16.4%) |
Occupancy by Educational Attainment in Port Mansfield
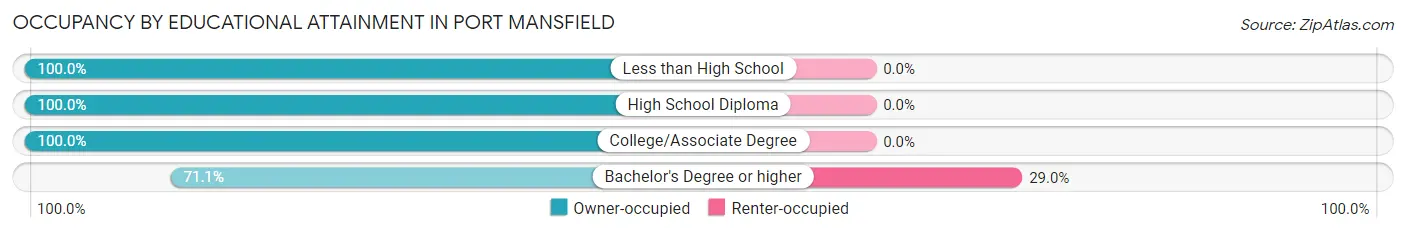
| Household Size | Owner-occupied | Renter-occupied |
| Less than High School | 6 (100.0%) | 0 (0.0%) |
| High School Diploma | 12 (100.0%) | 0 (0.0%) |
| College/Associate Degree | 11 (100.0%) | 0 (0.0%) |
| Bachelor's Degree or higher | 27 (71.1%) | 11 (28.9%) |
Occupancy by Age of Householder in Port Mansfield
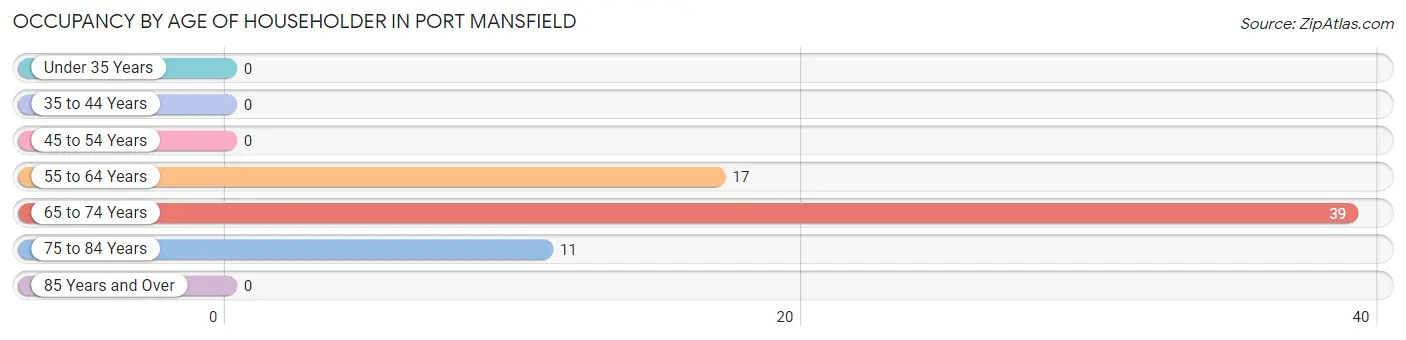
| Age Bracket | # Households | % Households |
| Under 35 Years | 0 | 0.0% |
| 35 to 44 Years | 0 | 0.0% |
| 45 to 54 Years | 0 | 0.0% |
| 55 to 64 Years | 17 | 25.4% |
| 65 to 74 Years | 39 | 58.2% |
| 75 to 84 Years | 11 | 16.4% |
| 85 Years and Over | 0 | 0.0% |
| Total | 67 | 100.0% |
Housing Finances in Port Mansfield
Median Income by Occupancy in Port Mansfield
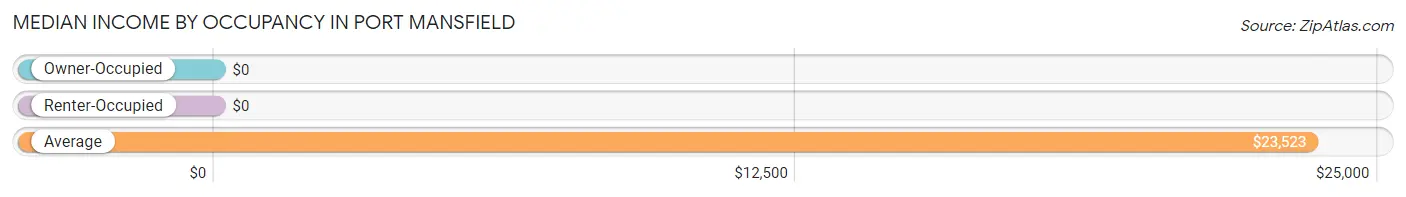
| Occupancy Type | # Households | Median Income |
| Owner-Occupied | 56 (83.6%) | $0 |
| Renter-Occupied | 11 (16.4%) | $0 |
| Average | 67 (100.0%) | $23,523 |
Occupancy by Householder Income Bracket in Port Mansfield
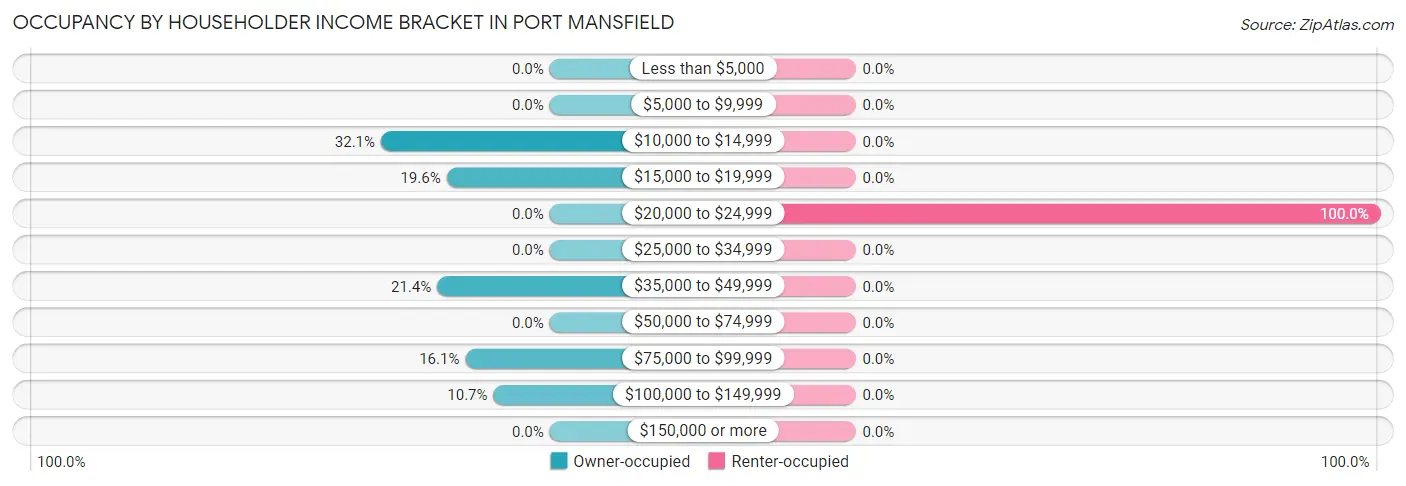
| Income Bracket | Owner-occupied | Renter-occupied |
| Less than $5,000 | 0 (0.0%) | 0 (0.0%) |
| $5,000 to $9,999 | 0 (0.0%) | 0 (0.0%) |
| $10,000 to $14,999 | 18 (32.1%) | 0 (0.0%) |
| $15,000 to $19,999 | 11 (19.6%) | 0 (0.0%) |
| $20,000 to $24,999 | 0 (0.0%) | 11 (100.0%) |
| $25,000 to $34,999 | 0 (0.0%) | 0 (0.0%) |
| $35,000 to $49,999 | 12 (21.4%) | 0 (0.0%) |
| $50,000 to $74,999 | 0 (0.0%) | 0 (0.0%) |
| $75,000 to $99,999 | 9 (16.1%) | 0 (0.0%) |
| $100,000 to $149,999 | 6 (10.7%) | 0 (0.0%) |
| $150,000 or more | 0 (0.0%) | 0 (0.0%) |
| Total | 56 (100.0%) | 11 (100.0%) |
Monthly Housing Cost Tiers in Port Mansfield
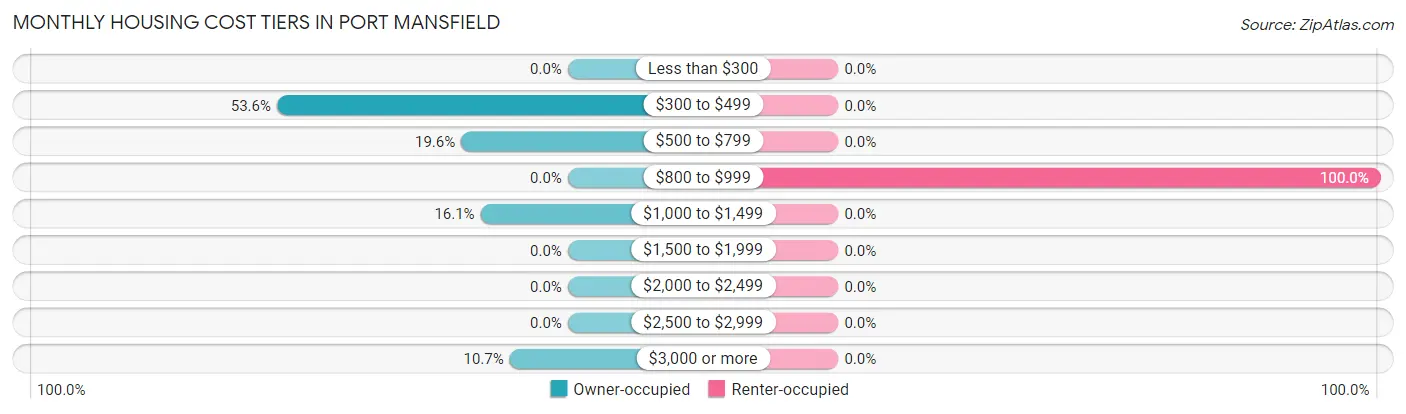
| Monthly Cost | Owner-occupied | Renter-occupied |
| Less than $300 | 0 (0.0%) | 0 (0.0%) |
| $300 to $499 | 30 (53.6%) | 0 (0.0%) |
| $500 to $799 | 11 (19.6%) | 0 (0.0%) |
| $800 to $999 | 0 (0.0%) | 11 (100.0%) |
| $1,000 to $1,499 | 9 (16.1%) | 0 (0.0%) |
| $1,500 to $1,999 | 0 (0.0%) | 0 (0.0%) |
| $2,000 to $2,499 | 0 (0.0%) | 0 (0.0%) |
| $2,500 to $2,999 | 0 (0.0%) | 0 (0.0%) |
| $3,000 or more | 6 (10.7%) | 0 (0.0%) |
| Total | 56 (100.0%) | 11 (100.0%) |
Physical Housing Characteristics in Port Mansfield
Housing Structures in Port Mansfield
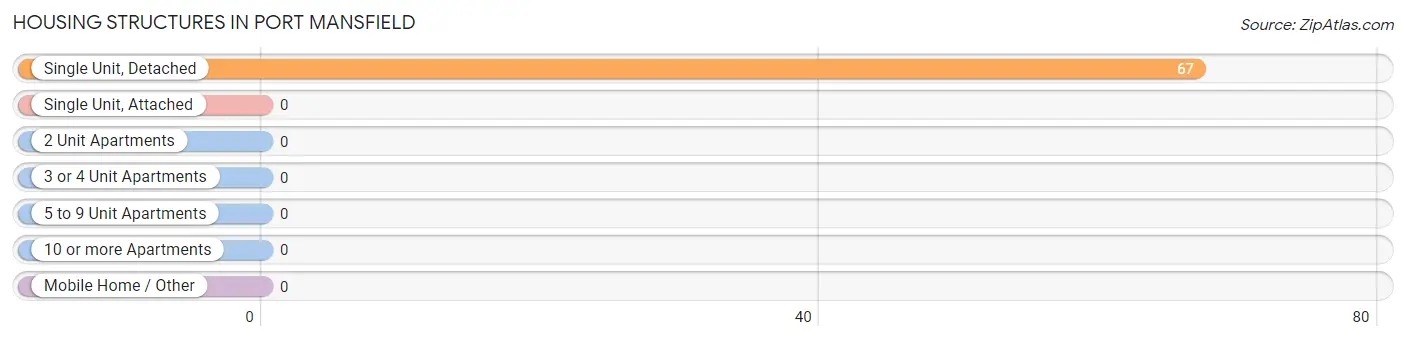
| Structure Type | # Housing Units | % Housing Units |
| Single Unit, Detached | 67 | 100.0% |
| Single Unit, Attached | 0 | 0.0% |
| 2 Unit Apartments | 0 | 0.0% |
| 3 or 4 Unit Apartments | 0 | 0.0% |
| 5 to 9 Unit Apartments | 0 | 0.0% |
| 10 or more Apartments | 0 | 0.0% |
| Mobile Home / Other | 0 | 0.0% |
| Total | 67 | 100.0% |
Housing Structures by Occupancy in Port Mansfield
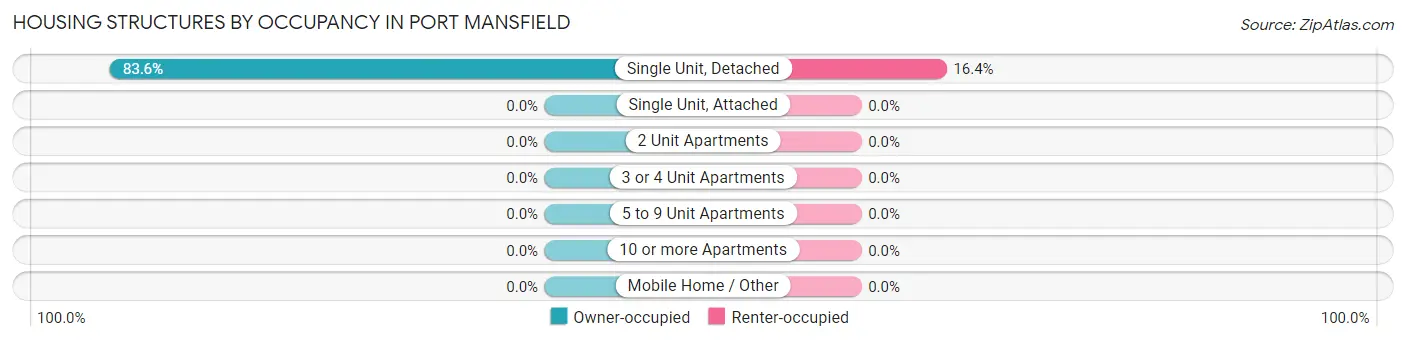
| Structure Type | Owner-occupied | Renter-occupied |
| Single Unit, Detached | 56 (83.6%) | 11 (16.4%) |
| Single Unit, Attached | 0 (0.0%) | 0 (0.0%) |
| 2 Unit Apartments | 0 (0.0%) | 0 (0.0%) |
| 3 or 4 Unit Apartments | 0 (0.0%) | 0 (0.0%) |
| 5 to 9 Unit Apartments | 0 (0.0%) | 0 (0.0%) |
| 10 or more Apartments | 0 (0.0%) | 0 (0.0%) |
| Mobile Home / Other | 0 (0.0%) | 0 (0.0%) |
| Total | 56 (83.6%) | 11 (16.4%) |
Housing Structures by Number of Rooms in Port Mansfield
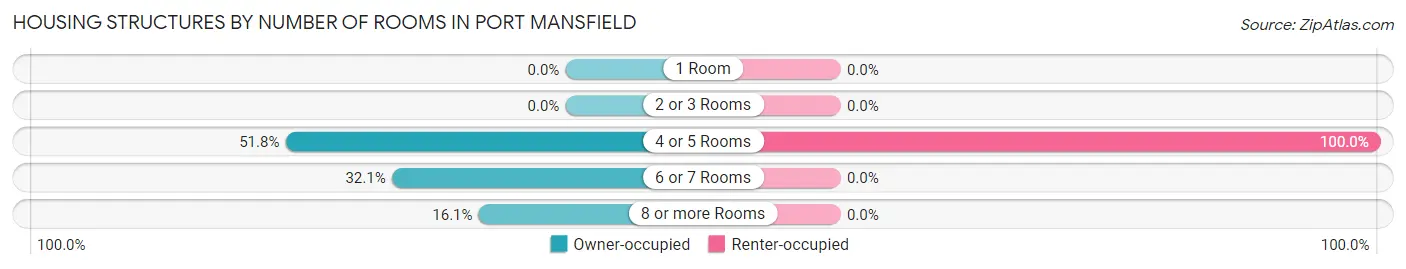
| Number of Rooms | Owner-occupied | Renter-occupied |
| 1 Room | 0 (0.0%) | 0 (0.0%) |
| 2 or 3 Rooms | 0 (0.0%) | 0 (0.0%) |
| 4 or 5 Rooms | 29 (51.8%) | 11 (100.0%) |
| 6 or 7 Rooms | 18 (32.1%) | 0 (0.0%) |
| 8 or more Rooms | 9 (16.1%) | 0 (0.0%) |
| Total | 56 (100.0%) | 11 (100.0%) |
Housing Structure by Heating Type in Port Mansfield
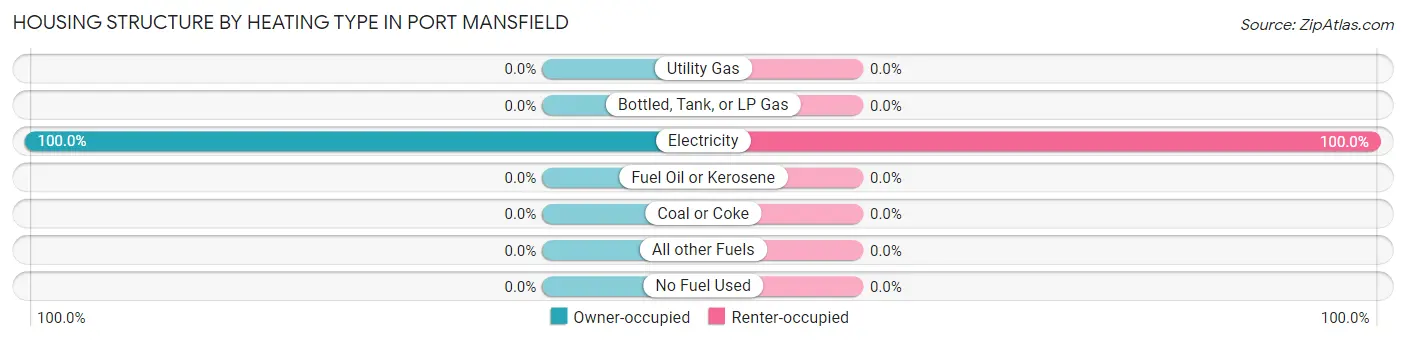
| Heating Type | Owner-occupied | Renter-occupied |
| Utility Gas | 0 (0.0%) | 0 (0.0%) |
| Bottled, Tank, or LP Gas | 0 (0.0%) | 0 (0.0%) |
| Electricity | 56 (100.0%) | 11 (100.0%) |
| Fuel Oil or Kerosene | 0 (0.0%) | 0 (0.0%) |
| Coal or Coke | 0 (0.0%) | 0 (0.0%) |
| All other Fuels | 0 (0.0%) | 0 (0.0%) |
| No Fuel Used | 0 (0.0%) | 0 (0.0%) |
| Total | 56 (100.0%) | 11 (100.0%) |
Household Vehicle Usage in Port Mansfield
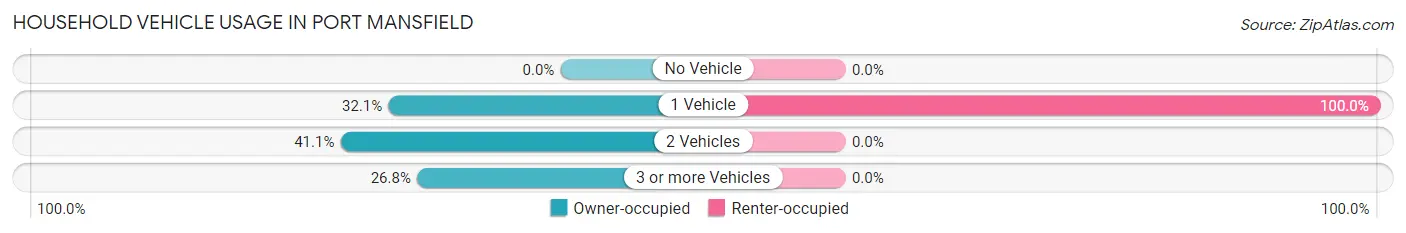
| Vehicles per Household | Owner-occupied | Renter-occupied |
| No Vehicle | 0 (0.0%) | 0 (0.0%) |
| 1 Vehicle | 18 (32.1%) | 11 (100.0%) |
| 2 Vehicles | 23 (41.1%) | 0 (0.0%) |
| 3 or more Vehicles | 15 (26.8%) | 0 (0.0%) |
| Total | 56 (100.0%) | 11 (100.0%) |
Real Estate & Mortgages in Port Mansfield
Real Estate and Mortgage Overview in Port Mansfield
| Characteristic | Without Mortgage | With Mortgage |
| Housing Units | 41 | 15 |
| Median Property Value | - | - |
| Median Household Income | - | - |
| Monthly Housing Costs | $421 | $6 |
| Real Estate Taxes | $1,342 | $0 |
Property Value by Mortgage Status in Port Mansfield
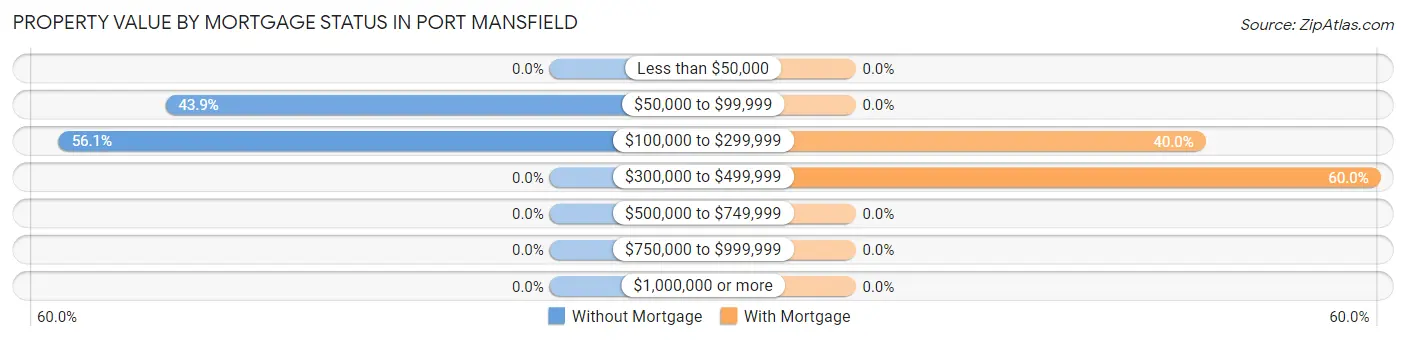
| Property Value | Without Mortgage | With Mortgage |
| Less than $50,000 | 0 (0.0%) | 0 (0.0%) |
| $50,000 to $99,999 | 18 (43.9%) | 0 (0.0%) |
| $100,000 to $299,999 | 23 (56.1%) | 6 (40.0%) |
| $300,000 to $499,999 | 0 (0.0%) | 9 (60.0%) |
| $500,000 to $749,999 | 0 (0.0%) | 0 (0.0%) |
| $750,000 to $999,999 | 0 (0.0%) | 0 (0.0%) |
| $1,000,000 or more | 0 (0.0%) | 0 (0.0%) |
| Total | 41 (100.0%) | 15 (100.0%) |
Household Income by Mortgage Status in Port Mansfield
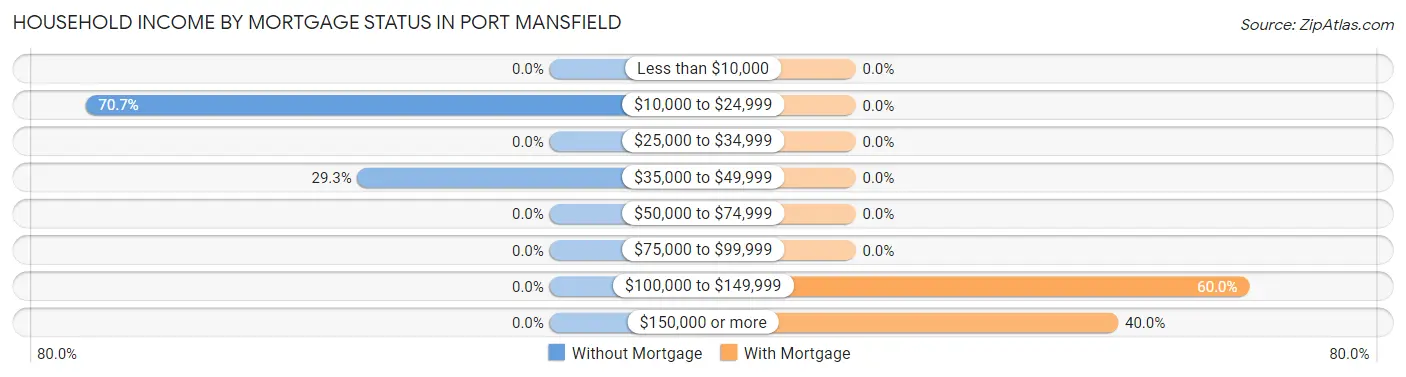
| Household Income | Without Mortgage | With Mortgage |
| Less than $10,000 | 0 (0.0%) | 0 (0.0%) |
| $10,000 to $24,999 | 29 (70.7%) | 0 (0.0%) |
| $25,000 to $34,999 | 0 (0.0%) | 0 (0.0%) |
| $35,000 to $49,999 | 12 (29.3%) | 0 (0.0%) |
| $50,000 to $74,999 | 0 (0.0%) | 0 (0.0%) |
| $75,000 to $99,999 | 0 (0.0%) | 0 (0.0%) |
| $100,000 to $149,999 | 0 (0.0%) | 9 (60.0%) |
| $150,000 or more | 0 (0.0%) | 6 (40.0%) |
| Total | 41 (100.0%) | 15 (100.0%) |
Property Value to Household Income Ratio in Port Mansfield
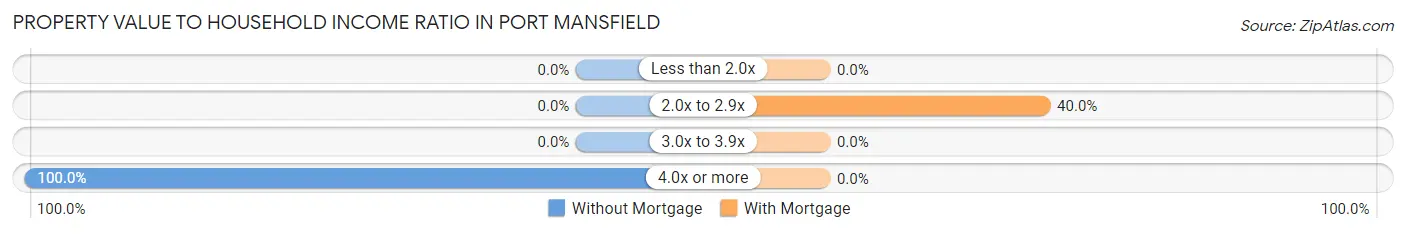
| Value-to-Income Ratio | Without Mortgage | With Mortgage |
| Less than 2.0x | 0 (0.0%) | 0 (0.0%) |
| 2.0x to 2.9x | 0 (0.0%) | 6 (40.0%) |
| 3.0x to 3.9x | 0 (0.0%) | 0 (0.0%) |
| 4.0x or more | 41 (100.0%) | 0 (0.0%) |
| Total | 41 (100.0%) | 15 (100.0%) |
Real Estate Taxes by Mortgage Status in Port Mansfield
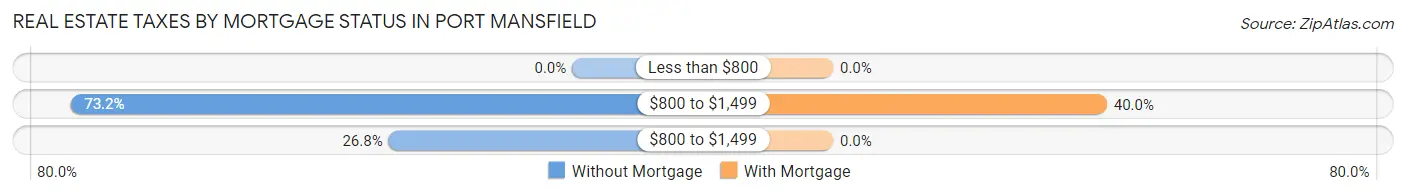
| Property Taxes | Without Mortgage | With Mortgage |
| Less than $800 | 0 (0.0%) | 0 (0.0%) |
| $800 to $1,499 | 30 (73.2%) | 6 (40.0%) |
| $800 to $1,499 | 11 (26.8%) | 0 (0.0%) |
| Total | 41 (100.0%) | 15 (100.0%) |
Health & Disability in Port Mansfield
Health Insurance Coverage by Age in Port Mansfield
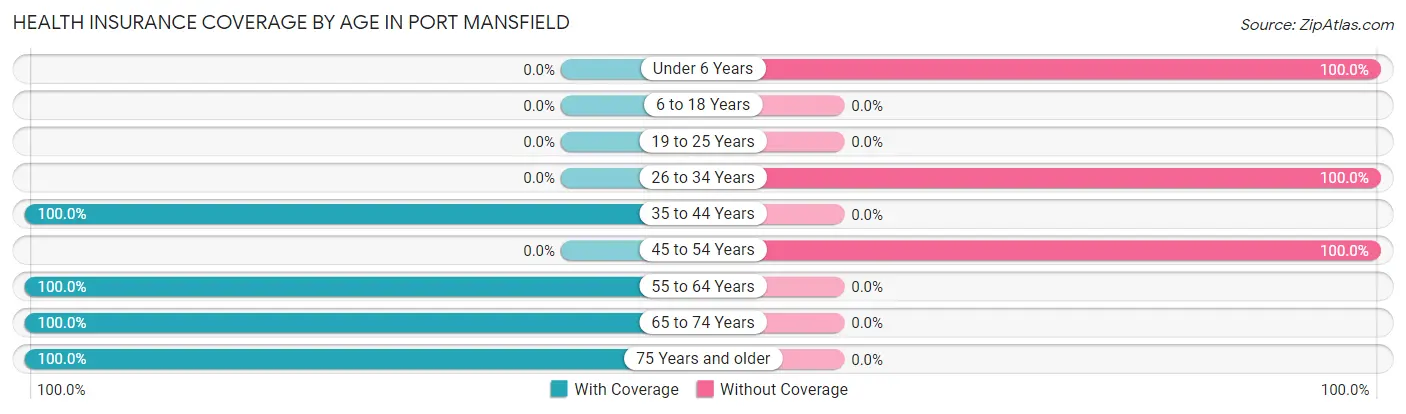
| Age Bracket | With Coverage | Without Coverage |
| Under 6 Years | 0 (0.0%) | 9 (100.0%) |
| 6 to 18 Years | 0 (0.0%) | 0 (0.0%) |
| 19 to 25 Years | 0 (0.0%) | 0 (0.0%) |
| 26 to 34 Years | 0 (0.0%) | 6 (100.0%) |
| 35 to 44 Years | 9 (100.0%) | 0 (0.0%) |
| 45 to 54 Years | 0 (0.0%) | 5 (100.0%) |
| 55 to 64 Years | 17 (100.0%) | 0 (0.0%) |
| 65 to 74 Years | 45 (100.0%) | 0 (0.0%) |
| 75 Years and older | 17 (100.0%) | 0 (0.0%) |
| Total | 88 (81.5%) | 20 (18.5%) |
Health Insurance Coverage by Citizenship Status in Port Mansfield
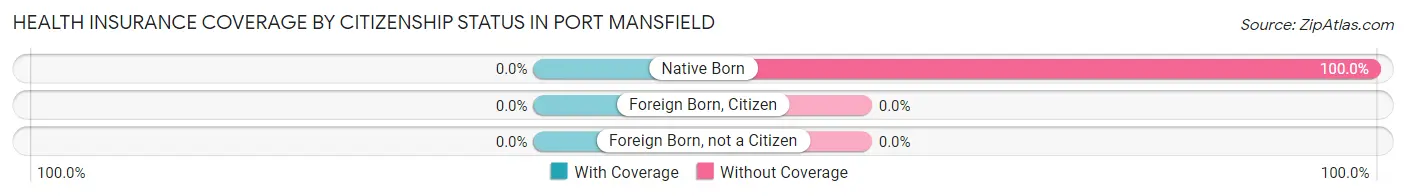
| Citizenship Status | With Coverage | Without Coverage |
| Native Born | 0 (0.0%) | 9 (100.0%) |
| Foreign Born, Citizen | 0 (0.0%) | 0 (0.0%) |
| Foreign Born, not a Citizen | 0 (0.0%) | 0 (0.0%) |
Health Insurance Coverage by Household Income in Port Mansfield
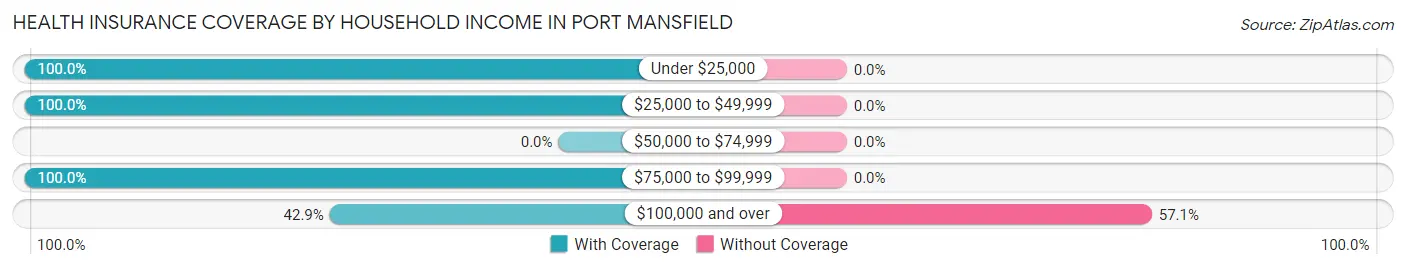
| Household Income | With Coverage | Without Coverage |
| Under $25,000 | 46 (100.0%) | 0 (0.0%) |
| $25,000 to $49,999 | 12 (100.0%) | 0 (0.0%) |
| $50,000 to $74,999 | 0 (0.0%) | 0 (0.0%) |
| $75,000 to $99,999 | 15 (100.0%) | 0 (0.0%) |
| $100,000 and over | 15 (42.9%) | 20 (57.1%) |
Public vs Private Health Insurance Coverage by Age in Port Mansfield
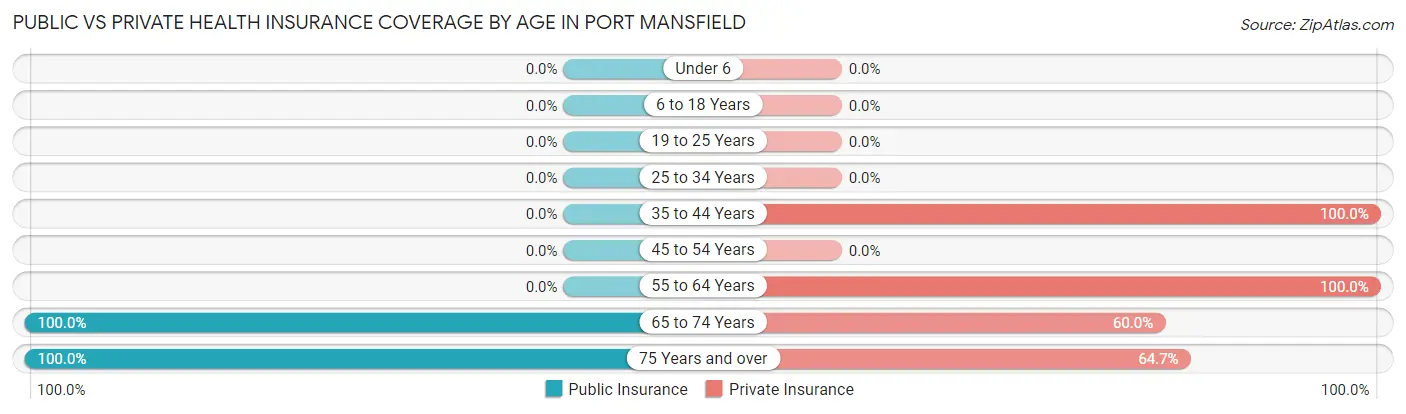
| Age Bracket | Public Insurance | Private Insurance |
| Under 6 | 0 (0.0%) | 0 (0.0%) |
| 6 to 18 Years | 0 (0.0%) | 0 (0.0%) |
| 19 to 25 Years | 0 (0.0%) | 0 (0.0%) |
| 25 to 34 Years | 0 (0.0%) | 0 (0.0%) |
| 35 to 44 Years | 0 (0.0%) | 9 (100.0%) |
| 45 to 54 Years | 0 (0.0%) | 0 (0.0%) |
| 55 to 64 Years | 0 (0.0%) | 17 (100.0%) |
| 65 to 74 Years | 45 (100.0%) | 27 (60.0%) |
| 75 Years and over | 17 (100.0%) | 11 (64.7%) |
| Total | 62 (57.4%) | 64 (59.3%) |
Disability Status by Sex by Age in Port Mansfield
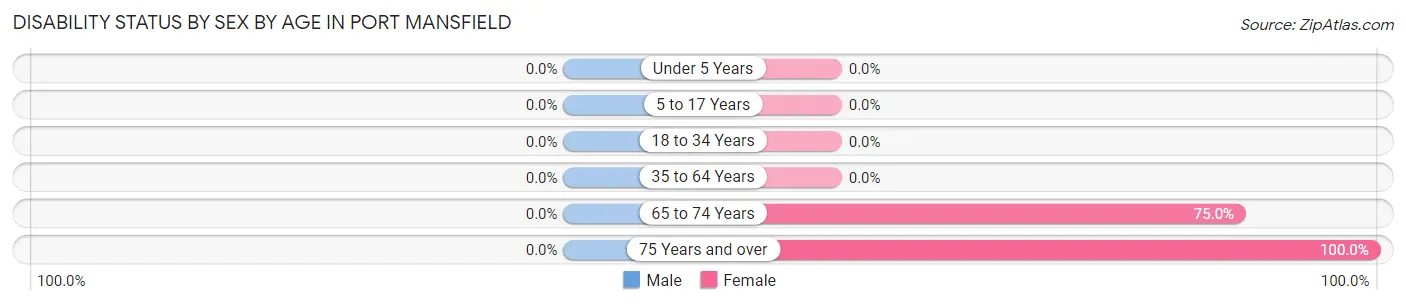
| Age Bracket | Male | Female |
| Under 5 Years | 0 (0.0%) | 0 (0.0%) |
| 5 to 17 Years | 0 (0.0%) | 0 (0.0%) |
| 18 to 34 Years | 0 (0.0%) | 0 (0.0%) |
| 35 to 64 Years | 0 (0.0%) | 0 (0.0%) |
| 65 to 74 Years | 0 (0.0%) | 18 (75.0%) |
| 75 Years and over | 0 (0.0%) | 6 (100.0%) |
Disability Class by Sex by Age in Port Mansfield
Disability Class: Hearing Difficulty
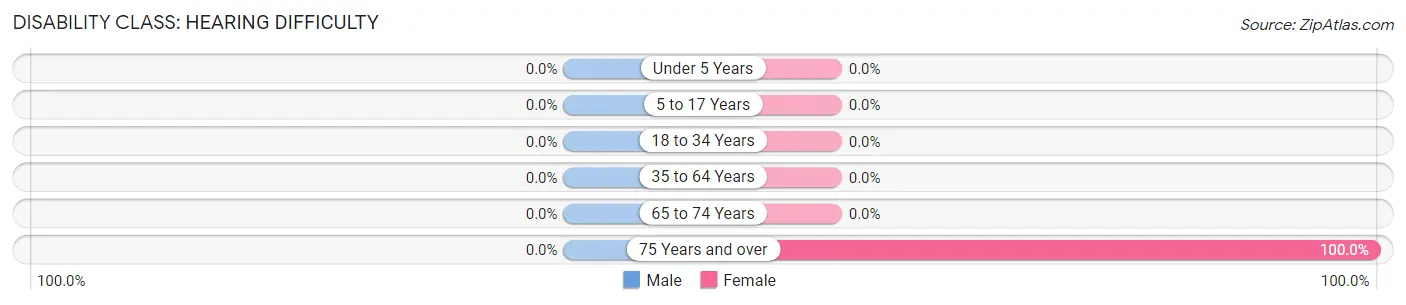
| Age Bracket | Male | Female |
| Under 5 Years | 0 (0.0%) | 0 (0.0%) |
| 5 to 17 Years | 0 (0.0%) | 0 (0.0%) |
| 18 to 34 Years | 0 (0.0%) | 0 (0.0%) |
| 35 to 64 Years | 0 (0.0%) | 0 (0.0%) |
| 65 to 74 Years | 0 (0.0%) | 0 (0.0%) |
| 75 Years and over | 0 (0.0%) | 6 (100.0%) |
Disability Class: Vision Difficulty
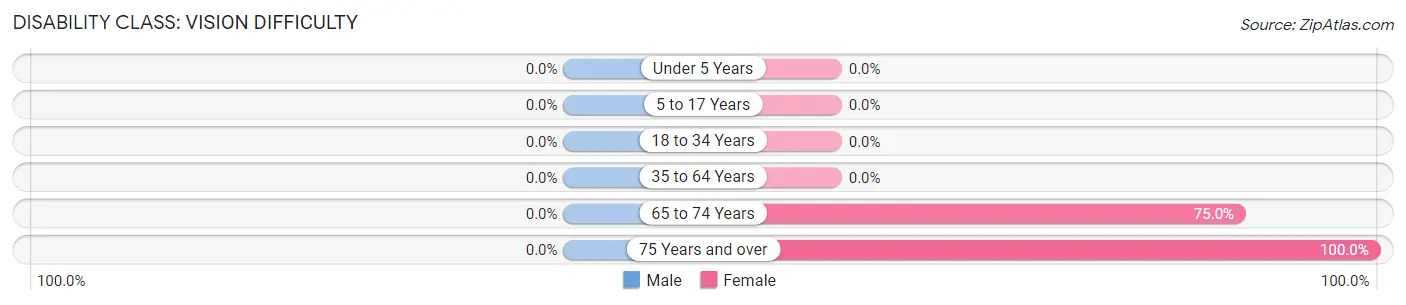
| Age Bracket | Male | Female |
| Under 5 Years | 0 (0.0%) | 0 (0.0%) |
| 5 to 17 Years | 0 (0.0%) | 0 (0.0%) |
| 18 to 34 Years | 0 (0.0%) | 0 (0.0%) |
| 35 to 64 Years | 0 (0.0%) | 0 (0.0%) |
| 65 to 74 Years | 0 (0.0%) | 18 (75.0%) |
| 75 Years and over | 0 (0.0%) | 6 (100.0%) |
Disability Class: Cognitive Difficulty

| Age Bracket | Male | Female |
| 5 to 17 Years | 0 (0.0%) | 0 (0.0%) |
| 18 to 34 Years | 0 (0.0%) | 0 (0.0%) |
| 35 to 64 Years | 0 (0.0%) | 0 (0.0%) |
| 65 to 74 Years | 0 (0.0%) | 0 (0.0%) |
| 75 Years and over | 0 (0.0%) | 0 (0.0%) |
Disability Class: Ambulatory Difficulty
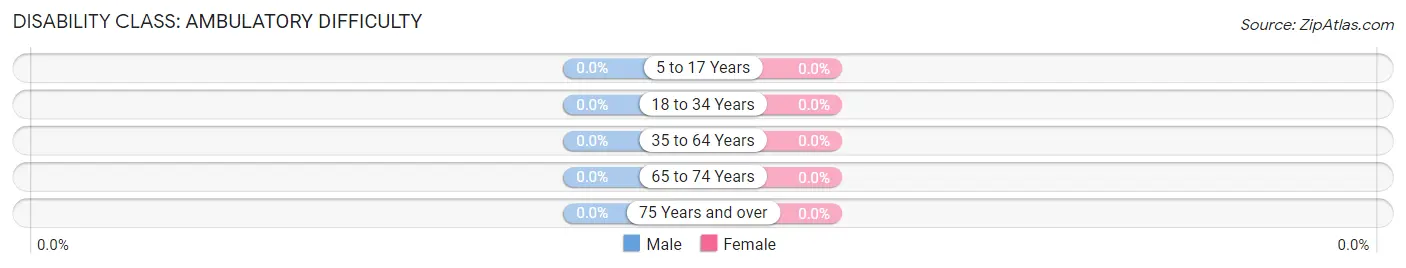
| Age Bracket | Male | Female |
| 5 to 17 Years | 0 (0.0%) | 0 (0.0%) |
| 18 to 34 Years | 0 (0.0%) | 0 (0.0%) |
| 35 to 64 Years | 0 (0.0%) | 0 (0.0%) |
| 65 to 74 Years | 0 (0.0%) | 0 (0.0%) |
| 75 Years and over | 0 (0.0%) | 0 (0.0%) |
Disability Class: Self-Care Difficulty
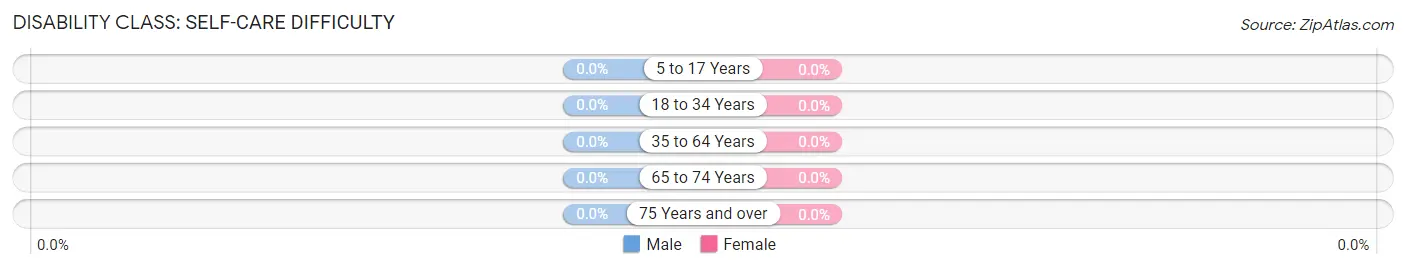
| Age Bracket | Male | Female |
| 5 to 17 Years | 0 (0.0%) | 0 (0.0%) |
| 18 to 34 Years | 0 (0.0%) | 0 (0.0%) |
| 35 to 64 Years | 0 (0.0%) | 0 (0.0%) |
| 65 to 74 Years | 0 (0.0%) | 0 (0.0%) |
| 75 Years and over | 0 (0.0%) | 0 (0.0%) |
Technology Access in Port Mansfield
Computing Device Access in Port Mansfield
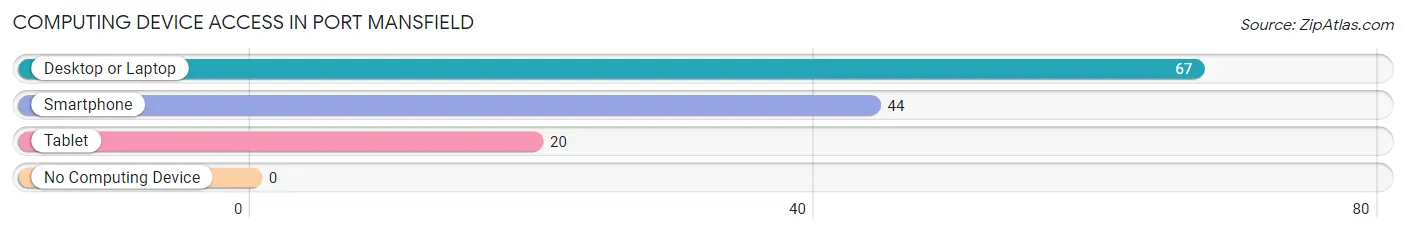
| Device Type | # Households | % Households |
| Desktop or Laptop | 67 | 100.0% |
| Smartphone | 44 | 65.7% |
| Tablet | 20 | 29.8% |
| No Computing Device | 0 | 0.0% |
| Total | 67 | 100.0% |
Internet Access in Port Mansfield
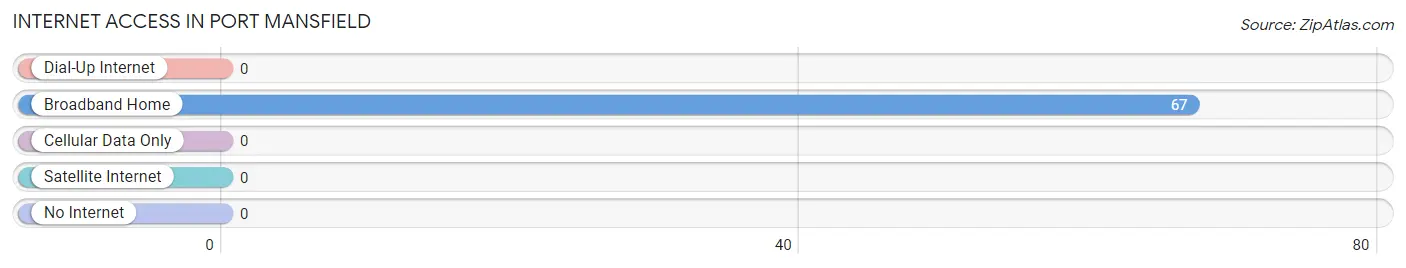
| Internet Type | # Households | % Households |
| Dial-Up Internet | 0 | 0.0% |
| Broadband Home | 67 | 100.0% |
| Cellular Data Only | 0 | 0.0% |
| Satellite Internet | 0 | 0.0% |
| No Internet | 0 | 0.0% |
| Total | 67 | 100.0% |
Port Mansfield Summary
Port Mansfield is a small unincorporated community located in Willacy County, Texas, United States. It is situated on the Laguna Madre, a shallow bay of the Gulf of Mexico, and is part of the Brownsville–Harlingen Metropolitan Statistical Area. The population of Port Mansfield was estimated to be around 1,000 in 2020.
History
Port Mansfield was founded in the early 1900s as a fishing village. It was named after the nearby Mansfield Cut, a channel that was dug in the late 1800s to provide a shortcut for ships traveling between the Gulf of Mexico and the Laguna Madre. The channel was named after General Mansfield, a Union officer who was killed in the Battle of Mansfield during the Civil War.
In the early 1900s, the town was a popular destination for commercial fishermen, who would come to the area to take advantage of the abundant fish in the Laguna Madre. The town also became a popular spot for recreational fishing, and in the 1950s, the first marina was built in Port Mansfield.
Geography
Port Mansfield is located in Willacy County, Texas, on the Laguna Madre, a shallow bay of the Gulf of Mexico. The town is situated on the western shore of the bay, and is bordered by the cities of Raymondville and Port Isabel to the north and south, respectively. The town is located approximately 40 miles south of Brownsville, and is accessible via State Highway 186.
The town is situated on a flat coastal plain, and is surrounded by marshlands and wetlands. The climate in Port Mansfield is subtropical, with hot, humid summers and mild winters. The average annual temperature is around 75°F, and the average annual precipitation is around 25 inches.
Economy
The economy of Port Mansfield is largely based on fishing and tourism. The town is home to several marinas, which provide access to the Laguna Madre for recreational and commercial fishermen. The town is also a popular destination for tourists, who come to the area to take advantage of the abundant fishing opportunities, as well as the nearby beaches and wildlife refuges.
In addition to fishing and tourism, Port Mansfield is home to several businesses, including restaurants, convenience stores, and a few small shops. The town is also home to a few small manufacturing companies, which produce items such as fishing tackle and boat parts.
Demographics
As of the 2010 census, the population of Port Mansfield was estimated to be around 1,000. The town is predominantly white, with around 90% of the population identifying as such. The remaining 10% of the population is made up of African Americans, Hispanics, and other ethnicities. The median household income in Port Mansfield is around $30,000, and the median home value is around $90,000. The town has a poverty rate of around 20%, which is higher than the national average.
Common Questions
What is Per Capita Income in Port Mansfield?
Per Capita income in Port Mansfield is $23,684.
What is the Median Household income in Port Mansfield?
Median Household Income in Port Mansfield is $23,523.
What is Inequality or Gini Index in Port Mansfield?
Inequality or Gini Index in Port Mansfield is 0.42.
What is the Total Population of Port Mansfield?
Total Population of Port Mansfield is 108.
What is the Total Male Population of Port Mansfield?
Total Male Population of Port Mansfield is 66.
What is the Total Female Population of Port Mansfield?
Total Female Population of Port Mansfield is 42.
What is the Ratio of Males per 100 Females in Port Mansfield?
There are 157.14 Males per 100 Females in Port Mansfield.
What is the Ratio of Females per 100 Males in Port Mansfield?
There are 63.64 Females per 100 Males in Port Mansfield.
What is the Median Population Age in Port Mansfield?
Median Population Age in Port Mansfield is 67.2 Years.
What is the Average Family Size in Port Mansfield
Average Family Size in Port Mansfield is 1.9 People.
What is the Average Household Size in Port Mansfield
Average Household Size in Port Mansfield is 1.6 People.
How Large is the Labor Force in Port Mansfield?
There are 27 People in the Labor Forcein in Port Mansfield.
What is the Percentage of People in the Labor Force in Port Mansfield?
27.3% of People are in the Labor Force in Port Mansfield.