Hanalei, HI Map & Demographics
Hanalei Map
Hanalei Overview
$45,504
PER CAPITA INCOME
$95,417
AVG FAMILY INCOME
$97,292
AVG HOUSEHOLD INCOME
63.8%
WAGE / INCOME GAP [ % ]
36.2¢/ $1
WAGE / INCOME GAP [ $ ]
0.37
INEQUALITY / GINI INDEX
300
TOTAL POPULATION
115
MALE POPULATION
185
FEMALE POPULATION
62.16
MALES / 100 FEMALES
160.87
FEMALES / 100 MALES
58.7
MEDIAN AGE
2.6
AVG FAMILY SIZE
2.4
AVG HOUSEHOLD SIZE
101
LABOR FORCE [ PEOPLE ]
42.1%
PERCENT IN LABOR FORCE
17.8%
UNEMPLOYMENT RATE
Hanalei Zip Codes
Hanalei Area Codes
Income in Hanalei
Income Overview in Hanalei
Per Capita Income in Hanalei is $45,504, while median incomes of families and households are $95,417 and $97,292 respectively.
| Characteristic | Number | Measure |
| Per Capita Income | 300 | $45,504 |
| Median Family Income | 100 | $95,417 |
| Mean Family Income | 100 | $127,308 |
| Median Household Income | 125 | $97,292 |
| Mean Household Income | 125 | $120,725 |
| Income Deficit | 100 | $0 |
| Wage / Income Gap (%) | 300 | 63.77% |
| Wage / Income Gap ($) | 300 | 36.23¢ per $1 |
| Gini / Inequality Index | 300 | 0.37 |
Earnings by Sex in Hanalei
Average Earnings in Hanalei are $45,000, $86,875 for men and $31,477 for women, a difference of 63.8%.
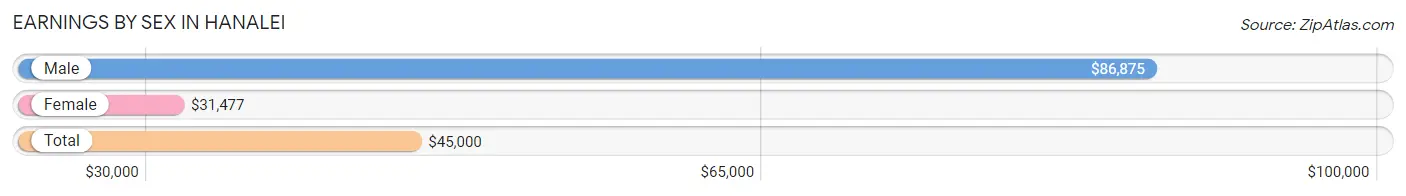
| Sex | Number | Average Earnings |
| Male | 61 (51.7%) | $86,875 |
| Female | 57 (48.3%) | $31,477 |
| Total | 118 (100.0%) | $45,000 |
Earnings by Sex by Income Bracket in Hanalei
The most common earnings brackets in Hanalei are $100,000+ for men (23 | 37.7%) and $7,500 to $9,999 for women (11 | 19.3%).
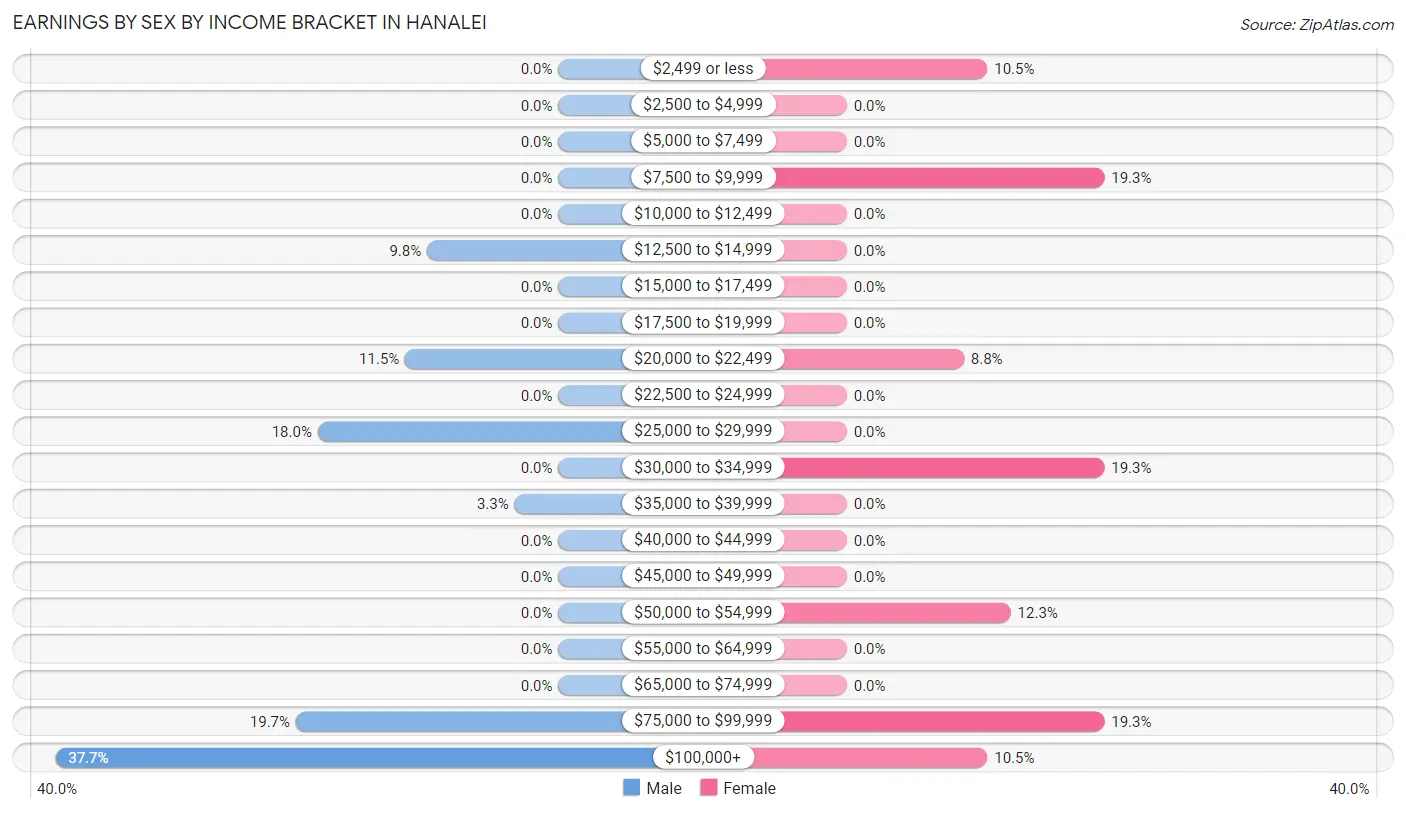
| Income | Male | Female |
| $2,499 or less | 0 (0.0%) | 6 (10.5%) |
| $2,500 to $4,999 | 0 (0.0%) | 0 (0.0%) |
| $5,000 to $7,499 | 0 (0.0%) | 0 (0.0%) |
| $7,500 to $9,999 | 0 (0.0%) | 11 (19.3%) |
| $10,000 to $12,499 | 0 (0.0%) | 0 (0.0%) |
| $12,500 to $14,999 | 6 (9.8%) | 0 (0.0%) |
| $15,000 to $17,499 | 0 (0.0%) | 0 (0.0%) |
| $17,500 to $19,999 | 0 (0.0%) | 0 (0.0%) |
| $20,000 to $22,499 | 7 (11.5%) | 5 (8.8%) |
| $22,500 to $24,999 | 0 (0.0%) | 0 (0.0%) |
| $25,000 to $29,999 | 11 (18.0%) | 0 (0.0%) |
| $30,000 to $34,999 | 0 (0.0%) | 11 (19.3%) |
| $35,000 to $39,999 | 2 (3.3%) | 0 (0.0%) |
| $40,000 to $44,999 | 0 (0.0%) | 0 (0.0%) |
| $45,000 to $49,999 | 0 (0.0%) | 0 (0.0%) |
| $50,000 to $54,999 | 0 (0.0%) | 7 (12.3%) |
| $55,000 to $64,999 | 0 (0.0%) | 0 (0.0%) |
| $65,000 to $74,999 | 0 (0.0%) | 0 (0.0%) |
| $75,000 to $99,999 | 12 (19.7%) | 11 (19.3%) |
| $100,000+ | 23 (37.7%) | 6 (10.5%) |
| Total | 61 (100.0%) | 57 (100.0%) |
Earnings by Sex by Educational Attainment in Hanalei
Average earnings in Hanalei are $86,875 for men and $31,477 for women, a difference of 63.8%. Men with an educational attainment of bachelor's degree enjoy the highest average annual earnings of $97,083, while those with bachelor's degree education earn the least with $97,083. Women with an educational attainment of bachelor's degree earn the most with the average annual earnings of $41,250, while those with bachelor's degree education have the smallest earnings of $41,250.
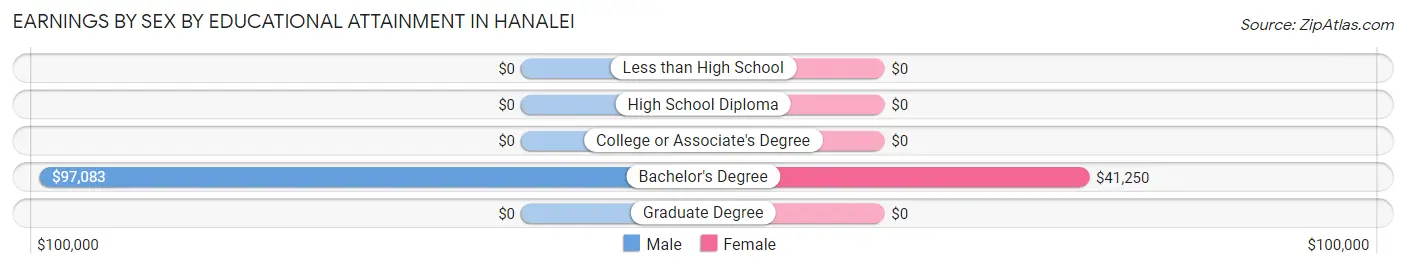
| Educational Attainment | Male Income | Female Income |
| Less than High School | - | - |
| High School Diploma | - | - |
| College or Associate's Degree | - | - |
| Bachelor's Degree | $97,083 | $41,250 |
| Graduate Degree | - | - |
| Total | $86,875 | $31,477 |
Family Income in Hanalei
Family Income Brackets in Hanalei
According to the Hanalei family income data, there are 24 families falling into the $200,000+ income range, which is the most common income bracket and makes up 24.0% of all families.
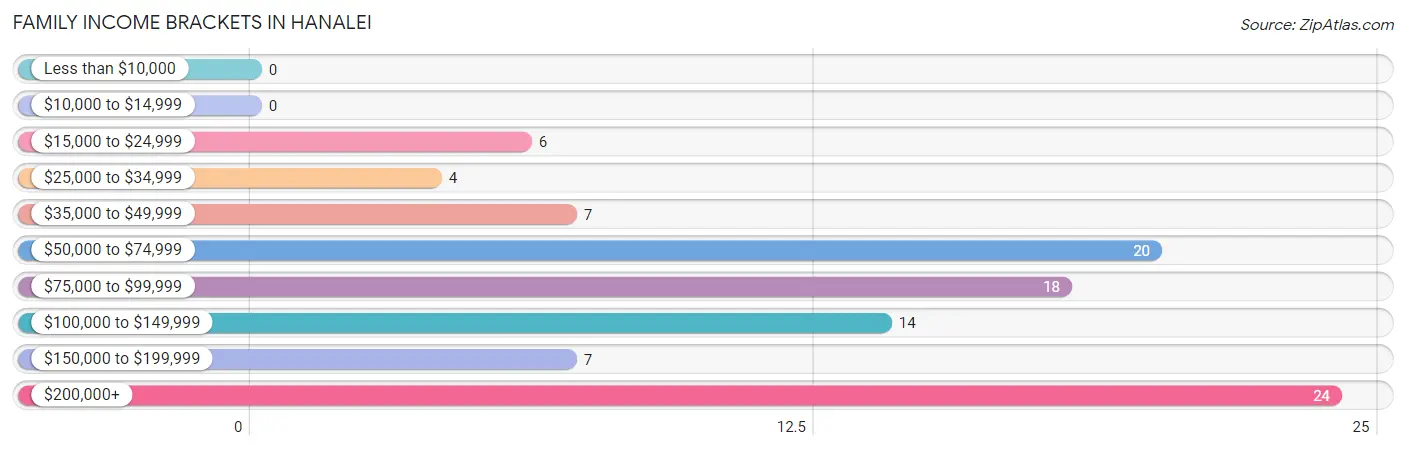
| Income Bracket | # Families | % Families |
| Less than $10,000 | 0 | 0.0% |
| $10,000 to $14,999 | 0 | 0.0% |
| $15,000 to $24,999 | 6 | 6.0% |
| $25,000 to $34,999 | 4 | 4.0% |
| $35,000 to $49,999 | 7 | 7.0% |
| $50,000 to $74,999 | 20 | 20.0% |
| $75,000 to $99,999 | 18 | 18.0% |
| $100,000 to $149,999 | 14 | 14.0% |
| $150,000 to $199,999 | 7 | 7.0% |
| $200,000+ | 24 | 24.0% |
Family Income by Famaliy Size in Hanalei
3-person families (24 | 24.0%) account for the highest median family income in Hanalei with $95,833 per family, while 2-person families (69 | 69.0%) have the highest median income of $42,946 per family member.
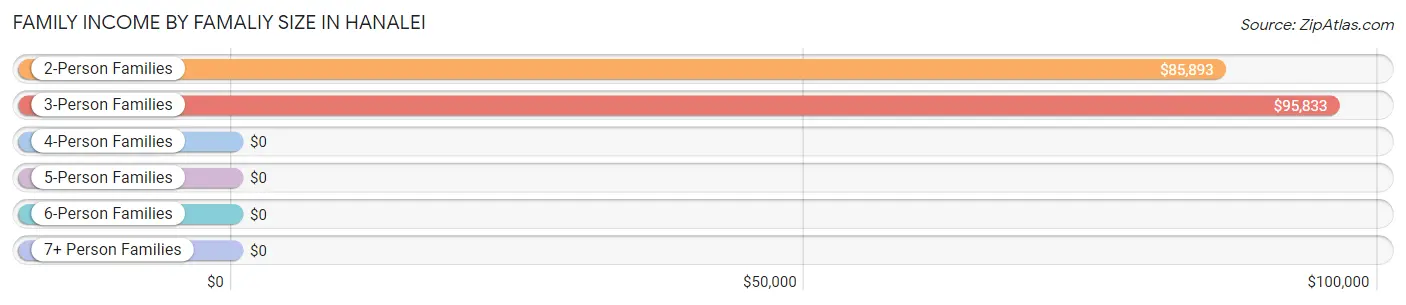
| Income Bracket | # Families | Median Income |
| 2-Person Families | 69 (69.0%) | $85,893 |
| 3-Person Families | 24 (24.0%) | $95,833 |
| 4-Person Families | 0 (0.0%) | $0 |
| 5-Person Families | 7 (7.0%) | $0 |
| 6-Person Families | 0 (0.0%) | $0 |
| 7+ Person Families | 0 (0.0%) | $0 |
| Total | 100 (100.0%) | $95,417 |
Family Income by Number of Earners in Hanalei
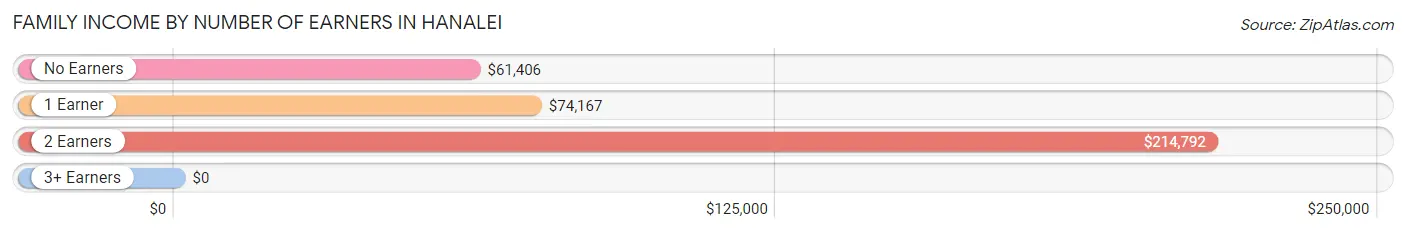
| Number of Earners | # Families | Median Income |
| No Earners | 21 (21.0%) | $61,406 |
| 1 Earner | 42 (42.0%) | $74,167 |
| 2 Earners | 37 (37.0%) | $214,792 |
| 3+ Earners | 0 (0.0%) | $0 |
| Total | 100 (100.0%) | $95,417 |
Household Income in Hanalei
Household Income Brackets in Hanalei
With 31 households falling in the category, the $100,000 to $149,999 income range is the most frequent in Hanalei, accounting for 24.8% of all households.
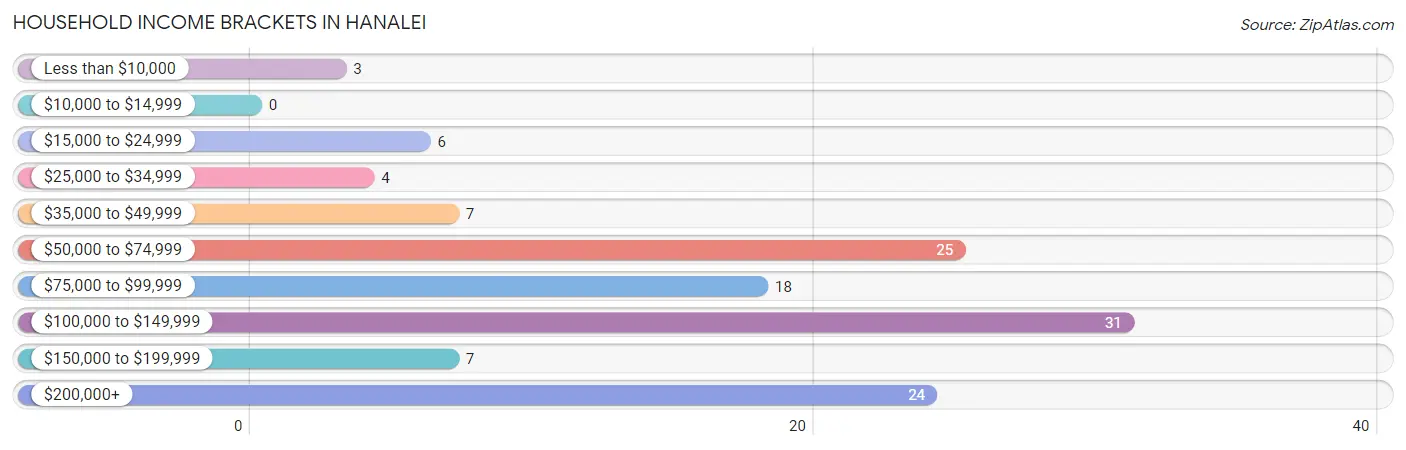
| Income Bracket | # Households | % Households |
| Less than $10,000 | 3 | 2.4% |
| $10,000 to $14,999 | 0 | 0.0% |
| $15,000 to $24,999 | 6 | 4.8% |
| $25,000 to $34,999 | 4 | 3.2% |
| $35,000 to $49,999 | 7 | 5.6% |
| $50,000 to $74,999 | 25 | 20.0% |
| $75,000 to $99,999 | 18 | 14.4% |
| $100,000 to $149,999 | 31 | 24.8% |
| $150,000 to $199,999 | 7 | 5.6% |
| $200,000+ | 24 | 19.2% |
Household Income by Householder Age in Hanalei
The median household income in Hanalei is $97,292, with the highest median household income of $120,662 found in the 65+ years age bracket for the primary householder. A total of 75 households (60.0%) fall into this category.
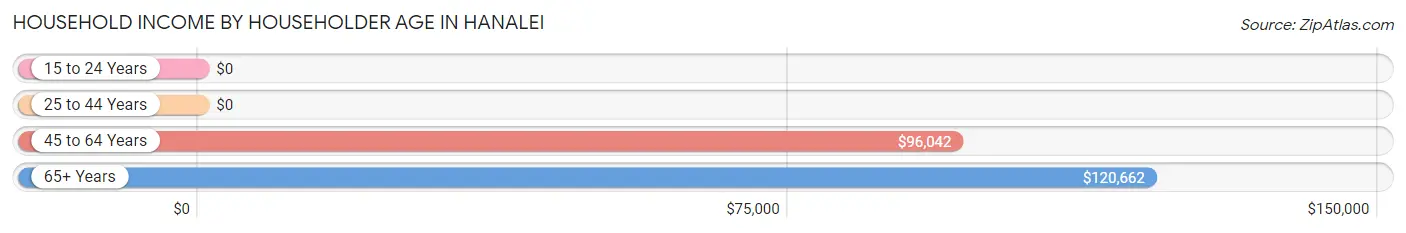
| Income Bracket | # Households | Median Income |
| 15 to 24 Years | 0 (0.0%) | $0 |
| 25 to 44 Years | 17 (13.6%) | $0 |
| 45 to 64 Years | 33 (26.4%) | $96,042 |
| 65+ Years | 75 (60.0%) | $120,662 |
| Total | 125 (100.0%) | $97,292 |
Poverty in Hanalei
Income Below Poverty by Sex and Age in Hanalei
With 14.8% poverty level for males and 2.2% for females among the residents of Hanalei, 6 to 11 year old males and 18 to 24 year old females are the most vulnerable to poverty, with 8 males (100.0%) and 4 females (100.0%) in their respective age groups living below the poverty level.
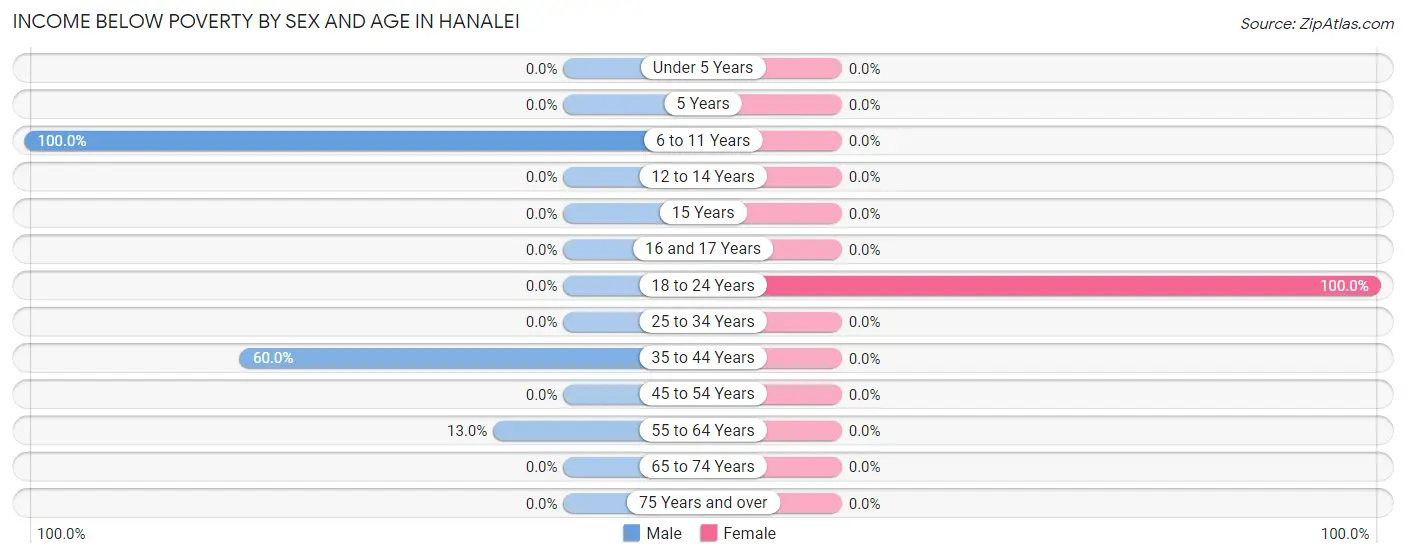
| Age Bracket | Male | Female |
| Under 5 Years | 0 (0.0%) | 0 (0.0%) |
| 5 Years | 0 (0.0%) | 0 (0.0%) |
| 6 to 11 Years | 8 (100.0%) | 0 (0.0%) |
| 12 to 14 Years | 0 (0.0%) | 0 (0.0%) |
| 15 Years | 0 (0.0%) | 0 (0.0%) |
| 16 and 17 Years | 0 (0.0%) | 0 (0.0%) |
| 18 to 24 Years | 0 (0.0%) | 4 (100.0%) |
| 25 to 34 Years | 0 (0.0%) | 0 (0.0%) |
| 35 to 44 Years | 6 (60.0%) | 0 (0.0%) |
| 45 to 54 Years | 0 (0.0%) | 0 (0.0%) |
| 55 to 64 Years | 3 (13.0%) | 0 (0.0%) |
| 65 to 74 Years | 0 (0.0%) | 0 (0.0%) |
| 75 Years and over | 0 (0.0%) | 0 (0.0%) |
| Total | 17 (14.8%) | 4 (2.2%) |
Income Above Poverty by Sex and Age in Hanalei
According to the poverty statistics in Hanalei, males aged 5 years and females aged under 5 years are the age groups that are most secure financially, with 100.0% of males and 100.0% of females in these age groups living above the poverty line.
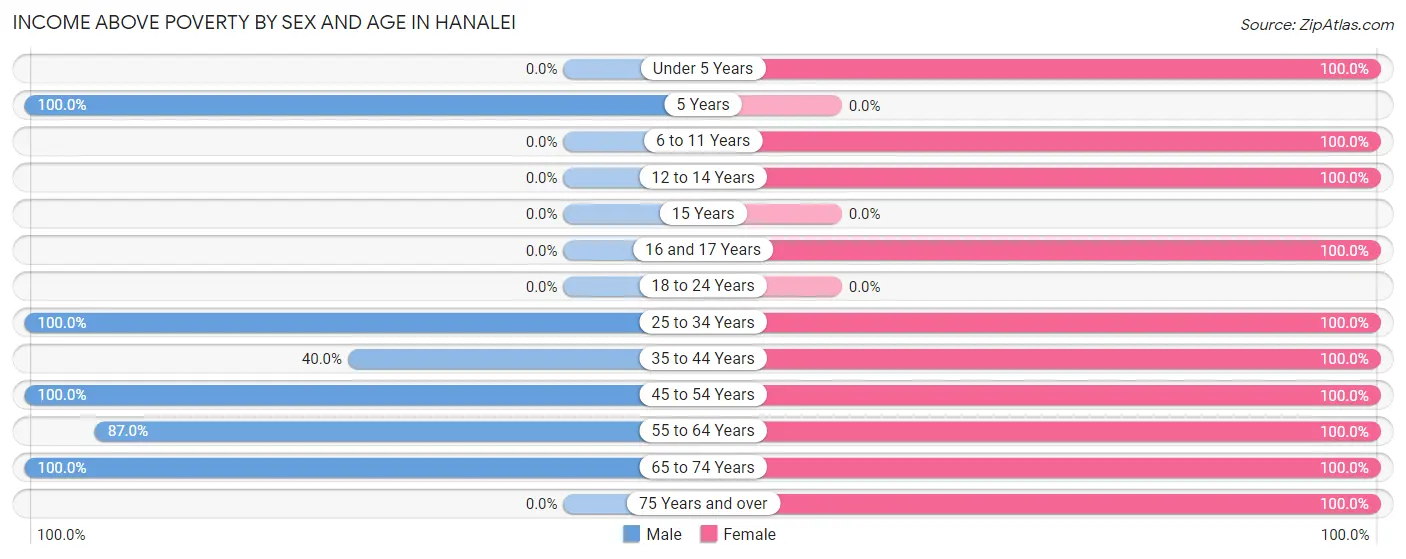
| Age Bracket | Male | Female |
| Under 5 Years | 0 (0.0%) | 17 (100.0%) |
| 5 Years | 13 (100.0%) | 0 (0.0%) |
| 6 to 11 Years | 0 (0.0%) | 5 (100.0%) |
| 12 to 14 Years | 0 (0.0%) | 17 (100.0%) |
| 15 Years | 0 (0.0%) | 0 (0.0%) |
| 16 and 17 Years | 0 (0.0%) | 9 (100.0%) |
| 18 to 24 Years | 0 (0.0%) | 0 (0.0%) |
| 25 to 34 Years | 4 (100.0%) | 11 (100.0%) |
| 35 to 44 Years | 4 (40.0%) | 7 (100.0%) |
| 45 to 54 Years | 2 (100.0%) | 28 (100.0%) |
| 55 to 64 Years | 20 (87.0%) | 10 (100.0%) |
| 65 to 74 Years | 55 (100.0%) | 70 (100.0%) |
| 75 Years and over | 0 (0.0%) | 7 (100.0%) |
| Total | 98 (85.2%) | 181 (97.8%) |
Income Below Poverty Among Married-Couple Families in Hanalei
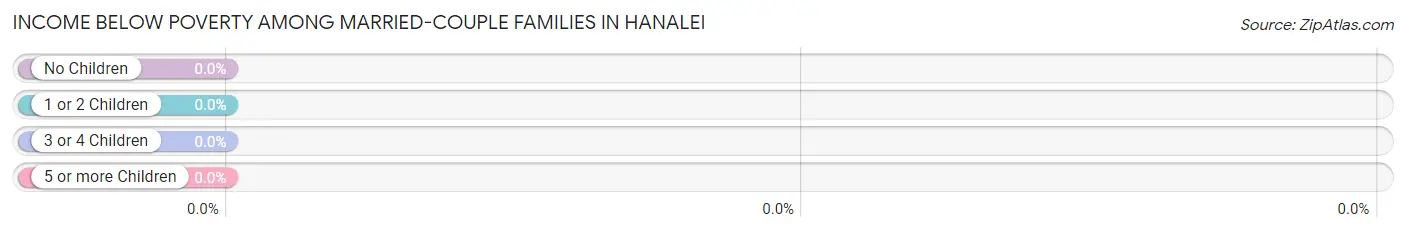
| Children | Above Poverty | Below Poverty |
| No Children | 49 (100.0%) | 0 (0.0%) |
| 1 or 2 Children | 27 (100.0%) | 0 (0.0%) |
| 3 or 4 Children | 0 (0.0%) | 0 (0.0%) |
| 5 or more Children | 0 (0.0%) | 0 (0.0%) |
| Total | 76 (100.0%) | 0 (0.0%) |
Income Below Poverty Among Single-Parent Households in Hanalei
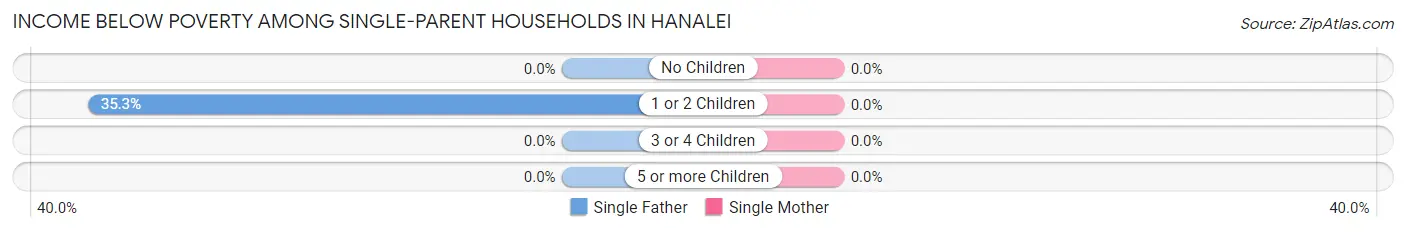
| Children | Single Father | Single Mother |
| No Children | 0 (0.0%) | 0 (0.0%) |
| 1 or 2 Children | 6 (35.3%) | 0 (0.0%) |
| 3 or 4 Children | 0 (0.0%) | 0 (0.0%) |
| 5 or more Children | 0 (0.0%) | 0 (0.0%) |
| Total | 6 (35.3%) | 0 (0.0%) |
Income Below Poverty Among Married-Couple vs Single-Parent Households in Hanalei
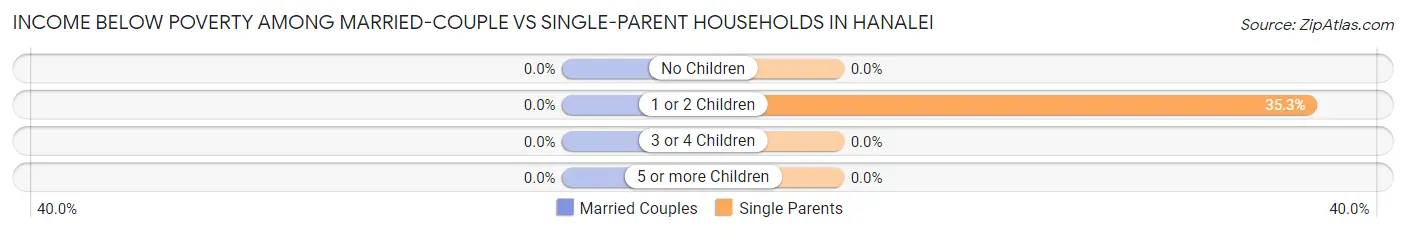
| Children | Married-Couple Families | Single-Parent Households |
| No Children | 0 (0.0%) | 0 (0.0%) |
| 1 or 2 Children | 0 (0.0%) | 6 (35.3%) |
| 3 or 4 Children | 0 (0.0%) | 0 (0.0%) |
| 5 or more Children | 0 (0.0%) | 0 (0.0%) |
| Total | 0 (0.0%) | 6 (25.0%) |
Race in Hanalei
The most populous races in Hanalei are White / Caucasian (219 | 73.0%), Asian (41 | 13.7%), and Two or more Races (40 | 13.3%).
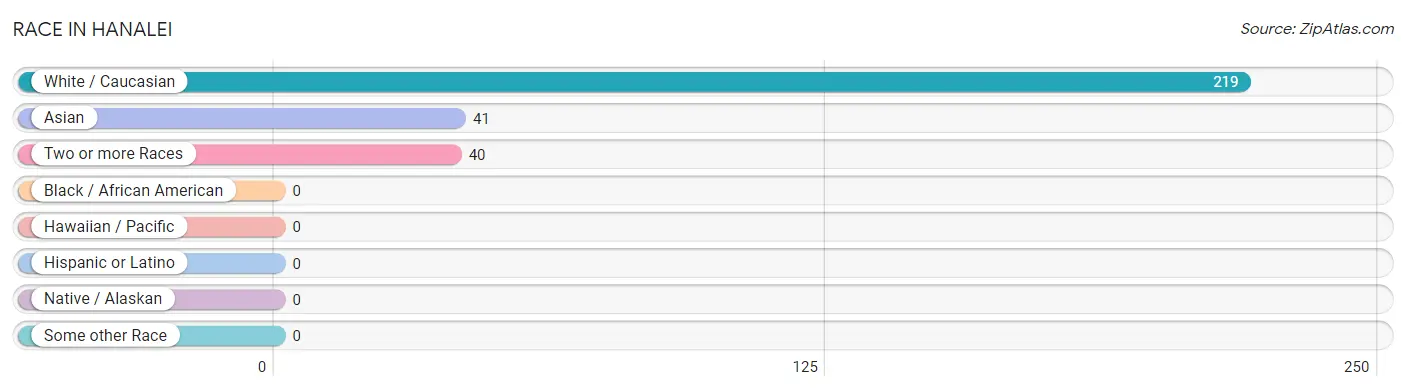
| Race | # Population | % Population |
| Asian | 41 | 13.7% |
| Black / African American | 0 | 0.0% |
| Hawaiian / Pacific | 0 | 0.0% |
| Hispanic or Latino | 0 | 0.0% |
| Native / Alaskan | 0 | 0.0% |
| White / Caucasian | 219 | 73.0% |
| Two or more Races | 40 | 13.3% |
| Some other Race | 0 | 0.0% |
| Total | 300 | 100.0% |
Ancestry in Hanalei
The most populous ancestries reported in Hanalei are English (81 | 27.0%), Irish (60 | 20.0%), Bhutanese (41 | 13.7%), Scottish (26 | 8.7%), and Native Hawaiian (23 | 7.7%), together accounting for 77.0% of all Hanalei residents.
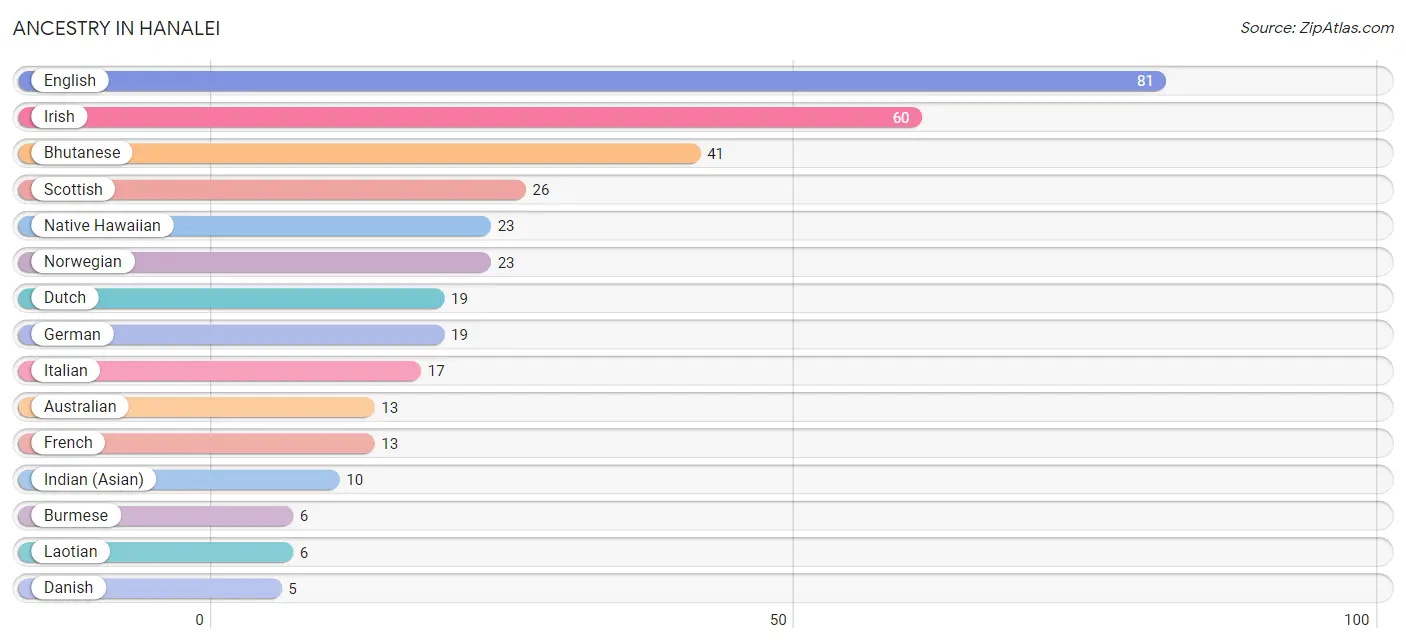
| Ancestry | # Population | % Population |
| Australian | 13 | 4.3% |
| Bhutanese | 41 | 13.7% |
| Burmese | 6 | 2.0% |
| Danish | 5 | 1.7% |
| Dutch | 19 | 6.3% |
| English | 81 | 27.0% |
| French | 13 | 4.3% |
| German | 19 | 6.3% |
| Indian (Asian) | 10 | 3.3% |
| Irish | 60 | 20.0% |
| Italian | 17 | 5.7% |
| Laotian | 6 | 2.0% |
| Native Hawaiian | 23 | 7.7% |
| Norwegian | 23 | 7.7% |
| Polish | 5 | 1.7% |
| Portuguese | 2 | 0.7% |
| Scottish | 26 | 8.7% |
| Swedish | 5 | 1.7% |
| Welsh | 4 | 1.3% | View All 19 Rows |
Immigrants in Hanalei
The most numerous immigrant groups reported in Hanalei came from Australia (13 | 4.3%), Oceania (13 | 4.3%), Argentina (6 | 2.0%), Asia (6 | 2.0%), and Eastern Asia (6 | 2.0%), together accounting for 14.7% of all Hanalei residents.
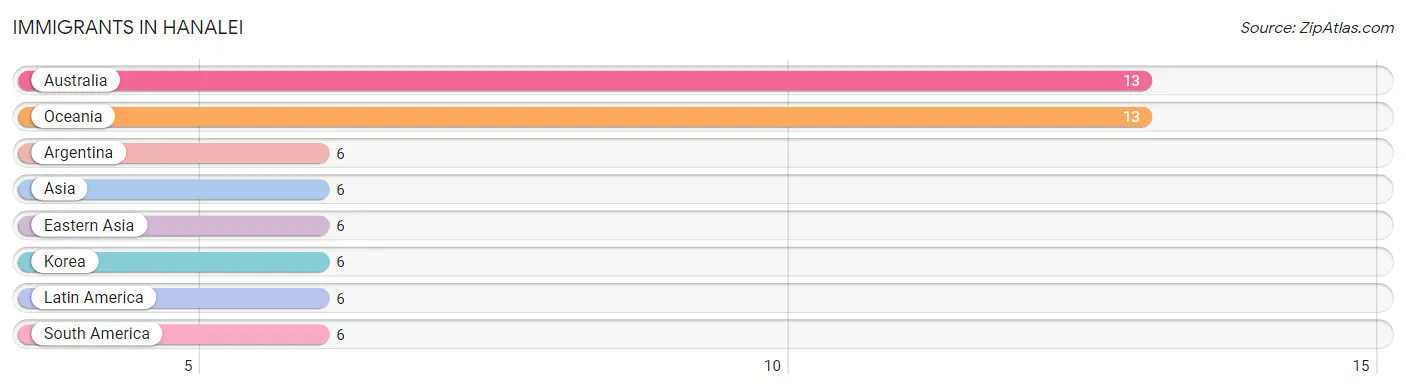
| Immigration Origin | # Population | % Population |
| Argentina | 6 | 2.0% |
| Asia | 6 | 2.0% |
| Australia | 13 | 4.3% |
| Eastern Asia | 6 | 2.0% |
| Korea | 6 | 2.0% |
| Latin America | 6 | 2.0% |
| Oceania | 13 | 4.3% |
| South America | 6 | 2.0% | View All 8 Rows |
Sex and Age in Hanalei
Sex and Age in Hanalei
The most populous age groups in Hanalei are 70 to 74 Years (41 | 35.6%) for men and 70 to 74 Years (58 | 31.4%) for women.
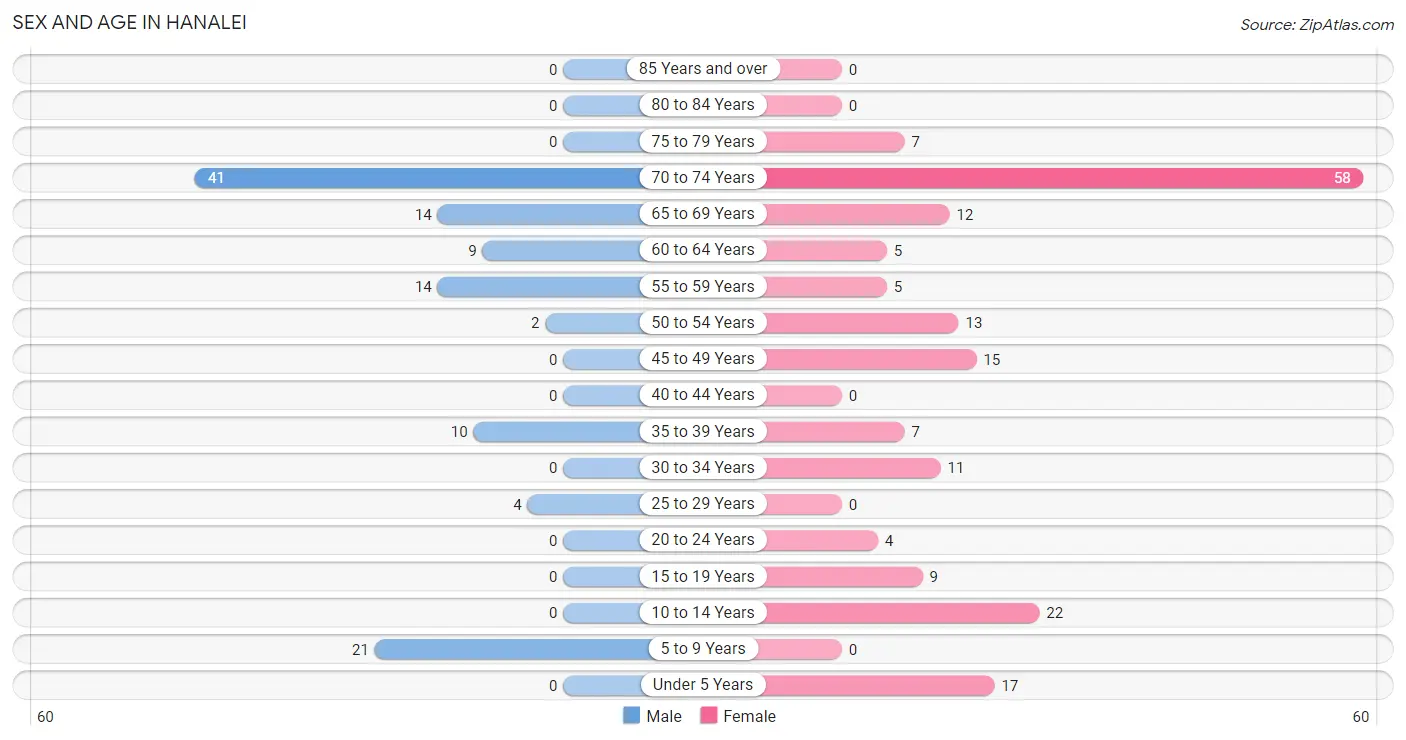
| Age Bracket | Male | Female |
| Under 5 Years | 0 (0.0%) | 17 (9.2%) |
| 5 to 9 Years | 21 (18.3%) | 0 (0.0%) |
| 10 to 14 Years | 0 (0.0%) | 22 (11.9%) |
| 15 to 19 Years | 0 (0.0%) | 9 (4.9%) |
| 20 to 24 Years | 0 (0.0%) | 4 (2.2%) |
| 25 to 29 Years | 4 (3.5%) | 0 (0.0%) |
| 30 to 34 Years | 0 (0.0%) | 11 (5.9%) |
| 35 to 39 Years | 10 (8.7%) | 7 (3.8%) |
| 40 to 44 Years | 0 (0.0%) | 0 (0.0%) |
| 45 to 49 Years | 0 (0.0%) | 15 (8.1%) |
| 50 to 54 Years | 2 (1.7%) | 13 (7.0%) |
| 55 to 59 Years | 14 (12.2%) | 5 (2.7%) |
| 60 to 64 Years | 9 (7.8%) | 5 (2.7%) |
| 65 to 69 Years | 14 (12.2%) | 12 (6.5%) |
| 70 to 74 Years | 41 (35.6%) | 58 (31.4%) |
| 75 to 79 Years | 0 (0.0%) | 7 (3.8%) |
| 80 to 84 Years | 0 (0.0%) | 0 (0.0%) |
| 85 Years and over | 0 (0.0%) | 0 (0.0%) |
| Total | 115 (100.0%) | 185 (100.0%) |
Families and Households in Hanalei
Median Family Size in Hanalei
The median family size in Hanalei is 2.60 persons per family, with single male/father families (17 | 17.0%) accounting for the largest median family size of 2.65 persons per family. On the other hand, single female/mother families (7 | 7.0%) represent the smallest median family size with 2.43 persons per family.
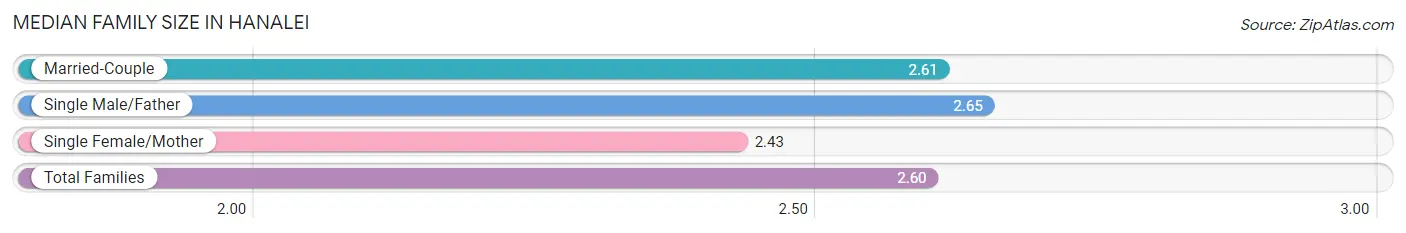
| Family Type | # Families | Family Size |
| Married-Couple | 76 (76.0%) | 2.61 |
| Single Male/Father | 17 (17.0%) | 2.65 |
| Single Female/Mother | 7 (7.0%) | 2.43 |
| Total Families | 100 (100.0%) | 2.60 |
Median Household Size in Hanalei
The median household size in Hanalei is 2.40 persons per household, with single male/father households (17 | 13.6%) accounting for the largest median household size of 2.88 persons per household. non-family households (25 | 20.0%) represent the smallest median household size with 1.44 persons per household.
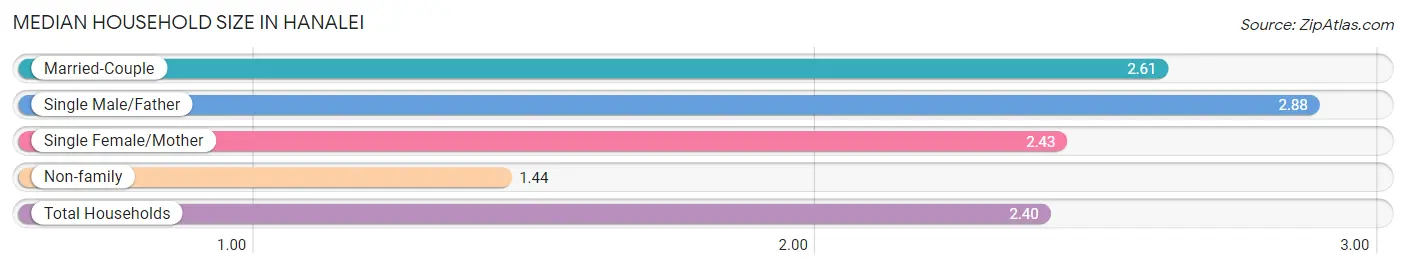
| Household Type | # Households | Household Size |
| Married-Couple | 76 (60.8%) | 2.61 |
| Single Male/Father | 17 (13.6%) | 2.88 |
| Single Female/Mother | 7 (5.6%) | 2.43 |
| Non-family | 25 (20.0%) | 1.44 |
| Total Households | 125 (100.0%) | 2.40 |
Household Size by Marriage Status in Hanalei
Out of a total of 125 households in Hanalei, 100 (80.0%) are family households, while 25 (20.0%) are nonfamily households. The most numerous type of family households are 2-person households, comprising 69, and the most common type of nonfamily households are 2-person households, comprising 17.
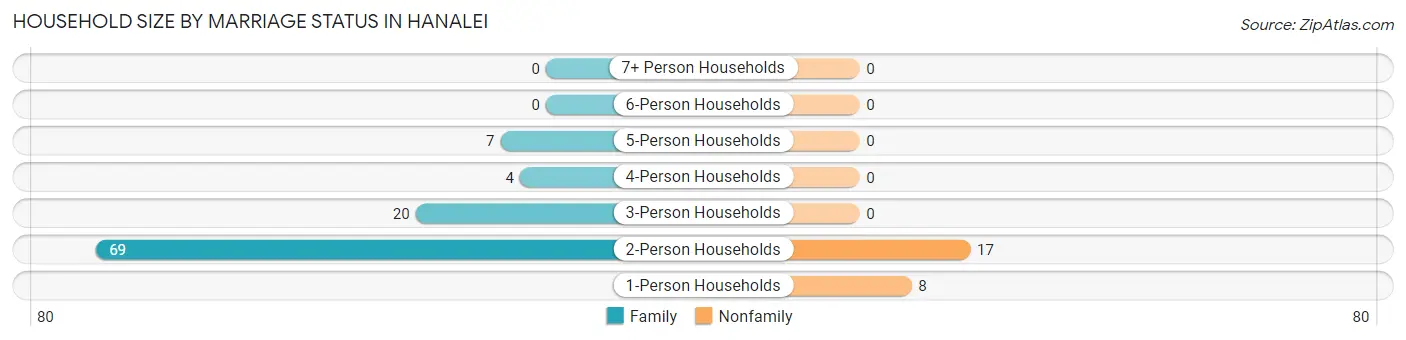
| Household Size | Family Households | Nonfamily Households |
| 1-Person Households | - | 8 (6.4%) |
| 2-Person Households | 69 (55.2%) | 17 (13.6%) |
| 3-Person Households | 20 (16.0%) | 0 (0.0%) |
| 4-Person Households | 4 (3.2%) | 0 (0.0%) |
| 5-Person Households | 7 (5.6%) | 0 (0.0%) |
| 6-Person Households | 0 (0.0%) | 0 (0.0%) |
| 7+ Person Households | 0 (0.0%) | 0 (0.0%) |
| Total | 100 (80.0%) | 25 (20.0%) |
Female Fertility in Hanalei
Fertility by Age in Hanalei
Average fertility rate in Hanalei is 87.0 births per 1,000 women. Women in the age bracket of 20 to 34 years have the highest fertility rate with 267.0 births per 1,000 women. Women in the age bracket of 20 to 34 years acount for 100.0% of all women with births.
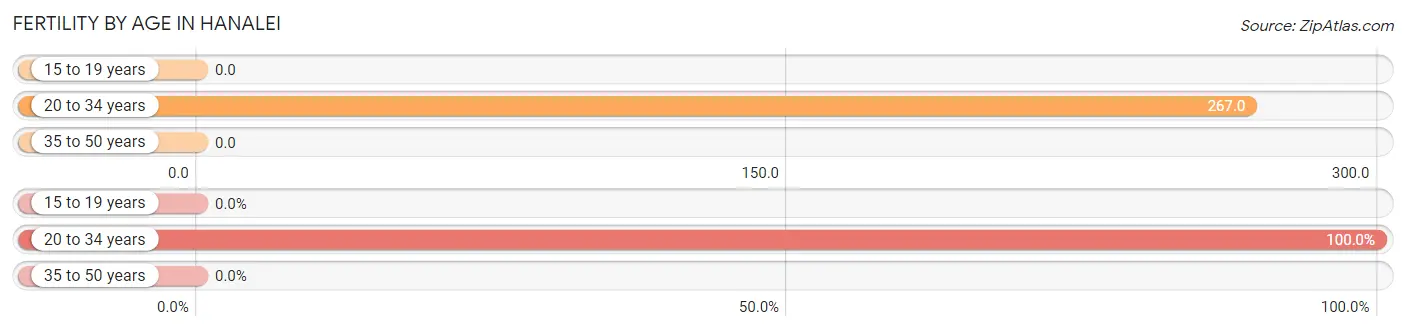
| Age Bracket | Women with Births | Births / 1,000 Women |
| 15 to 19 years | 0 (0.0%) | 0.0 |
| 20 to 34 years | 4 (100.0%) | 267.0 |
| 35 to 50 years | 0 (0.0%) | 0.0 |
| Total | 4 (100.0%) | 87.0 |
Fertility by Age by Marriage Status in Hanalei

| Age Bracket | Married | Unmarried |
| 15 to 19 years | 0 (0.0%) | 0 (0.0%) |
| 20 to 34 years | 0 (0.0%) | 4 (100.0%) |
| 35 to 50 years | 0 (0.0%) | 0 (0.0%) |
| Total | 0 (0.0%) | 4 (100.0%) |
Fertility by Education in Hanalei
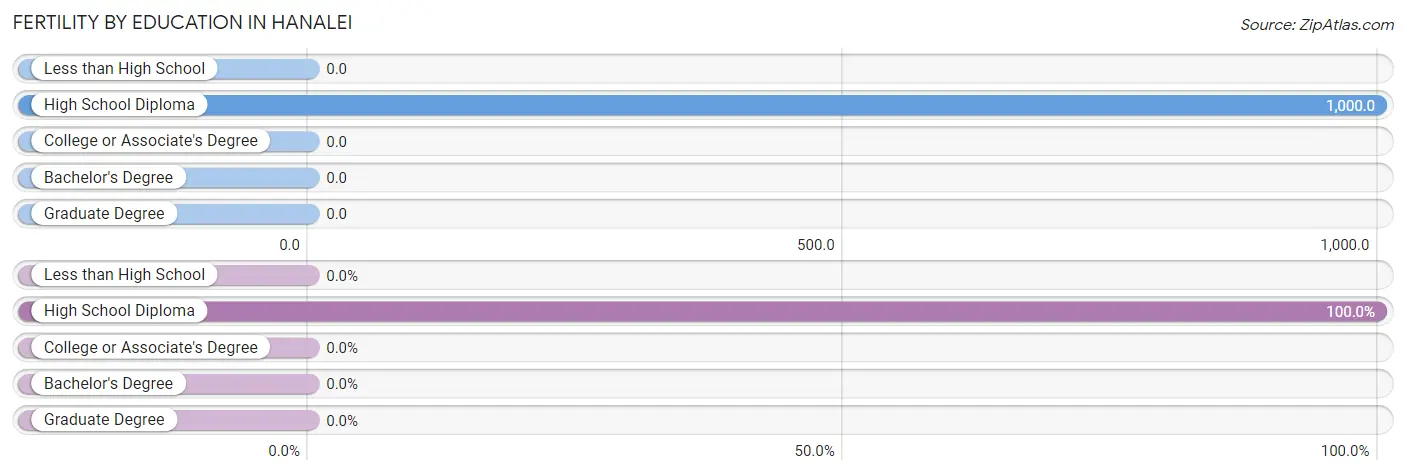
| Educational Attainment | Women with Births | Births / 1,000 Women |
| Less than High School | 0 (0.0%) | 0.0 |
| High School Diploma | 4 (100.0%) | 1,000.0 |
| College or Associate's Degree | 0 (0.0%) | 0.0 |
| Bachelor's Degree | 0 (0.0%) | 0.0 |
| Graduate Degree | 0 (0.0%) | 0.0 |
| Total | 4 (100.0%) | 87.0 |
Fertility by Education by Marriage Status in Hanalei
| Educational Attainment | Married | Unmarried |
| Less than High School | 0 (0.0%) | 0 (0.0%) |
| High School Diploma | 0 (0.0%) | 4 (100.0%) |
| College or Associate's Degree | 0 (0.0%) | 0 (0.0%) |
| Bachelor's Degree | 0 (0.0%) | 0 (0.0%) |
| Graduate Degree | 0 (0.0%) | 0 (0.0%) |
| Total | 0 (0.0%) | 4 (100.0%) |
Employment Characteristics in Hanalei
Employment by Class of Employer in Hanalei
Among the 83 employed individuals in Hanalei, self-employed (not incorporated) (25 | 30.1%), private company employees (23 | 27.7%), and self-employed (incorporated) (22 | 26.5%) make up the most common classes of employment.
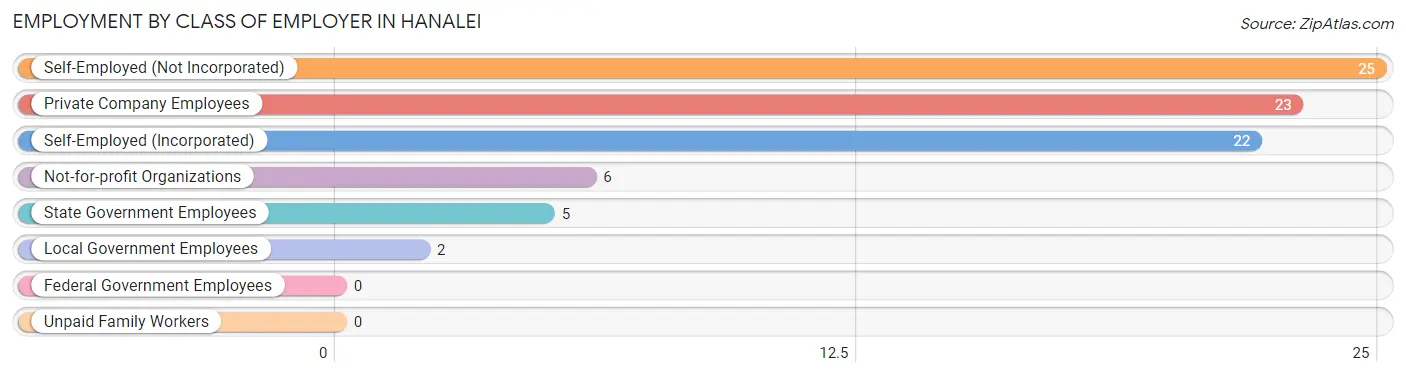
| Employer Class | # Employees | % Employees |
| Private Company Employees | 23 | 27.7% |
| Self-Employed (Incorporated) | 22 | 26.5% |
| Self-Employed (Not Incorporated) | 25 | 30.1% |
| Not-for-profit Organizations | 6 | 7.2% |
| Local Government Employees | 2 | 2.4% |
| State Government Employees | 5 | 6.0% |
| Federal Government Employees | 0 | 0.0% |
| Unpaid Family Workers | 0 | 0.0% |
| Total | 83 | 100.0% |
Employment Status by Age in Hanalei
According to the labor force statistics for Hanalei, out of the total population over 16 years of age (240), 42.1% or 101 individuals are in the labor force, with 17.8% or 18 of them unemployed. The age group with the highest labor force participation rate is 25 to 29 years, with 100.0% or 4 individuals in the labor force. Within the labor force, the 30 to 34 years age range has the highest percentage of unemployed individuals, with 100.0% or 11 of them being unemployed.
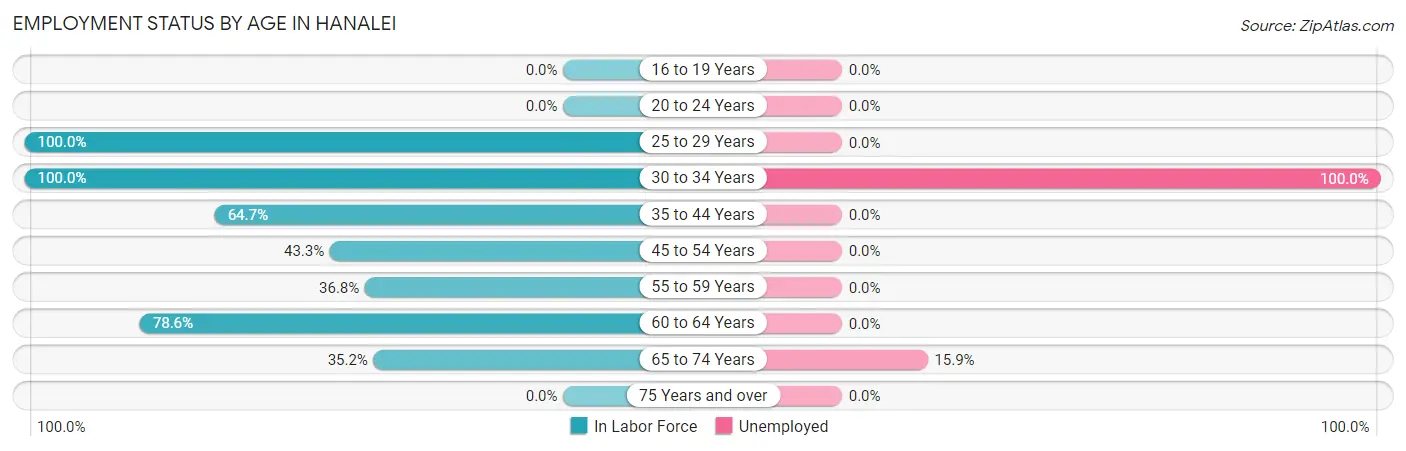
| Age Bracket | In Labor Force | Unemployed |
| 16 to 19 Years | 0 (0.0%) | 0 (0.0%) |
| 20 to 24 Years | 0 (0.0%) | 0 (0.0%) |
| 25 to 29 Years | 4 (100.0%) | 0 (0.0%) |
| 30 to 34 Years | 11 (100.0%) | 11 (100.0%) |
| 35 to 44 Years | 11 (64.7%) | 0 (0.0%) |
| 45 to 54 Years | 13 (43.3%) | 0 (0.0%) |
| 55 to 59 Years | 7 (36.8%) | 0 (0.0%) |
| 60 to 64 Years | 11 (78.6%) | 0 (0.0%) |
| 65 to 74 Years | 44 (35.2%) | 7 (15.9%) |
| 75 Years and over | 0 (0.0%) | 0 (0.0%) |
| Total | 101 (42.1%) | 18 (17.8%) |
Employment Status by Educational Attainment in Hanalei
According to labor force statistics for Hanalei, 60.0% of individuals (57) out of the total population between 25 and 64 years of age (95) are in the labor force, with 19.3% or 11 of them being unemployed. The group with the highest labor force participation rate are those with the educational attainment of bachelor's degree or higher, with 71.2% or 42 individuals in the labor force. Within the labor force, individuals with bachelor's degree or higher education have the highest percentage of unemployment, with 26.2% or 11 of them being unemployed.
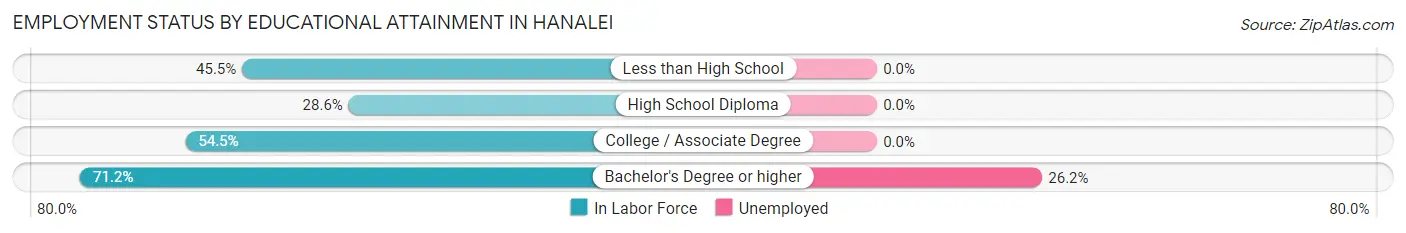
| Educational Attainment | In Labor Force | Unemployed |
| Less than High School | 5 (45.5%) | 0 (0.0%) |
| High School Diploma | 4 (28.6%) | 0 (0.0%) |
| College / Associate Degree | 6 (54.5%) | 0 (0.0%) |
| Bachelor's Degree or higher | 42 (71.2%) | 15 (26.2%) |
| Total | 57 (60.0%) | 18 (19.3%) |
Employment Occupations by Sex in Hanalei
Management, Business, Science and Arts Occupations
The most common Management, Business, Science and Arts occupations in Hanalei are Management (29 | 34.9%), Community & Social Service (26 | 31.3%), Arts, Media & Entertainment (13 | 15.7%), Education Instruction & Library (7 | 8.4%), and Education, Arts & Media (6 | 7.2%).
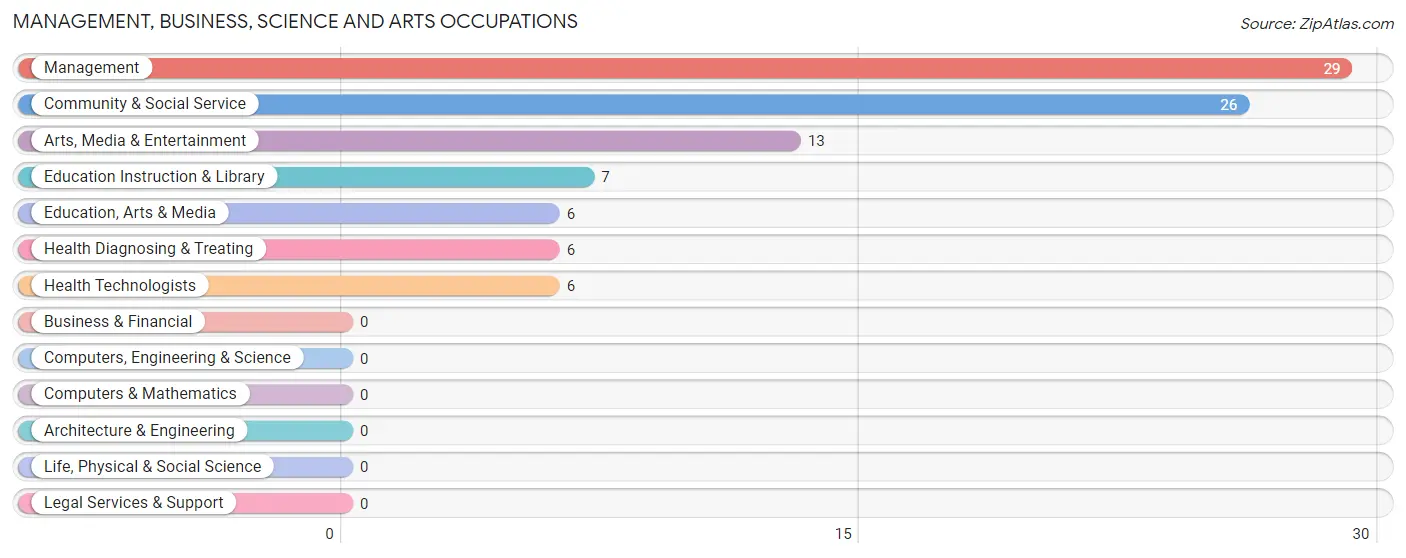
Management, Business, Science and Arts Occupations by Sex
Within the Management, Business, Science and Arts occupations in Hanalei, the most male-oriented occupations are Health Diagnosing & Treating (100.0%), Health Technologists (100.0%), and Management (79.3%), while the most female-oriented occupations are Education, Arts & Media (100.0%), Education Instruction & Library (71.4%), and Community & Social Service (65.4%).

| Occupation | Male | Female |
| Management | 23 (79.3%) | 6 (20.7%) |
| Business & Financial | 0 (0.0%) | 0 (0.0%) |
| Computers, Engineering & Science | 0 (0.0%) | 0 (0.0%) |
| Computers & Mathematics | 0 (0.0%) | 0 (0.0%) |
| Architecture & Engineering | 0 (0.0%) | 0 (0.0%) |
| Life, Physical & Social Science | 0 (0.0%) | 0 (0.0%) |
| Community & Social Service | 9 (34.6%) | 17 (65.4%) |
| Education, Arts & Media | 0 (0.0%) | 6 (100.0%) |
| Legal Services & Support | 0 (0.0%) | 0 (0.0%) |
| Education Instruction & Library | 2 (28.6%) | 5 (71.4%) |
| Arts, Media & Entertainment | 7 (53.8%) | 6 (46.2%) |
| Health Diagnosing & Treating | 6 (100.0%) | 0 (0.0%) |
| Health Technologists | 6 (100.0%) | 0 (0.0%) |
| Total (Category) | 38 (62.3%) | 23 (37.7%) |
| Total (Overall) | 48 (57.8%) | 35 (42.2%) |
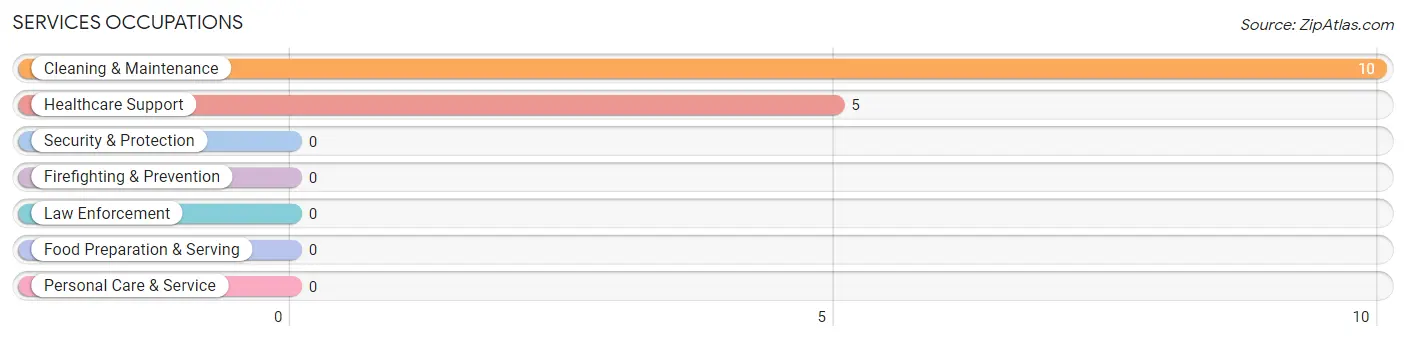
Services Occupations
The most common Services occupations in Hanalei are Cleaning & Maintenance (10 | 12.0%), and Healthcare Support (5 | 6.0%).
Services Occupations by Sex
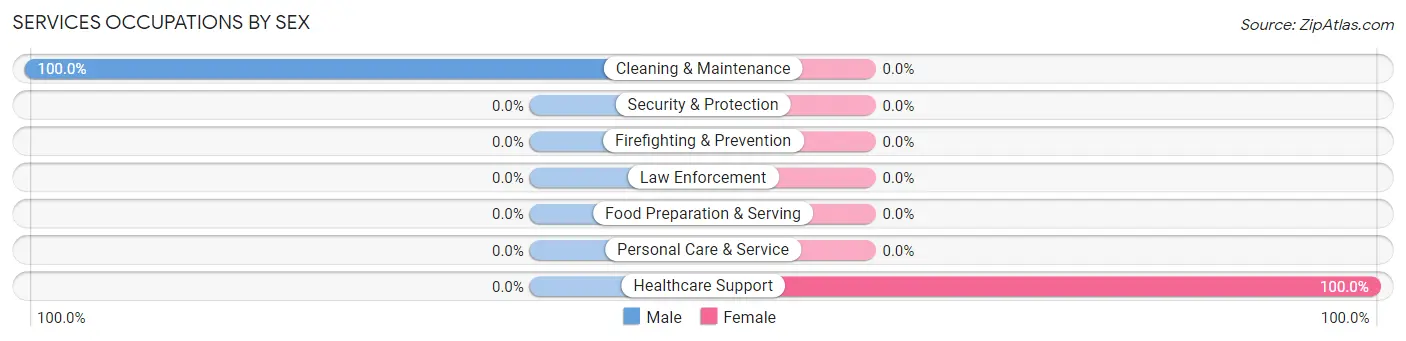
| Occupation | Male | Female |
| Healthcare Support | 0 (0.0%) | 5 (100.0%) |
| Security & Protection | 0 (0.0%) | 0 (0.0%) |
| Firefighting & Prevention | 0 (0.0%) | 0 (0.0%) |
| Law Enforcement | 0 (0.0%) | 0 (0.0%) |
| Food Preparation & Serving | 0 (0.0%) | 0 (0.0%) |
| Cleaning & Maintenance | 10 (100.0%) | 0 (0.0%) |
| Personal Care & Service | 0 (0.0%) | 0 (0.0%) |
| Total (Category) | 10 (66.7%) | 5 (33.3%) |
| Total (Overall) | 48 (57.8%) | 35 (42.2%) |
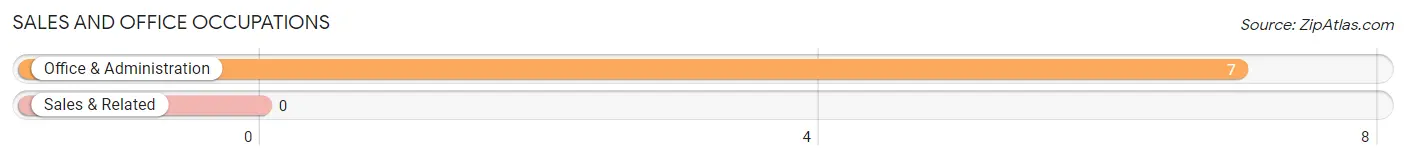
Sales and Office Occupations
The most common Sales and Office occupations in Hanalei are , and Office & Administration (7 | 8.4%).
Sales and Office Occupations by Sex
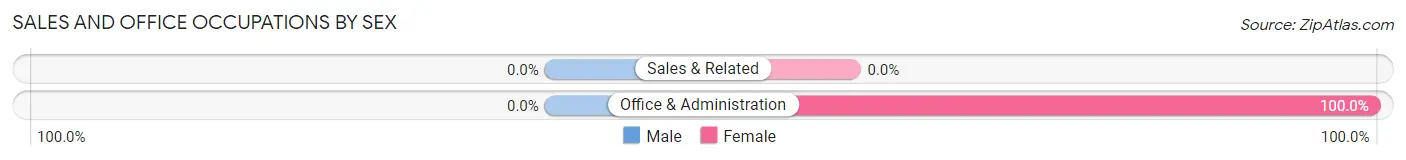
| Occupation | Male | Female |
| Sales & Related | 0 (0.0%) | 0 (0.0%) |
| Office & Administration | 0 (0.0%) | 7 (100.0%) |
| Total (Category) | 0 (0.0%) | 7 (100.0%) |
| Total (Overall) | 48 (57.8%) | 35 (42.2%) |
Natural Resources, Construction and Maintenance Occupations
Natural Resources, Construction and Maintenance Occupations by Sex
| Occupation | Male | Female |
| Farming, Fishing & Forestry | 0 (0.0%) | 0 (0.0%) |
| Construction & Extraction | 0 (0.0%) | 0 (0.0%) |
| Installation, Maintenance & Repair | 0 (0.0%) | 0 (0.0%) |
| Total (Category) | 0 (0.0%) | 0 (0.0%) |
| Total (Overall) | 48 (57.8%) | 35 (42.2%) |
Production, Transportation and Moving Occupations
Production, Transportation and Moving Occupations by Sex
| Occupation | Male | Female |
| Production | 0 (0.0%) | 0 (0.0%) |
| Transportation | 0 (0.0%) | 0 (0.0%) |
| Material Moving | 0 (0.0%) | 0 (0.0%) |
| Total (Category) | 0 (0.0%) | 0 (0.0%) |
| Total (Overall) | 48 (57.8%) | 35 (42.2%) |
Employment Industries by Sex in Hanalei
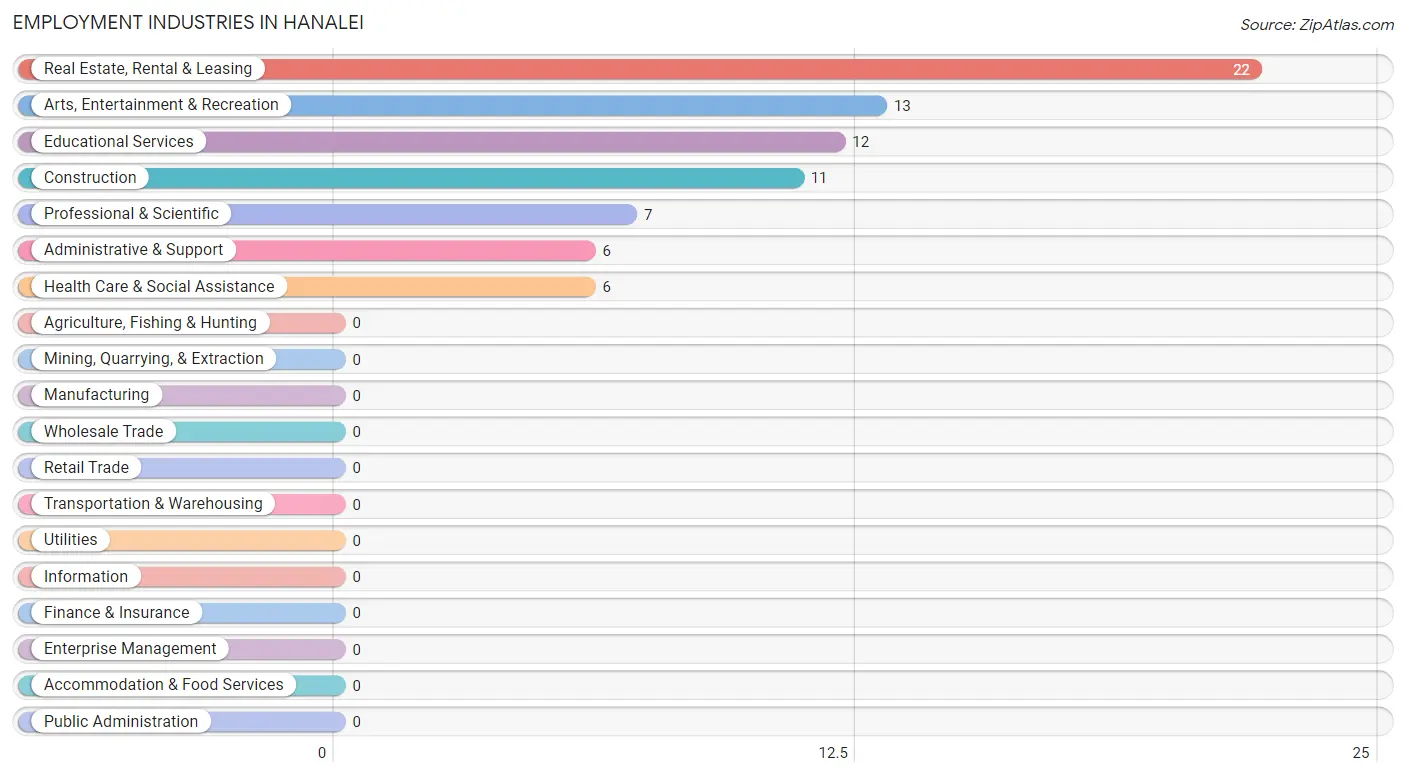
Employment Industries in Hanalei
The major employment industries in Hanalei include Real Estate, Rental & Leasing (22 | 26.5%), Arts, Entertainment & Recreation (13 | 15.7%), Educational Services (12 | 14.5%), Construction (11 | 13.3%), and Professional & Scientific (7 | 8.4%).
Employment Industries by Sex in Hanalei
The Hanalei industries that see more men than women are Professional & Scientific (100.0%), Administrative & Support (100.0%), and Health Care & Social Assistance (100.0%), whereas the industries that tend to have a higher number of women are Educational Services (83.3%), Construction (63.6%), and Arts, Entertainment & Recreation (46.2%).
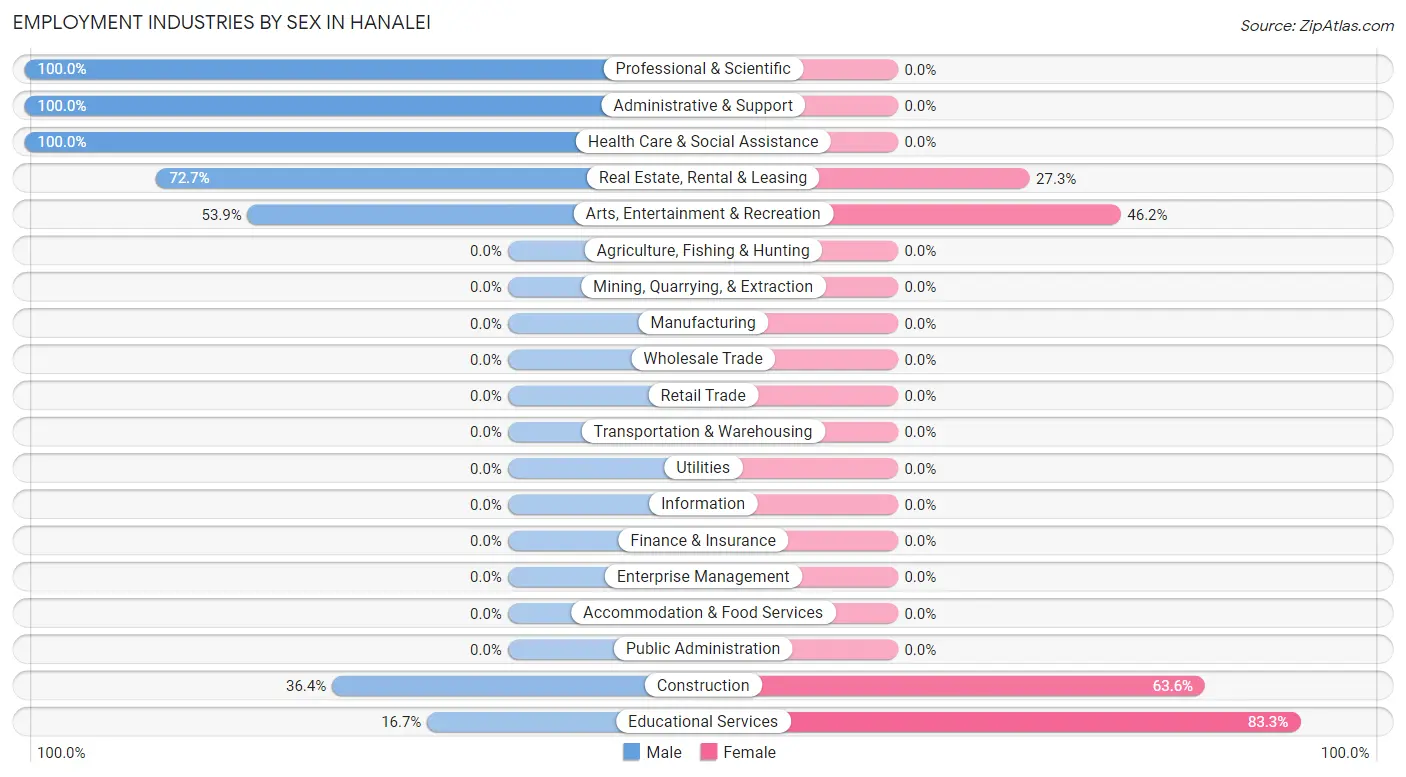
| Industry | Male | Female |
| Agriculture, Fishing & Hunting | 0 (0.0%) | 0 (0.0%) |
| Mining, Quarrying, & Extraction | 0 (0.0%) | 0 (0.0%) |
| Construction | 4 (36.4%) | 7 (63.6%) |
| Manufacturing | 0 (0.0%) | 0 (0.0%) |
| Wholesale Trade | 0 (0.0%) | 0 (0.0%) |
| Retail Trade | 0 (0.0%) | 0 (0.0%) |
| Transportation & Warehousing | 0 (0.0%) | 0 (0.0%) |
| Utilities | 0 (0.0%) | 0 (0.0%) |
| Information | 0 (0.0%) | 0 (0.0%) |
| Finance & Insurance | 0 (0.0%) | 0 (0.0%) |
| Real Estate, Rental & Leasing | 16 (72.7%) | 6 (27.3%) |
| Professional & Scientific | 7 (100.0%) | 0 (0.0%) |
| Enterprise Management | 0 (0.0%) | 0 (0.0%) |
| Administrative & Support | 6 (100.0%) | 0 (0.0%) |
| Educational Services | 2 (16.7%) | 10 (83.3%) |
| Health Care & Social Assistance | 6 (100.0%) | 0 (0.0%) |
| Arts, Entertainment & Recreation | 7 (53.8%) | 6 (46.2%) |
| Accommodation & Food Services | 0 (0.0%) | 0 (0.0%) |
| Public Administration | 0 (0.0%) | 0 (0.0%) |
| Total | 48 (57.8%) | 35 (42.2%) |
Education in Hanalei
School Enrollment in Hanalei
The most common levels of schooling among the 28 students in Hanalei are middle school (11 | 39.3%), high school (9 | 32.1%), and elementary school (8 | 28.6%).
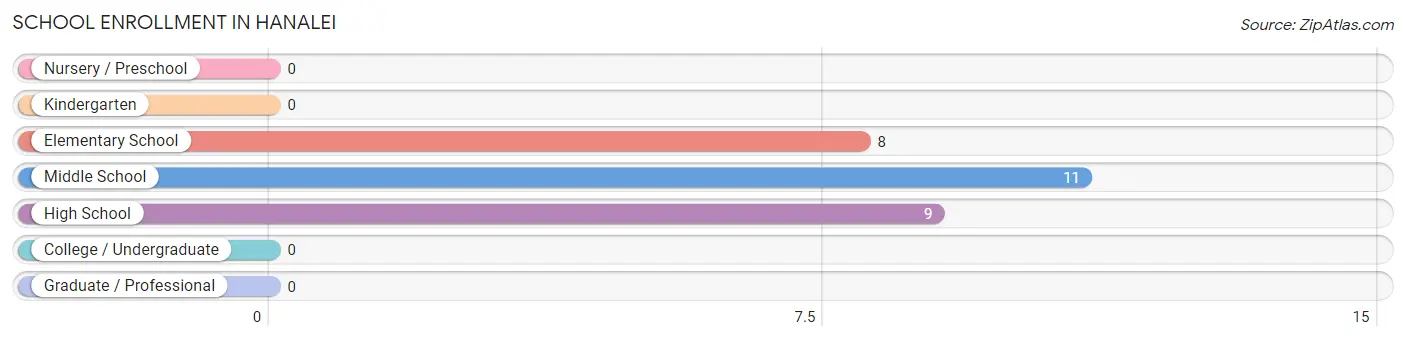
| School Level | # Students | % Students |
| Nursery / Preschool | 0 | 0.0% |
| Kindergarten | 0 | 0.0% |
| Elementary School | 8 | 28.6% |
| Middle School | 11 | 39.3% |
| High School | 9 | 32.1% |
| College / Undergraduate | 0 | 0.0% |
| Graduate / Professional | 0 | 0.0% |
| Total | 28 | 100.0% |
School Enrollment by Age by Funding Source in Hanalei
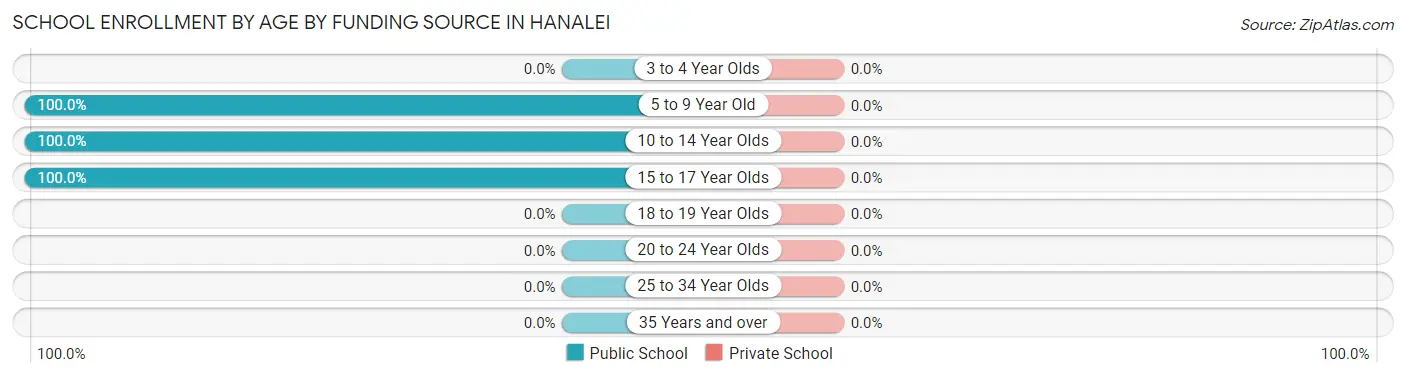
| Age Bracket | Public School | Private School |
| 3 to 4 Year Olds | 0 (0.0%) | 0 (0.0%) |
| 5 to 9 Year Old | 8 (100.0%) | 0 (0.0%) |
| 10 to 14 Year Olds | 11 (100.0%) | 0 (0.0%) |
| 15 to 17 Year Olds | 9 (100.0%) | 0 (0.0%) |
| 18 to 19 Year Olds | 0 (0.0%) | 0 (0.0%) |
| 20 to 24 Year Olds | 0 (0.0%) | 0 (0.0%) |
| 25 to 34 Year Olds | 0 (0.0%) | 0 (0.0%) |
| 35 Years and over | 0 (0.0%) | 0 (0.0%) |
| Total | 28 (100.0%) | 0 (0.0%) |
Educational Attainment by Field of Study in Hanalei
Social sciences (44 | 27.0%), bio, nature & agricultural (32 | 19.6%), literature & languages (19 | 11.7%), psychology (17 | 10.4%), and business (13 | 8.0%) are the most common fields of study among 163 individuals in Hanalei who have obtained a bachelor's degree or higher.
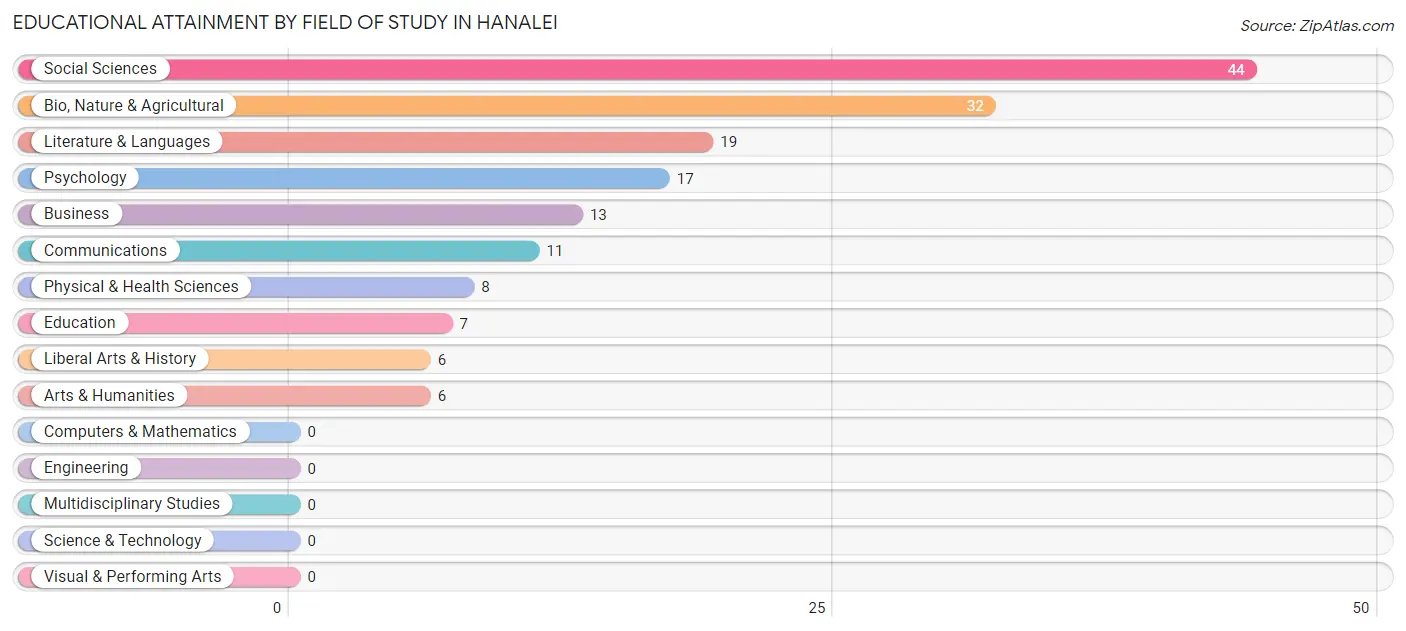
| Field of Study | # Graduates | % Graduates |
| Computers & Mathematics | 0 | 0.0% |
| Bio, Nature & Agricultural | 32 | 19.6% |
| Physical & Health Sciences | 8 | 4.9% |
| Psychology | 17 | 10.4% |
| Social Sciences | 44 | 27.0% |
| Engineering | 0 | 0.0% |
| Multidisciplinary Studies | 0 | 0.0% |
| Science & Technology | 0 | 0.0% |
| Business | 13 | 8.0% |
| Education | 7 | 4.3% |
| Literature & Languages | 19 | 11.7% |
| Liberal Arts & History | 6 | 3.7% |
| Visual & Performing Arts | 0 | 0.0% |
| Communications | 11 | 6.8% |
| Arts & Humanities | 6 | 3.7% |
| Total | 163 | 100.0% |
Transportation & Commute in Hanalei
Vehicle Availability by Sex in Hanalei
The most prevalent vehicle ownership categories in Hanalei are males with 1 vehicle (18, accounting for 37.5%) and females with 1 vehicle (6, making up 51.4%).
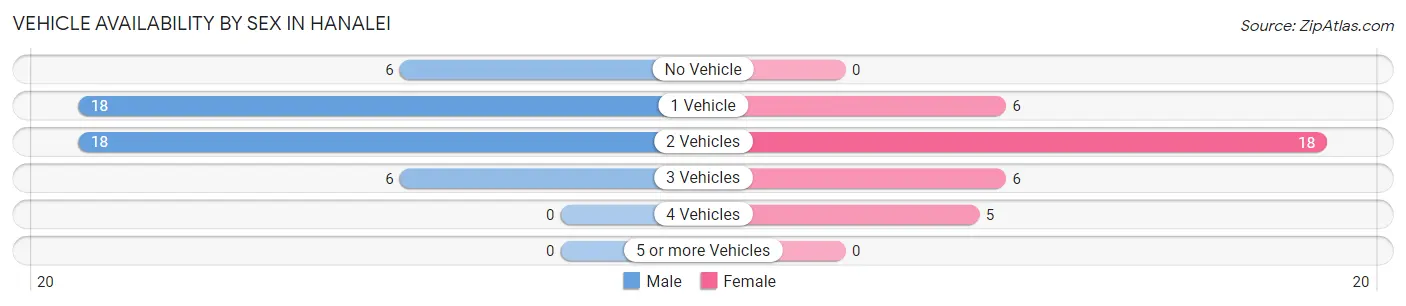
| Vehicles Available | Male | Female |
| No Vehicle | 6 (12.5%) | 0 (0.0%) |
| 1 Vehicle | 18 (37.5%) | 6 (17.1%) |
| 2 Vehicles | 18 (37.5%) | 18 (51.4%) |
| 3 Vehicles | 6 (12.5%) | 6 (17.1%) |
| 4 Vehicles | 0 (0.0%) | 5 (14.3%) |
| 5 or more Vehicles | 0 (0.0%) | 0 (0.0%) |
| Total | 48 (100.0%) | 35 (100.0%) |
Commute Time in Hanalei
The most frequently occuring commute durations in Hanalei are less than 5 minutes (17 commuters, 41.5%), 30 to 34 minutes (7 commuters, 17.1%), and 40 to 44 minutes (6 commuters, 14.6%).
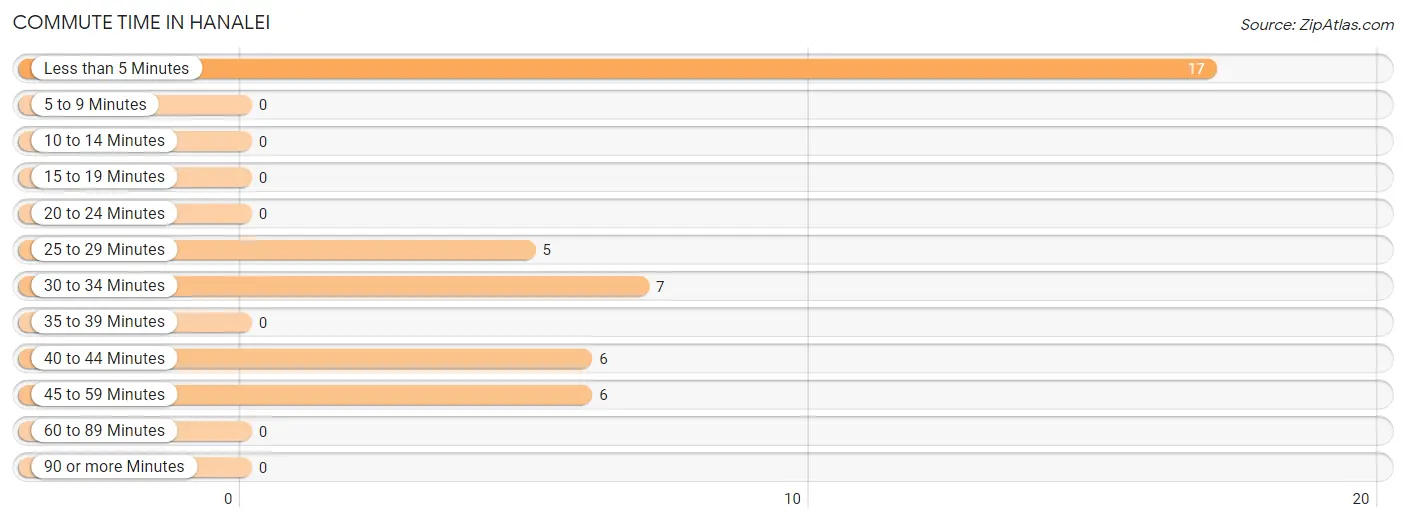
| Commute Time | # Commuters | % Commuters |
| Less than 5 Minutes | 17 | 41.5% |
| 5 to 9 Minutes | 0 | 0.0% |
| 10 to 14 Minutes | 0 | 0.0% |
| 15 to 19 Minutes | 0 | 0.0% |
| 20 to 24 Minutes | 0 | 0.0% |
| 25 to 29 Minutes | 5 | 12.2% |
| 30 to 34 Minutes | 7 | 17.1% |
| 35 to 39 Minutes | 0 | 0.0% |
| 40 to 44 Minutes | 6 | 14.6% |
| 45 to 59 Minutes | 6 | 14.6% |
| 60 to 89 Minutes | 0 | 0.0% |
| 90 or more Minutes | 0 | 0.0% |
Commute Time by Sex in Hanalei
The most common commute times in Hanalei are less than 5 minutes (12 commuters, 48.0%) for males and 40 to 44 minutes (6 commuters, 37.5%) for females.
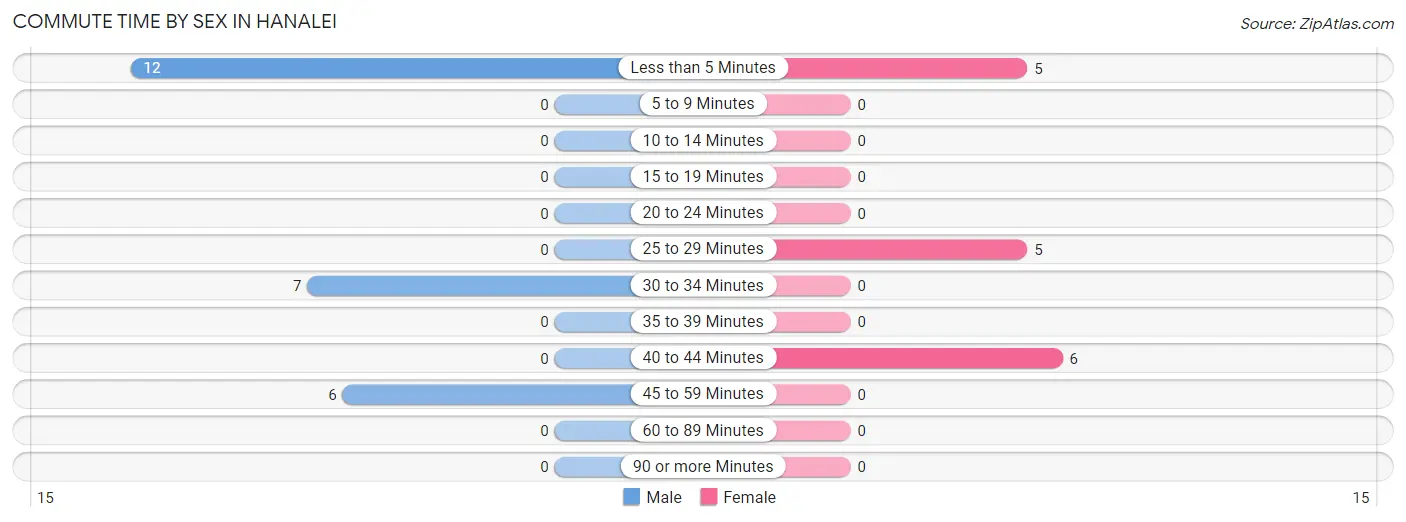
| Commute Time | Male | Female |
| Less than 5 Minutes | 12 (48.0%) | 5 (31.2%) |
| 5 to 9 Minutes | 0 (0.0%) | 0 (0.0%) |
| 10 to 14 Minutes | 0 (0.0%) | 0 (0.0%) |
| 15 to 19 Minutes | 0 (0.0%) | 0 (0.0%) |
| 20 to 24 Minutes | 0 (0.0%) | 0 (0.0%) |
| 25 to 29 Minutes | 0 (0.0%) | 5 (31.2%) |
| 30 to 34 Minutes | 7 (28.0%) | 0 (0.0%) |
| 35 to 39 Minutes | 0 (0.0%) | 0 (0.0%) |
| 40 to 44 Minutes | 0 (0.0%) | 6 (37.5%) |
| 45 to 59 Minutes | 6 (24.0%) | 0 (0.0%) |
| 60 to 89 Minutes | 0 (0.0%) | 0 (0.0%) |
| 90 or more Minutes | 0 (0.0%) | 0 (0.0%) |
Time of Departure to Work by Sex in Hanalei
The most frequent times of departure to work in Hanalei are 12:00 AM to 4:59 AM (12, 48.0%) for males and 7:30 AM to 7:59 AM (6, 37.5%) for females.
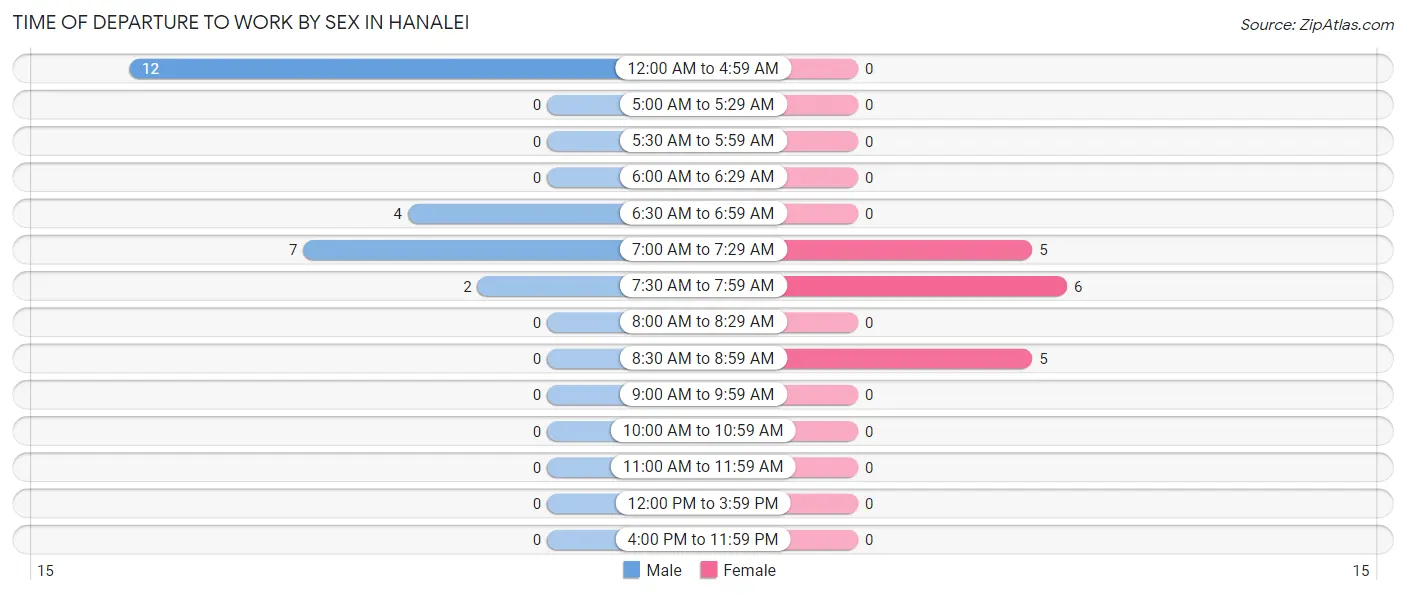
| Time of Departure | Male | Female |
| 12:00 AM to 4:59 AM | 12 (48.0%) | 0 (0.0%) |
| 5:00 AM to 5:29 AM | 0 (0.0%) | 0 (0.0%) |
| 5:30 AM to 5:59 AM | 0 (0.0%) | 0 (0.0%) |
| 6:00 AM to 6:29 AM | 0 (0.0%) | 0 (0.0%) |
| 6:30 AM to 6:59 AM | 4 (16.0%) | 0 (0.0%) |
| 7:00 AM to 7:29 AM | 7 (28.0%) | 5 (31.2%) |
| 7:30 AM to 7:59 AM | 2 (8.0%) | 6 (37.5%) |
| 8:00 AM to 8:29 AM | 0 (0.0%) | 0 (0.0%) |
| 8:30 AM to 8:59 AM | 0 (0.0%) | 5 (31.2%) |
| 9:00 AM to 9:59 AM | 0 (0.0%) | 0 (0.0%) |
| 10:00 AM to 10:59 AM | 0 (0.0%) | 0 (0.0%) |
| 11:00 AM to 11:59 AM | 0 (0.0%) | 0 (0.0%) |
| 12:00 PM to 3:59 PM | 0 (0.0%) | 0 (0.0%) |
| 4:00 PM to 11:59 PM | 0 (0.0%) | 0 (0.0%) |
| Total | 25 (100.0%) | 16 (100.0%) |
Housing Occupancy in Hanalei
Occupancy by Ownership in Hanalei
Of the total 125 dwellings in Hanalei, owner-occupied units account for 75 (60.0%), while renter-occupied units make up 50 (40.0%).
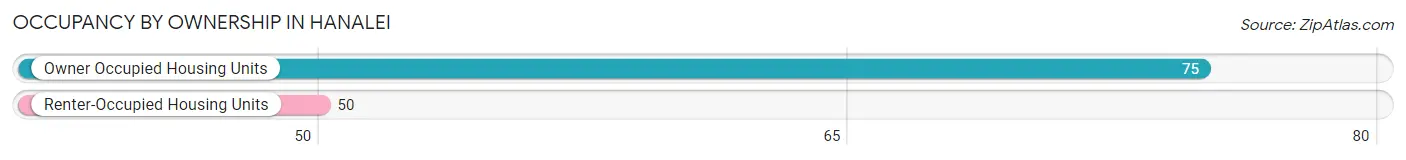
| Occupancy | # Housing Units | % Housing Units |
| Owner Occupied Housing Units | 75 | 60.0% |
| Renter-Occupied Housing Units | 50 | 40.0% |
| Total Occupied Housing Units | 125 | 100.0% |
Occupancy by Household Size in Hanalei
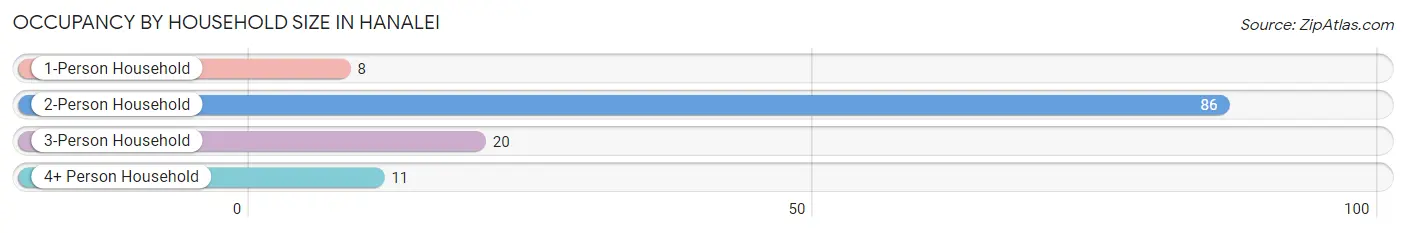
| Household Size | # Housing Units | % Housing Units |
| 1-Person Household | 8 | 6.4% |
| 2-Person Household | 86 | 68.8% |
| 3-Person Household | 20 | 16.0% |
| 4+ Person Household | 11 | 8.8% |
| Total Housing Units | 125 | 100.0% |
Occupancy by Ownership by Household Size in Hanalei
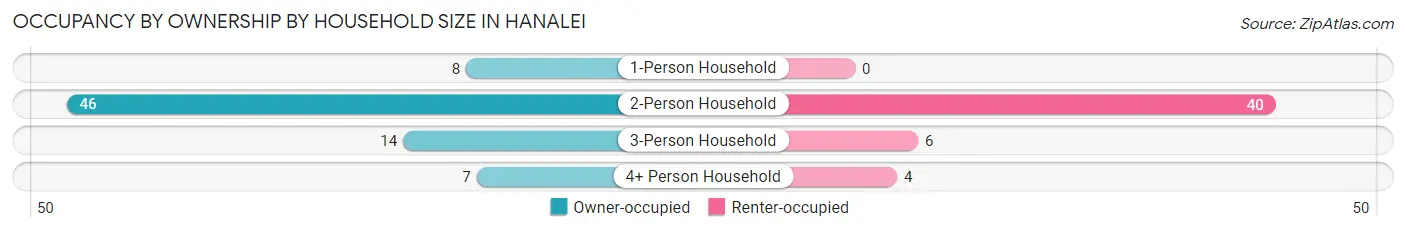
| Household Size | Owner-occupied | Renter-occupied |
| 1-Person Household | 8 (100.0%) | 0 (0.0%) |
| 2-Person Household | 46 (53.5%) | 40 (46.5%) |
| 3-Person Household | 14 (70.0%) | 6 (30.0%) |
| 4+ Person Household | 7 (63.6%) | 4 (36.4%) |
| Total Housing Units | 75 (60.0%) | 50 (40.0%) |
Occupancy by Educational Attainment in Hanalei
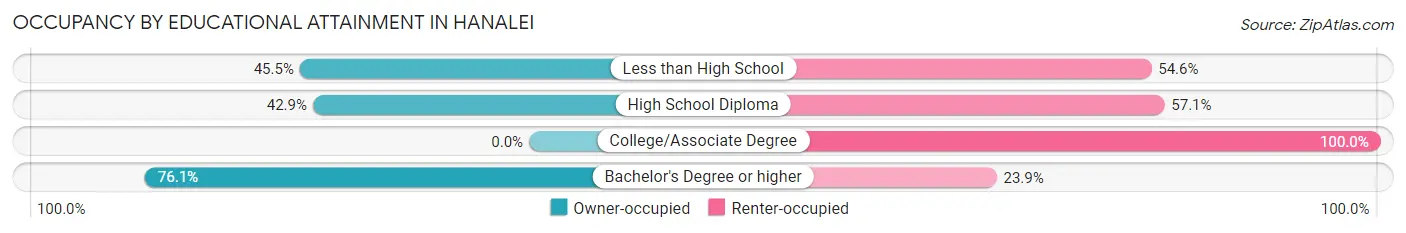
| Household Size | Owner-occupied | Renter-occupied |
| Less than High School | 5 (45.5%) | 6 (54.5%) |
| High School Diploma | 3 (42.9%) | 4 (57.1%) |
| College/Associate Degree | 0 (0.0%) | 19 (100.0%) |
| Bachelor's Degree or higher | 67 (76.1%) | 21 (23.9%) |
Occupancy by Age of Householder in Hanalei
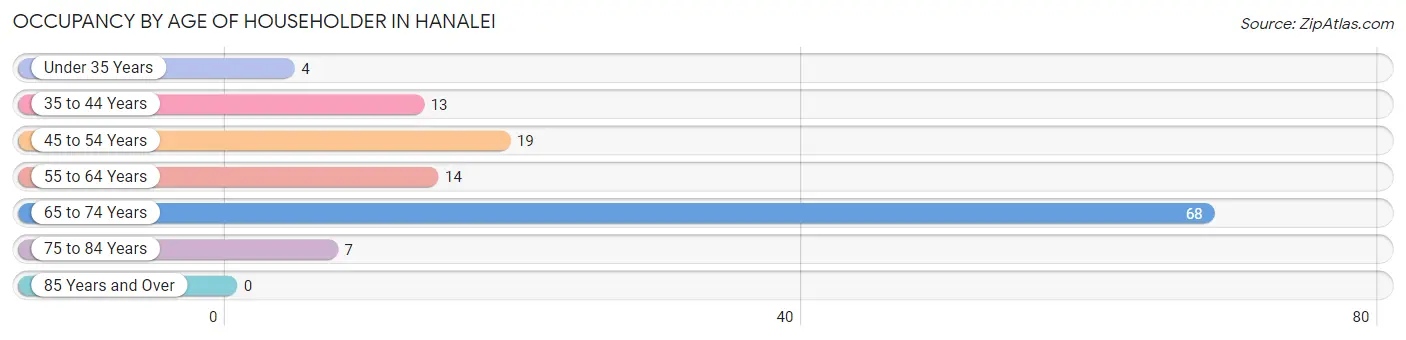
| Age Bracket | # Households | % Households |
| Under 35 Years | 4 | 3.2% |
| 35 to 44 Years | 13 | 10.4% |
| 45 to 54 Years | 19 | 15.2% |
| 55 to 64 Years | 14 | 11.2% |
| 65 to 74 Years | 68 | 54.4% |
| 75 to 84 Years | 7 | 5.6% |
| 85 Years and Over | 0 | 0.0% |
| Total | 125 | 100.0% |
Housing Finances in Hanalei
Median Income by Occupancy in Hanalei
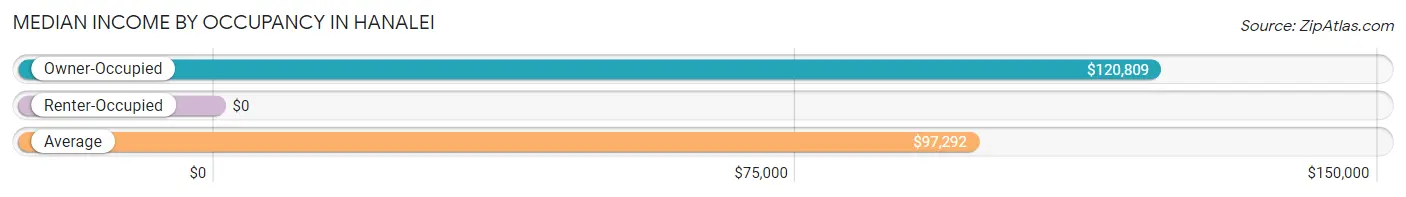
| Occupancy Type | # Households | Median Income |
| Owner-Occupied | 75 (60.0%) | $120,809 |
| Renter-Occupied | 50 (40.0%) | $0 |
| Average | 125 (100.0%) | $97,292 |
Occupancy by Householder Income Bracket in Hanalei
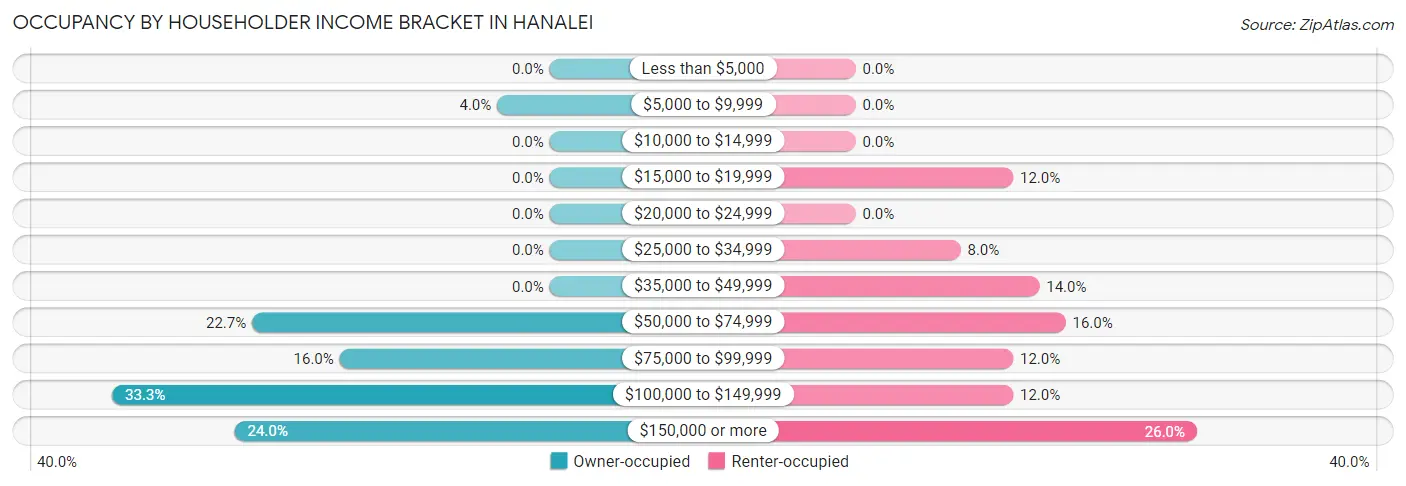
| Income Bracket | Owner-occupied | Renter-occupied |
| Less than $5,000 | 0 (0.0%) | 0 (0.0%) |
| $5,000 to $9,999 | 3 (4.0%) | 0 (0.0%) |
| $10,000 to $14,999 | 0 (0.0%) | 0 (0.0%) |
| $15,000 to $19,999 | 0 (0.0%) | 6 (12.0%) |
| $20,000 to $24,999 | 0 (0.0%) | 0 (0.0%) |
| $25,000 to $34,999 | 0 (0.0%) | 4 (8.0%) |
| $35,000 to $49,999 | 0 (0.0%) | 7 (14.0%) |
| $50,000 to $74,999 | 17 (22.7%) | 8 (16.0%) |
| $75,000 to $99,999 | 12 (16.0%) | 6 (12.0%) |
| $100,000 to $149,999 | 25 (33.3%) | 6 (12.0%) |
| $150,000 or more | 18 (24.0%) | 13 (26.0%) |
| Total | 75 (100.0%) | 50 (100.0%) |
Monthly Housing Cost Tiers in Hanalei
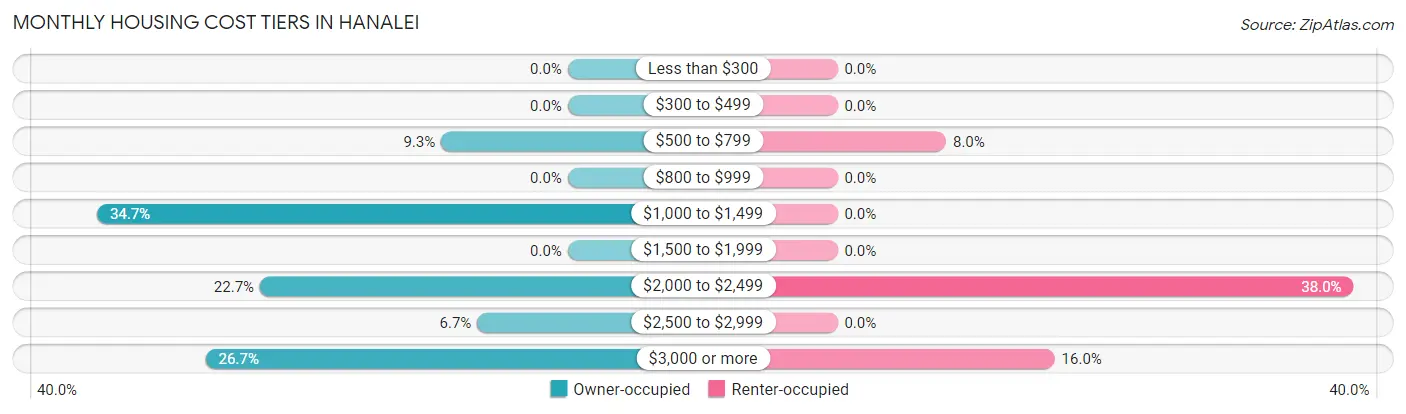
| Monthly Cost | Owner-occupied | Renter-occupied |
| Less than $300 | 0 (0.0%) | 0 (0.0%) |
| $300 to $499 | 0 (0.0%) | 0 (0.0%) |
| $500 to $799 | 7 (9.3%) | 4 (8.0%) |
| $800 to $999 | 0 (0.0%) | 0 (0.0%) |
| $1,000 to $1,499 | 26 (34.7%) | 0 (0.0%) |
| $1,500 to $1,999 | 0 (0.0%) | 0 (0.0%) |
| $2,000 to $2,499 | 17 (22.7%) | 19 (38.0%) |
| $2,500 to $2,999 | 5 (6.7%) | 0 (0.0%) |
| $3,000 or more | 20 (26.7%) | 8 (16.0%) |
| Total | 75 (100.0%) | 50 (100.0%) |
Physical Housing Characteristics in Hanalei
Housing Structures in Hanalei
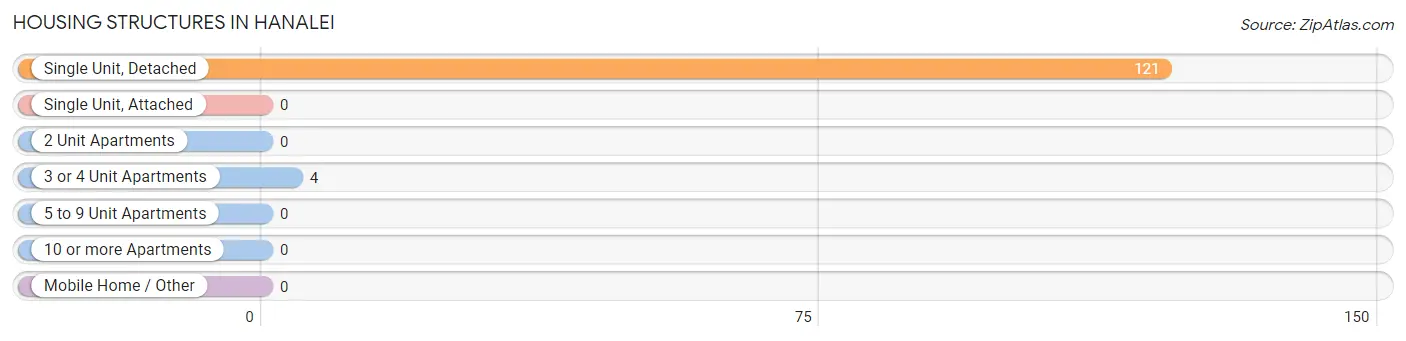
| Structure Type | # Housing Units | % Housing Units |
| Single Unit, Detached | 121 | 96.8% |
| Single Unit, Attached | 0 | 0.0% |
| 2 Unit Apartments | 0 | 0.0% |
| 3 or 4 Unit Apartments | 4 | 3.2% |
| 5 to 9 Unit Apartments | 0 | 0.0% |
| 10 or more Apartments | 0 | 0.0% |
| Mobile Home / Other | 0 | 0.0% |
| Total | 125 | 100.0% |
Housing Structures by Occupancy in Hanalei
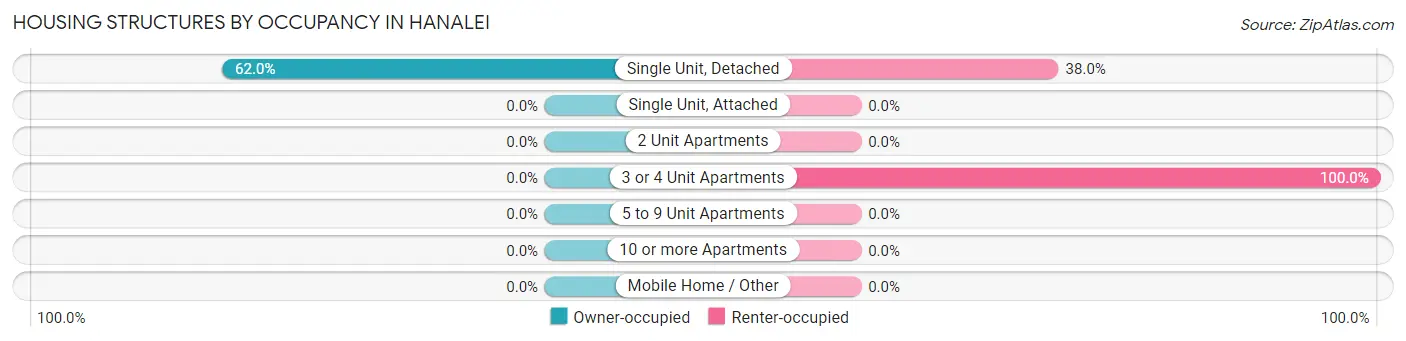
| Structure Type | Owner-occupied | Renter-occupied |
| Single Unit, Detached | 75 (62.0%) | 46 (38.0%) |
| Single Unit, Attached | 0 (0.0%) | 0 (0.0%) |
| 2 Unit Apartments | 0 (0.0%) | 0 (0.0%) |
| 3 or 4 Unit Apartments | 0 (0.0%) | 4 (100.0%) |
| 5 to 9 Unit Apartments | 0 (0.0%) | 0 (0.0%) |
| 10 or more Apartments | 0 (0.0%) | 0 (0.0%) |
| Mobile Home / Other | 0 (0.0%) | 0 (0.0%) |
| Total | 75 (60.0%) | 50 (40.0%) |
Housing Structures by Number of Rooms in Hanalei
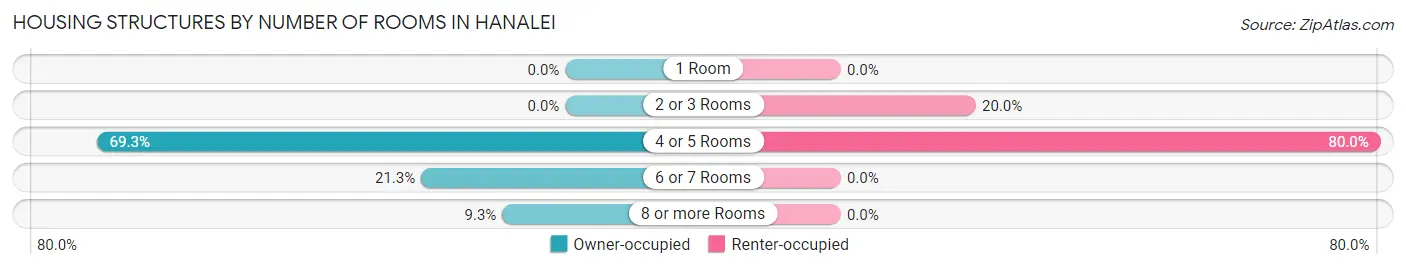
| Number of Rooms | Owner-occupied | Renter-occupied |
| 1 Room | 0 (0.0%) | 0 (0.0%) |
| 2 or 3 Rooms | 0 (0.0%) | 10 (20.0%) |
| 4 or 5 Rooms | 52 (69.3%) | 40 (80.0%) |
| 6 or 7 Rooms | 16 (21.3%) | 0 (0.0%) |
| 8 or more Rooms | 7 (9.3%) | 0 (0.0%) |
| Total | 75 (100.0%) | 50 (100.0%) |
Housing Structure by Heating Type in Hanalei
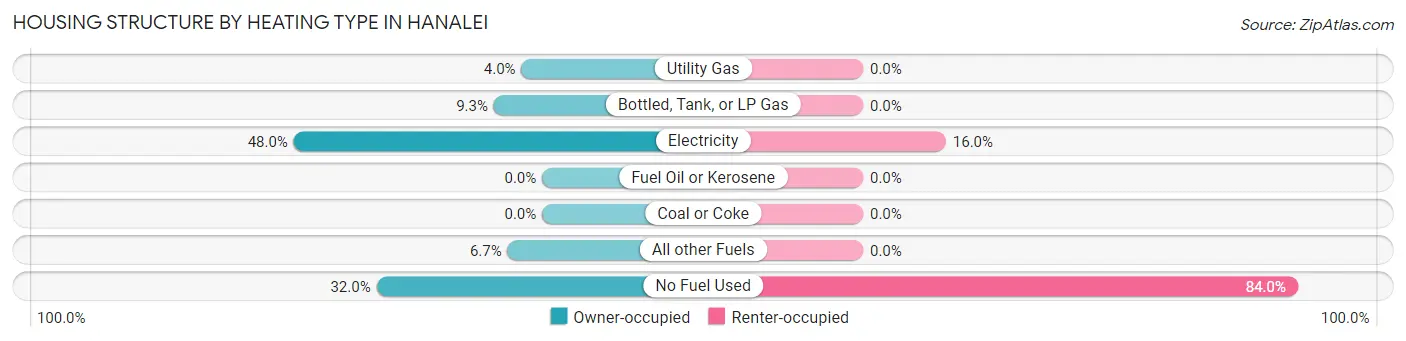
| Heating Type | Owner-occupied | Renter-occupied |
| Utility Gas | 3 (4.0%) | 0 (0.0%) |
| Bottled, Tank, or LP Gas | 7 (9.3%) | 0 (0.0%) |
| Electricity | 36 (48.0%) | 8 (16.0%) |
| Fuel Oil or Kerosene | 0 (0.0%) | 0 (0.0%) |
| Coal or Coke | 0 (0.0%) | 0 (0.0%) |
| All other Fuels | 5 (6.7%) | 0 (0.0%) |
| No Fuel Used | 24 (32.0%) | 42 (84.0%) |
| Total | 75 (100.0%) | 50 (100.0%) |
Household Vehicle Usage in Hanalei
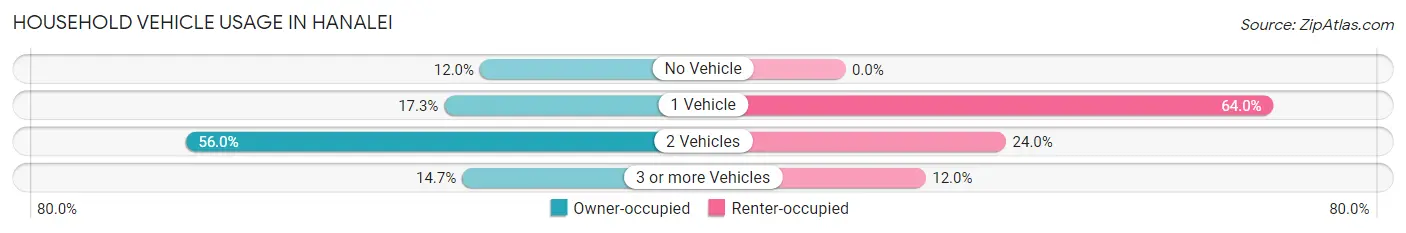
| Vehicles per Household | Owner-occupied | Renter-occupied |
| No Vehicle | 9 (12.0%) | 0 (0.0%) |
| 1 Vehicle | 13 (17.3%) | 32 (64.0%) |
| 2 Vehicles | 42 (56.0%) | 12 (24.0%) |
| 3 or more Vehicles | 11 (14.7%) | 6 (12.0%) |
| Total | 75 (100.0%) | 50 (100.0%) |
Real Estate & Mortgages in Hanalei
Real Estate and Mortgage Overview in Hanalei
| Characteristic | Without Mortgage | With Mortgage |
| Housing Units | 55 | 20 |
| Median Property Value | $1,906,300 | $2,000,001 |
| Median Household Income | $85,893 | $12 |
| Monthly Housing Costs | $1,392 | $20 |
| Real Estate Taxes | $5,104 | $8 |
Property Value by Mortgage Status in Hanalei
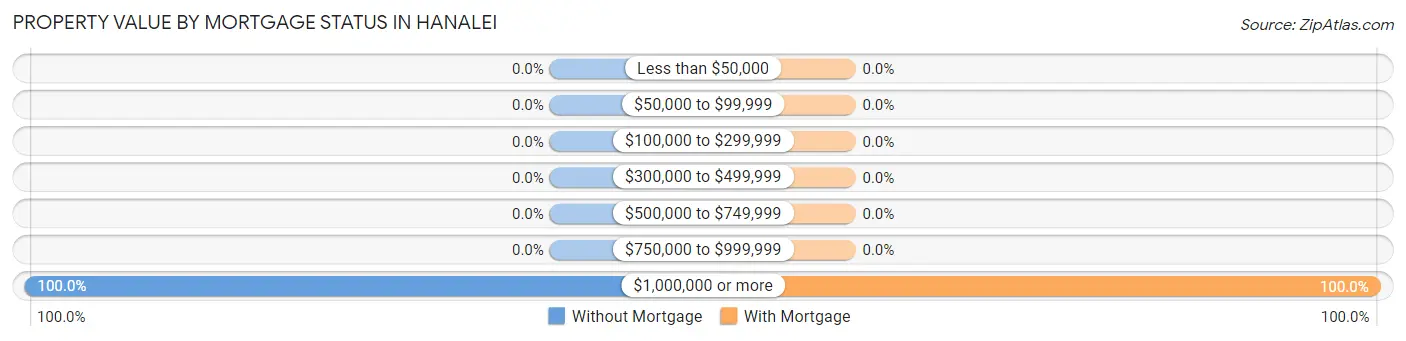
| Property Value | Without Mortgage | With Mortgage |
| Less than $50,000 | 0 (0.0%) | 0 (0.0%) |
| $50,000 to $99,999 | 0 (0.0%) | 0 (0.0%) |
| $100,000 to $299,999 | 0 (0.0%) | 0 (0.0%) |
| $300,000 to $499,999 | 0 (0.0%) | 0 (0.0%) |
| $500,000 to $749,999 | 0 (0.0%) | 0 (0.0%) |
| $750,000 to $999,999 | 0 (0.0%) | 0 (0.0%) |
| $1,000,000 or more | 55 (100.0%) | 20 (100.0%) |
| Total | 55 (100.0%) | 20 (100.0%) |
Household Income by Mortgage Status in Hanalei
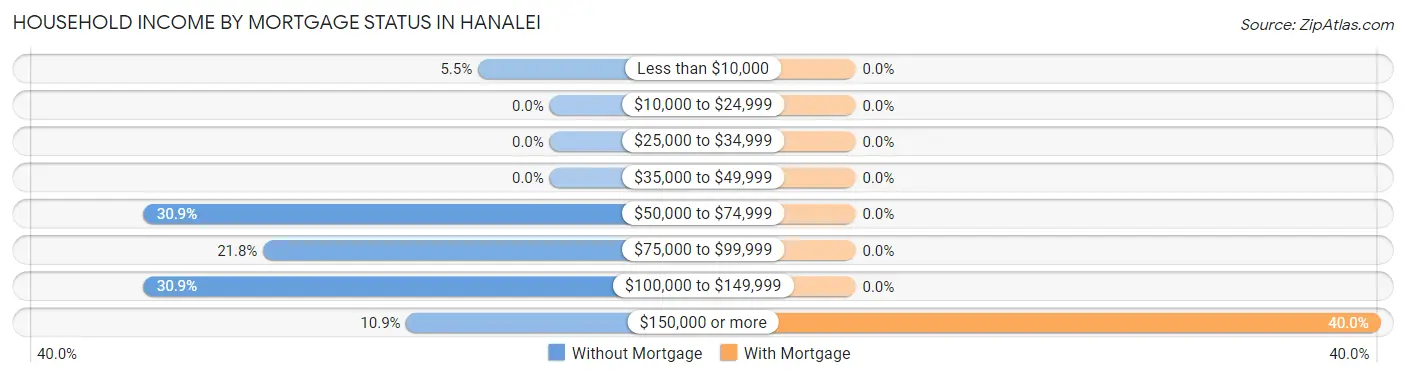
| Household Income | Without Mortgage | With Mortgage |
| Less than $10,000 | 3 (5.4%) | 0 (0.0%) |
| $10,000 to $24,999 | 0 (0.0%) | 0 (0.0%) |
| $25,000 to $34,999 | 0 (0.0%) | 0 (0.0%) |
| $35,000 to $49,999 | 0 (0.0%) | 0 (0.0%) |
| $50,000 to $74,999 | 17 (30.9%) | 0 (0.0%) |
| $75,000 to $99,999 | 12 (21.8%) | 0 (0.0%) |
| $100,000 to $149,999 | 17 (30.9%) | 0 (0.0%) |
| $150,000 or more | 6 (10.9%) | 8 (40.0%) |
| Total | 55 (100.0%) | 20 (100.0%) |
Property Value to Household Income Ratio in Hanalei
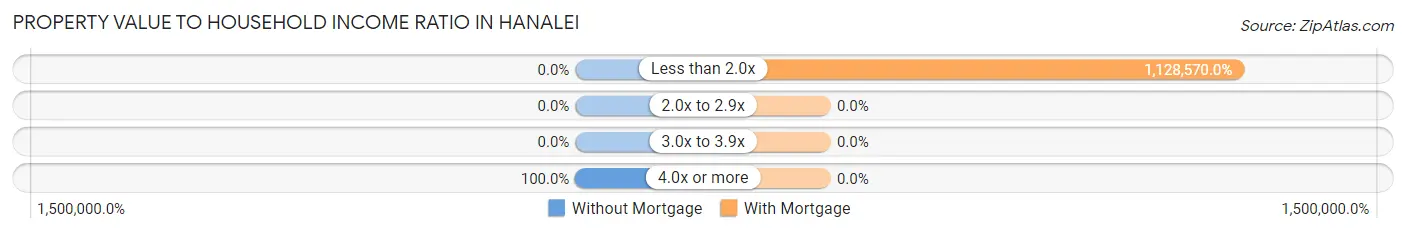
| Value-to-Income Ratio | Without Mortgage | With Mortgage |
| Less than 2.0x | 0 (0.0%) | 225,714 (1,128,570.0%) |
| 2.0x to 2.9x | 0 (0.0%) | 0 (0.0%) |
| 3.0x to 3.9x | 0 (0.0%) | 0 (0.0%) |
| 4.0x or more | 55 (100.0%) | 0 (0.0%) |
| Total | 55 (100.0%) | 20 (100.0%) |
Real Estate Taxes by Mortgage Status in Hanalei
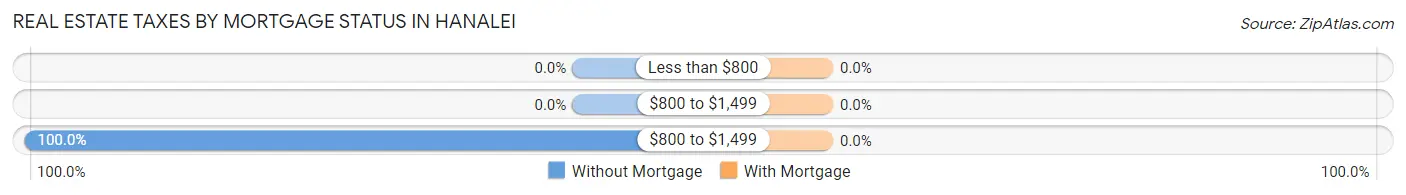
| Property Taxes | Without Mortgage | With Mortgage |
| Less than $800 | 0 (0.0%) | 0 (0.0%) |
| $800 to $1,499 | 0 (0.0%) | 0 (0.0%) |
| $800 to $1,499 | 55 (100.0%) | 0 (0.0%) |
| Total | 55 (100.0%) | 20 (100.0%) |
Health & Disability in Hanalei
Health Insurance Coverage by Age in Hanalei
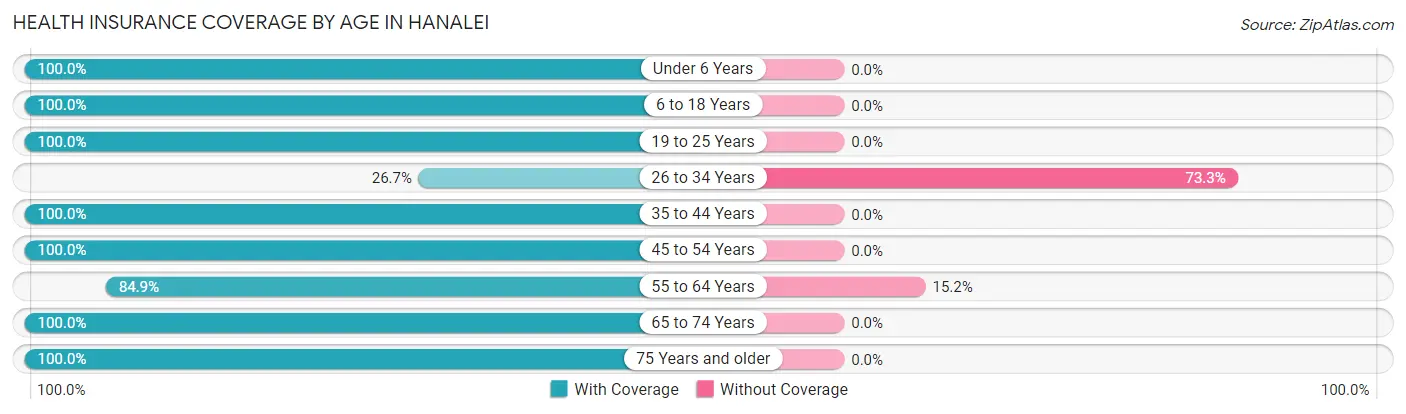
| Age Bracket | With Coverage | Without Coverage |
| Under 6 Years | 30 (100.0%) | 0 (0.0%) |
| 6 to 18 Years | 39 (100.0%) | 0 (0.0%) |
| 19 to 25 Years | 4 (100.0%) | 0 (0.0%) |
| 26 to 34 Years | 4 (26.7%) | 11 (73.3%) |
| 35 to 44 Years | 17 (100.0%) | 0 (0.0%) |
| 45 to 54 Years | 30 (100.0%) | 0 (0.0%) |
| 55 to 64 Years | 28 (84.9%) | 5 (15.1%) |
| 65 to 74 Years | 125 (100.0%) | 0 (0.0%) |
| 75 Years and older | 7 (100.0%) | 0 (0.0%) |
| Total | 284 (94.7%) | 16 (5.3%) |
Health Insurance Coverage by Citizenship Status in Hanalei
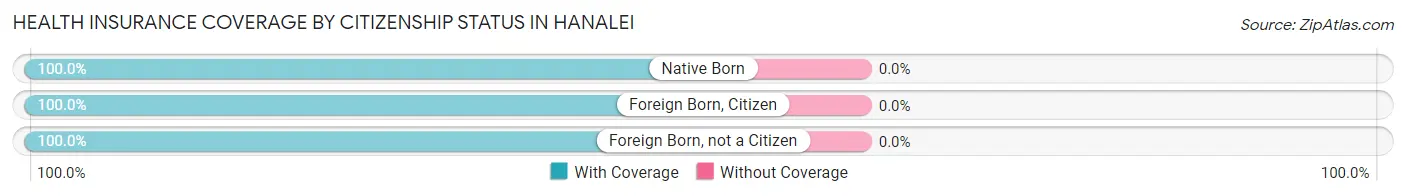
| Citizenship Status | With Coverage | Without Coverage |
| Native Born | 30 (100.0%) | 0 (0.0%) |
| Foreign Born, Citizen | 39 (100.0%) | 0 (0.0%) |
| Foreign Born, not a Citizen | 4 (100.0%) | 0 (0.0%) |
Health Insurance Coverage by Household Income in Hanalei
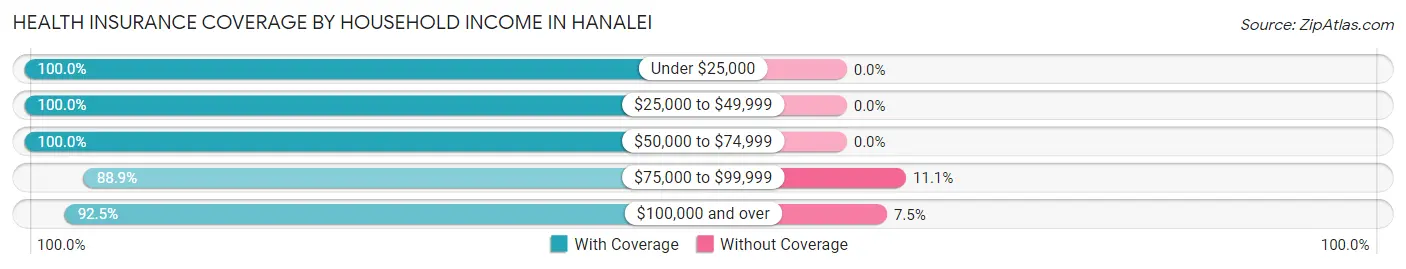
| Household Income | With Coverage | Without Coverage |
| Under $25,000 | 17 (100.0%) | 0 (0.0%) |
| $25,000 to $49,999 | 35 (100.0%) | 0 (0.0%) |
| $50,000 to $74,999 | 57 (100.0%) | 0 (0.0%) |
| $75,000 to $99,999 | 40 (88.9%) | 5 (11.1%) |
| $100,000 and over | 135 (92.5%) | 11 (7.5%) |
Public vs Private Health Insurance Coverage by Age in Hanalei
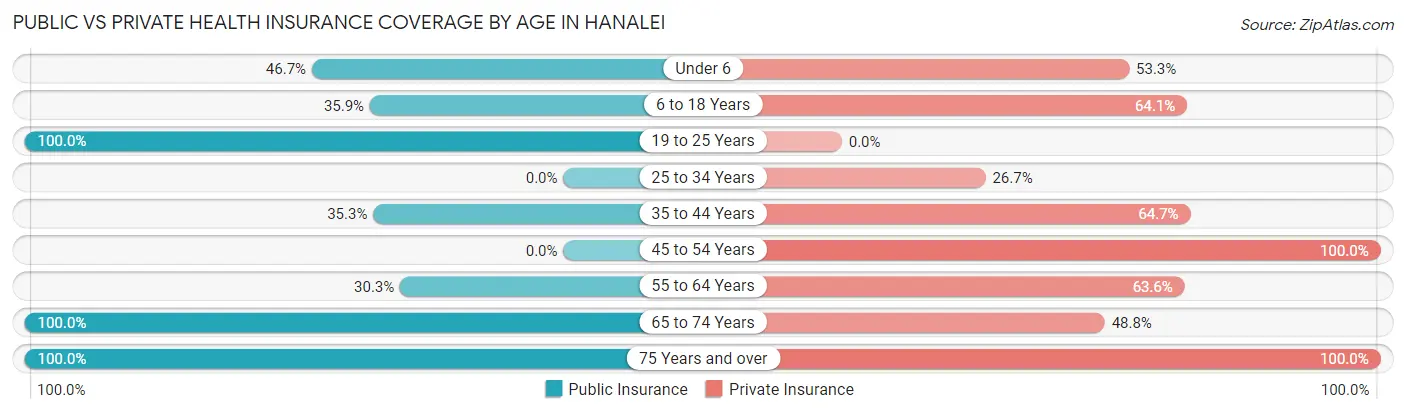
| Age Bracket | Public Insurance | Private Insurance |
| Under 6 | 14 (46.7%) | 16 (53.3%) |
| 6 to 18 Years | 14 (35.9%) | 25 (64.1%) |
| 19 to 25 Years | 4 (100.0%) | 0 (0.0%) |
| 25 to 34 Years | 0 (0.0%) | 4 (26.7%) |
| 35 to 44 Years | 6 (35.3%) | 11 (64.7%) |
| 45 to 54 Years | 0 (0.0%) | 30 (100.0%) |
| 55 to 64 Years | 10 (30.3%) | 21 (63.6%) |
| 65 to 74 Years | 125 (100.0%) | 61 (48.8%) |
| 75 Years and over | 7 (100.0%) | 7 (100.0%) |
| Total | 180 (60.0%) | 175 (58.3%) |
Disability Status by Sex by Age in Hanalei
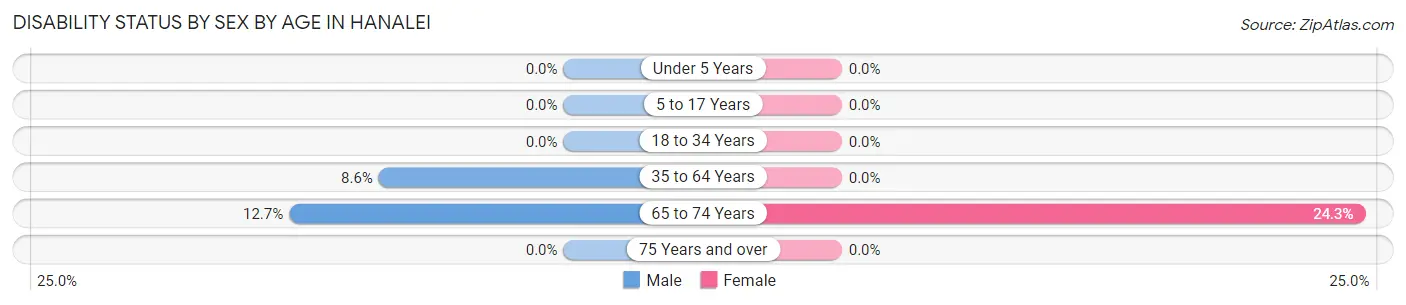
| Age Bracket | Male | Female |
| Under 5 Years | 0 (0.0%) | 0 (0.0%) |
| 5 to 17 Years | 0 (0.0%) | 0 (0.0%) |
| 18 to 34 Years | 0 (0.0%) | 0 (0.0%) |
| 35 to 64 Years | 3 (8.6%) | 0 (0.0%) |
| 65 to 74 Years | 7 (12.7%) | 17 (24.3%) |
| 75 Years and over | 0 (0.0%) | 0 (0.0%) |
Disability Class by Sex by Age in Hanalei
Disability Class: Hearing Difficulty
| Age Bracket | Male | Female |
| Under 5 Years | 0 (0.0%) | 0 (0.0%) |
| 5 to 17 Years | 0 (0.0%) | 0 (0.0%) |
| 18 to 34 Years | 0 (0.0%) | 0 (0.0%) |
| 35 to 64 Years | 0 (0.0%) | 0 (0.0%) |
| 65 to 74 Years | 0 (0.0%) | 0 (0.0%) |
| 75 Years and over | 0 (0.0%) | 0 (0.0%) |
Disability Class: Vision Difficulty
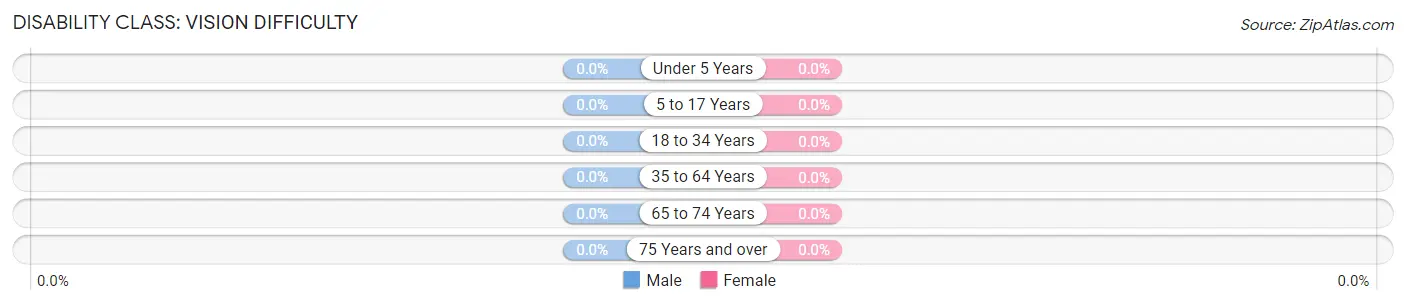
| Age Bracket | Male | Female |
| Under 5 Years | 0 (0.0%) | 0 (0.0%) |
| 5 to 17 Years | 0 (0.0%) | 0 (0.0%) |
| 18 to 34 Years | 0 (0.0%) | 0 (0.0%) |
| 35 to 64 Years | 0 (0.0%) | 0 (0.0%) |
| 65 to 74 Years | 0 (0.0%) | 0 (0.0%) |
| 75 Years and over | 0 (0.0%) | 0 (0.0%) |
Disability Class: Cognitive Difficulty
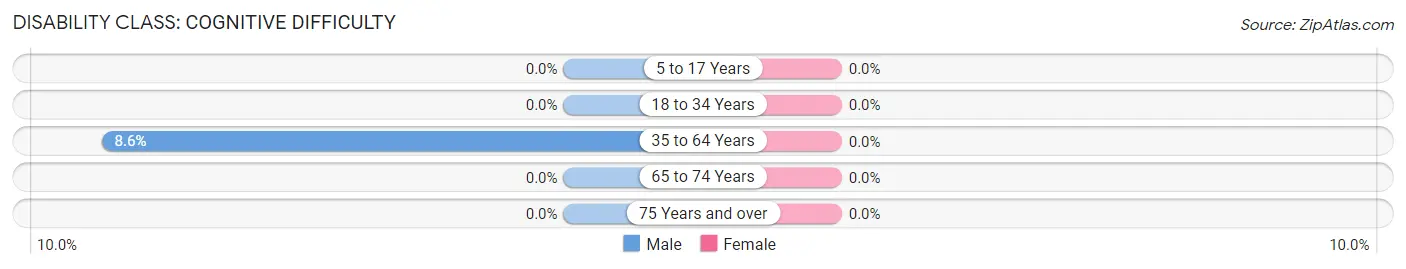
| Age Bracket | Male | Female |
| 5 to 17 Years | 0 (0.0%) | 0 (0.0%) |
| 18 to 34 Years | 0 (0.0%) | 0 (0.0%) |
| 35 to 64 Years | 3 (8.6%) | 0 (0.0%) |
| 65 to 74 Years | 0 (0.0%) | 0 (0.0%) |
| 75 Years and over | 0 (0.0%) | 0 (0.0%) |
Disability Class: Ambulatory Difficulty
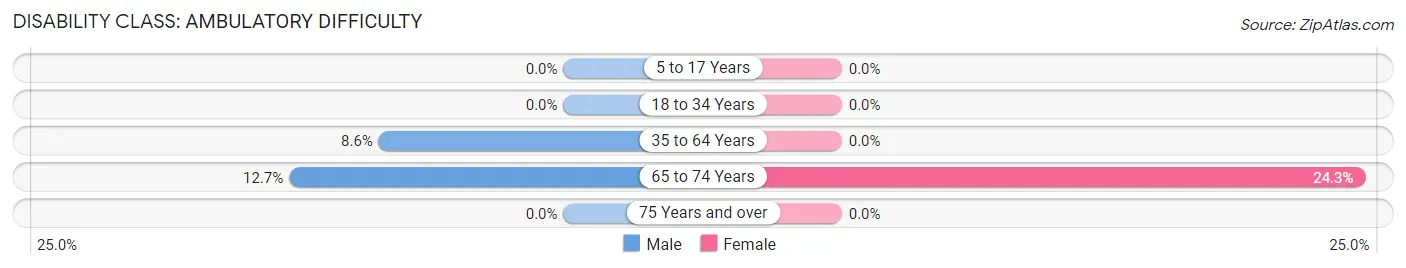
| Age Bracket | Male | Female |
| 5 to 17 Years | 0 (0.0%) | 0 (0.0%) |
| 18 to 34 Years | 0 (0.0%) | 0 (0.0%) |
| 35 to 64 Years | 3 (8.6%) | 0 (0.0%) |
| 65 to 74 Years | 7 (12.7%) | 17 (24.3%) |
| 75 Years and over | 0 (0.0%) | 0 (0.0%) |
Disability Class: Self-Care Difficulty
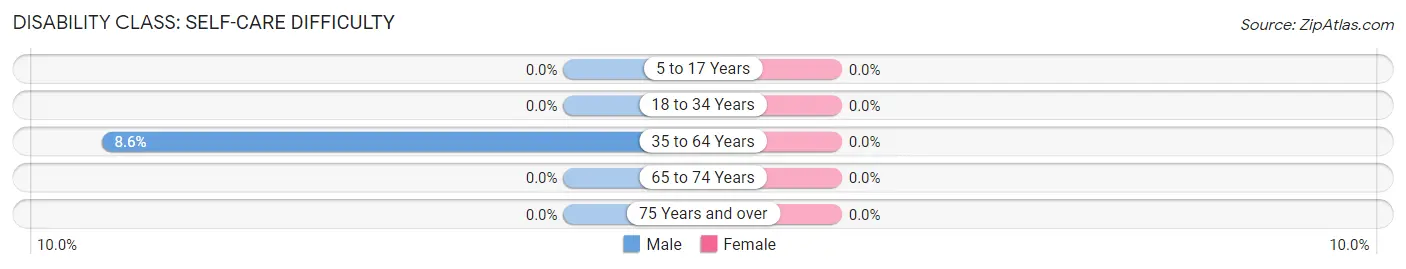
| Age Bracket | Male | Female |
| 5 to 17 Years | 0 (0.0%) | 0 (0.0%) |
| 18 to 34 Years | 0 (0.0%) | 0 (0.0%) |
| 35 to 64 Years | 3 (8.6%) | 0 (0.0%) |
| 65 to 74 Years | 0 (0.0%) | 0 (0.0%) |
| 75 Years and over | 0 (0.0%) | 0 (0.0%) |
Technology Access in Hanalei
Computing Device Access in Hanalei
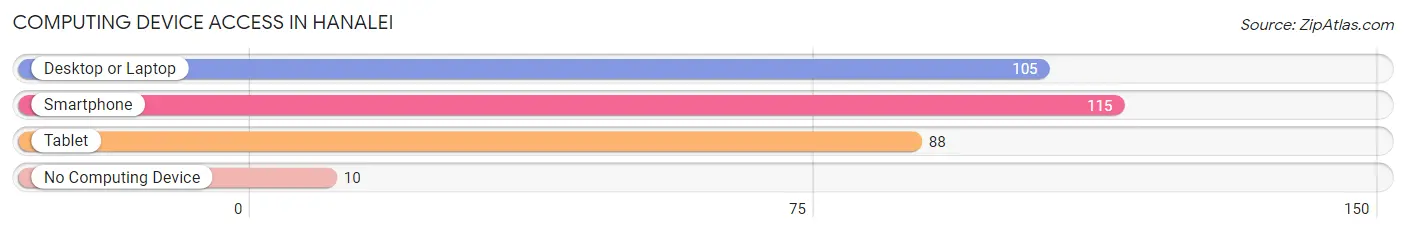
| Device Type | # Households | % Households |
| Desktop or Laptop | 105 | 84.0% |
| Smartphone | 115 | 92.0% |
| Tablet | 88 | 70.4% |
| No Computing Device | 10 | 8.0% |
| Total | 125 | 100.0% |
Internet Access in Hanalei
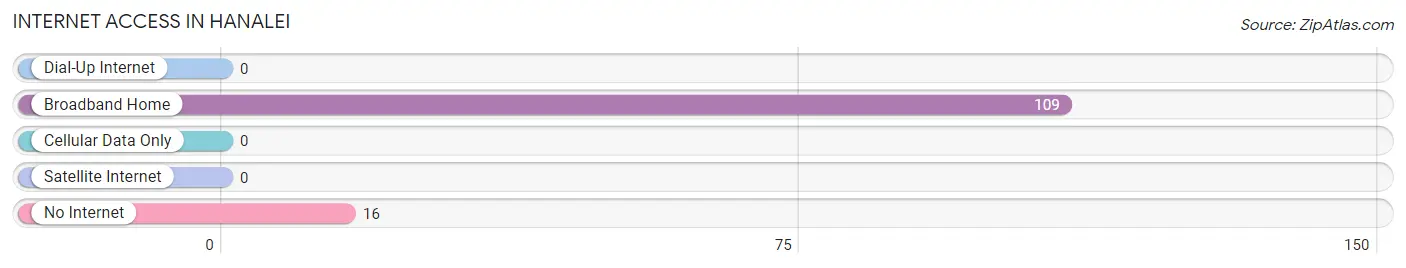
| Internet Type | # Households | % Households |
| Dial-Up Internet | 0 | 0.0% |
| Broadband Home | 109 | 87.2% |
| Cellular Data Only | 0 | 0.0% |
| Satellite Internet | 0 | 0.0% |
| No Internet | 16 | 12.8% |
| Total | 125 | 100.0% |
Hanalei Summary
Hanalei is a small town located on the north shore of Kauai, Hawaii. It is a popular tourist destination due to its stunning natural beauty, and is known for its white sand beaches, lush green valleys, and majestic mountains. The town is located in the Hanalei Valley, which is part of the larger Waimea Canyon State Park. The population of Hanalei was 1,741 as of the 2010 census.
History
The area now known as Hanalei was first settled by Polynesian voyagers in the late 1700s. The first Europeans to visit the area were Captain James Cook and his crew in 1778. The area was later settled by Chinese immigrants in the mid-1800s, who established a small fishing village. The town was officially established in 1846, when King Kamehameha III granted the land to the Hanalei Sugar Company. The company built a sugar mill and a wharf, and the town quickly grew.
In the late 1800s, the town was a popular destination for wealthy tourists from the mainland. The town was also home to a thriving pineapple industry, and the Hanalei Cannery was built in the early 1900s. The cannery was destroyed by a tsunami in 1946, and the town was largely abandoned until the 1960s, when it was rediscovered by surfers and hippies.
Geography
Hanalei is located on the north shore of Kauai, Hawaii. It is situated in the Hanalei Valley, which is part of the larger Waimea Canyon State Park. The town is surrounded by lush green mountains and valleys, and is home to several white sand beaches. The Hanalei River runs through the town, and is a popular spot for kayaking and swimming.
Economy
The economy of Hanalei is largely based on tourism. The town is a popular destination for surfers, hikers, and beachgoers, and there are several hotels and resorts in the area. The town is also home to several restaurants, cafes, and shops. The Hanalei Cannery is still in operation, and produces canned pineapple and other fruit products.
Demographics
As of the 2010 census, the population of Hanalei was 1,741. The racial makeup of the town was 79.3% White, 0.7% African American, 0.3% Native American, 8.2% Asian, 0.1% Pacific Islander, 0.2% from other races, and 11.4% from two or more races. The median household income was $50,938, and the median family income was $60,938. The per capita income was $25,938. The town is home to a large number of retirees, and the median age is 55.
Common Questions
What is Per Capita Income in Hanalei?
Per Capita income in Hanalei is $45,504.
What is the Median Family Income in Hanalei?
Median Family Income in Hanalei is $95,417.
What is the Median Household income in Hanalei?
Median Household Income in Hanalei is $97,292.
What is Income or Wage Gap in Hanalei?
Income or Wage Gap in Hanalei is 63.8%.
Women in Hanalei earn 36.2 cents for every dollar earned by a man.
What is Inequality or Gini Index in Hanalei?
Inequality or Gini Index in Hanalei is 0.37.
What is the Total Population of Hanalei?
Total Population of Hanalei is 300.
What is the Total Male Population of Hanalei?
Total Male Population of Hanalei is 115.
What is the Total Female Population of Hanalei?
Total Female Population of Hanalei is 185.
What is the Ratio of Males per 100 Females in Hanalei?
There are 62.16 Males per 100 Females in Hanalei.
What is the Ratio of Females per 100 Males in Hanalei?
There are 160.87 Females per 100 Males in Hanalei.
What is the Median Population Age in Hanalei?
Median Population Age in Hanalei is 58.7 Years.
What is the Average Family Size in Hanalei
Average Family Size in Hanalei is 2.6 People.
What is the Average Household Size in Hanalei
Average Household Size in Hanalei is 2.4 People.
How Large is the Labor Force in Hanalei?
There are 101 People in the Labor Forcein in Hanalei.
What is the Percentage of People in the Labor Force in Hanalei?
42.1% of People are in the Labor Force in Hanalei.
What is the Unemployment Rate in Hanalei?
Unemployment Rate in Hanalei is 17.8%.