Temperanceville, VA Map & Demographics
Temperanceville Map
Temperanceville Overview
$41,727
PER CAPITA INCOME
$83,958
AVG HOUSEHOLD INCOME
0.54
INEQUALITY / GINI INDEX
262
TOTAL POPULATION
119
MALE POPULATION
143
FEMALE POPULATION
83.22
MALES / 100 FEMALES
120.17
FEMALES / 100 MALES
51.3
MEDIAN AGE
3.1
AVG FAMILY SIZE
2.7
AVG HOUSEHOLD SIZE
125
LABOR FORCE [ PEOPLE ]
65.8%
PERCENT IN LABOR FORCE
Temperanceville Zip Codes
Temperanceville Area Codes
Income in Temperanceville
Income Overview in Temperanceville
| Characteristic | Number | Measure |
| Per Capita Income | 262 | $41,727 |
| Median Family Income | 73 | $0 |
| Mean Family Income | 73 | $126,823 |
| Median Household Income | 97 | $83,958 |
| Mean Household Income | 97 | $106,977 |
| Income Deficit | 73 | $0 |
| Wage / Income Gap (%) | 262 | 0.00% |
| Wage / Income Gap ($) | 262 | 100.00¢ per $1 |
| Gini / Inequality Index | 262 | 0.54 |
Earnings by Sex in Temperanceville
| Sex | Number | Average Earnings |
| Male | 51 (40.8%) | $0 |
| Female | 74 (59.2%) | $0 |
| Total | 125 (100.0%) | $0 |
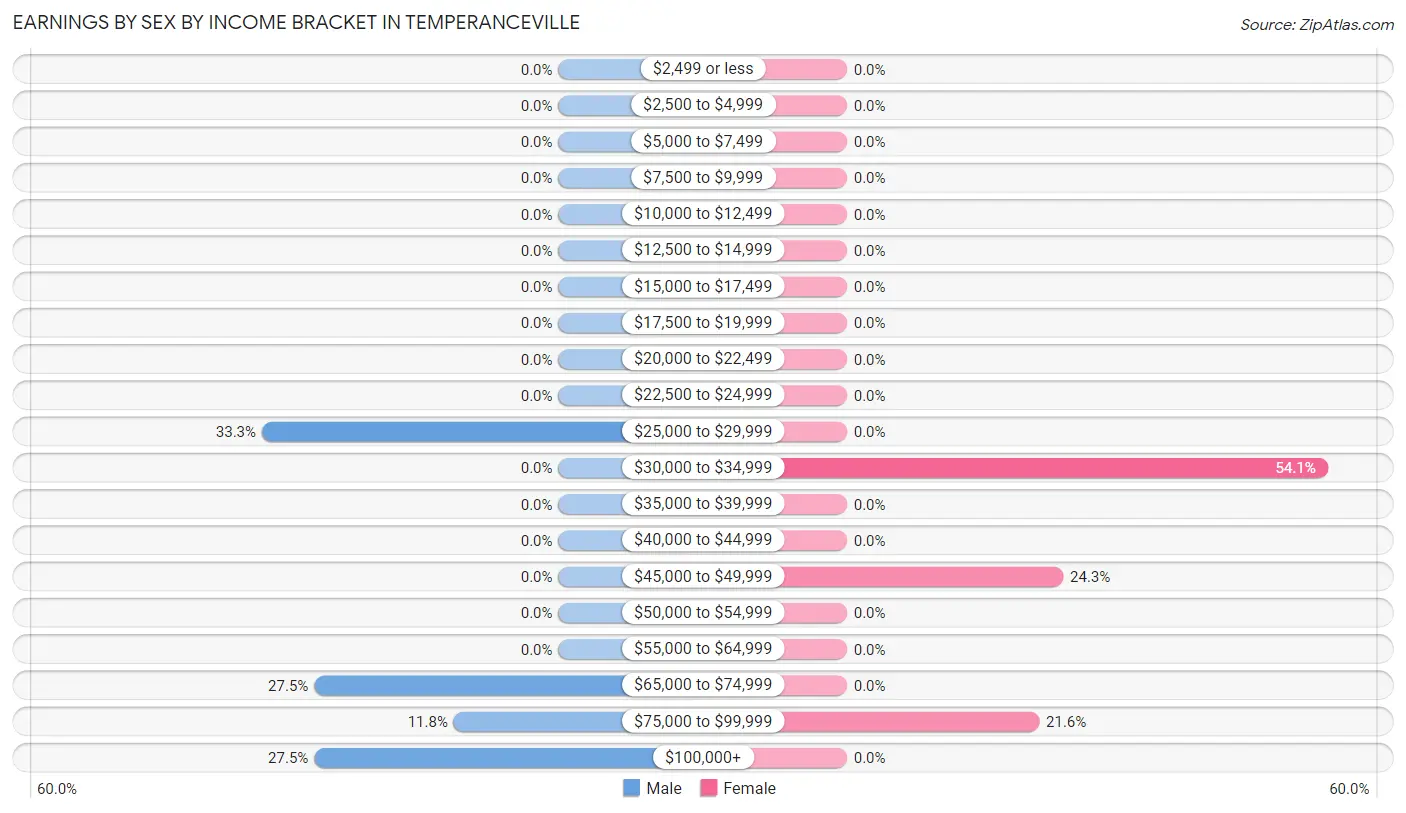
Earnings by Sex by Income Bracket in Temperanceville
The most common earnings brackets in Temperanceville are $25,000 to $29,999 for men (17 | 33.3%) and $30,000 to $34,999 for women (40 | 54.0%).
| Income | Male | Female |
| $2,499 or less | 0 (0.0%) | 0 (0.0%) |
| $2,500 to $4,999 | 0 (0.0%) | 0 (0.0%) |
| $5,000 to $7,499 | 0 (0.0%) | 0 (0.0%) |
| $7,500 to $9,999 | 0 (0.0%) | 0 (0.0%) |
| $10,000 to $12,499 | 0 (0.0%) | 0 (0.0%) |
| $12,500 to $14,999 | 0 (0.0%) | 0 (0.0%) |
| $15,000 to $17,499 | 0 (0.0%) | 0 (0.0%) |
| $17,500 to $19,999 | 0 (0.0%) | 0 (0.0%) |
| $20,000 to $22,499 | 0 (0.0%) | 0 (0.0%) |
| $22,500 to $24,999 | 0 (0.0%) | 0 (0.0%) |
| $25,000 to $29,999 | 17 (33.3%) | 0 (0.0%) |
| $30,000 to $34,999 | 0 (0.0%) | 40 (54.0%) |
| $35,000 to $39,999 | 0 (0.0%) | 0 (0.0%) |
| $40,000 to $44,999 | 0 (0.0%) | 0 (0.0%) |
| $45,000 to $49,999 | 0 (0.0%) | 18 (24.3%) |
| $50,000 to $54,999 | 0 (0.0%) | 0 (0.0%) |
| $55,000 to $64,999 | 0 (0.0%) | 0 (0.0%) |
| $65,000 to $74,999 | 14 (27.5%) | 0 (0.0%) |
| $75,000 to $99,999 | 6 (11.8%) | 16 (21.6%) |
| $100,000+ | 14 (27.5%) | 0 (0.0%) |
| Total | 51 (100.0%) | 74 (100.0%) |
Earnings by Sex by Educational Attainment in Temperanceville
| Educational Attainment | Male Income | Female Income |
| Less than High School | - | - |
| High School Diploma | - | - |
| College or Associate's Degree | - | - |
| Bachelor's Degree | - | - |
| Graduate Degree | - | - |
| Total | - | - |
Family Income in Temperanceville
Family Income Brackets in Temperanceville
According to the Temperanceville family income data, there are 28 families falling into the $200,000+ income range, which is the most common income bracket and makes up 38.4% of all families.
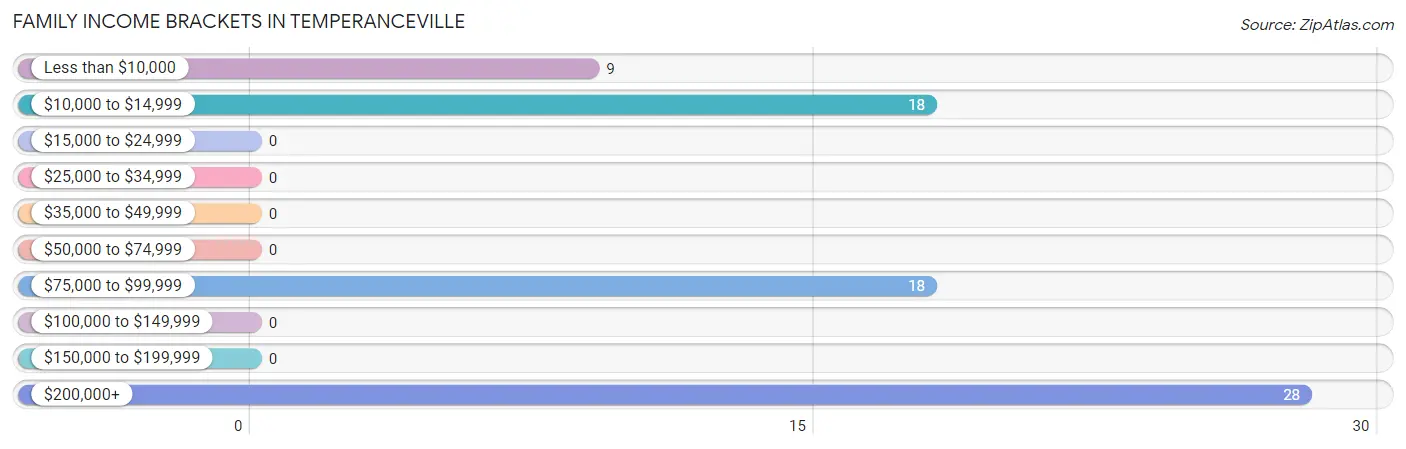
| Income Bracket | # Families | % Families |
| Less than $10,000 | 9 | 12.3% |
| $10,000 to $14,999 | 18 | 24.7% |
| $15,000 to $24,999 | 0 | 0.0% |
| $25,000 to $34,999 | 0 | 0.0% |
| $35,000 to $49,999 | 0 | 0.0% |
| $50,000 to $74,999 | 0 | 0.0% |
| $75,000 to $99,999 | 18 | 24.7% |
| $100,000 to $149,999 | 0 | 0.0% |
| $150,000 to $199,999 | 0 | 0.0% |
| $200,000+ | 28 | 38.4% |
Family Income by Famaliy Size in Temperanceville
| Income Bracket | # Families | Median Income |
| 2-Person Families | 23 (31.5%) | $0 |
| 3-Person Families | 32 (43.8%) | $0 |
| 4-Person Families | 18 (24.7%) | $0 |
| 5-Person Families | 0 (0.0%) | $0 |
| 6-Person Families | 0 (0.0%) | $0 |
| 7+ Person Families | 0 (0.0%) | $0 |
| Total | 73 (100.0%) | $0 |
Family Income by Number of Earners in Temperanceville
| Number of Earners | # Families | Median Income |
| No Earners | 27 (37.0%) | $0 |
| 1 Earner | 0 (0.0%) | $0 |
| 2 Earners | 28 (38.4%) | $0 |
| 3+ Earners | 18 (24.7%) | $0 |
| Total | 73 (100.0%) | $0 |
Household Income in Temperanceville
Household Income Brackets in Temperanceville
With 28 households falling in the category, the $200,000+ income range is the most frequent in Temperanceville, accounting for 28.9% of all households.
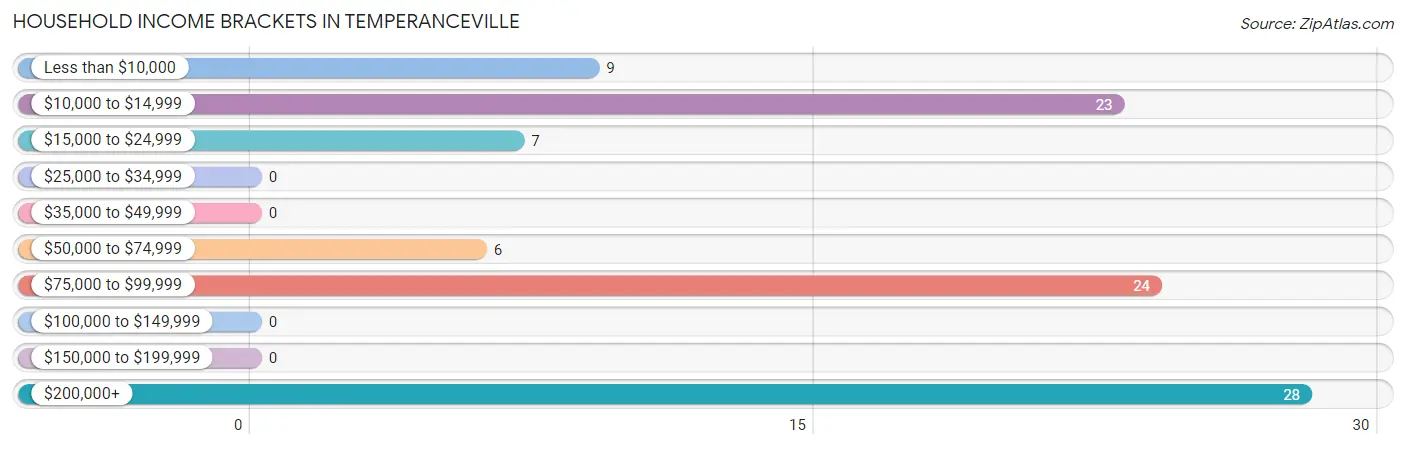
| Income Bracket | # Households | % Households |
| Less than $10,000 | 9 | 9.3% |
| $10,000 to $14,999 | 23 | 23.7% |
| $15,000 to $24,999 | 7 | 7.2% |
| $25,000 to $34,999 | 0 | 0.0% |
| $35,000 to $49,999 | 0 | 0.0% |
| $50,000 to $74,999 | 6 | 6.2% |
| $75,000 to $99,999 | 24 | 24.7% |
| $100,000 to $149,999 | 0 | 0.0% |
| $150,000 to $199,999 | 0 | 0.0% |
| $200,000+ | 28 | 28.9% |
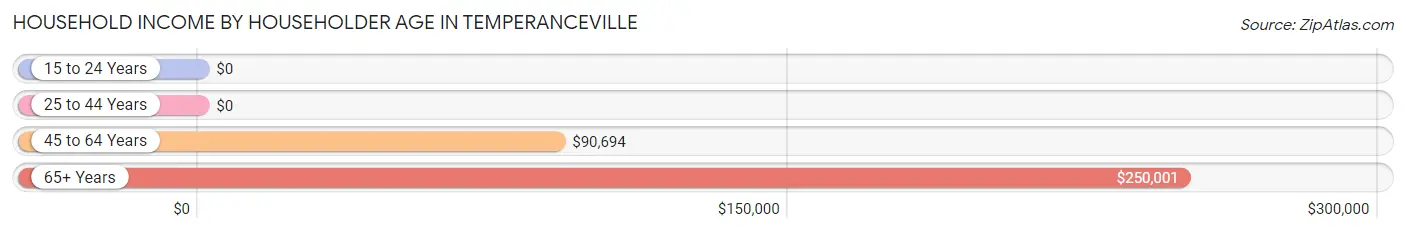
Household Income by Householder Age in Temperanceville
The median household income in Temperanceville is $83,958, with the highest median household income of $250,001 found in the 65+ years age bracket for the primary householder. A total of 25 households (25.8%) fall into this category.
| Income Bracket | # Households | Median Income |
| 15 to 24 Years | 0 (0.0%) | $0 |
| 25 to 44 Years | 18 (18.6%) | $0 |
| 45 to 64 Years | 54 (55.7%) | $90,694 |
| 65+ Years | 25 (25.8%) | $250,001 |
| Total | 97 (100.0%) | $83,958 |
Poverty in Temperanceville
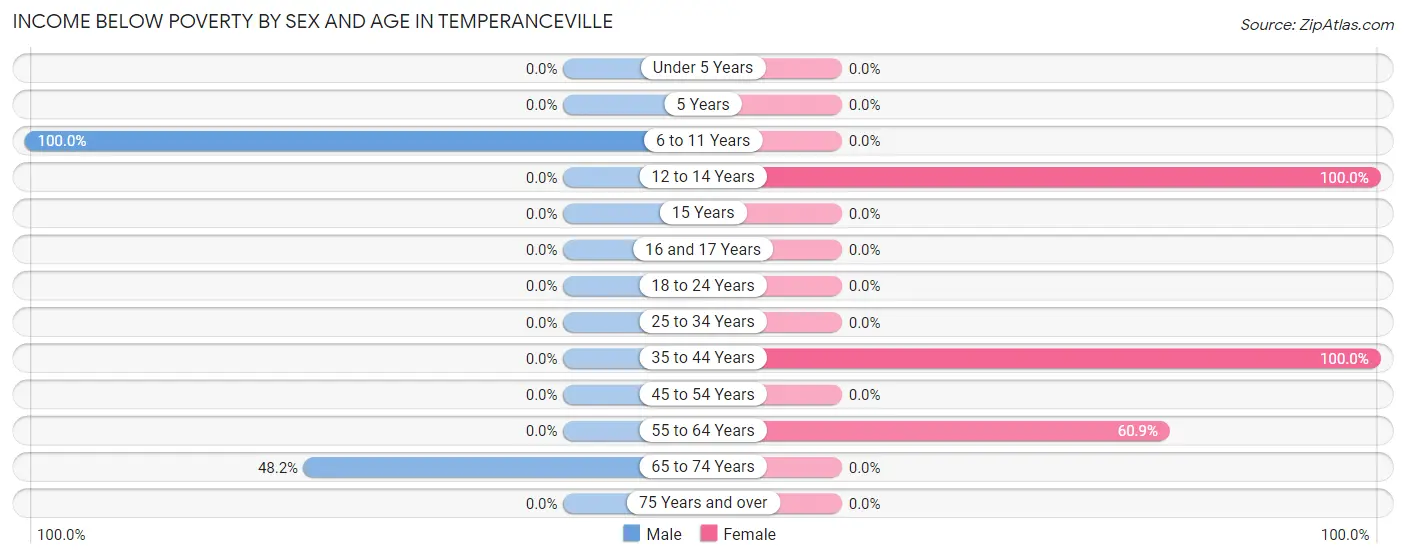
Income Below Poverty by Sex and Age in Temperanceville
With 42.0% poverty level for males and 44.1% for females among the residents of Temperanceville, 6 to 11 year old males and 12 to 14 year old females are the most vulnerable to poverty, with 37 males (100.0%) and 17 females (100.0%) in their respective age groups living below the poverty level.
| Age Bracket | Male | Female |
| Under 5 Years | 0 (0.0%) | 0 (0.0%) |
| 5 Years | 0 (0.0%) | 0 (0.0%) |
| 6 to 11 Years | 37 (100.0%) | 0 (0.0%) |
| 12 to 14 Years | 0 (0.0%) | 17 (100.0%) |
| 15 Years | 0 (0.0%) | 0 (0.0%) |
| 16 and 17 Years | 0 (0.0%) | 0 (0.0%) |
| 18 to 24 Years | 0 (0.0%) | 0 (0.0%) |
| 25 to 34 Years | 0 (0.0%) | 0 (0.0%) |
| 35 to 44 Years | 0 (0.0%) | 18 (100.0%) |
| 45 to 54 Years | 0 (0.0%) | 0 (0.0%) |
| 55 to 64 Years | 0 (0.0%) | 28 (60.9%) |
| 65 to 74 Years | 13 (48.1%) | 0 (0.0%) |
| 75 Years and over | 0 (0.0%) | 0 (0.0%) |
| Total | 50 (42.0%) | 63 (44.1%) |
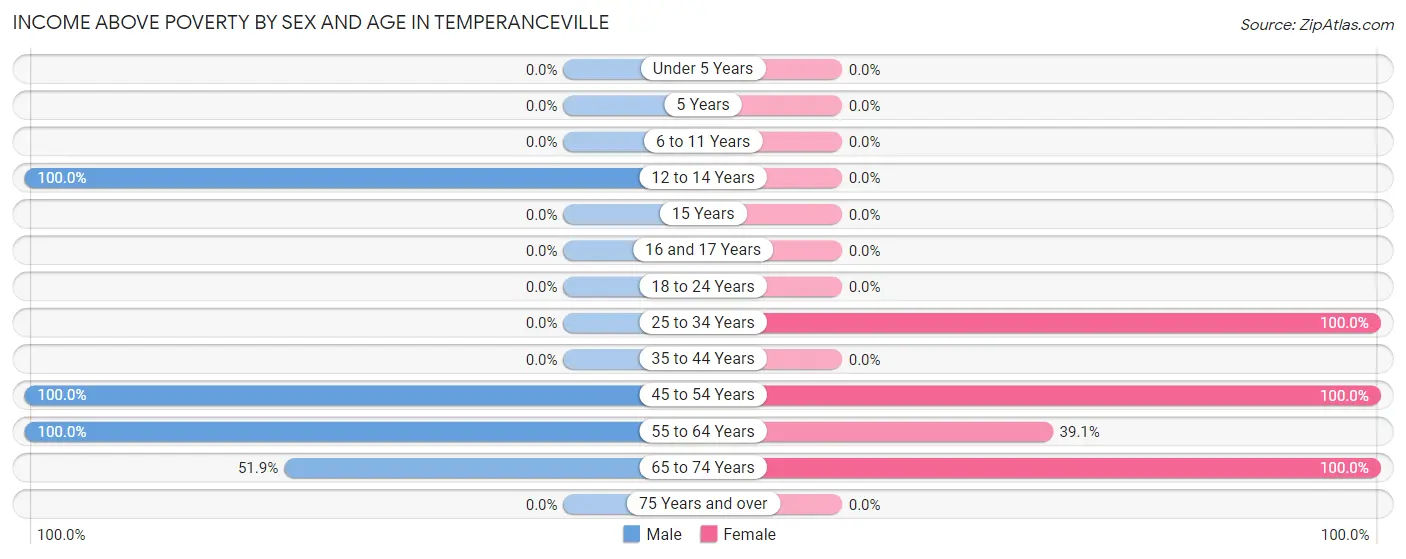
Income Above Poverty by Sex and Age in Temperanceville
According to the poverty statistics in Temperanceville, males aged 12 to 14 years and females aged 25 to 34 years are the age groups that are most secure financially, with 100.0% of males and 100.0% of females in these age groups living above the poverty line.
| Age Bracket | Male | Female |
| Under 5 Years | 0 (0.0%) | 0 (0.0%) |
| 5 Years | 0 (0.0%) | 0 (0.0%) |
| 6 to 11 Years | 0 (0.0%) | 0 (0.0%) |
| 12 to 14 Years | 18 (100.0%) | 0 (0.0%) |
| 15 Years | 0 (0.0%) | 0 (0.0%) |
| 16 and 17 Years | 0 (0.0%) | 0 (0.0%) |
| 18 to 24 Years | 0 (0.0%) | 0 (0.0%) |
| 25 to 34 Years | 0 (0.0%) | 22 (100.0%) |
| 35 to 44 Years | 0 (0.0%) | 0 (0.0%) |
| 45 to 54 Years | 14 (100.0%) | 16 (100.0%) |
| 55 to 64 Years | 23 (100.0%) | 18 (39.1%) |
| 65 to 74 Years | 14 (51.8%) | 24 (100.0%) |
| 75 Years and over | 0 (0.0%) | 0 (0.0%) |
| Total | 69 (58.0%) | 80 (55.9%) |
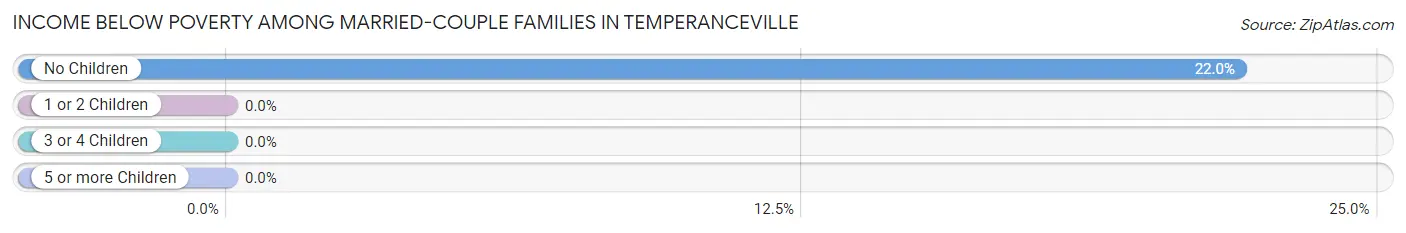
Income Below Poverty Among Married-Couple Families in Temperanceville
The poverty statistics for married-couple families in Temperanceville show that 16.4% or 9 of the total 55 families live below the poverty line. Families with no children have the highest poverty rate of 22.0%, comprising of 9 families. On the other hand, families with 1 or 2 children have the lowest poverty rate of 0.0%, which includes 0 families.
| Children | Above Poverty | Below Poverty |
| No Children | 32 (78.0%) | 9 (22.0%) |
| 1 or 2 Children | 14 (100.0%) | 0 (0.0%) |
| 3 or 4 Children | 0 (0.0%) | 0 (0.0%) |
| 5 or more Children | 0 (0.0%) | 0 (0.0%) |
| Total | 46 (83.6%) | 9 (16.4%) |
Income Below Poverty Among Single-Parent Households in Temperanceville
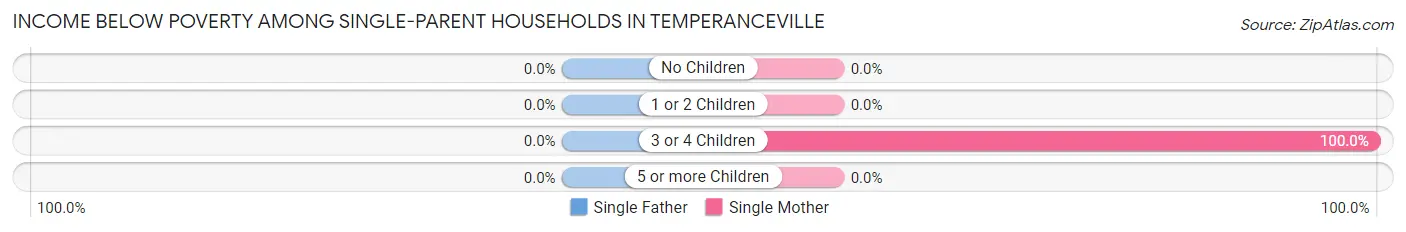
| Children | Single Father | Single Mother |
| No Children | 0 (0.0%) | 0 (0.0%) |
| 1 or 2 Children | 0 (0.0%) | 0 (0.0%) |
| 3 or 4 Children | 0 (0.0%) | 18 (100.0%) |
| 5 or more Children | 0 (0.0%) | 0 (0.0%) |
| Total | 0 (0.0%) | 18 (100.0%) |
Income Below Poverty Among Married-Couple vs Single-Parent Households in Temperanceville
The poverty data for Temperanceville shows that 9 of the married-couple family households (16.4%) and 18 of the single-parent households (100.0%) are living below the poverty level. Within the married-couple family households, those with no children have the highest poverty rate, with 9 households (22.0%) falling below the poverty line. Among the single-parent households, those with 3 or 4 children have the highest poverty rate, with 18 household (100.0%) living below poverty.
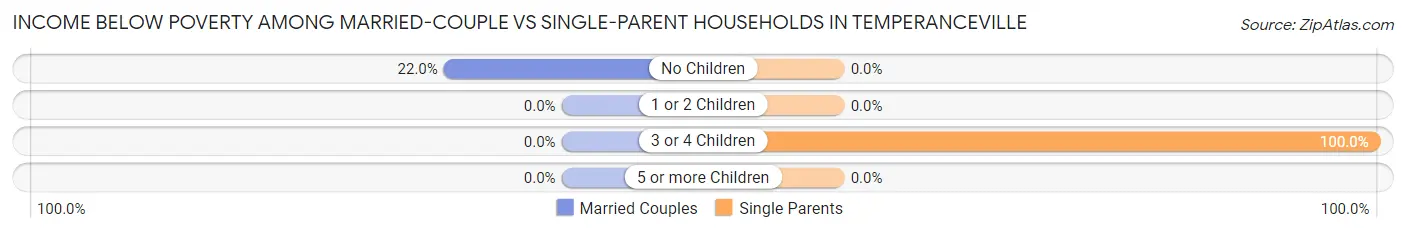
| Children | Married-Couple Families | Single-Parent Households |
| No Children | 9 (22.0%) | 0 (0.0%) |
| 1 or 2 Children | 0 (0.0%) | 0 (0.0%) |
| 3 or 4 Children | 0 (0.0%) | 18 (100.0%) |
| 5 or more Children | 0 (0.0%) | 0 (0.0%) |
| Total | 9 (16.4%) | 18 (100.0%) |
Race in Temperanceville
The most populous races in Temperanceville are White / Caucasian (209 | 79.8%), Hispanic or Latino (54 | 20.6%), and Black / African American (35 | 13.4%).
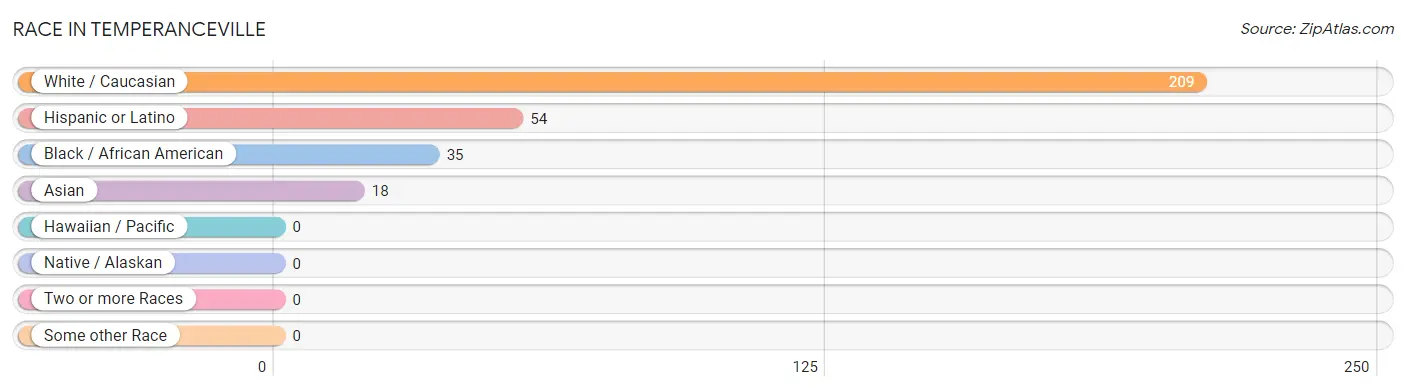
| Race | # Population | % Population |
| Asian | 18 | 6.9% |
| Black / African American | 35 | 13.4% |
| Hawaiian / Pacific | 0 | 0.0% |
| Hispanic or Latino | 54 | 20.6% |
| Native / Alaskan | 0 | 0.0% |
| White / Caucasian | 209 | 79.8% |
| Two or more Races | 0 | 0.0% |
| Some other Race | 0 | 0.0% |
| Total | 262 | 100.0% |
Ancestry in Temperanceville
The most populous ancestries reported in Temperanceville are Irish (58 | 22.1%), Puerto Rican (54 | 20.6%), European (48 | 18.3%), German (40 | 15.3%), and Polish (31 | 11.8%), together accounting for 88.2% of all Temperanceville residents.
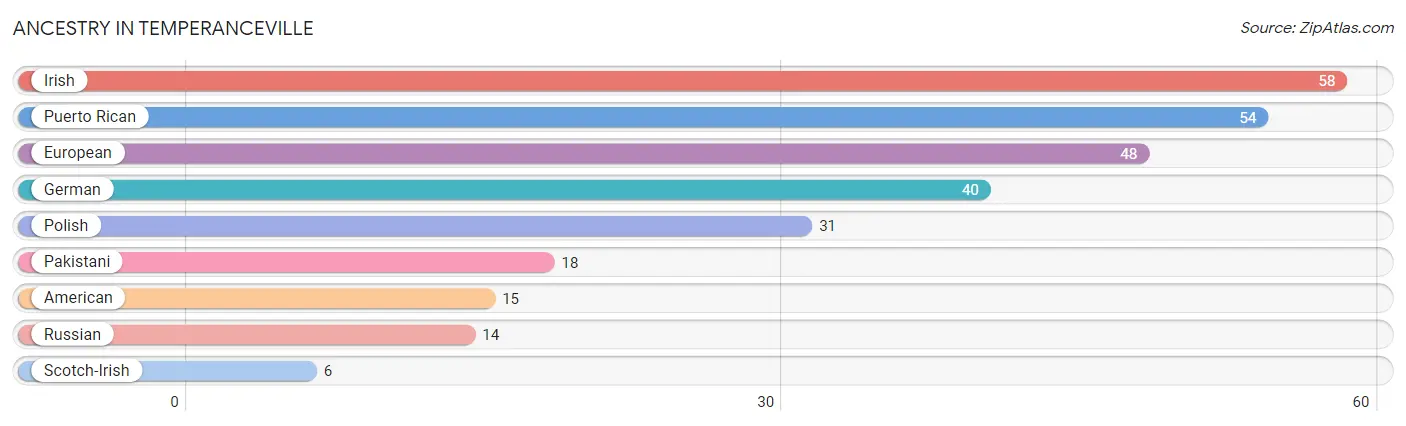
| Ancestry | # Population | % Population |
| American | 15 | 5.7% |
| European | 48 | 18.3% |
| German | 40 | 15.3% |
| Irish | 58 | 22.1% |
| Pakistani | 18 | 6.9% |
| Polish | 31 | 11.8% |
| Puerto Rican | 54 | 20.6% |
| Russian | 14 | 5.3% |
| Scotch-Irish | 6 | 2.3% | View All 9 Rows |
Immigrants in Temperanceville
The most numerous immigrant groups reported in Temperanceville came from Asia (18 | 6.9%), South Eastern Asia (18 | 6.9%), and Thailand (18 | 6.9%), together accounting for 20.6% of all Temperanceville residents.
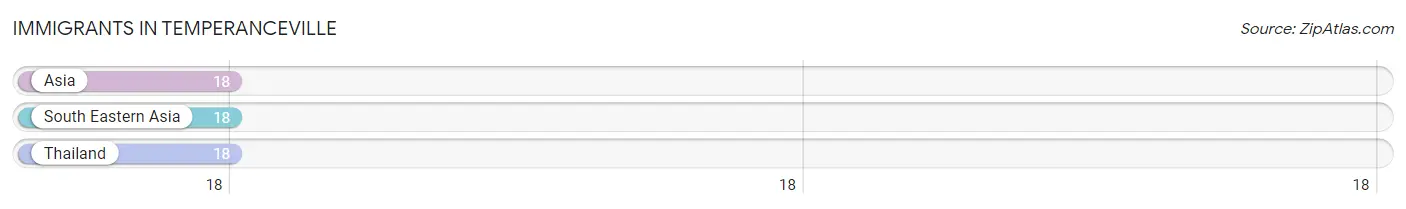
| Immigration Origin | # Population | % Population |
| Asia | 18 | 6.9% |
| South Eastern Asia | 18 | 6.9% |
| Thailand | 18 | 6.9% | View All 3 Rows |
Sex and Age in Temperanceville
Sex and Age in Temperanceville
The most populous age groups in Temperanceville are 10 to 14 Years (36 | 30.2%) for men and 55 to 59 Years (39 | 27.3%) for women.
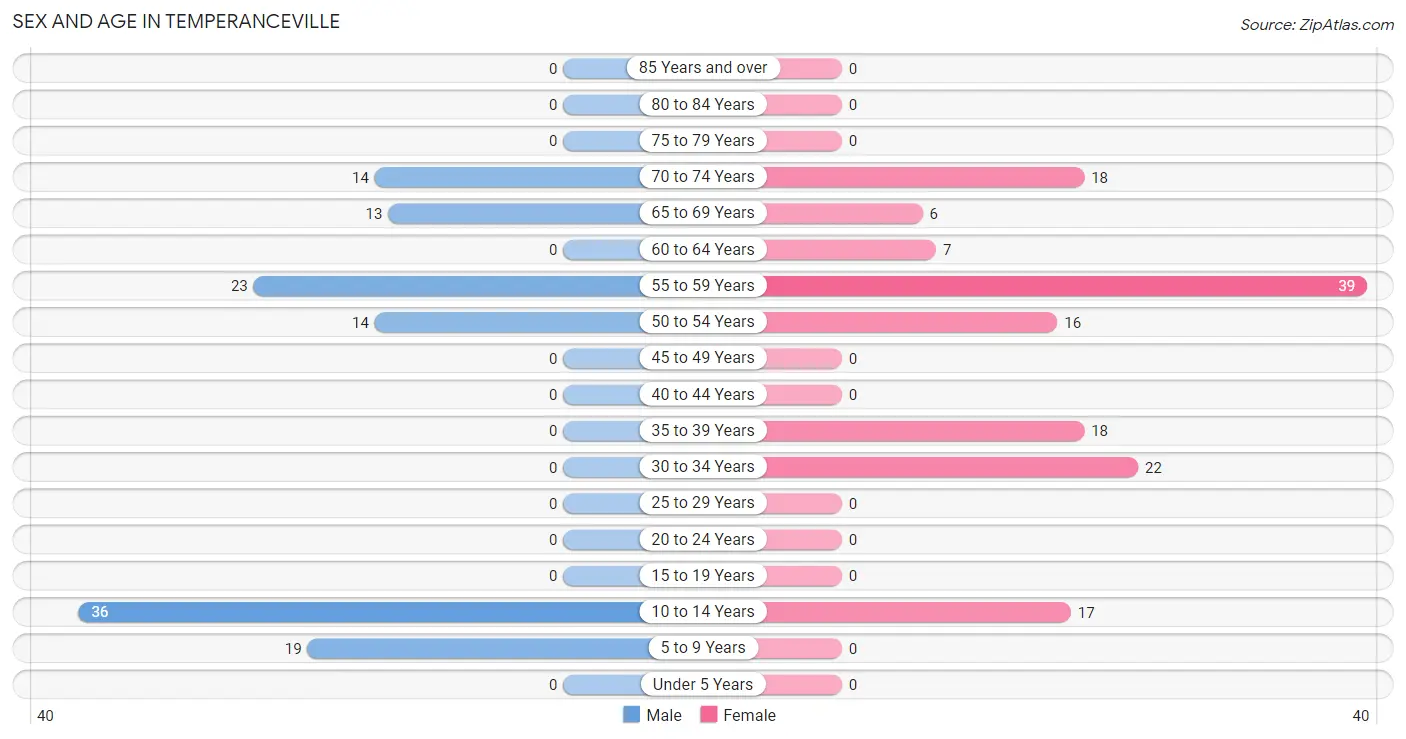
| Age Bracket | Male | Female |
| Under 5 Years | 0 (0.0%) | 0 (0.0%) |
| 5 to 9 Years | 19 (16.0%) | 0 (0.0%) |
| 10 to 14 Years | 36 (30.2%) | 17 (11.9%) |
| 15 to 19 Years | 0 (0.0%) | 0 (0.0%) |
| 20 to 24 Years | 0 (0.0%) | 0 (0.0%) |
| 25 to 29 Years | 0 (0.0%) | 0 (0.0%) |
| 30 to 34 Years | 0 (0.0%) | 22 (15.4%) |
| 35 to 39 Years | 0 (0.0%) | 18 (12.6%) |
| 40 to 44 Years | 0 (0.0%) | 0 (0.0%) |
| 45 to 49 Years | 0 (0.0%) | 0 (0.0%) |
| 50 to 54 Years | 14 (11.8%) | 16 (11.2%) |
| 55 to 59 Years | 23 (19.3%) | 39 (27.3%) |
| 60 to 64 Years | 0 (0.0%) | 7 (4.9%) |
| 65 to 69 Years | 13 (10.9%) | 6 (4.2%) |
| 70 to 74 Years | 14 (11.8%) | 18 (12.6%) |
| 75 to 79 Years | 0 (0.0%) | 0 (0.0%) |
| 80 to 84 Years | 0 (0.0%) | 0 (0.0%) |
| 85 Years and over | 0 (0.0%) | 0 (0.0%) |
| Total | 119 (100.0%) | 143 (100.0%) |
Families and Households in Temperanceville
Median Family Size in Temperanceville
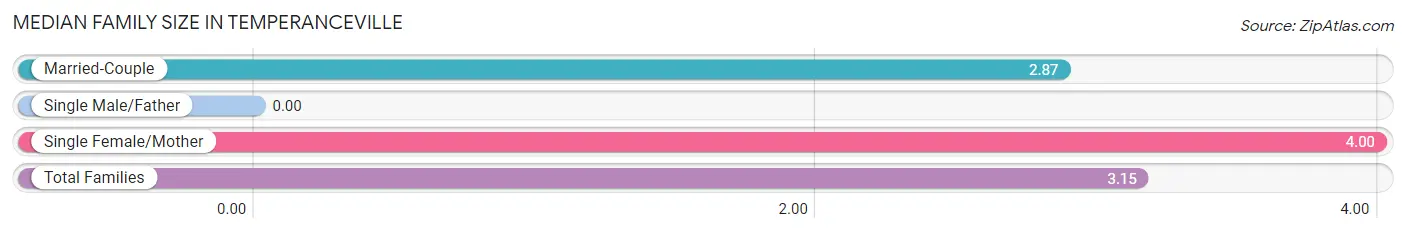
| Family Type | # Families | Family Size |
| Married-Couple | 55 (75.3%) | 2.87 |
| Single Male/Father | 0 (0.0%) | - |
| Single Female/Mother | 18 (24.7%) | 4.00 |
| Total Families | 73 (100.0%) | 3.15 |
Median Household Size in Temperanceville
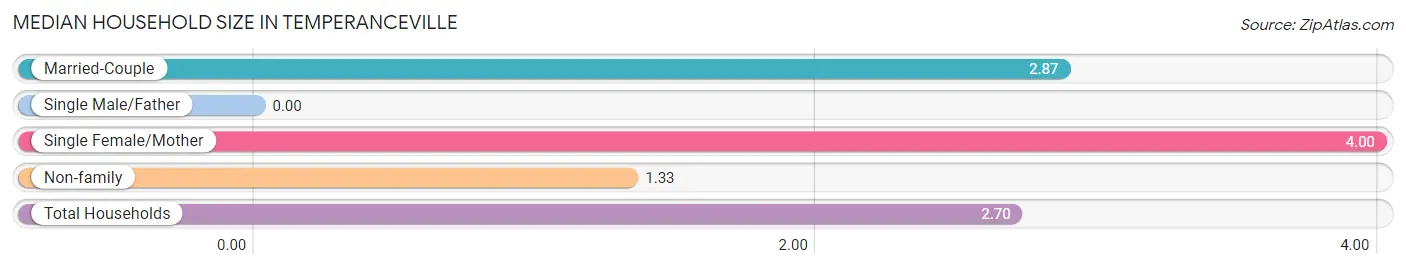
| Household Type | # Households | Household Size |
| Married-Couple | 55 (56.7%) | 2.87 |
| Single Male/Father | 0 (0.0%) | - |
| Single Female/Mother | 18 (18.6%) | 4.00 |
| Non-family | 24 (24.7%) | 1.33 |
| Total Households | 97 (100.0%) | 2.70 |
Household Size by Marriage Status in Temperanceville
Out of a total of 97 households in Temperanceville, 73 (75.3%) are family households, while 24 (24.7%) are nonfamily households. The most numerous type of family households are 3-person households, comprising 32, and the most common type of nonfamily households are 1-person households, comprising 17.
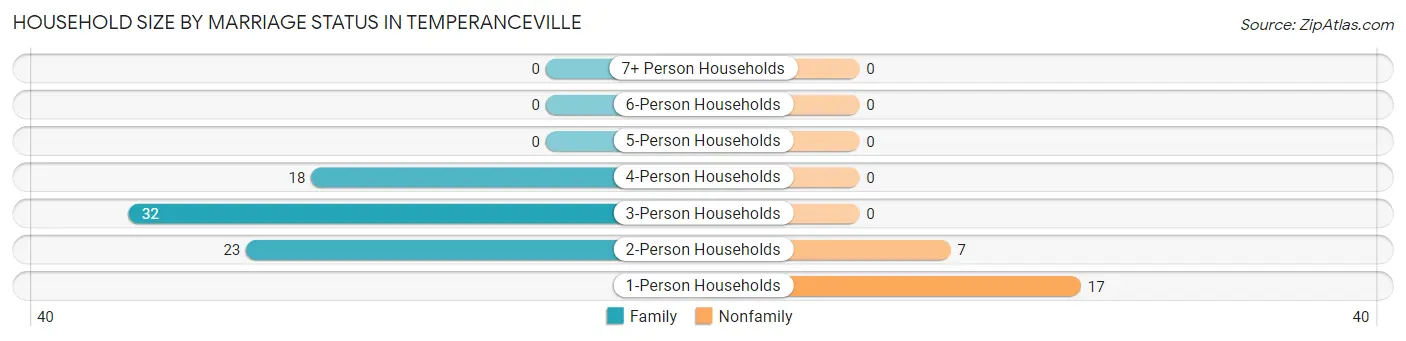
| Household Size | Family Households | Nonfamily Households |
| 1-Person Households | - | 17 (17.5%) |
| 2-Person Households | 23 (23.7%) | 7 (7.2%) |
| 3-Person Households | 32 (33.0%) | 0 (0.0%) |
| 4-Person Households | 18 (18.6%) | 0 (0.0%) |
| 5-Person Households | 0 (0.0%) | 0 (0.0%) |
| 6-Person Households | 0 (0.0%) | 0 (0.0%) |
| 7+ Person Households | 0 (0.0%) | 0 (0.0%) |
| Total | 73 (75.3%) | 24 (24.7%) |
Female Fertility in Temperanceville
Fertility by Age in Temperanceville
| Age Bracket | Women with Births | Births / 1,000 Women |
| 15 to 19 years | 0 (0.0%) | 0.0 |
| 20 to 34 years | 0 (0.0%) | 0.0 |
| 35 to 50 years | 0 (0.0%) | 0.0 |
| Total | 0 (0.0%) | 0.0 |
Fertility by Age by Marriage Status in Temperanceville
| Age Bracket | Married | Unmarried |
| 15 to 19 years | 0 (0.0%) | 0 (0.0%) |
| 20 to 34 years | 0 (0.0%) | 0 (0.0%) |
| 35 to 50 years | 0 (0.0%) | 0 (0.0%) |
| Total | 0 (0.0%) | 0 (0.0%) |
Fertility by Education in Temperanceville
| Educational Attainment | Women with Births | Births / 1,000 Women |
| Less than High School | 0 (0.0%) | 0.0 |
| High School Diploma | 0 (0.0%) | 0.0 |
| College or Associate's Degree | 0 (0.0%) | 0.0 |
| Bachelor's Degree | 0 (0.0%) | 0.0 |
| Graduate Degree | 0 (0.0%) | 0.0 |
| Total | 0 (0.0%) | 0.0 |
Fertility by Education by Marriage Status in Temperanceville
| Educational Attainment | Married | Unmarried |
| Less than High School | 0 (0.0%) | 0 (0.0%) |
| High School Diploma | 0 (0.0%) | 0 (0.0%) |
| College or Associate's Degree | 0 (0.0%) | 0 (0.0%) |
| Bachelor's Degree | 0 (0.0%) | 0 (0.0%) |
| Graduate Degree | 0 (0.0%) | 0 (0.0%) |
| Total | 0 (0.0%) | 0 (0.0%) |
Employment Characteristics in Temperanceville
Employment by Class of Employer in Temperanceville
Among the 125 employed individuals in Temperanceville, private company employees (107 | 85.6%), and federal government employees (18 | 14.4%) make up the most common classes of employment.
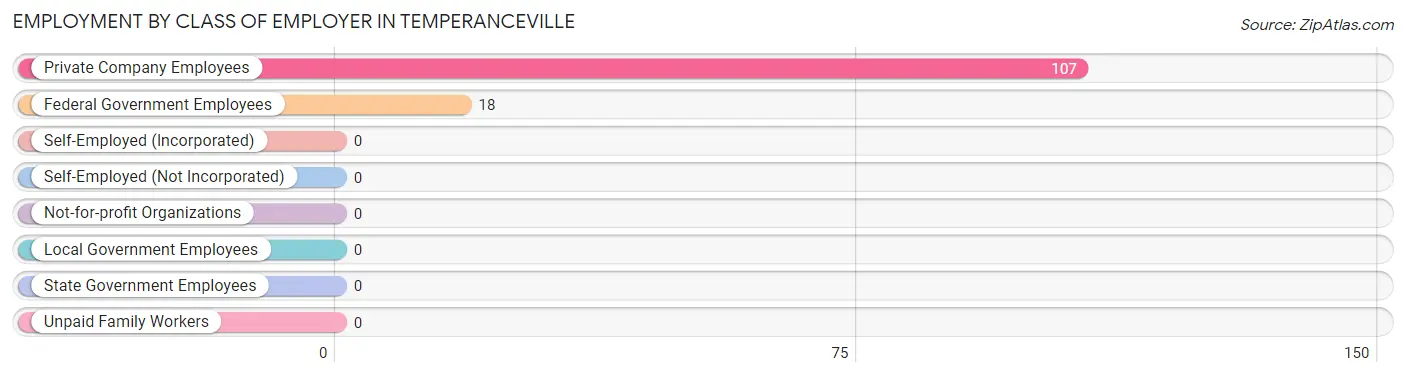
| Employer Class | # Employees | % Employees |
| Private Company Employees | 107 | 85.6% |
| Self-Employed (Incorporated) | 0 | 0.0% |
| Self-Employed (Not Incorporated) | 0 | 0.0% |
| Not-for-profit Organizations | 0 | 0.0% |
| Local Government Employees | 0 | 0.0% |
| State Government Employees | 0 | 0.0% |
| Federal Government Employees | 18 | 14.4% |
| Unpaid Family Workers | 0 | 0.0% |
| Total | 125 | 100.0% |
Employment Status by Age in Temperanceville
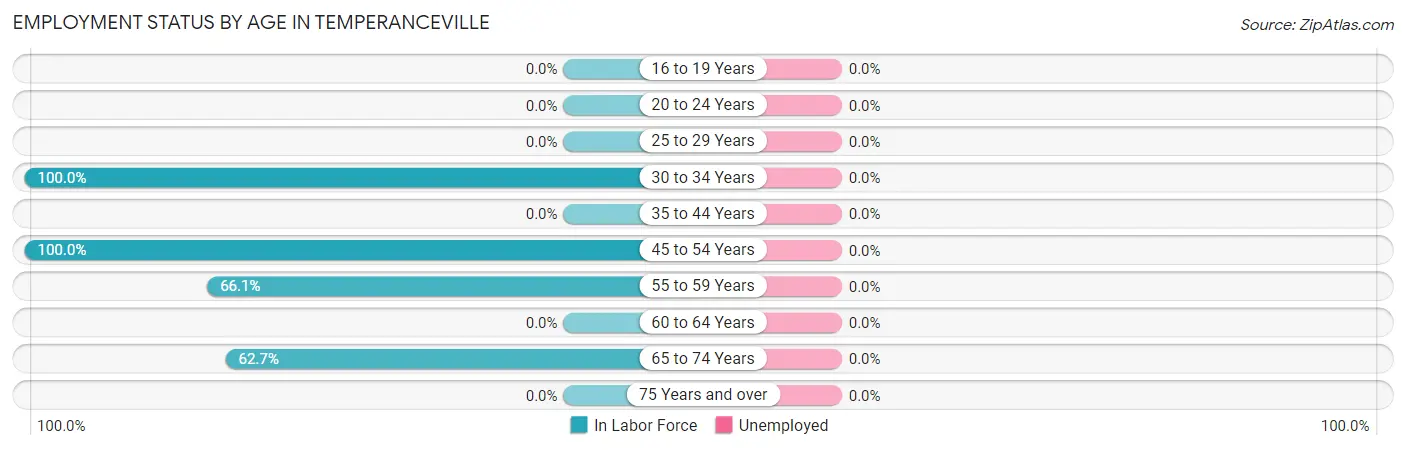
| Age Bracket | In Labor Force | Unemployed |
| 16 to 19 Years | 0 (0.0%) | 0 (0.0%) |
| 20 to 24 Years | 0 (0.0%) | 0 (0.0%) |
| 25 to 29 Years | 0 (0.0%) | 0 (0.0%) |
| 30 to 34 Years | 22 (100.0%) | 0 (0.0%) |
| 35 to 44 Years | 0 (0.0%) | 0 (0.0%) |
| 45 to 54 Years | 30 (100.0%) | 0 (0.0%) |
| 55 to 59 Years | 41 (66.1%) | 0 (0.0%) |
| 60 to 64 Years | 0 (0.0%) | 0 (0.0%) |
| 65 to 74 Years | 32 (62.7%) | 0 (0.0%) |
| 75 Years and over | 0 (0.0%) | 0 (0.0%) |
| Total | 125 (65.8%) | 0 (0.0%) |
Employment Status by Educational Attainment in Temperanceville
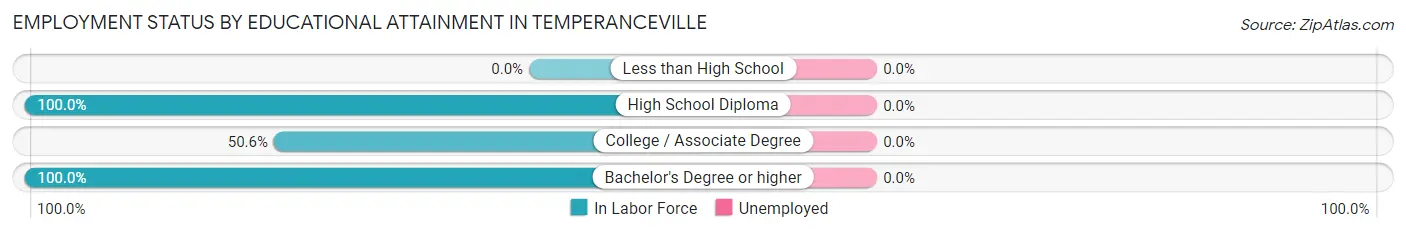
| Educational Attainment | In Labor Force | Unemployed |
| Less than High School | 0 (0.0%) | 0 (0.0%) |
| High School Diploma | 17 (100.0%) | 0 (0.0%) |
| College / Associate Degree | 40 (50.6%) | 0 (0.0%) |
| Bachelor's Degree or higher | 36 (100.0%) | 0 (0.0%) |
| Total | 93 (66.9%) | 0 (0.0%) |
Employment Occupations by Sex in Temperanceville
Management, Business, Science and Arts Occupations
The most common Management, Business, Science and Arts occupations in Temperanceville are Management (33 | 26.4%), Business & Financial (14 | 11.2%), Health Diagnosing & Treating (14 | 11.2%), and Health Technologists (14 | 11.2%).
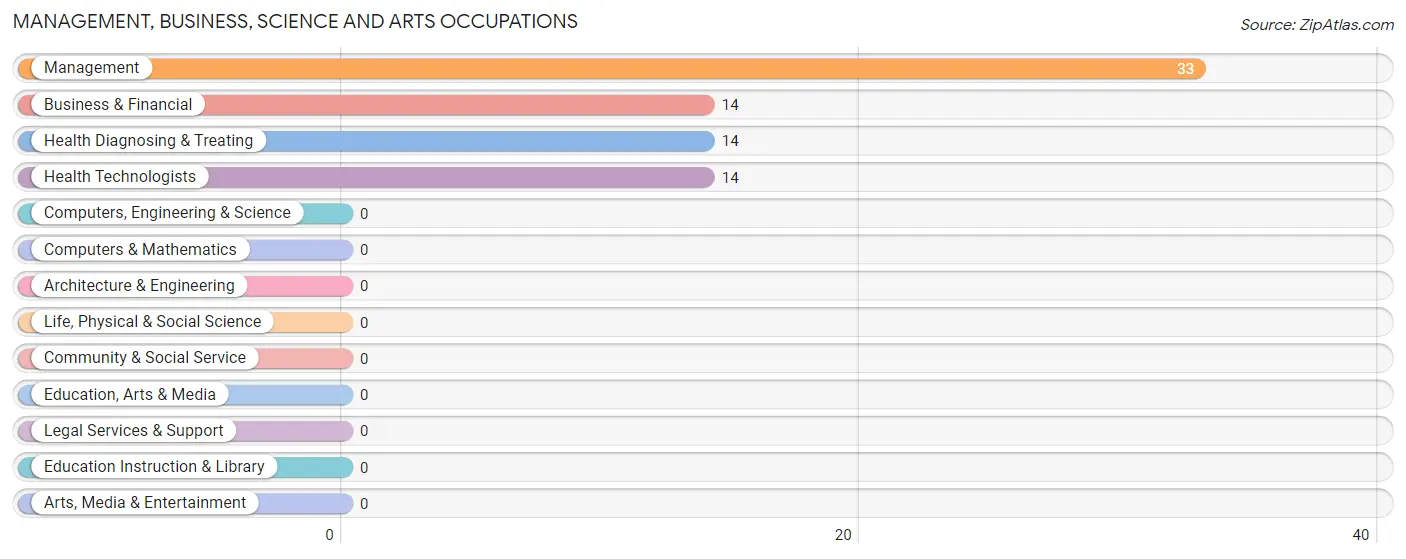
Management, Business, Science and Arts Occupations by Sex
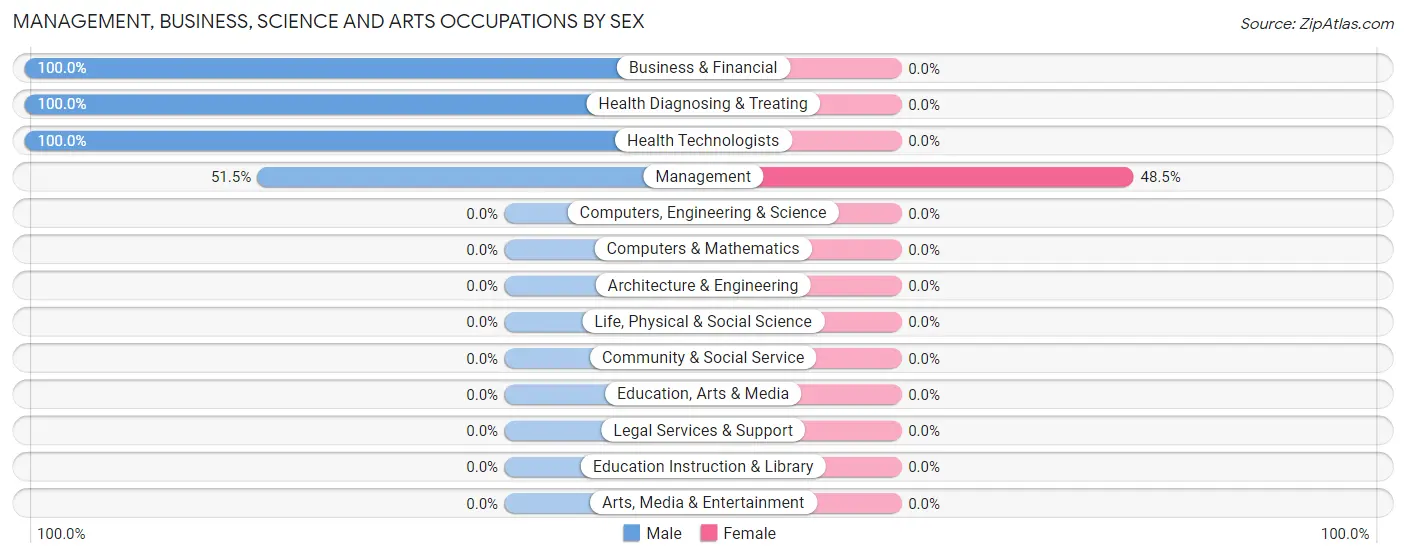
| Occupation | Male | Female |
| Management | 17 (51.5%) | 16 (48.5%) |
| Business & Financial | 14 (100.0%) | 0 (0.0%) |
| Computers, Engineering & Science | 0 (0.0%) | 0 (0.0%) |
| Computers & Mathematics | 0 (0.0%) | 0 (0.0%) |
| Architecture & Engineering | 0 (0.0%) | 0 (0.0%) |
| Life, Physical & Social Science | 0 (0.0%) | 0 (0.0%) |
| Community & Social Service | 0 (0.0%) | 0 (0.0%) |
| Education, Arts & Media | 0 (0.0%) | 0 (0.0%) |
| Legal Services & Support | 0 (0.0%) | 0 (0.0%) |
| Education Instruction & Library | 0 (0.0%) | 0 (0.0%) |
| Arts, Media & Entertainment | 0 (0.0%) | 0 (0.0%) |
| Health Diagnosing & Treating | 14 (100.0%) | 0 (0.0%) |
| Health Technologists | 14 (100.0%) | 0 (0.0%) |
| Total (Category) | 45 (73.8%) | 16 (26.2%) |
| Total (Overall) | 51 (40.8%) | 74 (59.2%) |
Services Occupations
The most common Services occupations in Temperanceville are Healthcare Support (22 | 17.6%), and Food Preparation & Serving (18 | 14.4%).
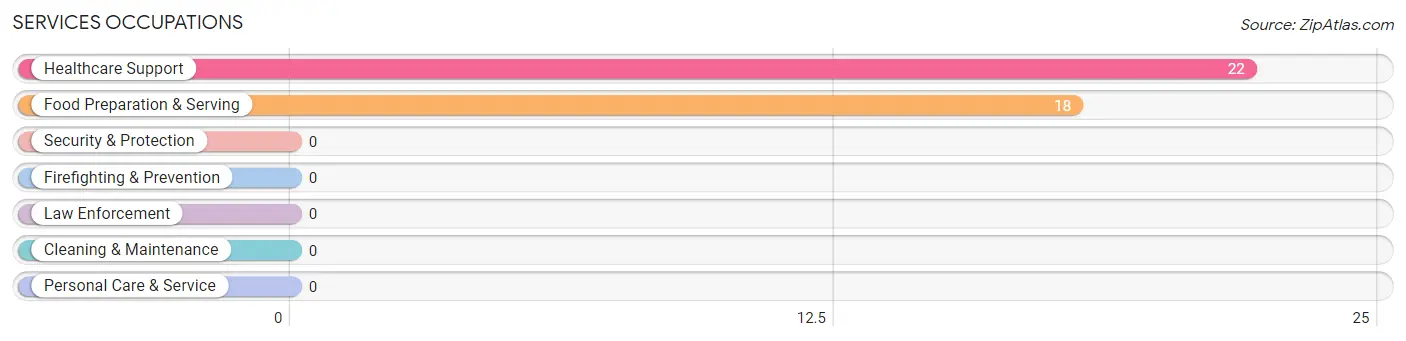
Services Occupations by Sex
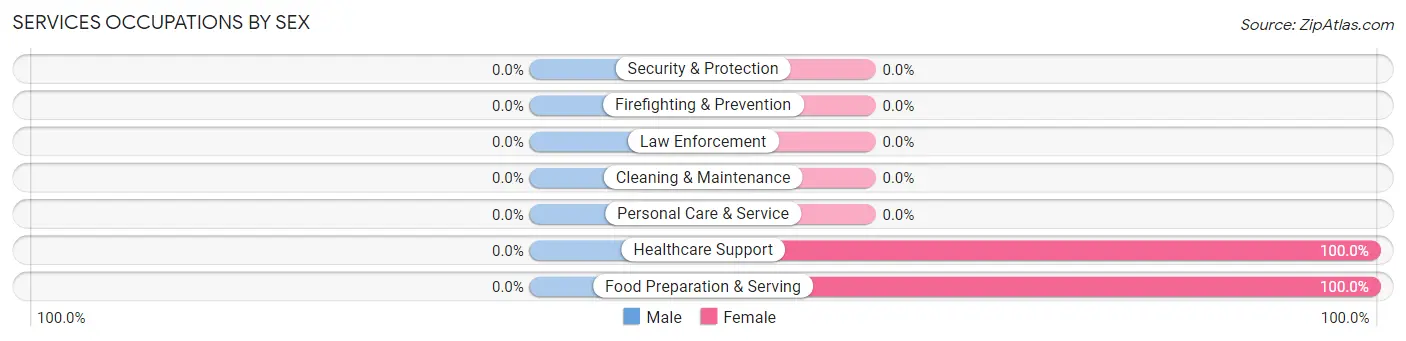
| Occupation | Male | Female |
| Healthcare Support | 0 (0.0%) | 22 (100.0%) |
| Security & Protection | 0 (0.0%) | 0 (0.0%) |
| Firefighting & Prevention | 0 (0.0%) | 0 (0.0%) |
| Law Enforcement | 0 (0.0%) | 0 (0.0%) |
| Food Preparation & Serving | 0 (0.0%) | 18 (100.0%) |
| Cleaning & Maintenance | 0 (0.0%) | 0 (0.0%) |
| Personal Care & Service | 0 (0.0%) | 0 (0.0%) |
| Total (Category) | 0 (0.0%) | 40 (100.0%) |
| Total (Overall) | 51 (40.8%) | 74 (59.2%) |
Sales and Office Occupations
The most common Sales and Office occupations in Temperanceville are , and Office & Administration (18 | 14.4%).
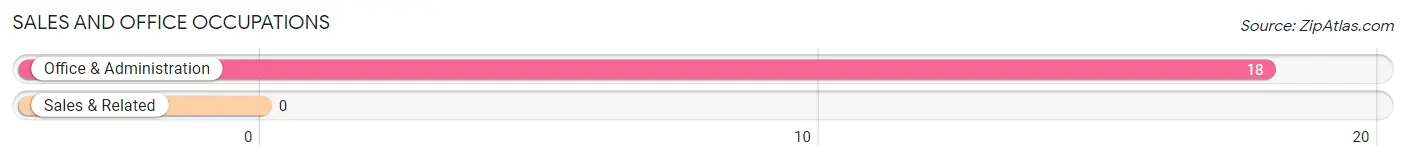
Sales and Office Occupations by Sex

| Occupation | Male | Female |
| Sales & Related | 0 (0.0%) | 0 (0.0%) |
| Office & Administration | 0 (0.0%) | 18 (100.0%) |
| Total (Category) | 0 (0.0%) | 18 (100.0%) |
| Total (Overall) | 51 (40.8%) | 74 (59.2%) |
Natural Resources, Construction and Maintenance Occupations

Natural Resources, Construction and Maintenance Occupations by Sex
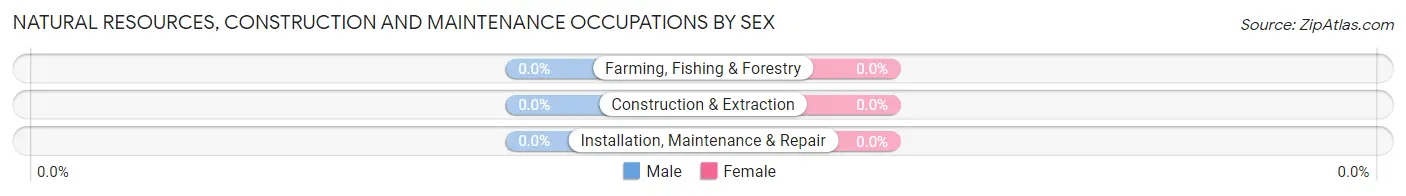
| Occupation | Male | Female |
| Farming, Fishing & Forestry | 0 (0.0%) | 0 (0.0%) |
| Construction & Extraction | 0 (0.0%) | 0 (0.0%) |
| Installation, Maintenance & Repair | 0 (0.0%) | 0 (0.0%) |
| Total (Category) | 0 (0.0%) | 0 (0.0%) |
| Total (Overall) | 51 (40.8%) | 74 (59.2%) |
Production, Transportation and Moving Occupations
The most common Production, Transportation and Moving occupations in Temperanceville are , and Production (6 | 4.8%).
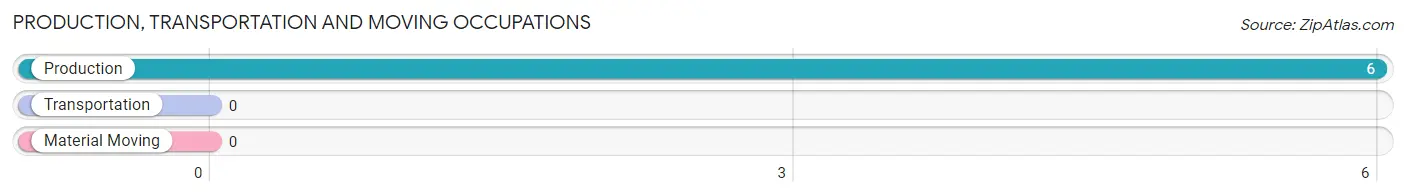
Production, Transportation and Moving Occupations by Sex
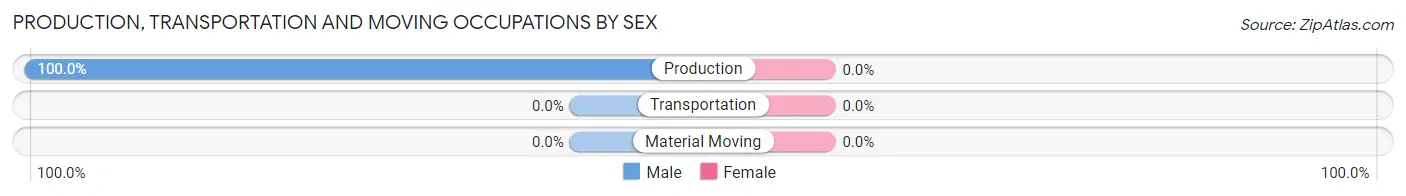
| Occupation | Male | Female |
| Production | 6 (100.0%) | 0 (0.0%) |
| Transportation | 0 (0.0%) | 0 (0.0%) |
| Material Moving | 0 (0.0%) | 0 (0.0%) |
| Total (Category) | 6 (100.0%) | 0 (0.0%) |
| Total (Overall) | 51 (40.8%) | 74 (59.2%) |
Employment Industries by Sex in Temperanceville
Employment Industries in Temperanceville
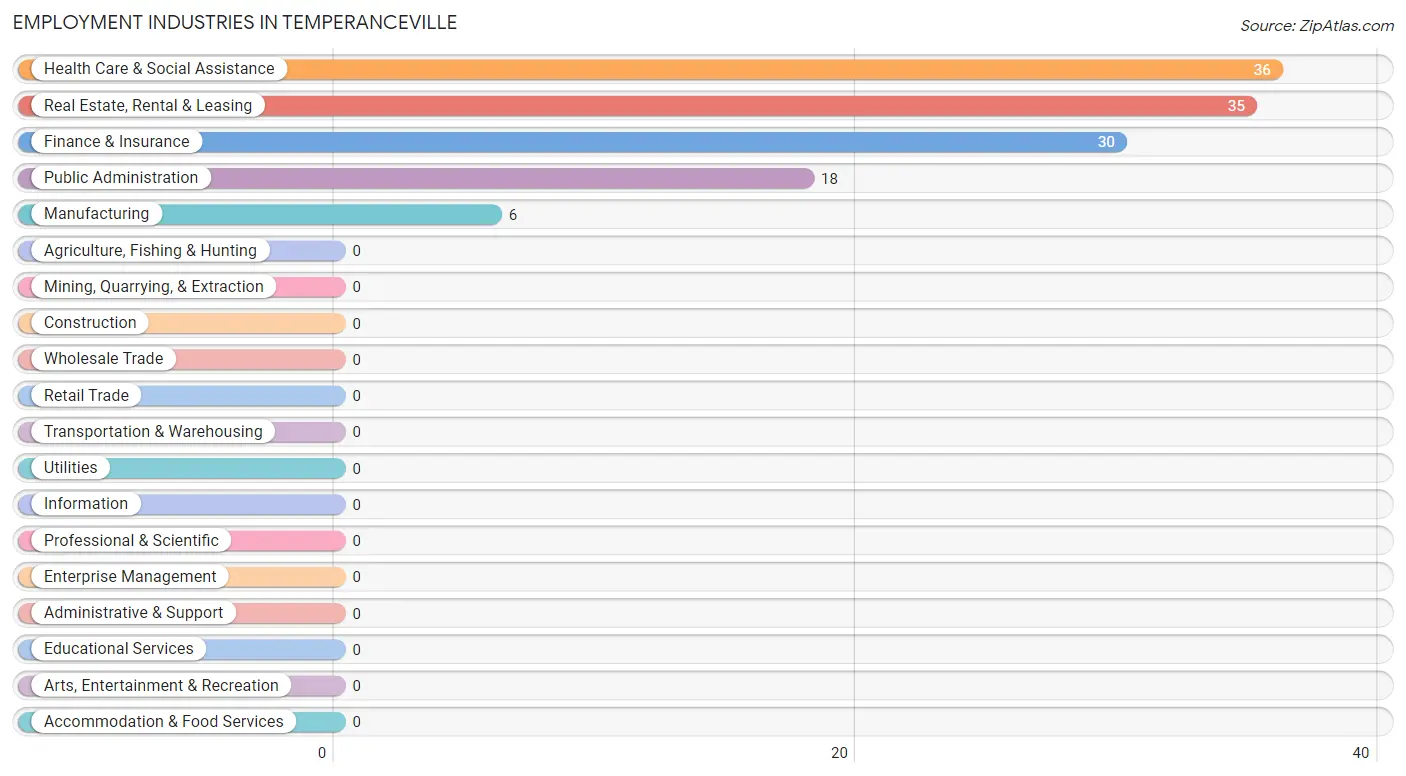
The major employment industries in Temperanceville include Health Care & Social Assistance (36 | 28.8%), Real Estate, Rental & Leasing (35 | 28.0%), Finance & Insurance (30 | 24.0%), Public Administration (18 | 14.4%), and Manufacturing (6 | 4.8%).
Employment Industries by Sex in Temperanceville
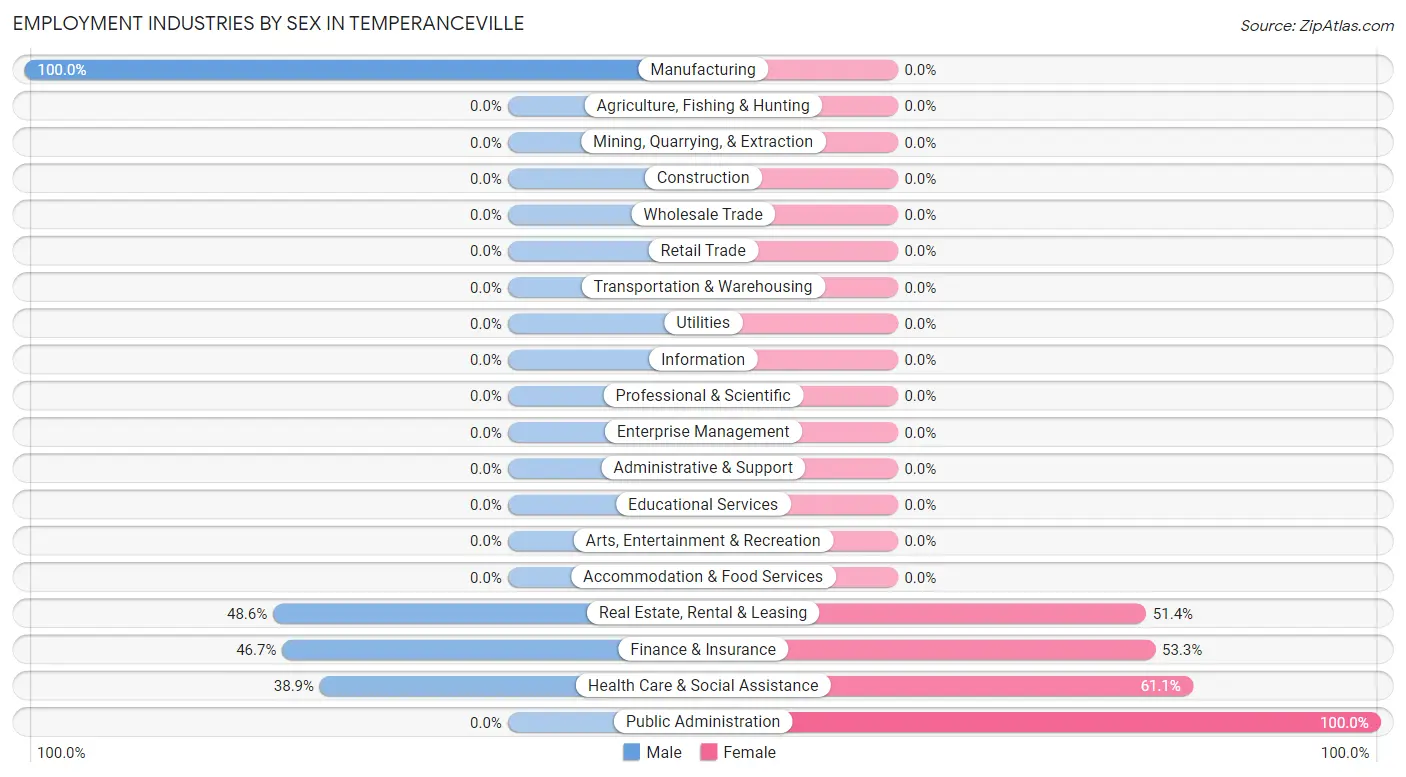
The Temperanceville industries that see more men than women are Manufacturing (100.0%), Real Estate, Rental & Leasing (48.6%), and Finance & Insurance (46.7%), whereas the industries that tend to have a higher number of women are Public Administration (100.0%), Health Care & Social Assistance (61.1%), and Finance & Insurance (53.3%).
| Industry | Male | Female |
| Agriculture, Fishing & Hunting | 0 (0.0%) | 0 (0.0%) |
| Mining, Quarrying, & Extraction | 0 (0.0%) | 0 (0.0%) |
| Construction | 0 (0.0%) | 0 (0.0%) |
| Manufacturing | 6 (100.0%) | 0 (0.0%) |
| Wholesale Trade | 0 (0.0%) | 0 (0.0%) |
| Retail Trade | 0 (0.0%) | 0 (0.0%) |
| Transportation & Warehousing | 0 (0.0%) | 0 (0.0%) |
| Utilities | 0 (0.0%) | 0 (0.0%) |
| Information | 0 (0.0%) | 0 (0.0%) |
| Finance & Insurance | 14 (46.7%) | 16 (53.3%) |
| Real Estate, Rental & Leasing | 17 (48.6%) | 18 (51.4%) |
| Professional & Scientific | 0 (0.0%) | 0 (0.0%) |
| Enterprise Management | 0 (0.0%) | 0 (0.0%) |
| Administrative & Support | 0 (0.0%) | 0 (0.0%) |
| Educational Services | 0 (0.0%) | 0 (0.0%) |
| Health Care & Social Assistance | 14 (38.9%) | 22 (61.1%) |
| Arts, Entertainment & Recreation | 0 (0.0%) | 0 (0.0%) |
| Accommodation & Food Services | 0 (0.0%) | 0 (0.0%) |
| Public Administration | 0 (0.0%) | 18 (100.0%) |
| Total | 51 (40.8%) | 74 (59.2%) |
Education in Temperanceville
School Enrollment in Temperanceville
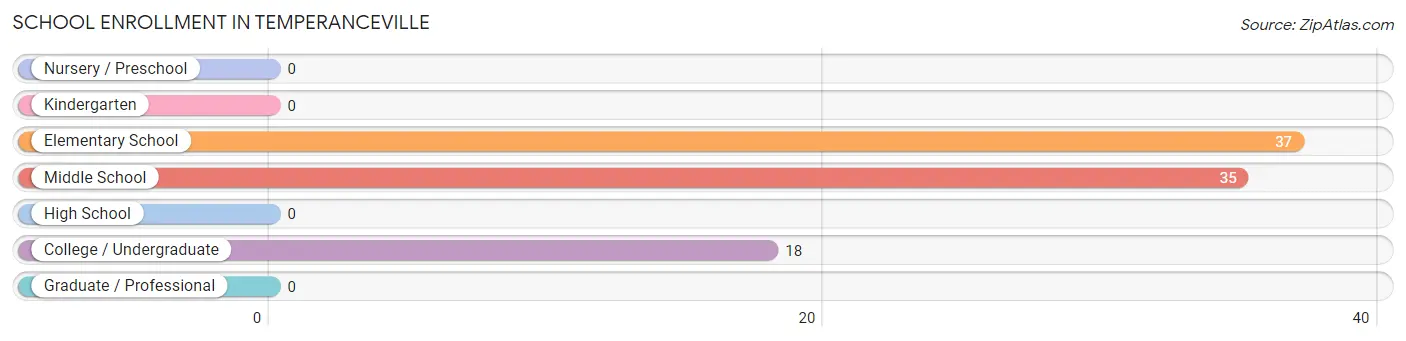
The most common levels of schooling among the 90 students in Temperanceville are elementary school (37 | 41.1%), middle school (35 | 38.9%), and college / undergraduate (18 | 20.0%).
| School Level | # Students | % Students |
| Nursery / Preschool | 0 | 0.0% |
| Kindergarten | 0 | 0.0% |
| Elementary School | 37 | 41.1% |
| Middle School | 35 | 38.9% |
| High School | 0 | 0.0% |
| College / Undergraduate | 18 | 20.0% |
| Graduate / Professional | 0 | 0.0% |
| Total | 90 | 100.0% |
School Enrollment by Age by Funding Source in Temperanceville
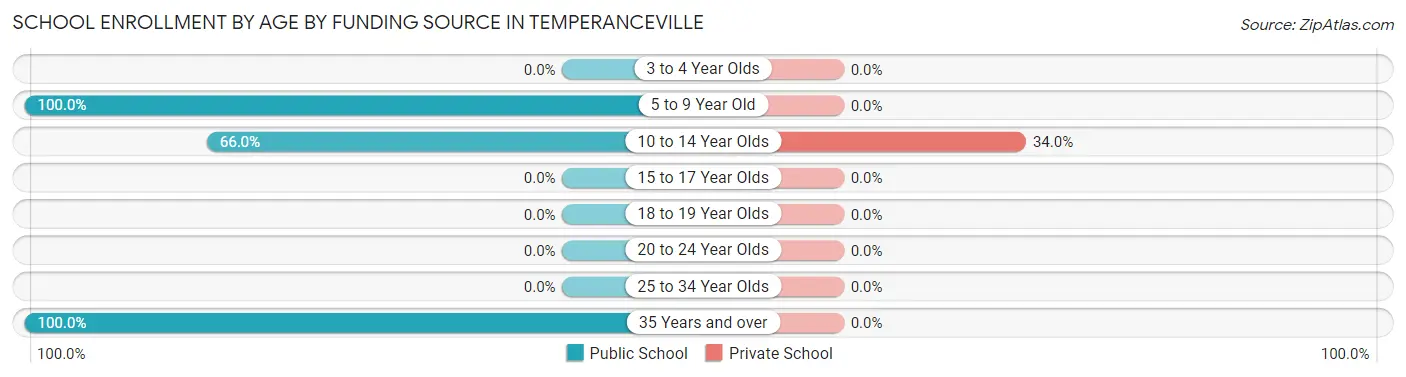
Out of a total of 90 students who are enrolled in schools in Temperanceville, 18 (20.0%) attend a private institution, while the remaining 72 (80.0%) are enrolled in public schools. The age group of 10 to 14 year olds has the highest likelihood of being enrolled in private schools, with 18 (34.0% in the age bracket) enrolled. Conversely, the age group of 5 to 9 year old has the lowest likelihood of being enrolled in a private school, with 19 (100.0% in the age bracket) attending a public institution.
| Age Bracket | Public School | Private School |
| 3 to 4 Year Olds | 0 (0.0%) | 0 (0.0%) |
| 5 to 9 Year Old | 19 (100.0%) | 0 (0.0%) |
| 10 to 14 Year Olds | 35 (66.0%) | 18 (34.0%) |
| 15 to 17 Year Olds | 0 (0.0%) | 0 (0.0%) |
| 18 to 19 Year Olds | 0 (0.0%) | 0 (0.0%) |
| 20 to 24 Year Olds | 0 (0.0%) | 0 (0.0%) |
| 25 to 34 Year Olds | 0 (0.0%) | 0 (0.0%) |
| 35 Years and over | 18 (100.0%) | 0 (0.0%) |
| Total | 72 (80.0%) | 18 (20.0%) |
Educational Attainment by Field of Study in Temperanceville
Social sciences (18 | 24.3%), visual & performing arts (16 | 21.6%), literature & languages (14 | 18.9%), liberal arts & history (14 | 18.9%), and business (12 | 16.2%) are the most common fields of study among 74 individuals in Temperanceville who have obtained a bachelor's degree or higher.
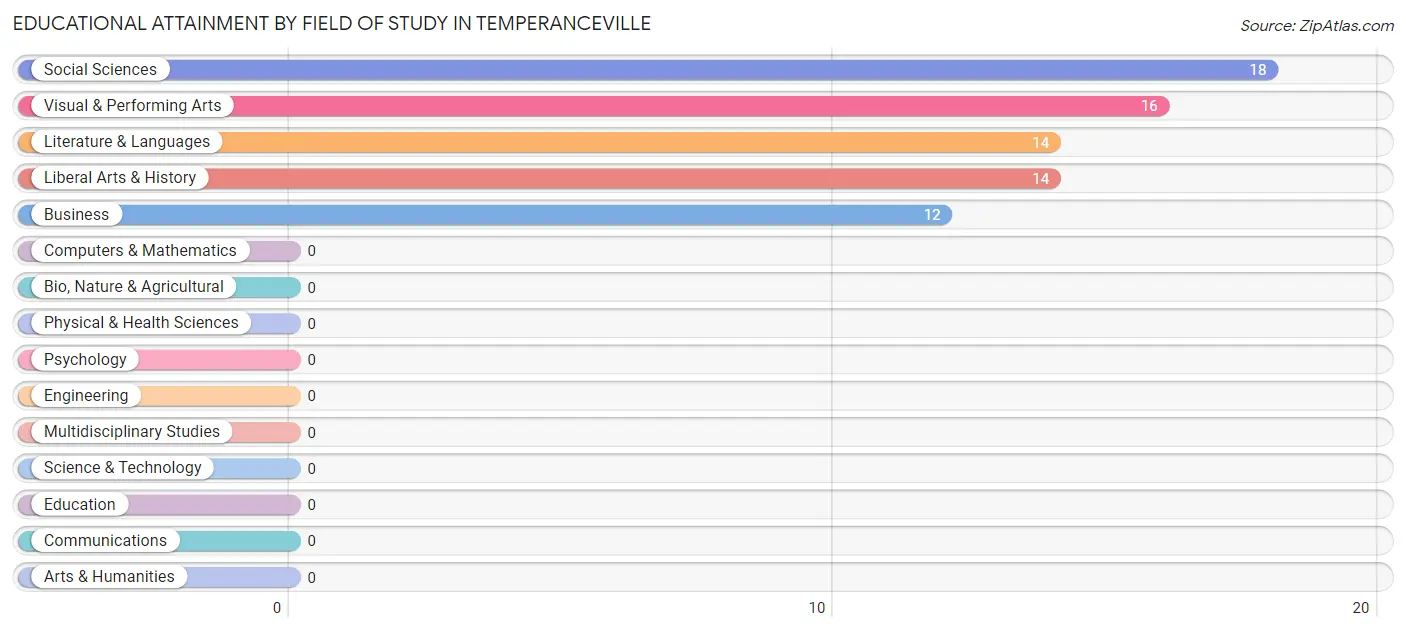
| Field of Study | # Graduates | % Graduates |
| Computers & Mathematics | 0 | 0.0% |
| Bio, Nature & Agricultural | 0 | 0.0% |
| Physical & Health Sciences | 0 | 0.0% |
| Psychology | 0 | 0.0% |
| Social Sciences | 18 | 24.3% |
| Engineering | 0 | 0.0% |
| Multidisciplinary Studies | 0 | 0.0% |
| Science & Technology | 0 | 0.0% |
| Business | 12 | 16.2% |
| Education | 0 | 0.0% |
| Literature & Languages | 14 | 18.9% |
| Liberal Arts & History | 14 | 18.9% |
| Visual & Performing Arts | 16 | 21.6% |
| Communications | 0 | 0.0% |
| Arts & Humanities | 0 | 0.0% |
| Total | 74 | 100.0% |
Transportation & Commute in Temperanceville
Vehicle Availability by Sex in Temperanceville
The most prevalent vehicle ownership categories in Temperanceville are males with 3 vehicles (31, accounting for 60.8%) and females with 3 vehicles (56, making up 41.9%).
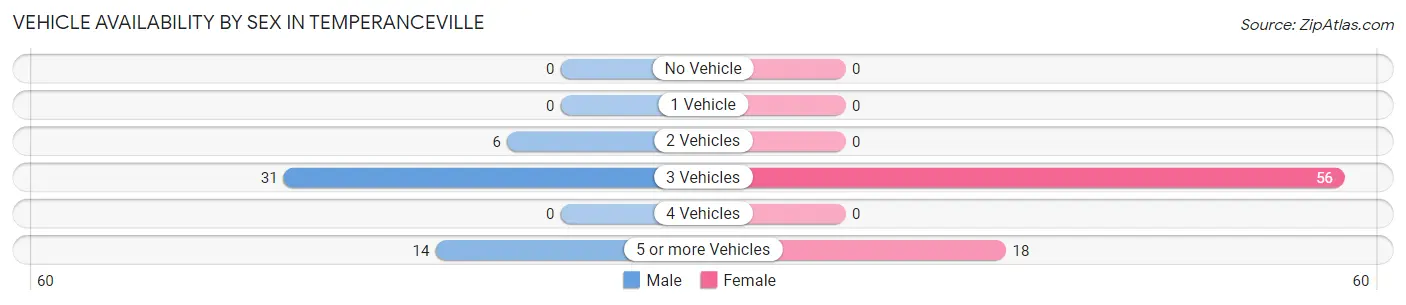
| Vehicles Available | Male | Female |
| No Vehicle | 0 (0.0%) | 0 (0.0%) |
| 1 Vehicle | 0 (0.0%) | 0 (0.0%) |
| 2 Vehicles | 6 (11.8%) | 0 (0.0%) |
| 3 Vehicles | 31 (60.8%) | 56 (75.7%) |
| 4 Vehicles | 0 (0.0%) | 0 (0.0%) |
| 5 or more Vehicles | 14 (27.5%) | 18 (24.3%) |
| Total | 51 (100.0%) | 74 (100.0%) |
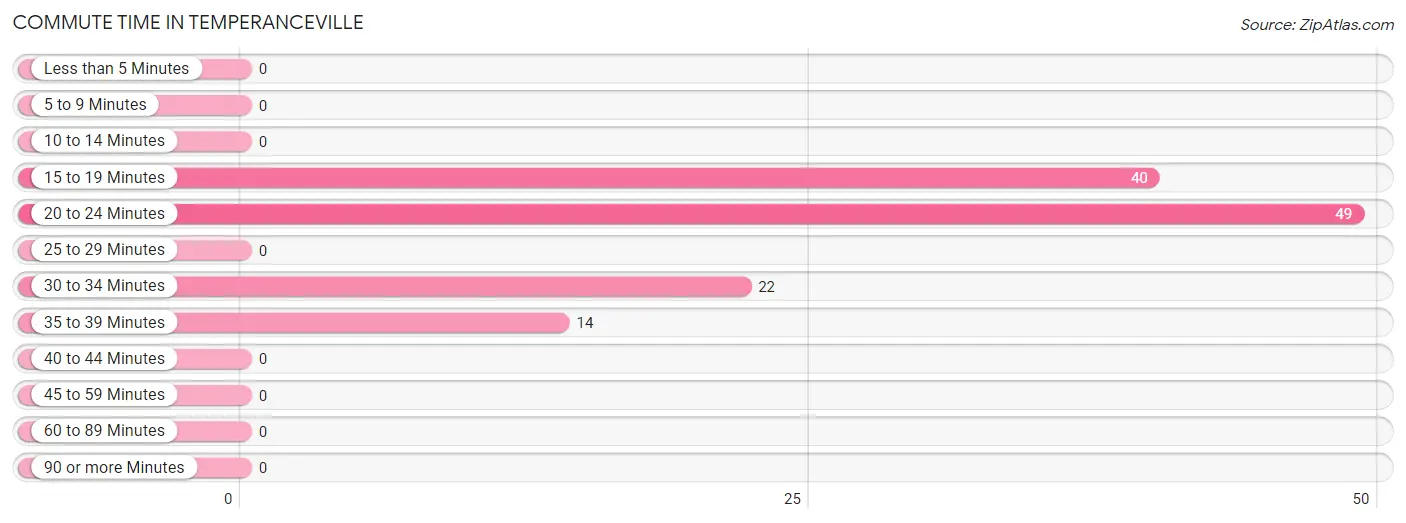
Commute Time in Temperanceville
The most frequently occuring commute durations in Temperanceville are 20 to 24 minutes (49 commuters, 39.2%), 15 to 19 minutes (40 commuters, 32.0%), and 30 to 34 minutes (22 commuters, 17.6%).
| Commute Time | # Commuters | % Commuters |
| Less than 5 Minutes | 0 | 0.0% |
| 5 to 9 Minutes | 0 | 0.0% |
| 10 to 14 Minutes | 0 | 0.0% |
| 15 to 19 Minutes | 40 | 32.0% |
| 20 to 24 Minutes | 49 | 39.2% |
| 25 to 29 Minutes | 0 | 0.0% |
| 30 to 34 Minutes | 22 | 17.6% |
| 35 to 39 Minutes | 14 | 11.2% |
| 40 to 44 Minutes | 0 | 0.0% |
| 45 to 59 Minutes | 0 | 0.0% |
| 60 to 89 Minutes | 0 | 0.0% |
| 90 or more Minutes | 0 | 0.0% |
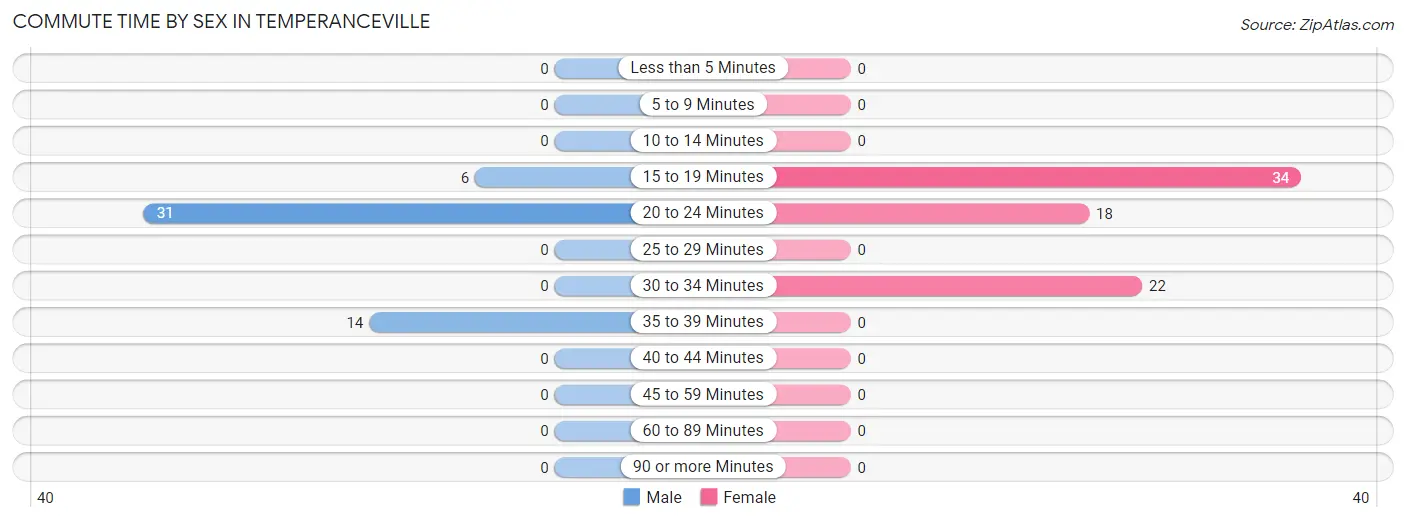
Commute Time by Sex in Temperanceville
The most common commute times in Temperanceville are 20 to 24 minutes (31 commuters, 60.8%) for males and 15 to 19 minutes (34 commuters, 46.0%) for females.
| Commute Time | Male | Female |
| Less than 5 Minutes | 0 (0.0%) | 0 (0.0%) |
| 5 to 9 Minutes | 0 (0.0%) | 0 (0.0%) |
| 10 to 14 Minutes | 0 (0.0%) | 0 (0.0%) |
| 15 to 19 Minutes | 6 (11.8%) | 34 (46.0%) |
| 20 to 24 Minutes | 31 (60.8%) | 18 (24.3%) |
| 25 to 29 Minutes | 0 (0.0%) | 0 (0.0%) |
| 30 to 34 Minutes | 0 (0.0%) | 22 (29.7%) |
| 35 to 39 Minutes | 14 (27.5%) | 0 (0.0%) |
| 40 to 44 Minutes | 0 (0.0%) | 0 (0.0%) |
| 45 to 59 Minutes | 0 (0.0%) | 0 (0.0%) |
| 60 to 89 Minutes | 0 (0.0%) | 0 (0.0%) |
| 90 or more Minutes | 0 (0.0%) | 0 (0.0%) |
Time of Departure to Work by Sex in Temperanceville
The most frequent times of departure to work in Temperanceville are 4:00 PM to 11:59 PM (17, 33.3%) for males and 7:00 AM to 7:29 AM (36, 48.6%) for females.
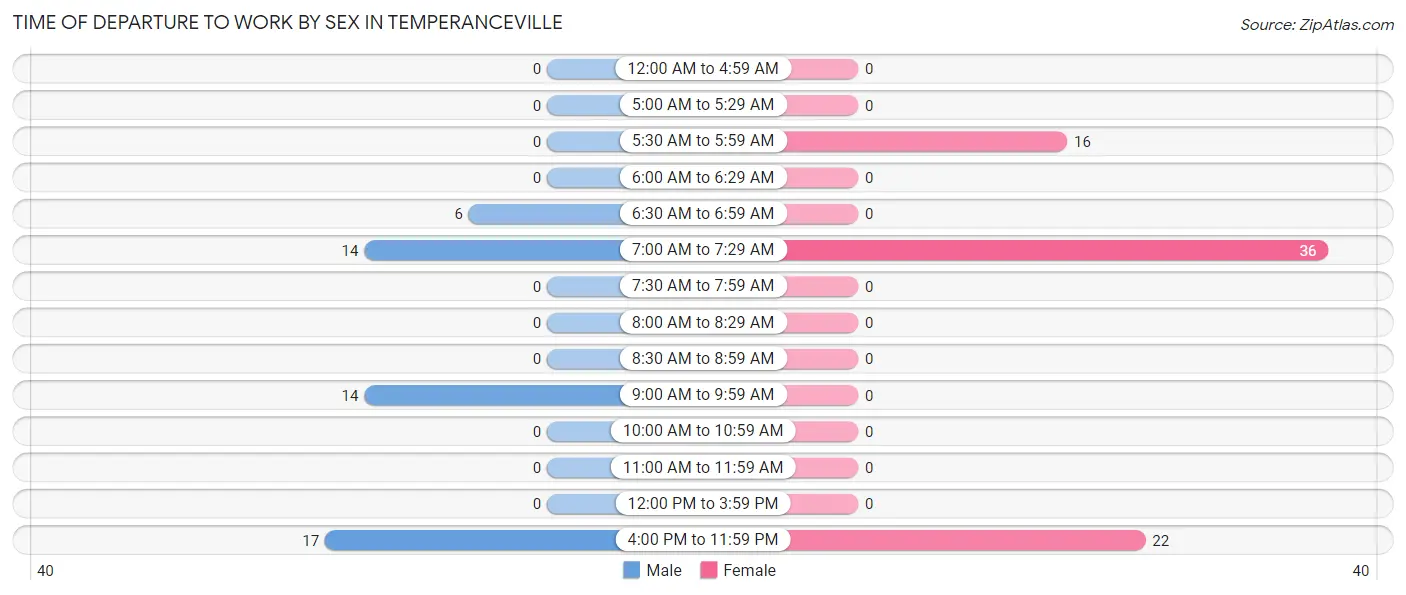
| Time of Departure | Male | Female |
| 12:00 AM to 4:59 AM | 0 (0.0%) | 0 (0.0%) |
| 5:00 AM to 5:29 AM | 0 (0.0%) | 0 (0.0%) |
| 5:30 AM to 5:59 AM | 0 (0.0%) | 16 (21.6%) |
| 6:00 AM to 6:29 AM | 0 (0.0%) | 0 (0.0%) |
| 6:30 AM to 6:59 AM | 6 (11.8%) | 0 (0.0%) |
| 7:00 AM to 7:29 AM | 14 (27.5%) | 36 (48.6%) |
| 7:30 AM to 7:59 AM | 0 (0.0%) | 0 (0.0%) |
| 8:00 AM to 8:29 AM | 0 (0.0%) | 0 (0.0%) |
| 8:30 AM to 8:59 AM | 0 (0.0%) | 0 (0.0%) |
| 9:00 AM to 9:59 AM | 14 (27.5%) | 0 (0.0%) |
| 10:00 AM to 10:59 AM | 0 (0.0%) | 0 (0.0%) |
| 11:00 AM to 11:59 AM | 0 (0.0%) | 0 (0.0%) |
| 12:00 PM to 3:59 PM | 0 (0.0%) | 0 (0.0%) |
| 4:00 PM to 11:59 PM | 17 (33.3%) | 22 (29.7%) |
| Total | 51 (100.0%) | 74 (100.0%) |
Housing Occupancy in Temperanceville
Occupancy by Ownership in Temperanceville
Of the total 97 dwellings in Temperanceville, owner-occupied units account for 72 (74.2%), while renter-occupied units make up 25 (25.8%).
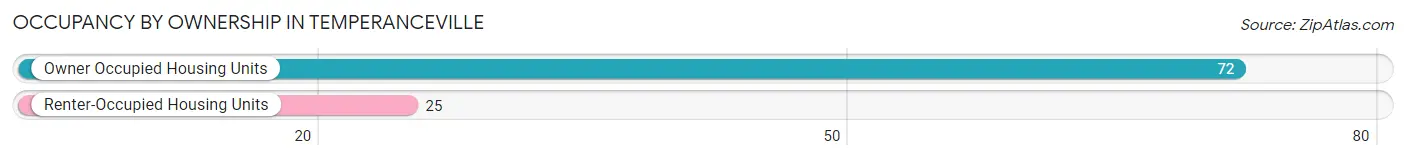
| Occupancy | # Housing Units | % Housing Units |
| Owner Occupied Housing Units | 72 | 74.2% |
| Renter-Occupied Housing Units | 25 | 25.8% |
| Total Occupied Housing Units | 97 | 100.0% |
Occupancy by Household Size in Temperanceville
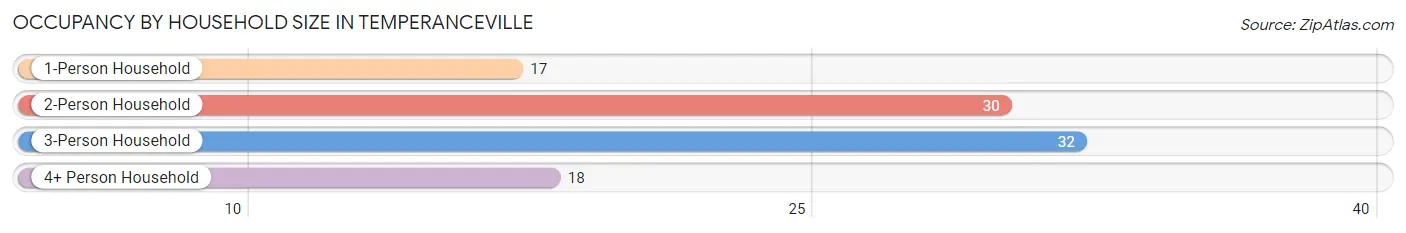
| Household Size | # Housing Units | % Housing Units |
| 1-Person Household | 17 | 17.5% |
| 2-Person Household | 30 | 30.9% |
| 3-Person Household | 32 | 33.0% |
| 4+ Person Household | 18 | 18.6% |
| Total Housing Units | 97 | 100.0% |
Occupancy by Ownership by Household Size in Temperanceville
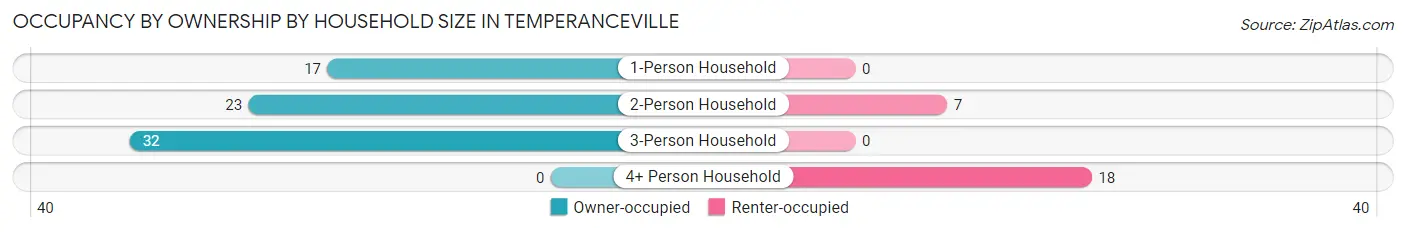
| Household Size | Owner-occupied | Renter-occupied |
| 1-Person Household | 17 (100.0%) | 0 (0.0%) |
| 2-Person Household | 23 (76.7%) | 7 (23.3%) |
| 3-Person Household | 32 (100.0%) | 0 (0.0%) |
| 4+ Person Household | 0 (0.0%) | 18 (100.0%) |
| Total Housing Units | 72 (74.2%) | 25 (25.8%) |
Occupancy by Educational Attainment in Temperanceville
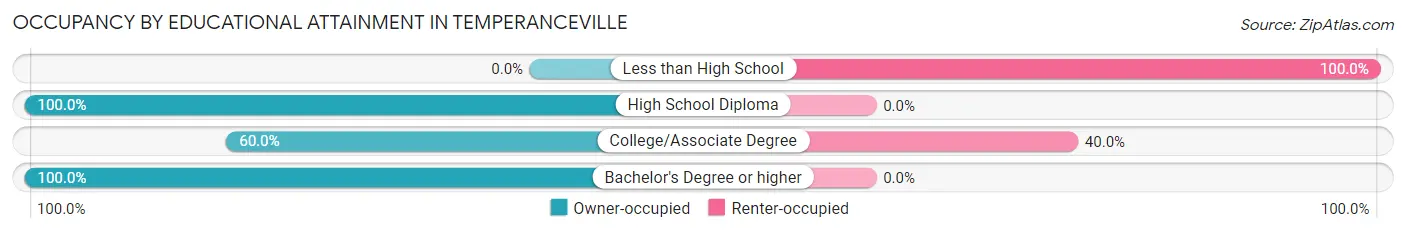
| Household Size | Owner-occupied | Renter-occupied |
| Less than High School | 0 (0.0%) | 7 (100.0%) |
| High School Diploma | 5 (100.0%) | 0 (0.0%) |
| College/Associate Degree | 27 (60.0%) | 18 (40.0%) |
| Bachelor's Degree or higher | 40 (100.0%) | 0 (0.0%) |
Occupancy by Age of Householder in Temperanceville
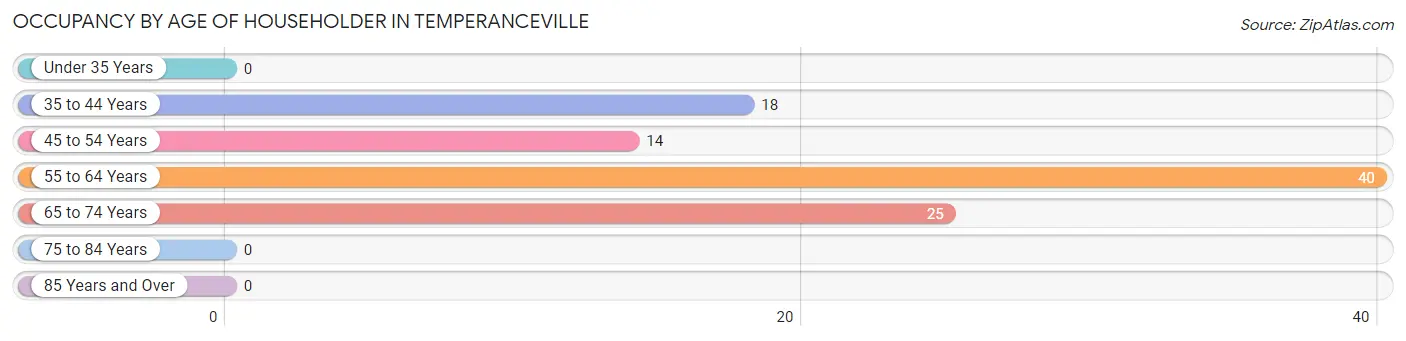
| Age Bracket | # Households | % Households |
| Under 35 Years | 0 | 0.0% |
| 35 to 44 Years | 18 | 18.6% |
| 45 to 54 Years | 14 | 14.4% |
| 55 to 64 Years | 40 | 41.2% |
| 65 to 74 Years | 25 | 25.8% |
| 75 to 84 Years | 0 | 0.0% |
| 85 Years and Over | 0 | 0.0% |
| Total | 97 | 100.0% |
Housing Finances in Temperanceville
Median Income by Occupancy in Temperanceville
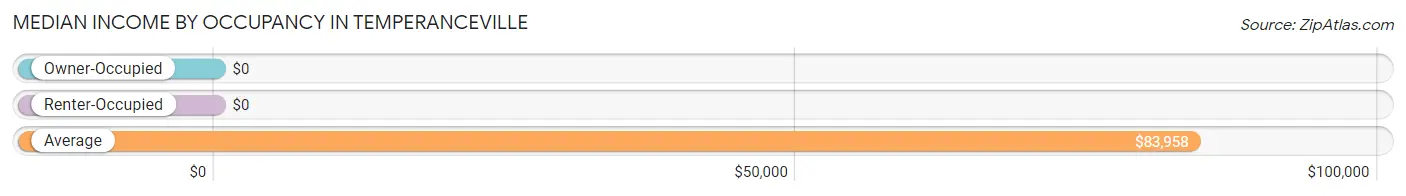
| Occupancy Type | # Households | Median Income |
| Owner-Occupied | 72 (74.2%) | $0 |
| Renter-Occupied | 25 (25.8%) | $0 |
| Average | 97 (100.0%) | $83,958 |
Occupancy by Householder Income Bracket in Temperanceville
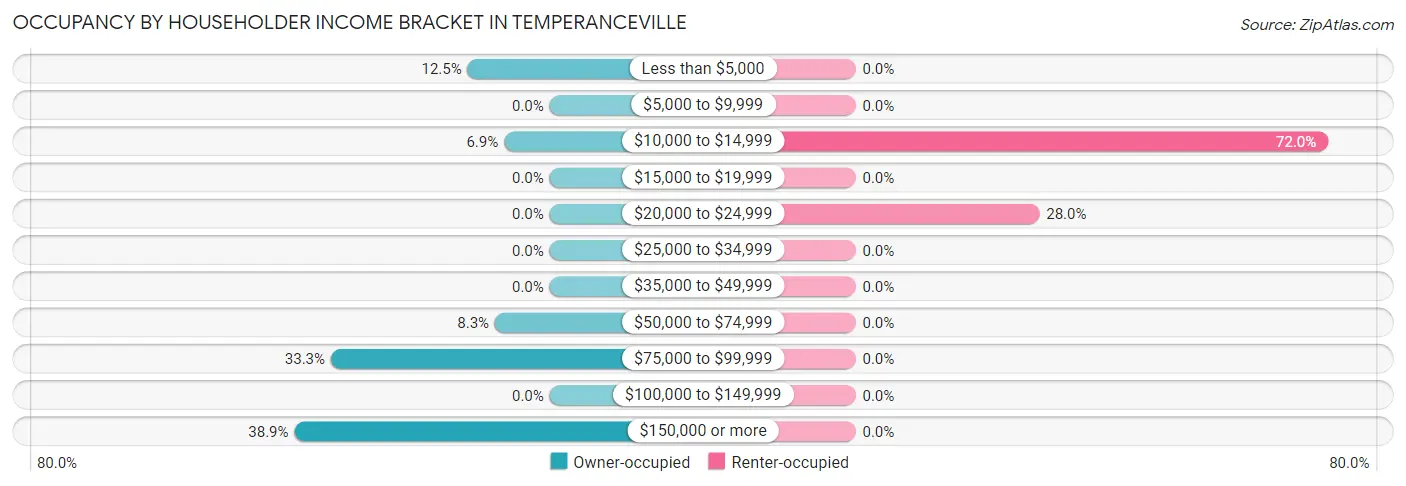
| Income Bracket | Owner-occupied | Renter-occupied |
| Less than $5,000 | 9 (12.5%) | 0 (0.0%) |
| $5,000 to $9,999 | 0 (0.0%) | 0 (0.0%) |
| $10,000 to $14,999 | 5 (6.9%) | 18 (72.0%) |
| $15,000 to $19,999 | 0 (0.0%) | 0 (0.0%) |
| $20,000 to $24,999 | 0 (0.0%) | 7 (28.0%) |
| $25,000 to $34,999 | 0 (0.0%) | 0 (0.0%) |
| $35,000 to $49,999 | 0 (0.0%) | 0 (0.0%) |
| $50,000 to $74,999 | 6 (8.3%) | 0 (0.0%) |
| $75,000 to $99,999 | 24 (33.3%) | 0 (0.0%) |
| $100,000 to $149,999 | 0 (0.0%) | 0 (0.0%) |
| $150,000 or more | 28 (38.9%) | 0 (0.0%) |
| Total | 72 (100.0%) | 25 (100.0%) |
Monthly Housing Cost Tiers in Temperanceville
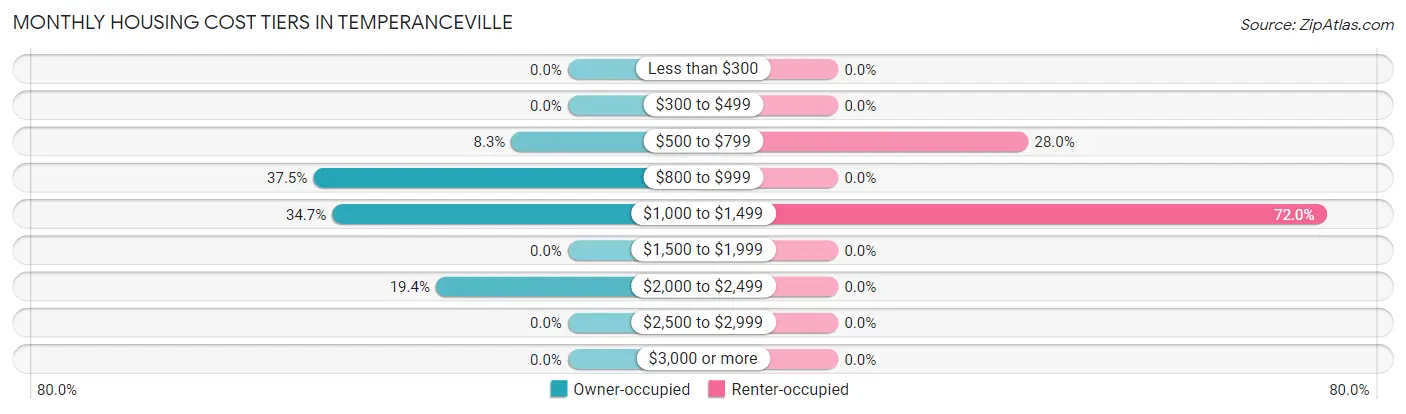
| Monthly Cost | Owner-occupied | Renter-occupied |
| Less than $300 | 0 (0.0%) | 0 (0.0%) |
| $300 to $499 | 0 (0.0%) | 0 (0.0%) |
| $500 to $799 | 6 (8.3%) | 7 (28.0%) |
| $800 to $999 | 27 (37.5%) | 0 (0.0%) |
| $1,000 to $1,499 | 25 (34.7%) | 18 (72.0%) |
| $1,500 to $1,999 | 0 (0.0%) | 0 (0.0%) |
| $2,000 to $2,499 | 14 (19.4%) | 0 (0.0%) |
| $2,500 to $2,999 | 0 (0.0%) | 0 (0.0%) |
| $3,000 or more | 0 (0.0%) | 0 (0.0%) |
| Total | 72 (100.0%) | 25 (100.0%) |
Physical Housing Characteristics in Temperanceville
Housing Structures in Temperanceville
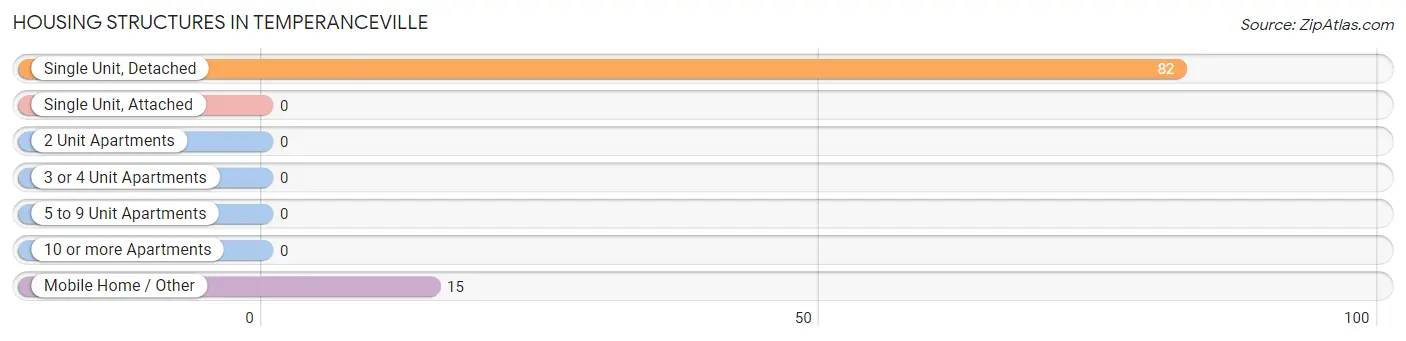
| Structure Type | # Housing Units | % Housing Units |
| Single Unit, Detached | 82 | 84.5% |
| Single Unit, Attached | 0 | 0.0% |
| 2 Unit Apartments | 0 | 0.0% |
| 3 or 4 Unit Apartments | 0 | 0.0% |
| 5 to 9 Unit Apartments | 0 | 0.0% |
| 10 or more Apartments | 0 | 0.0% |
| Mobile Home / Other | 15 | 15.5% |
| Total | 97 | 100.0% |
Housing Structures by Occupancy in Temperanceville
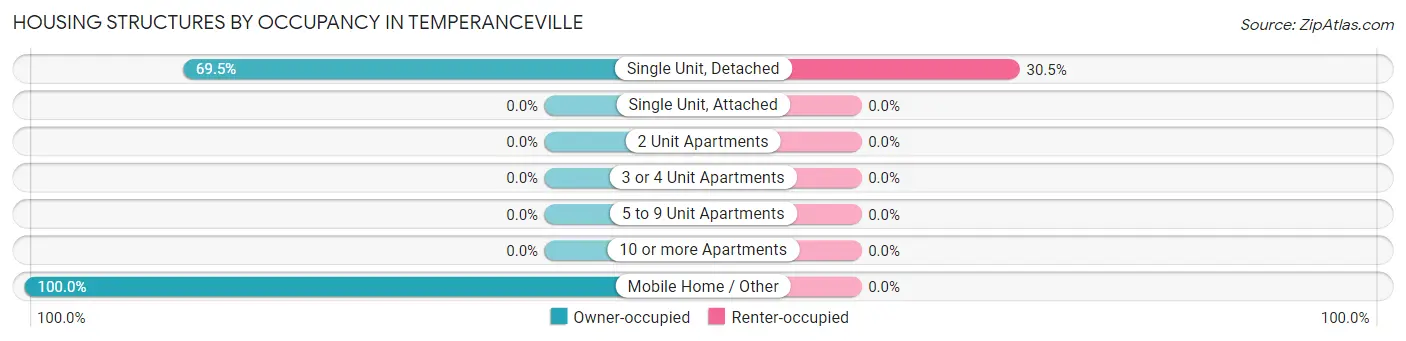
| Structure Type | Owner-occupied | Renter-occupied |
| Single Unit, Detached | 57 (69.5%) | 25 (30.5%) |
| Single Unit, Attached | 0 (0.0%) | 0 (0.0%) |
| 2 Unit Apartments | 0 (0.0%) | 0 (0.0%) |
| 3 or 4 Unit Apartments | 0 (0.0%) | 0 (0.0%) |
| 5 to 9 Unit Apartments | 0 (0.0%) | 0 (0.0%) |
| 10 or more Apartments | 0 (0.0%) | 0 (0.0%) |
| Mobile Home / Other | 15 (100.0%) | 0 (0.0%) |
| Total | 72 (74.2%) | 25 (25.8%) |
Housing Structures by Number of Rooms in Temperanceville
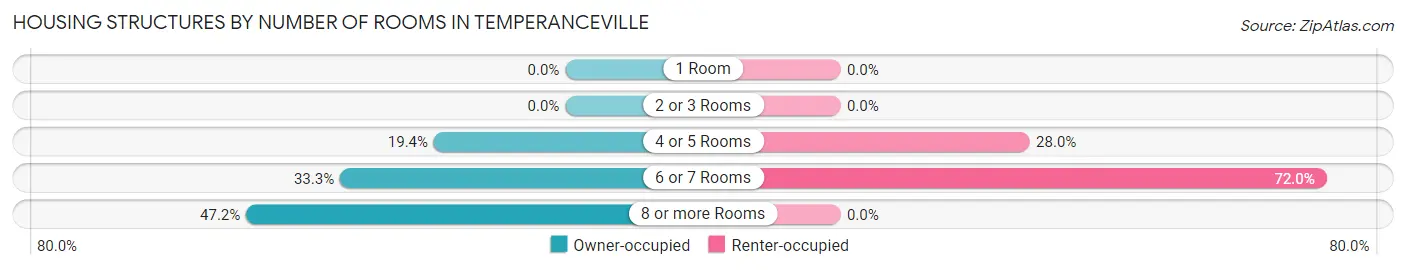
| Number of Rooms | Owner-occupied | Renter-occupied |
| 1 Room | 0 (0.0%) | 0 (0.0%) |
| 2 or 3 Rooms | 0 (0.0%) | 0 (0.0%) |
| 4 or 5 Rooms | 14 (19.4%) | 7 (28.0%) |
| 6 or 7 Rooms | 24 (33.3%) | 18 (72.0%) |
| 8 or more Rooms | 34 (47.2%) | 0 (0.0%) |
| Total | 72 (100.0%) | 25 (100.0%) |
Housing Structure by Heating Type in Temperanceville
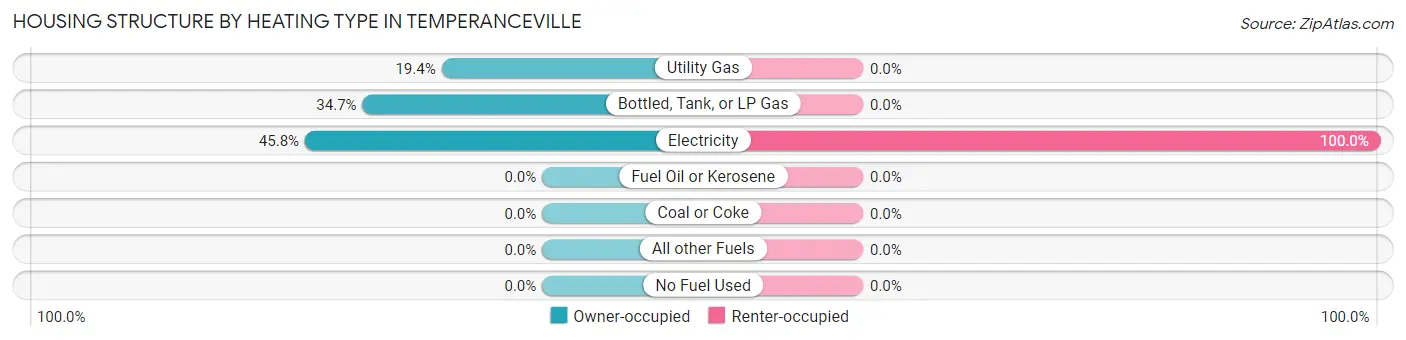
| Heating Type | Owner-occupied | Renter-occupied |
| Utility Gas | 14 (19.4%) | 0 (0.0%) |
| Bottled, Tank, or LP Gas | 25 (34.7%) | 0 (0.0%) |
| Electricity | 33 (45.8%) | 25 (100.0%) |
| Fuel Oil or Kerosene | 0 (0.0%) | 0 (0.0%) |
| Coal or Coke | 0 (0.0%) | 0 (0.0%) |
| All other Fuels | 0 (0.0%) | 0 (0.0%) |
| No Fuel Used | 0 (0.0%) | 0 (0.0%) |
| Total | 72 (100.0%) | 25 (100.0%) |
Household Vehicle Usage in Temperanceville
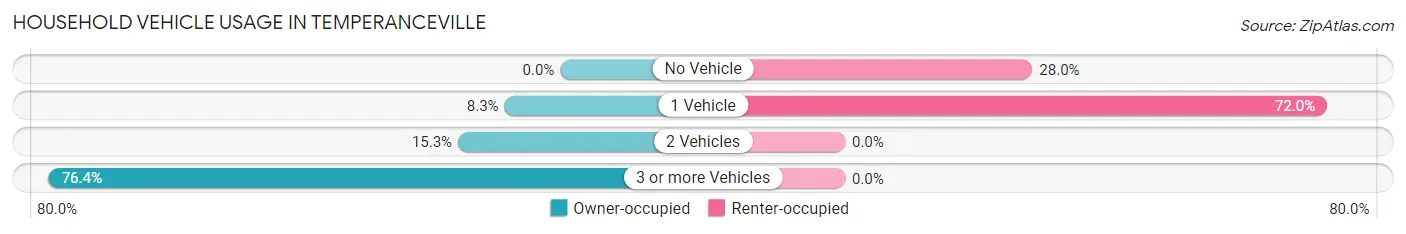
| Vehicles per Household | Owner-occupied | Renter-occupied |
| No Vehicle | 0 (0.0%) | 7 (28.0%) |
| 1 Vehicle | 6 (8.3%) | 18 (72.0%) |
| 2 Vehicles | 11 (15.3%) | 0 (0.0%) |
| 3 or more Vehicles | 55 (76.4%) | 0 (0.0%) |
| Total | 72 (100.0%) | 25 (100.0%) |
Real Estate & Mortgages in Temperanceville
Real Estate and Mortgage Overview in Temperanceville
| Characteristic | Without Mortgage | With Mortgage |
| Housing Units | 25 | 47 |
| Median Property Value | - | - |
| Median Household Income | $250,001 | $14 |
| Monthly Housing Costs | $1,046 | $0 |
| Real Estate Taxes | - | - |
Property Value by Mortgage Status in Temperanceville
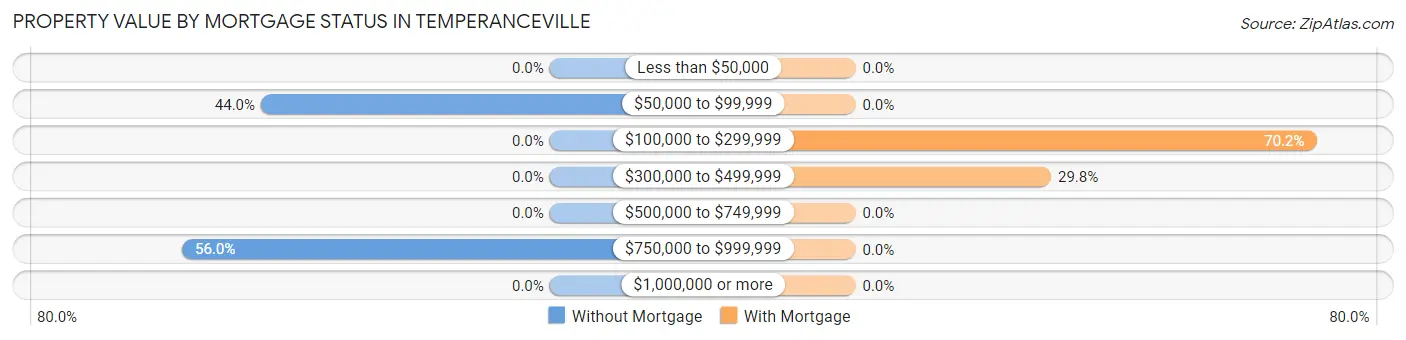
| Property Value | Without Mortgage | With Mortgage |
| Less than $50,000 | 0 (0.0%) | 0 (0.0%) |
| $50,000 to $99,999 | 11 (44.0%) | 0 (0.0%) |
| $100,000 to $299,999 | 0 (0.0%) | 33 (70.2%) |
| $300,000 to $499,999 | 0 (0.0%) | 14 (29.8%) |
| $500,000 to $749,999 | 0 (0.0%) | 0 (0.0%) |
| $750,000 to $999,999 | 14 (56.0%) | 0 (0.0%) |
| $1,000,000 or more | 0 (0.0%) | 0 (0.0%) |
| Total | 25 (100.0%) | 47 (100.0%) |
Household Income by Mortgage Status in Temperanceville
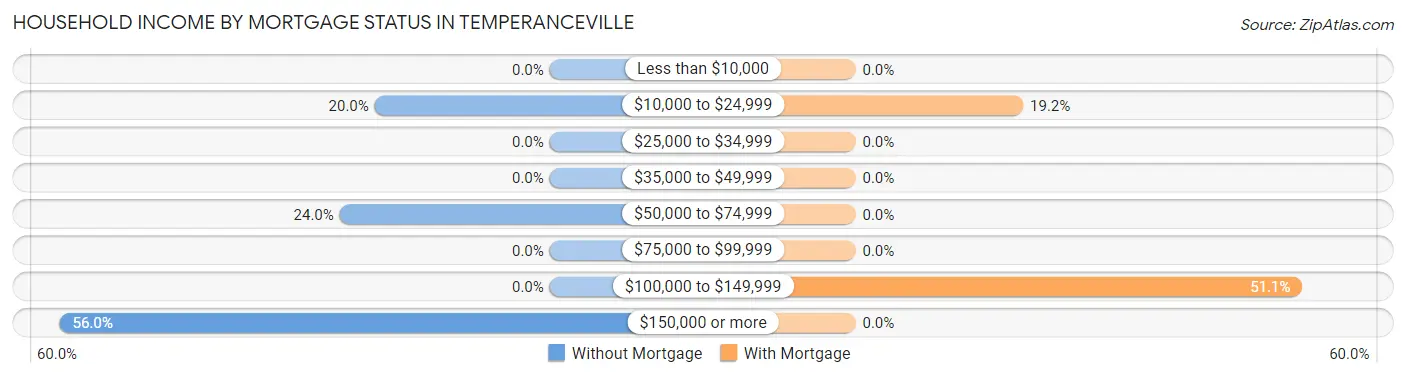
| Household Income | Without Mortgage | With Mortgage |
| Less than $10,000 | 0 (0.0%) | 0 (0.0%) |
| $10,000 to $24,999 | 5 (20.0%) | 9 (19.2%) |
| $25,000 to $34,999 | 0 (0.0%) | 0 (0.0%) |
| $35,000 to $49,999 | 0 (0.0%) | 0 (0.0%) |
| $50,000 to $74,999 | 6 (24.0%) | 0 (0.0%) |
| $75,000 to $99,999 | 0 (0.0%) | 0 (0.0%) |
| $100,000 to $149,999 | 0 (0.0%) | 24 (51.1%) |
| $150,000 or more | 14 (56.0%) | 0 (0.0%) |
| Total | 25 (100.0%) | 47 (100.0%) |
Property Value to Household Income Ratio in Temperanceville
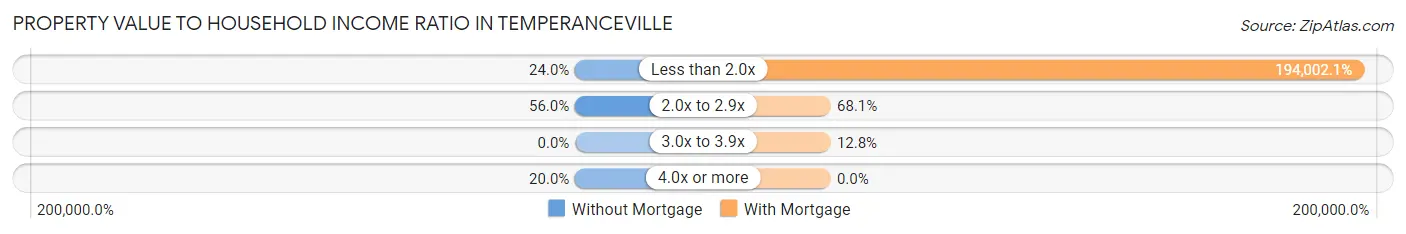
| Value-to-Income Ratio | Without Mortgage | With Mortgage |
| Less than 2.0x | 6 (24.0%) | 91,181 (194,002.1%) |
| 2.0x to 2.9x | 14 (56.0%) | 32 (68.1%) |
| 3.0x to 3.9x | 0 (0.0%) | 6 (12.8%) |
| 4.0x or more | 5 (20.0%) | 0 (0.0%) |
| Total | 25 (100.0%) | 47 (100.0%) |
Real Estate Taxes by Mortgage Status in Temperanceville
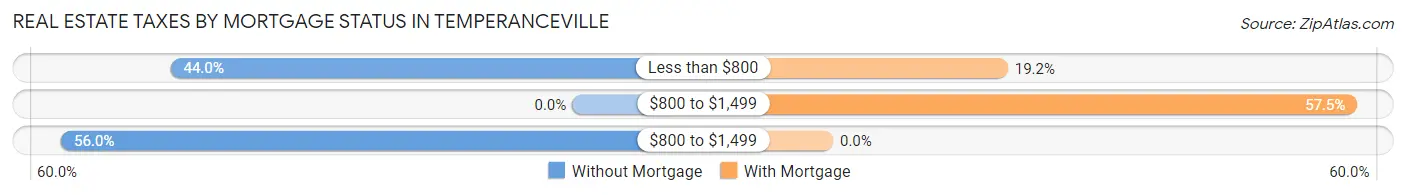
| Property Taxes | Without Mortgage | With Mortgage |
| Less than $800 | 11 (44.0%) | 9 (19.2%) |
| $800 to $1,499 | 0 (0.0%) | 27 (57.5%) |
| $800 to $1,499 | 14 (56.0%) | 0 (0.0%) |
| Total | 25 (100.0%) | 47 (100.0%) |
Health & Disability in Temperanceville
Health Insurance Coverage by Age in Temperanceville
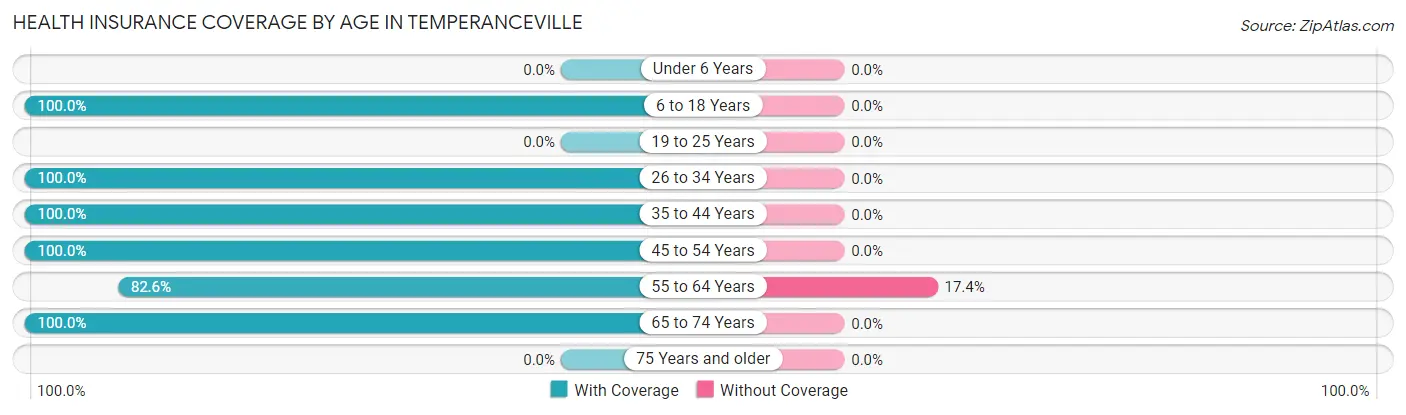
| Age Bracket | With Coverage | Without Coverage |
| Under 6 Years | 0 (0.0%) | 0 (0.0%) |
| 6 to 18 Years | 72 (100.0%) | 0 (0.0%) |
| 19 to 25 Years | 0 (0.0%) | 0 (0.0%) |
| 26 to 34 Years | 22 (100.0%) | 0 (0.0%) |
| 35 to 44 Years | 18 (100.0%) | 0 (0.0%) |
| 45 to 54 Years | 30 (100.0%) | 0 (0.0%) |
| 55 to 64 Years | 57 (82.6%) | 12 (17.4%) |
| 65 to 74 Years | 51 (100.0%) | 0 (0.0%) |
| 75 Years and older | 0 (0.0%) | 0 (0.0%) |
| Total | 250 (95.4%) | 12 (4.6%) |
Health Insurance Coverage by Citizenship Status in Temperanceville
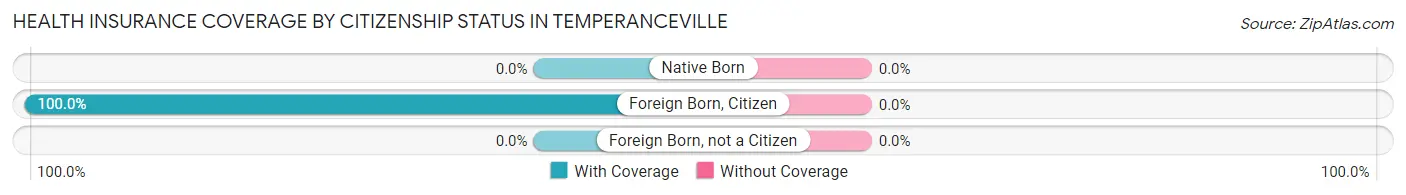
| Citizenship Status | With Coverage | Without Coverage |
| Native Born | 0 (0.0%) | 0 (0.0%) |
| Foreign Born, Citizen | 72 (100.0%) | 0 (0.0%) |
| Foreign Born, not a Citizen | 0 (0.0%) | 0 (0.0%) |
Health Insurance Coverage by Household Income in Temperanceville
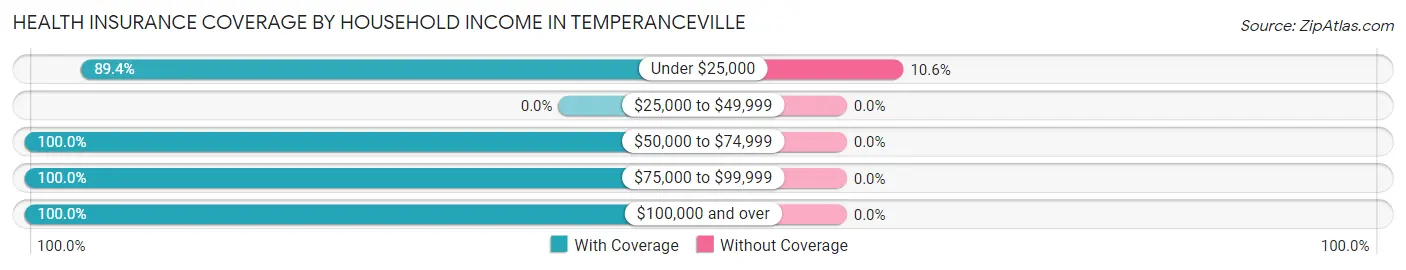
| Household Income | With Coverage | Without Coverage |
| Under $25,000 | 101 (89.4%) | 12 (10.6%) |
| $25,000 to $49,999 | 0 (0.0%) | 0 (0.0%) |
| $50,000 to $74,999 | 6 (100.0%) | 0 (0.0%) |
| $75,000 to $99,999 | 63 (100.0%) | 0 (0.0%) |
| $100,000 and over | 80 (100.0%) | 0 (0.0%) |
Public vs Private Health Insurance Coverage by Age in Temperanceville
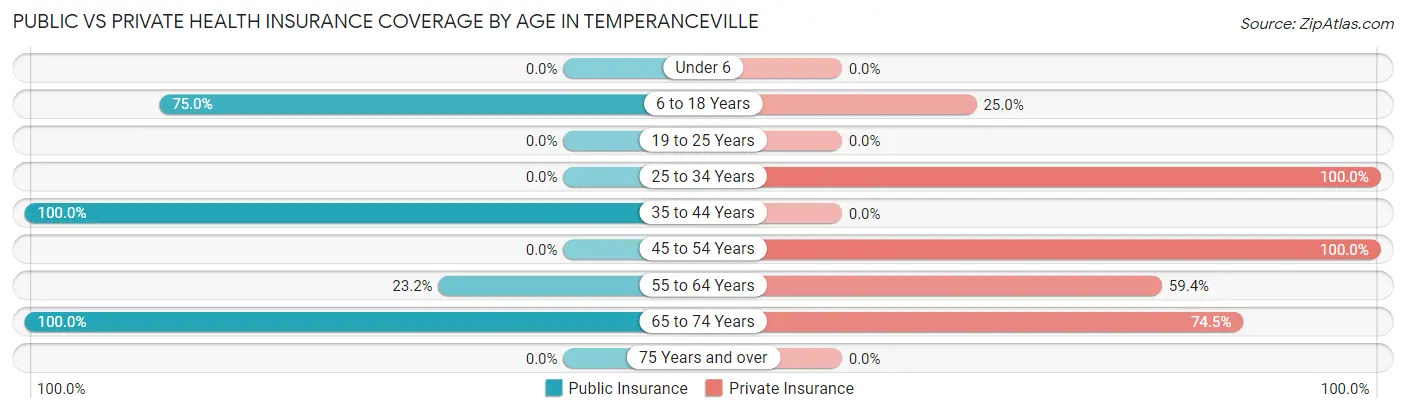
| Age Bracket | Public Insurance | Private Insurance |
| Under 6 | 0 (0.0%) | 0 (0.0%) |
| 6 to 18 Years | 54 (75.0%) | 18 (25.0%) |
| 19 to 25 Years | 0 (0.0%) | 0 (0.0%) |
| 25 to 34 Years | 0 (0.0%) | 22 (100.0%) |
| 35 to 44 Years | 18 (100.0%) | 0 (0.0%) |
| 45 to 54 Years | 0 (0.0%) | 30 (100.0%) |
| 55 to 64 Years | 16 (23.2%) | 41 (59.4%) |
| 65 to 74 Years | 51 (100.0%) | 38 (74.5%) |
| 75 Years and over | 0 (0.0%) | 0 (0.0%) |
| Total | 139 (53.0%) | 149 (56.9%) |
Disability Status by Sex by Age in Temperanceville
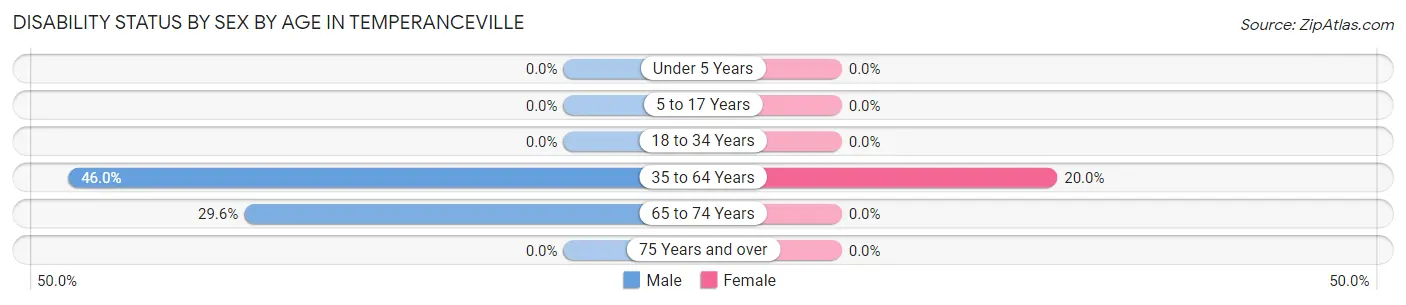
| Age Bracket | Male | Female |
| Under 5 Years | 0 (0.0%) | 0 (0.0%) |
| 5 to 17 Years | 0 (0.0%) | 0 (0.0%) |
| 18 to 34 Years | 0 (0.0%) | 0 (0.0%) |
| 35 to 64 Years | 17 (46.0%) | 16 (20.0%) |
| 65 to 74 Years | 8 (29.6%) | 0 (0.0%) |
| 75 Years and over | 0 (0.0%) | 0 (0.0%) |
Disability Class by Sex by Age in Temperanceville
Disability Class: Hearing Difficulty
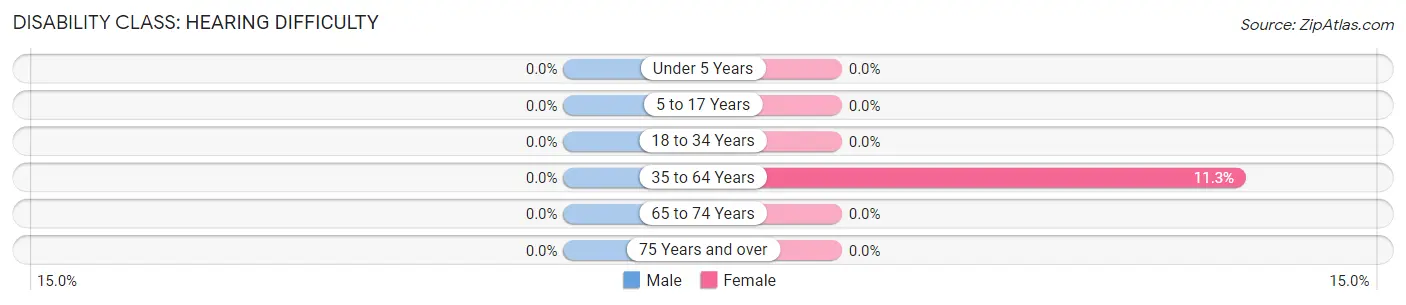
| Age Bracket | Male | Female |
| Under 5 Years | 0 (0.0%) | 0 (0.0%) |
| 5 to 17 Years | 0 (0.0%) | 0 (0.0%) |
| 18 to 34 Years | 0 (0.0%) | 0 (0.0%) |
| 35 to 64 Years | 0 (0.0%) | 9 (11.3%) |
| 65 to 74 Years | 0 (0.0%) | 0 (0.0%) |
| 75 Years and over | 0 (0.0%) | 0 (0.0%) |
Disability Class: Vision Difficulty
| Age Bracket | Male | Female |
| Under 5 Years | 0 (0.0%) | 0 (0.0%) |
| 5 to 17 Years | 0 (0.0%) | 0 (0.0%) |
| 18 to 34 Years | 0 (0.0%) | 0 (0.0%) |
| 35 to 64 Years | 0 (0.0%) | 0 (0.0%) |
| 65 to 74 Years | 0 (0.0%) | 0 (0.0%) |
| 75 Years and over | 0 (0.0%) | 0 (0.0%) |
Disability Class: Cognitive Difficulty
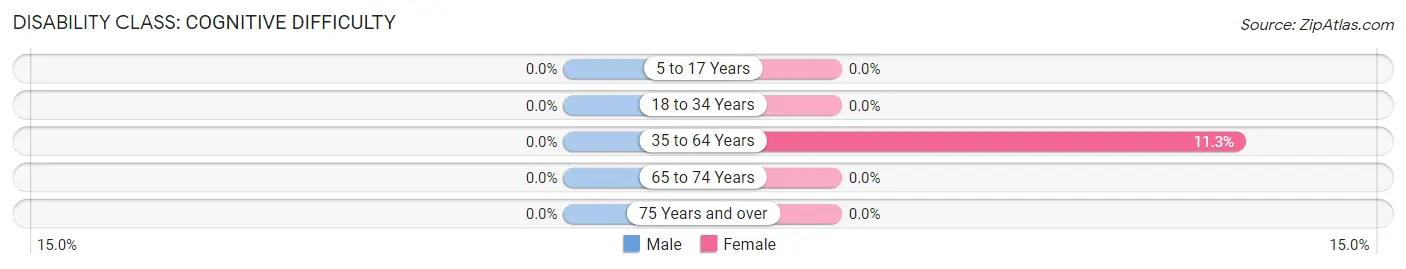
| Age Bracket | Male | Female |
| 5 to 17 Years | 0 (0.0%) | 0 (0.0%) |
| 18 to 34 Years | 0 (0.0%) | 0 (0.0%) |
| 35 to 64 Years | 0 (0.0%) | 9 (11.3%) |
| 65 to 74 Years | 0 (0.0%) | 0 (0.0%) |
| 75 Years and over | 0 (0.0%) | 0 (0.0%) |
Disability Class: Ambulatory Difficulty
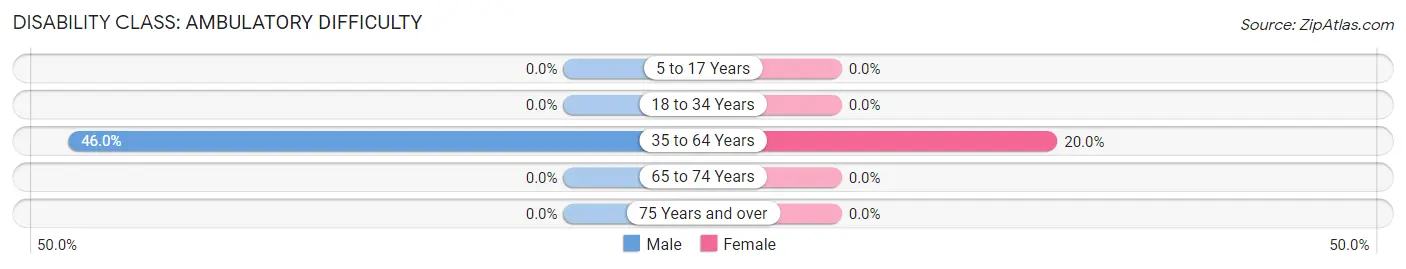
| Age Bracket | Male | Female |
| 5 to 17 Years | 0 (0.0%) | 0 (0.0%) |
| 18 to 34 Years | 0 (0.0%) | 0 (0.0%) |
| 35 to 64 Years | 17 (46.0%) | 16 (20.0%) |
| 65 to 74 Years | 0 (0.0%) | 0 (0.0%) |
| 75 Years and over | 0 (0.0%) | 0 (0.0%) |
Disability Class: Self-Care Difficulty
| Age Bracket | Male | Female |
| 5 to 17 Years | 0 (0.0%) | 0 (0.0%) |
| 18 to 34 Years | 0 (0.0%) | 0 (0.0%) |
| 35 to 64 Years | 0 (0.0%) | 0 (0.0%) |
| 65 to 74 Years | 0 (0.0%) | 0 (0.0%) |
| 75 Years and over | 0 (0.0%) | 0 (0.0%) |
Technology Access in Temperanceville
Computing Device Access in Temperanceville
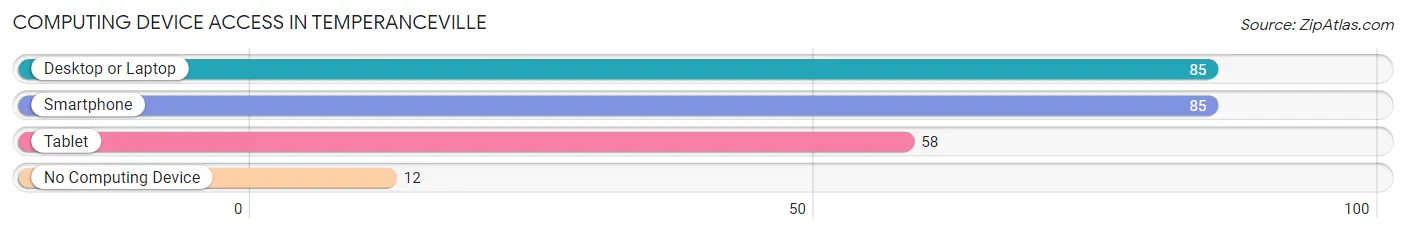
| Device Type | # Households | % Households |
| Desktop or Laptop | 85 | 87.6% |
| Smartphone | 85 | 87.6% |
| Tablet | 58 | 59.8% |
| No Computing Device | 12 | 12.4% |
| Total | 97 | 100.0% |
Internet Access in Temperanceville
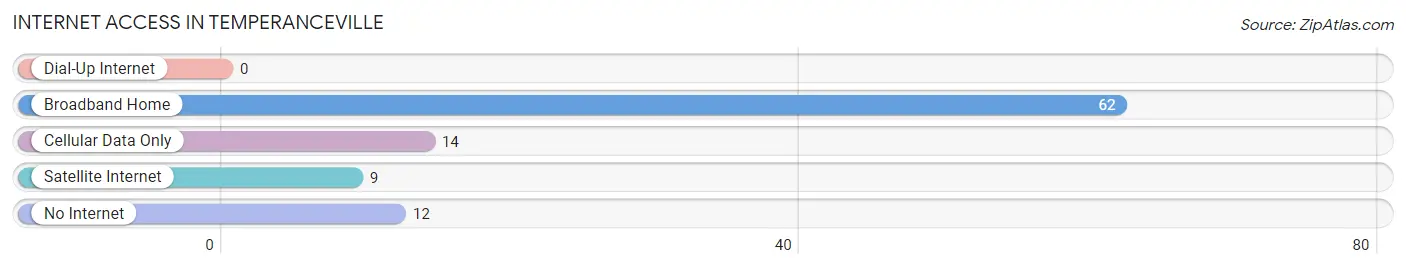
| Internet Type | # Households | % Households |
| Dial-Up Internet | 0 | 0.0% |
| Broadband Home | 62 | 63.9% |
| Cellular Data Only | 14 | 14.4% |
| Satellite Internet | 9 | 9.3% |
| No Internet | 12 | 12.4% |
| Total | 97 | 100.0% |
Temperanceville Summary
Temperanceville is a small unincorporated community located in Accomack County, Virginia. It is situated on the Eastern Shore of Virginia, approximately 20 miles south of the Chesapeake Bay Bridge-Tunnel. The population of Temperanceville was estimated to be around 500 in 2020.
History
Temperanceville was first settled in the early 1700s by English colonists. The town was named after the temperance movement, which was popular in the area at the time. The town was originally known as Temperance Town, but the name was eventually shortened to Temperanceville.
The town was an important port for the shipping of goods and supplies to and from the Eastern Shore of Virginia. During the Civil War, Temperanceville was a major supply depot for the Confederate Army. After the war, the town experienced a period of economic decline, but it was eventually revitalized in the early 1900s.
Geography
Temperanceville is located in Accomack County, Virginia, on the Eastern Shore of Virginia. The town is situated on the western shore of the Chesapeake Bay, approximately 20 miles south of the Chesapeake Bay Bridge-Tunnel. Temperanceville is bordered by the towns of Onancock, Parksley, and Melfa.
The town is located in a rural area, with the nearest major city being Norfolk, Virginia, which is approximately 90 miles away. Temperanceville is surrounded by farmland and wetlands, and is home to a variety of wildlife, including deer, foxes, and bald eagles.
Economy
The economy of Temperanceville is largely based on agriculture and fishing. The town is home to several farms, which produce a variety of crops, including corn, soybeans, and wheat. The town is also home to several seafood processing plants, which process and package seafood for distribution throughout the region.
In addition to agriculture and fishing, Temperanceville is home to several small businesses, including restaurants, convenience stores, and a hardware store. The town is also home to a small marina, which provides boat storage and repair services.
Demographics
As of 2020, the population of Temperanceville was estimated to be around 500. The town is predominantly white, with approximately 90% of the population identifying as Caucasian. The remaining 10% of the population is made up of African Americans, Hispanics, and other ethnicities.
The median household income in Temperanceville is approximately $45,000, which is slightly lower than the national average. The town has a poverty rate of approximately 10%, which is slightly higher than the national average. The town has a high school graduation rate of approximately 80%, which is slightly higher than the national average.
Conclusion
Temperanceville is a small unincorporated community located in Accomack County, Virginia. The town has a long history, dating back to the early 1700s, and has a population of approximately 500. The economy of Temperanceville is largely based on agriculture and fishing, and the town is home to several small businesses. The population of Temperanceville is predominantly white, with a median household income of approximately $45,000.
Common Questions
What is Per Capita Income in Temperanceville?
Per Capita income in Temperanceville is $41,727.
What is the Median Household income in Temperanceville?
Median Household Income in Temperanceville is $83,958.
What is Inequality or Gini Index in Temperanceville?
Inequality or Gini Index in Temperanceville is 0.54.
What is the Total Population of Temperanceville?
Total Population of Temperanceville is 262.
What is the Total Male Population of Temperanceville?
Total Male Population of Temperanceville is 119.
What is the Total Female Population of Temperanceville?
Total Female Population of Temperanceville is 143.
What is the Ratio of Males per 100 Females in Temperanceville?
There are 83.22 Males per 100 Females in Temperanceville.
What is the Ratio of Females per 100 Males in Temperanceville?
There are 120.17 Females per 100 Males in Temperanceville.
What is the Median Population Age in Temperanceville?
Median Population Age in Temperanceville is 51.3 Years.
What is the Average Family Size in Temperanceville
Average Family Size in Temperanceville is 3.1 People.
What is the Average Household Size in Temperanceville
Average Household Size in Temperanceville is 2.7 People.
How Large is the Labor Force in Temperanceville?
There are 125 People in the Labor Forcein in Temperanceville.
What is the Percentage of People in the Labor Force in Temperanceville?
65.8% of People are in the Labor Force in Temperanceville.